2016 Sweetener SystemsConference Summary
A Global Food Forums® Event
32016 Sweetener Systems Conference Summary ©Global Food Forums®, Inc.
2016 Sweetener Systems Conference Summary
Insights into Challenges of Labeling “Added Sugar”
David Ellingson, MSc, Senior Research Chemist and Project
Manager, Covance
Panel: Sweeteners and Nutrition: New Developments
& Reality Checks
• Caloric Sweeteners and Health: What is the Truth?
G. Harvey Anderson, Ph.D., Professor of Nutritional Sciences
and Physiology, Faculty of Medicine, University of Toronto
• Low-calorie Sweeteners and Health: New Developments and Reality Checks Richard D. Mattes, MPH, Ph.D., RD, Distinguished Prof. of
Nutrition Science at Purdue University, Affiliated Scientist at
Monell Chemical Senses Center
• How High-potency Sweeteners Work
and What to Do about It
John C. Fry, Ph.D., Director, Connect Consulting
Simply Sweet: Updates on How to Make Foods and
Beverages Sweeter with Sight, Smell, Sound and Touch
Alex Woo, Ph.D., CEO and Founder, W2O Food Innovation
The Science Behind Sugar Reduction: Ingredient
Functionality Beyond Taste
Kathy Groves, Professor & Senior Consultant, Head of Science
& Microscopy, Leatherhead Food Research
Emerging Research in Aromas
& Sweetness Enhancement
Thomas Colquhoun, Ph.D., Assistant Professor, Plant
Biotechnology, University of Florida
KEYNOTE: Understanding Consumer Reaction to
Sweetened New Products
Lynn Dornblaser, Director, Innovation & Insight, Mintel
Why hold a conference on sweetener systems?
Sweetness-enhancing components have long been added to recipes, as
well as packaged foods and beverages. However, as consumers demand
an increasing array of attributes from the products they consume, the
food industry has stepped up to deliver sweetener ingredients from a
myriad of sources and with wide-ranging properties. Additionally, the
perception of sweetness and the impact of any one sweetener ingre-
dient is highly influenced by other ingredients in a food matrix. The
need for up-to-date information on sweeteners by product developers
has increased. This is because there have been ingredient technological
advances; and because there is increased complexity in the sweetener
systems used. Other factors include evolving consumer attitudes, prog-
ress in nutritional science and, lastly, changes in regulations.
With these issues in mind, Global Food Forums, Inc. launched its
first Sweetener Systems Trends & Technologies Conference (since
renamed Sweetener Systems Conference) on November 2, 2016, in
Lombard, Ill., USA. The event proved successful beyond expecta-
tions—with over 160 registrants and an abundance of very positive
comments. A brief summary of the excellent presentations from
this year’s program is provided here.
All presentations and/or adapted versions made available by
the speakers are posted at www.GlobalFoodForums.com/2016-
Sweetener-Systems/Store.
Please consider attending our 2017 Sweetener Systems Con-
ference, November 7th, at the Westin Hotel, Lombard, Ill., USA.
(www.GlobalFoodForums.com/2017-sweetener-systems)
Table of Contents
The contents of this publication are copyrighted. Reproduction, in whole or in part, is not permitted without the written consent of the owners of Global Food Forums, Inc. To reference materials, at minimum, please attribute the speaker, their affiliation and 2016 Sweetener Systems Conference.
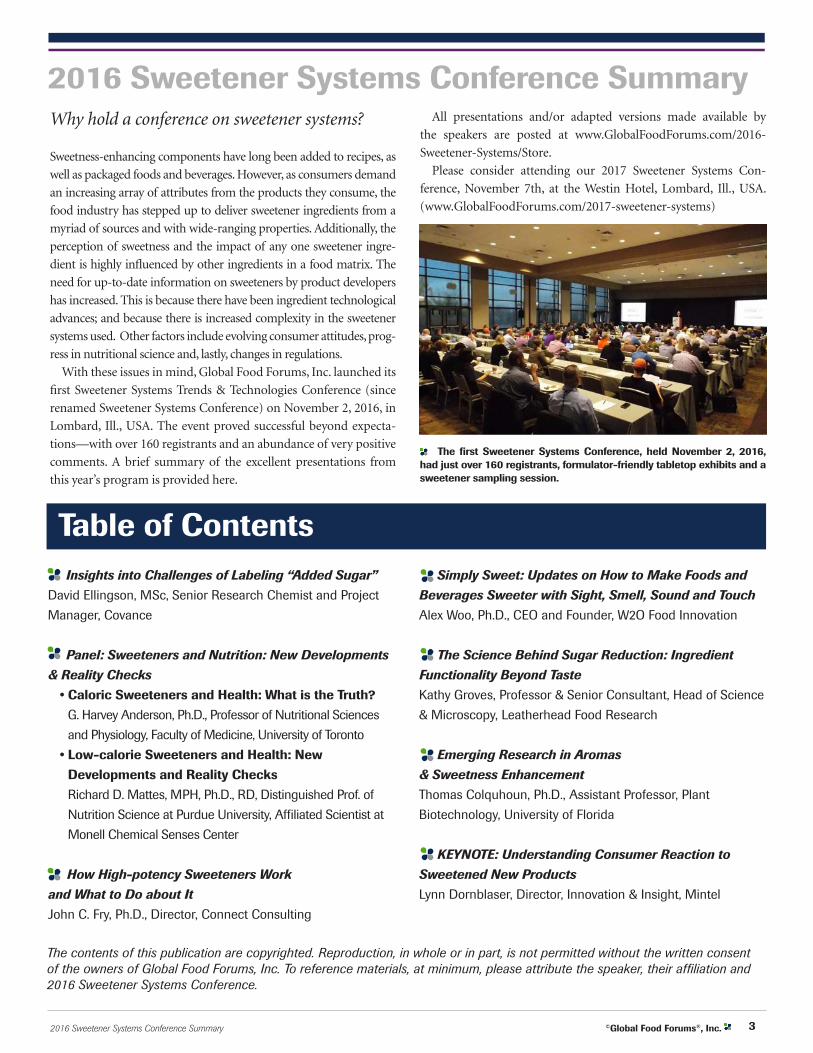
The first Sweetener Systems Conference, held November 2, 2016, had just over 160 registrants, formulator-friendly tabletop exhibits and a sweetener sampling session.
4 ©Global Food Forums®, Inc. 2016 Sweetener Systems Conference Summary
Insights into Challenges of Labeling “Added Sugar”Dietary sugar reduction is a global health objective, as per the
United Nations’ World Health Organization (WHO). Thus, the
compliance challenges posed by the U.S. Food & Drug Agency’s
(FDA) recently published requirement to include “added sugar” as
a subhead to the line-item “sugars” on the nutritional label have
global implications for all food regulatory agencies.
David Ellingson, MSc, Senior Research Chemist and Project
Manager with Covance, an international research laboratory, ad-
dressed two issues that should be of primary concern:
1) Industry’s inability to discern between naturally present and
added sugars; and
2) the need to establish requirements for dynamic sugar concen-
trations that vary as a function of processing and storage.
“The FDA regulation defines ‘added sugars’ as either free sugar
(mono- and disaccharides), syrups or ‘sugars from concentrated
fruit or vegetable juices that are in excess of what would be expected
from the same volume of 100% fruit or vegetable juice of the same
type,’” explained Ellingson.
There are four exceptions:
1) Fruit or vegetable juice concentrated from 100% juices sold to
consumers;
2) fruit or vegetable juice concentrates used towards the total
juice percentage label;
3) fruit juice concentrates used to formulate the fruit component of
jellies, jams or preserves, or the fruit component of fruit spreads; and
4) lactose from milk.
“There are three high-level scenarios with respect to a product
analysis: one being where all sugar is added; one being both natural
and added; and a third where all sugars present are natural,” contin-
ued Ellingson.
“Typically, when we do an analysis for sugar in our labs, we are
looking for these six: glucose, galactose, fructose, sucrose, maltose
and lactose. We utilize HPLC and GC applications,” Ellingson noted.
Whereas ion chromatography with pulsed amperometric de-
tection is becoming the
norm for HPLC-type ap-
plications, “more robust”
gas chromatography
techniques are still pop-
ular—even though they
require derivatization
of sugars prior to anal-
ysis. For quick, in-line
production screening,
a technology such as Fourier Transform Infrared (FTIR) spectro-
scopy may be quite adequate. However, he stressed, none of these
techniques is capable of distinguishing between “natural” and
“added” sugars!
“If a more forensic analysis is needed, laboratories have available
a range of analytical techniques to identify the source of a sugar
on a qualitative level,” explained Ellingson. Although more sophis-
ticated isotope analyses can distinguish between C12 (found in
cane and corn sugars) and C13 (found in maple and beet sugars),
they cannot pinpoint the source origin of all sugars. Nonetheless,
isotope analyses do offer limited use in identifying adulterants in
products and ingredients.”
Continued Ellingson, “By far the most difficult analytical chal-
lenge is when fruits or vegetables that have innate amounts of
sugars are mixed with ‘added’ sugars, such as sweetener syrups, to
improve taste or sweetness.” This includes products such as juice
drinks, breakfast cereals and yogurt beverages.
Providing analytical chemists with a product’s formula in advance
allows them to analyze the areas under chromatographic peaks and
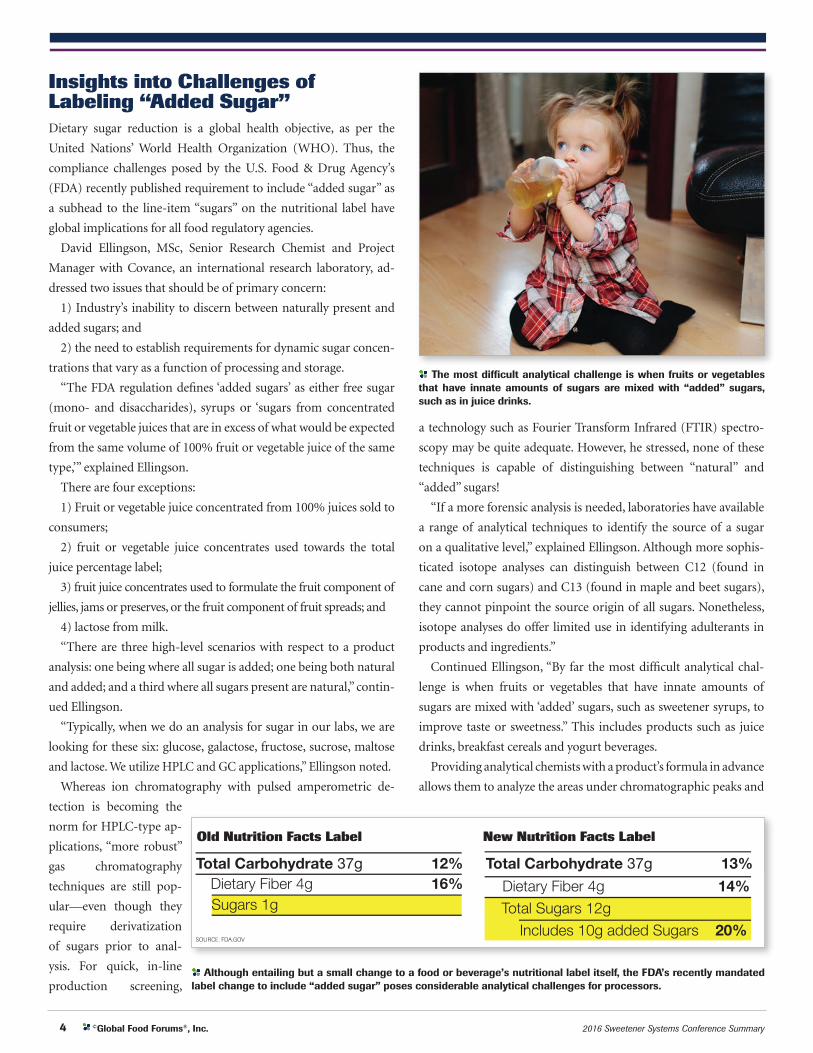
Although entailing but a small change to a food or beverage’s nutritional label itself, the FDA’s recently mandated label change to include “added sugar” poses considerable analytical challenges for processors.
Old Nutrition Facts Label New Nutrition Facts Label
SOURCE: FDA.GOV
Sugars 1gDietary Fiber 4g Dietary Fiber 4g
Total Carbohydrate 37g16% 14%12% Total Carbohydrate 37g 13%
Total Sugars 12gIncludes 10g added Sugars 20%
The most difficult analytical challenge is when fruits or vegetables that have innate amounts of sugars are mixed with “added” sugars, such as in juice drinks.
52016 Sweetener Systems Conference Summary ©Global Food Forums®, Inc.
roughly estimate total sugar contents. If the chromatographic pro-
files conform to the formula provided, all may be well. However, it
is much more difficult to determine whether a food, beverage or
ingredient has been adulterated—and by how much—using only
such techniques. Analysis of carbon isotope profiles and other im-
purity markers can flag possible adulteration—but not always.
An additional complication is when non-enzymatic browning,
fermentation or other processes affect total sugar content during
processing or storage. This is an important consideration for
heat-treated products rich in amino acids, sweeteners, and fruit and
vegetable ingredients, such as soups or sauces.
When asked a question about how one could establish a label
declaration for sugar content for products exhibiting starch break-
down during storage due to acid hydrolysis, Ellingson allowed that
this could be a complicating factor: At what point in the process or
retail distribution of such products can an accurate determination
of sugar content and profile be made? Perhaps a petition to the FDA
for a labeling exception would be merited in such cases; the FDA
regulations do allow companies to petition for exceptions.
[Note: The final, published FDA “added sugar” labeling regulation
can be found in: FDA Federal Register/Vol. 81, No. 103/Friday, May
27, 2016/Rules and Regulations].
“Insights into Challenges of Labeling ‘Added’ Sugar,” David
Ellingson, MSc, Senior Research Chemist and Project Manager,
Covance, [email protected]
Panel: Sweeteners and Nutrition—New Developments & Reality ChecksPanelist #1: Caloric Sweeteners & Health—What is the Truth? G. Harvey Anderson, Ph.D., University of Toronto Professor of
Nutritional Science and Physiology, got straight to the point:
“There is insufficient evidence upon which to make public policy
regarding caloric sweeteners consumption—but the horse has left
the barn—and we must deal with the consequences.”
Caloric sweeteners are under siege. Very recently, the U.S.
National Science Foundation’s Institute of Medicine (IOM) de-
clared there was insufficient evidence upon which to set upper
limits to caloric sweetener consumption, but it nonetheless
recommended that they constitute no more than 25% of total
calories. This recommendation was based not upon health issue
mitigation, but on preventing the displacement of foods that con-
tribute essential nutrients to the diet.
In contrast, the 2015 Dietary Guidelines Advisory Committee
declared that caloric sugar consumption should be limited to
no more than 10% of dietary calories, due to “negative impacts”
on type II diabetes, cardiovascular health and dental caries. The
WHO also supported a policy of limiting caloric sweetener
consumption to no more than 10% of the diet and, perhaps, to
less than 5% of the diet. “And…there is now talk of imposing
world-wide sugar consumption taxes,” said Anderson.
“Obesity is the public health concern that started this cam-
paign,” explained Anderson. “We know that obesity comes from
excess food intake, meaning an energy imbalance, but it remains
unclear whether obesity develops from physiological systems that
make us susceptible to environmental causes, such as sedentary
lifestyles, or from environmental causes alone.”
Therefore, caution is warranted.
With respect to the U.S. Dietary Guidelines, for example, “We
know that many of the guidelines have proven themselves wrong,
over time. We keep shifting around claims, such as fat causes
obesity or cardiovascular disease, only to have them later proven
wrong.” This has hurt the credibility of nutritional policy-making.
Sweeteners are a normal part of life, and humans are exposed to
sweet tastes from in utero to death. There are also many benefits to
sweet foods. They tend to be safe; easy to store; easy to transport;
require no preparation; and are relatively inexpensive. In addition,
caloric sweeteners can play important roles in rendering highly
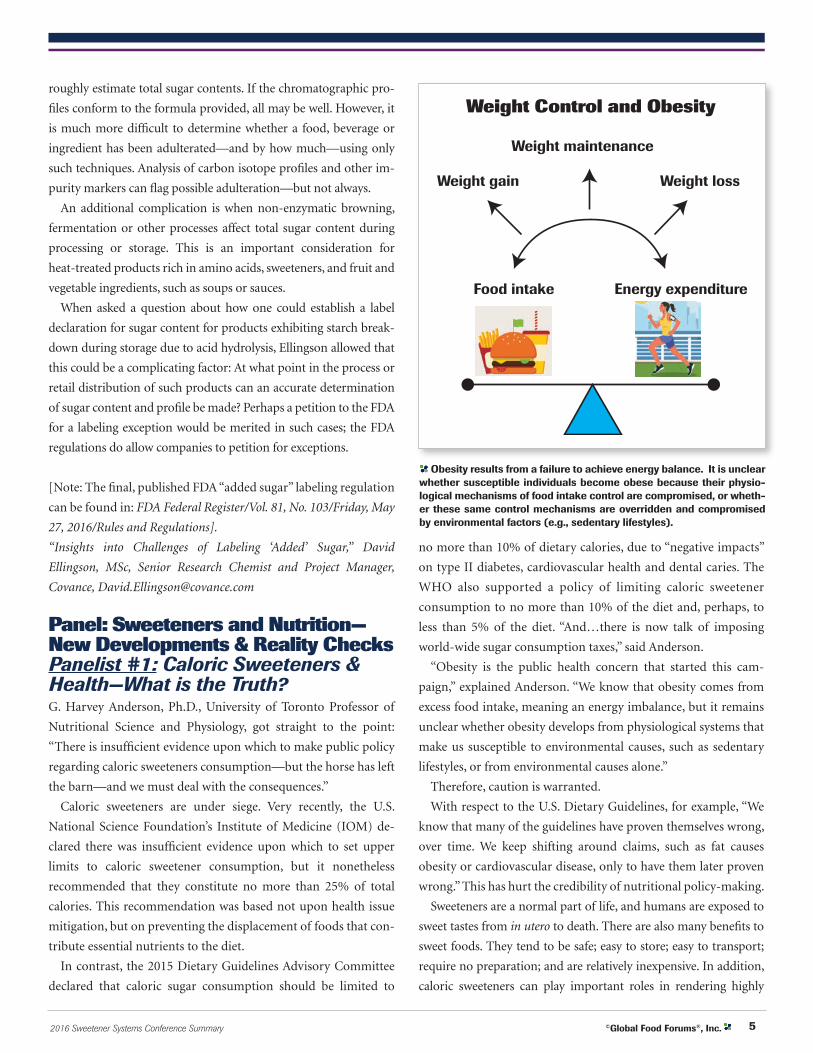
Weight Control and Obesity
Weight loss
Food intake
Weight gain
Weight maintenance
Energy expenditure
Obesity results from a failure to achieve energy balance. It is unclear whether susceptible individuals become obese because their physio-logical mechanisms of food intake control are compromised, or wheth-er these same control mechanisms are overridden and compromised by environmental factors (e.g., sedentary lifestyles).
6 ©Global Food Forums®, Inc. 2016 Sweetener Systems Conference Summary
nutritional products palatable, such as bitter fruit (e.g., cranberry)
or high-fiber cereal products (e.g., cereal or granola bars).
So, given all these considerations, what does the evidence say?
Anderson referenced the work of his University of Toronto
colleague, John Sievenpiper, MD, Ph.D., FRCPC. Sievenpiper
undertook a systematic review of all published studies linking
sweetener consumption to health concerns, in order to critically
assess whether caloric sweeteners cause diabetes and obesity (as
per the U.S. 2015 Dietary Guidelines Advisory Committee). He
determined that no studies had been able to statistically link ca-
loric sweetener consumption levels to either obesity or diabetes.
Such absences of associations were found for both sucrose and
fructose. Certainly, no documented associations were found that
could justify public policy-making on caloric sweetener con-
sumption, summarized Anderson.
Sievenpiper also referenced studies that linked the consump-
tion of specific foods to weight gain. Here, a weak but statistically
significant association was found between weight gain and sugar-
sweetened beverage consumption. But, similar gains were also
found for French fries, potato chips, nuts, potatoes and, even,
yogurt. In sum, the studies appeared only to prove that increased
energy consumption leads to weight gain. “If you eat more, you
get fatter,” summarized Anderson.
Effects of sugar-sweetened beverage intake on obesity were also
more difficult to categorize. Many food intake studies rely upon
consumer recall. In general, people can recall their frequency of
consumption much better than their quantity of consumption,
said Anderson. It also can’t be ascertained whether sugar-sweet-
ened beverage consumption levels translate directly into weight
gain or serve as markers for other lifestyle factors that relate to
obesity (e.g., sedentary lifestyles).
Put together, these results are inconclusive, maintained
Anderson, and there remains far more work to be done before
public policy-makers can credibly recommend optimal levels of
caloric sweetener consumption.
“Caloric Sweeteners and Health: What is the Truth?” G. Harvey
Anderson, Ph.D., University of Toronto Professor of Nutritional
Science and Physiology, [email protected]
Panelist #2: Low-calorie Sweeteners and Health—New Developments and Reality ChecksProf. Richard Mattes, Purdue University, launched his data-rich
presentation with a plea: Given the many terms in use for our
topic today, “We need consensus!”
Mattes proposed using “low calorie” as the preferred terminol-
ogy, as it is “easily translatable to consumers.”
Low-calorie sweeteners (LCS) have been recurring subjects
of controversy ever since saccharine’s initial discovery in the
late 19th century, said Mattes. More recently, in the “sweetener
heyday” of the 1980s, controversy swirled around top-line study
claims that suggested LCS were associated with weight gain or
long-term weight management. Such were the claims that made
news headlines.
Closer critical review of the data indicated that aspartame did
indeed benefit consumer weight management, when it was substi-
tuted for other energy sources—but this did not lead to resolution
of the matter. Many subsequent trials continued to raise concerns
but without clear supporting data. In study after study cited in
Mattes’ presentation, initial top-line conclusions and media head-
lines ended up being contradicted by either closer examination of
the studies’ own data or by subsequent studies.
Today, the use of low-calorie sweeteners in the food supply has
increased dramatically, coincident with increases in body mass
indices (BMI) and claims that the two trends are causally linked.
This has not been substantiated, but three new scientific develop-
ments have further contributed to debates on LCSs and health in
recent years:
1) Elucidation of the gastrointestinal biome’s roll in energy
management;
2) documentation of sweeteners’ effects on dopamine-
mediated “reward” mechanisms in the brain; and
3) the discovery of sweet-taste receptors in the gastrointestinal
tract and other organs, such as the pancreas and the brain.
The discovery that sweeteners affect reward centers in the brain
led to hypotheses that sweeteners render foods “hyperpalatable,”
triggering reward systems in the brain similar to addictive drugs.
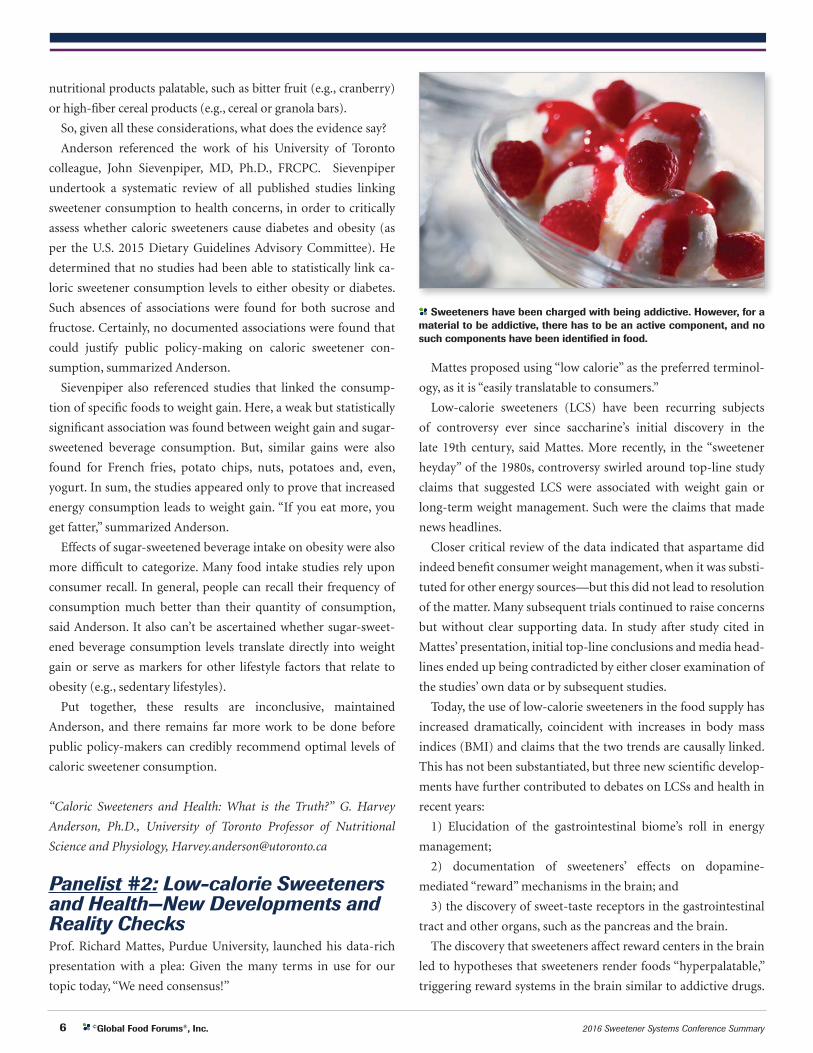
Sweeteners have been charged with being addictive. However, for a material to be addictive, there has to be an active component, and no such components have been identified in food.
72016 Sweetener Systems Conference Summary ©Global Food Forums®, Inc.
Mattes, after pointing out that overall per-capita sweetener con-
sumption is down in the U.S., decried the use of terms (such as
hyperpalatable). When people are hungry, all foods trigger reward
signals in the brain, said Mattes.
In order for any material to be addictive, “There has to be an
active component,” Mattes continued. No such components have
been identified in foods. Also, even if one applies criteria for “food
addictions” to the population at large, it hardly accounts for the
growing prevalence of obesity in the population. Even the term
addiction is misused in reference to food: “Dopamine responses
to addictive drugs are at least an order of magnitude larger than
anything observed with any food-related response,” said Mattes.
Mattes cited research purporting to document links between
dietary sweeteners, gastrointestinal microflora, obesity and dia-
betes. Citing two foundational rodent studies for this theory, he
once again noted that closer examination of the data refuted the
authors’ conclusions.
Many of the rodent studies cited involved low-calorie sweetener
doses (e.g., aspartame) far in excess of an equivalent human
Acceptable Daily Intake (ADI). These studies yield contradictory
or insignificant results.
“Whether data like this can translate into anything of practical
importance is highly suspect,” concluded Mattes. He forensically
dispensed with studies postulating that low-calorie sweeteners
somehow corrupt brain and appetite “signaling” via alteration of
entero-endocrine peptides and receptors. After citing the “intrin-
sic problems” in using rat models to evaluate human sweet taste
perception and energy metabolism (e.g., rats metabolize carbo-
hydrates into fat far more efficiently that humans), Mattes added
that “there is no compelling evidence from human studies of any
effect of low-calorie sweeteners on entero-endocrine cells.”
“Where do we stand now?” asked Mattes. “We know low-cal-
orie sweeteners do affect brain reward mechanisms, but it is
not possible to link them to body mass increases. Meanwhile,
meta-analyses of epidemiological studies do appear to link
low-calorie sweetener consumption to body mass but in a ben-
eficial—rather than problematic—way.”
To those involved in selling low-calorie sweeteners, Mattes
offered: “The science supports a beneficial role when used prop-
erly. LCS can provide a function tool to manage energy intake
and body weight.”
“Low-calorie Sweeteners and Health: New Developments and
Reality Checks,” Richard Mattes, MPH, Ph.D., RD, Distinguished
Professor of Nutritional Science at Purdue University, Affiliated
Scientist at Monell Chemical Senses Center, [email protected]
How High-potency Sweeteners Work and What to Do about ItFood scientists have available to them a range of high-potency
sweeteners, but are they being used effectively? Maximizing the
potential of these ingredients in foods and beverages is of para-
mount importance to product development. John Fry, Ph.D., of
UK-based Connect Consulting, explained, however, that “rather
than emphasize how these sweeteners work, I spend a great deal
of time talking about how they don’t work and offering remedies.”
To know how to do this, one needs first to understand the physiol-
ogy of sweetness receptors.
Sweet taste receptors in the mouth are complex protein struc-
tures crossing the cell walls of sweet-sensing taste cells. The taste
cells are contained within taste buds, distributed in the papillae
of the tongue. The buds communicate with the exterior saliva via
a taste “pore,” within which are tiny projections of the taste cells,
called microvilli. The receptor proteins are on the microvilli and
comprise four zones:
1) A “Venus fly trap” structure outside the taste cell and in con-
tact with saliva;
2) an external, cysteine-rich protein chain connecting the Venus
fly trap to:
3) a transmembrane zone of seven helical strands of protein,
terminating in:
4) an intracellular protein thread that interacts with the taste cell
contents and triggers a complex series of biochemical reactions,
culminating in a nerve signal to the brain that signifies “sweet.”
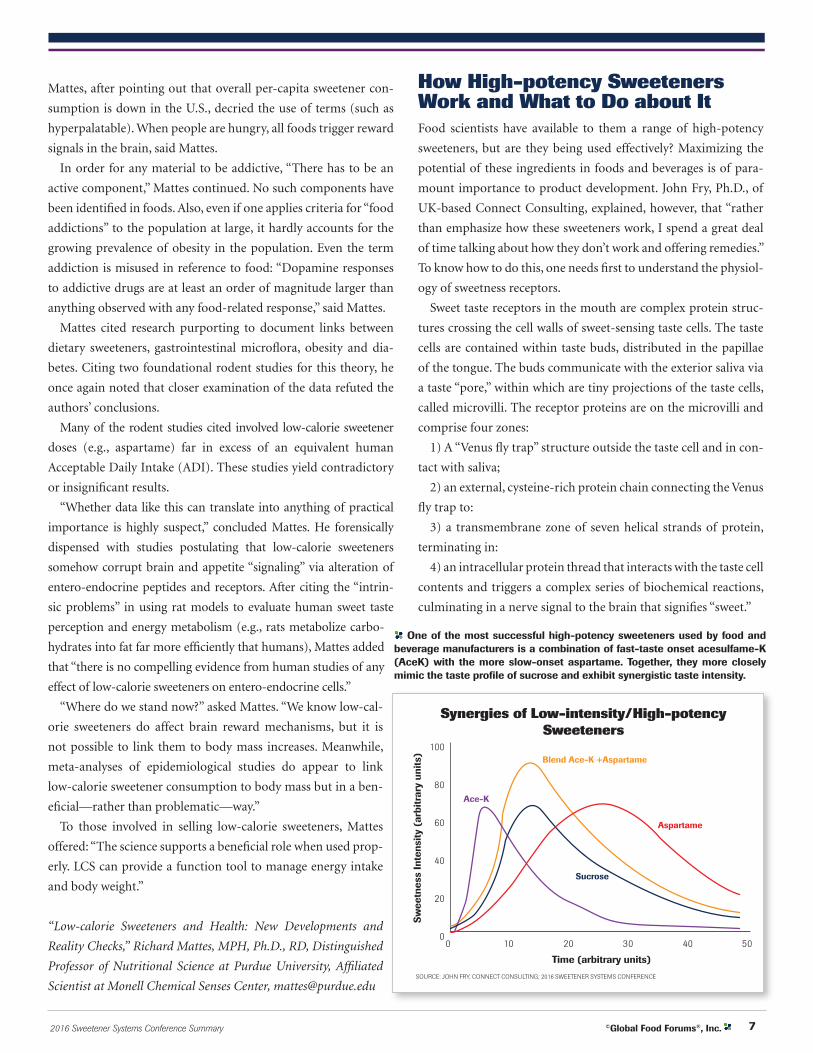
Synergies of Low-intensity/High-potencySweeteners
SOURCE: JOHN FRY, CONNECT CONSULTING; 2016 SWEETENER SYSTEMS CONFERENCE
Blend Ace-K +Aspartame
Aspartame
Sucrose
Ace-K
Sw
eetn
ess
Inte
nsit
y (a
rbit
rary
uni
ts)
Time (arbitrary units)
100
80
60
40
20
00 10 20 30 40 50
One of the most successful high-potency sweeteners used by food and beverage manufacturers is a combination of fast-taste onset acesulfame-K (AceK) with the more slow-onset aspartame. Together, they more closely mimic the taste profile of sucrose and exhibit synergistic taste intensity.
8 ©Global Food Forums®, Inc. 2016 Sweetener Systems Conference Summary
The primary route for humans to sense sweetness requires two
such receptors, T1R2 and T1R3, intertwined. This arrangement
affords multiple points where the proteins can interact with
the wide variety of substances we experience as sweet. A given
high-potency sweetener generally interacts with only one or two
such sites on the receptor complex.
There is, in addition, a secondary mechanism by which humans
can also detect the sweetness of certain sugars, but this route does
not respond to high-potency sweeteners.
Another aspect of so-called “high-intensity” sweeteners, contin-
ued Fry, is that they are actually “low-intensity.” Few can achieve
even 10% sucrose equivalent (the approximate sweetness intensity
of many fruit juices and soft drinks) on their own.
In contrast, sucrose itself can deliver much higher sweetness
intensities. “This is why I prefer to refer to them as ‘high-potency,’
rather than high-intensity sweeteners,” Fry averred. Providing an
example of a typical response curve, Fry indicated the maximum
sweetening effect of Rebaudioside A (Reb A) occurs at about
5-800ppm concentration and exhibits a sweetness level roughly
equivalent to an 8% sucrose solution.
All high-potency sweeteners have similarly shaped concentra-
tion-response curves that plateau at some relatively low sweetness
intensity. Continued Fry, “So, if you double the concentration of
a high-potency sweetener, you do not get double the sweetness. In
contrast, sucrose has a linear response of sweetness to concentration.”
In addition, different high-potency sweeteners have different
time-intensity relationships that can affect their taste profile. Fry
noted that combining acesulfame-K (AceK), which exhibits a quick
onset and rapid drop-off of sweetness, with slow-onset, more-linger-
ing aspartame, more closely mimics the sweetness profile of sucrose.
This relationship is also “quantitatively synergistic.” That is, the com-
bined sweetness from these two sweeteners exceeds that which would
have been predicted based on the properties of each sweetener alone.
(See chart “Synergies of Low-intensity/High-potency Sweeteners.”)
“This suggests that we can get synergistic enhancements of
sweetness by combining high-potency sweeteners that react
at different parts of the receptor structures,” concluded Fry.
Nevertheless, while none of the available high-potency sweet-
eners alone generates sweetness intensities greater than that of
about 15% sucrose solution, synergistic effects between different
molecules also disappear around this level. Despite the fact that
synergism will not furnish true high intensities, the effect is much
used to maximize the effectiveness and taste quality of zero-calo-
rie sweeteners in foods and beverages.
As Fry explained, use of high-potency sweeteners at levels ap-
proaching their sweetness plateau is a costly waste. In addition, at
these elevated concentrations, many sweeteners exhibit intrinsic
off-tastes (e.g., a bitter-metallic taste for saccharin). Blends allow
product developers to keep individual sweeteners below the
thresholds for off-taste development, while achieving quantitative
synergies and, thus, minimizing cost.
Fry addressed other factors that can enhance the effectiveness of
high-potency sweeteners, particularly in relation to typical issues
of slow onset and lingering sweetness. Citing the “non-specific
binding” hypothesis, he noted that increasing the osmotic pres-
sure of food and beverage systems “compresses the time-intensity
profiles of sweeteners,” thus speeding onset and reducing linger
to produce more sucrose-like taste dynamics with almost any
high-potency sweetener.
Hydrocolloids, sometimes used to remedy mouthfeel losses
when sugars are removed, can also benefit the dynamics of sweet-
ness perception by reducing the impact of non-specific binding.
However, “perhaps the ultimate solution to the different taste
qualities of high-potency sweeteners is not to use them at all,” sug-
gested Fry. He pointed to a relatively new category of compounds,
known as positive allosteric modulators (PAMs), that have no
sweetness or flavor of their own but can greatly enhance the
sweetness intensity of conventional sweeteners, such as sucrose.
Reduced-sugar formulations could thus be made that still deliver
full sweetness and with all the taste qualities of the original sugar.
“How High-potency Sweeteners Work and What to Do about It,”
John Fry, Ph.D., Director, Connect Consulting, [email protected]
Simply Sweet: Updates on How to Make Foods and Beverages Sweeter with Sight, Smell, Sound and Touch“How do you make food and beverages sweet without using
sugar?” asked Alex Woo, Ph.D., CEO and Founder of W2O Food
Innovation. Answering his own question, he continued, “You can
do this by combining a basic understanding of neuroscience and
ingredient technology.”
Woo began his presentation by expanding upon convention-
al concepts of “flavor,” setting the stage whereby to show how to
systematically achieve a 12% sucrose-level of sweetness typically
associated with carbonated, sugared beverages. He proposed a pyra-
midal approach to using low- or no-calorie sweetener alternatives.
First, said Woo, flavor is not just about the five primary tastes.
“Flavor is also 80-90% influenced by smell in the nose.” Touch
receptors in the mouth let us distinguish between grainy, creamy
or crunchy foods. Sound has been labeled “the forgotten flavor
92016 Sweetener Systems Conference Summary ©Global Food Forums®, Inc.
sense” by one academic researcher. “So, when we are talking about
flavor in foods, we are really talking about the full integration of
all five senses…smell, taste, sight, touch and hearing.” Each of
these senses is called a “modality.”
Woo briefly summarized the different taste receptors in the
mouth. “We are hard-wired to make no mistakes in detecting
primary tastes, in large part, for survival reasons.” Signals from
different taste and other receptors are integrated into perceived
flavors by the brain.
In order to remove sugar from a product while protecting its
sweet taste perception, Woo proposed “a methodology similar to
stacking layers onto a pyramid in order to achieved the desired
sweet taste intensity.”
First, there is a foundational layer comprising a high-potency,
plant-based sweetener (HPS), such as stevia. If the stevia is stacked
with monk fruit (not yet approved in the EU) in a 2:1 ratio (200-
100ppm), this achieves about 6% sucrose equivalence (SE) in
sweetness. This is equivalent to about a 50% sucrose reduction for
most beverages in the market, said Woo.
The next step is to add a bulk non- or low-caloric sweeten-
er, such as erythritol or allulose, to boost the sweetness by an
additional 2% to approximately 8% SE. “Less is more,” counseled
Woo. You want to add just enough of each sweetener to maximize
its sweetness effect without contributing off-flavors. In addition,
there are the time-intensity curves to be considered, as addressed
by John Fry, Connect Consulting, in his presentation.
The next step on the pyramid relies upon “cross-modal corre-
spondence.” This refers to the integration of multiple signals from
all five senses in the brain.
Of these, the most important is smell. “We have about
400 smell receptors in the nose that can detect up to 1
trillion different odors” which interact with taste to create
flavors. Phantom flavors are those that operate below their
own taste detection level but serve to enhance the sweet-
ness of sweeteners. Congruent flavors are aroma molecules
above the detection level that are typically associated with
sweetness. These include sugar, honey or molasses distil-
lates, tomato aroma, tea distillates or vanilla aroma.
Combined, this achieves about 10% SE. But for carbon-
ated diet beverages, one will need a 12% SE. This requires
“cross-modal modulation,” involving the interplay between
the other sensory modalities.
Touch, including temperature sensations and carbon-
ation (a pain agent), can mute differences between different
artificial, high-potency sweeteners, making them more like su-
crose. Lower temperatures make stevia more potent, while higher
temperature increases sweetness perception in chocolate.
Sight: shape (roundness) is associated with sweetness.
Symmetrical and minimal features serve to enhance sweetness
perceptions by 10-30% (in chocolates, for example). Such associ-
ations also exist in nature, where round fruits are associated with
sweetness. The color red is also associated with sweetness. Woo
noted that both Coke and Pepsi’s carbonated beverages emphasize
round shapes and red colors in their packaging.
Sound has been easy to overlook, but there is considerable
documentation linking it to sweetness perception. High-pitched
music has been associated with increased sweetness, whereas low-
pitched music suggests increased bitterness.
Combined, this pyramidal combination of ingredients based on
neuroscience serves to attain the 12% SE target for sweetness.
“Simply Sweet: Updates on How to Make Foods and Beverages Sweeter
with Sight, Smell, Sound and Touch,” Alex Woo, Ph.D., CEO and
Founder of W2O Food Innovation, [email protected]
The Science Behind Sugar Reduction: Ingredient Functionality Beyond TasteWhat if the development or reformulation of a product was en-
tirely predictable? What if it was a process informed by science,
rather than “gut feel”—allowing consistency and quality to be
controlled on a global scale, regardless of differences in process-
ing, packaging or the ingredient supply chain?
This was the objective sought by Leatherhead Food Research
(UK) Professor Kathy Groves, Head of Science and Microscopy.
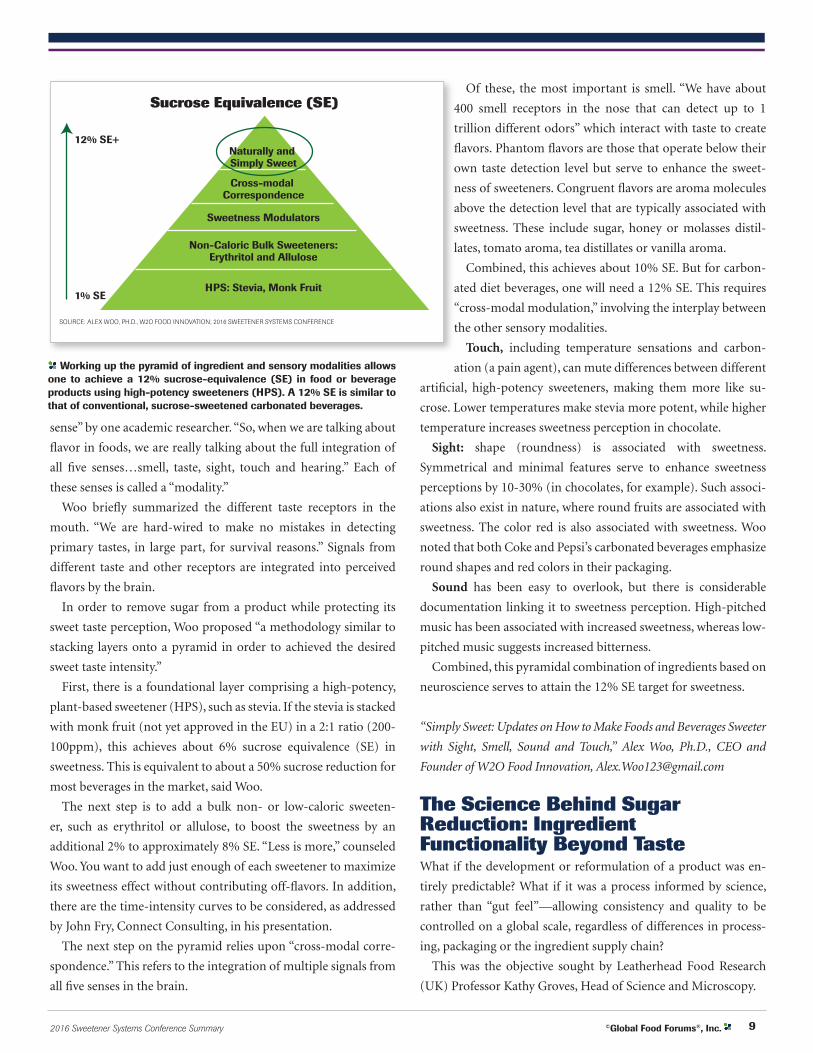
Sucrose Equivalence (SE)
SOURCE: ALEX WOO, PH.D., W2O FOOD INNOVATION; 2016 SWEETENER SYSTEMS CONFERENCE
Naturally and Simply Sweet
Cross-modal Correspondence
Sweetness Modulators
Non-Caloric Bulk Sweeteners:Erythritol and Allulose
HPS: Stevia, Monk Fruit
12% SE+
1% SE
Working up the pyramid of ingredient and sensory modalities allows one to achieve a 12% sucrose-equivalence (SE) in food or beverage products using high-potency sweeteners (HPS). A 12% SE is similar to that of conventional, sucrose-sweetened carbonated beverages.
10 ©Global Food Forums®, Inc. 2016 Sweetener Systems Conference Summary
“If you want to reduce sugar in foods and—this is important—
make high-quality products anywhere in the world, then you need
to have a proper blueprint of your products,” said Groves.
“Blueprint” refers to a technical map that tells a product de-
veloper or food scientist how a product is affected when specific
parameters are changed: the effect of formula or process changes
on product state, process, structure, texture and sensory proper-
ties, for example. While acknowledging that developing such a
blueprint is not an easy proposition without access to the relevant
technical skillsets, “not doing so for a product (with mass market
appeal) can create significant inefficiencies in your product devel-
opment process. The cost of not doing a blueprint far outweighs
the cost of doing one,” said Groves.
How does one begin to develop such a blueprint? Begin by lay-
ing out the various parameters that define product performance
and quality attributes, such as texture, chemistry, nutritional
ingredient functionality and nutritional value, to cite a few ex-
amples. Each parameter is, in turn, defined by a list of specific
attributes or other variables, such as “foam or emulsion interface”
under ingredient functionality, or “viscosity and rheology” under
texture. Such a blueprint provides a checklist for product and
process developers whereby to address product-related issues in
a systematic manner.
To demonstrate the concept, Groves provided the example of a
biscuit’s (i.e., cookie) microstructure and its relationship to tex-
ture and other quality parameters. She began by showing a crumb
structure as seen under a conventional stereomicroscope, empha-
sizing that the observable crumb structure has “everything to
do with your experience when you eat it.”
If one cuts a thin slice through the crumb, one observes “a
matrix of starch, protein, sugar and fat throughout the crumb
structure.” Transmitted cross-polarized light through the slice
causes anything with ordered crystallinity (e.g., sugar, fat) to
appear white and, when stained, the matrix becomes much
clearer, further distinguishing the positions of starches and
proteins in the matrix.
The next step is to zoom into the structure with a scanning
electron microscope. Air gaps become evident, which affect
the fracture mechanics “when one bites into the product,” said
Groves. Changing the type of detector in the electron micro-
scope brings out the (white) fat in the image. Fat distribution
can affect taste perception–i.e., a creamy mouthfeel associated
with fat particles that are broadly distributed over the crumb
surface. Such microstructure data can then be linked with
other techniques, such as texture or audio analyses, to deter-
mine chewing properties or brittleness, in order to further
enhance the blueprint.
What happens to the product blueprint if we replace sugar in the
biscuit with a typically used alternative bulk sweetener? Whereas
the sugar formula exhibits evenly distributed sugar, fat, starch and
protein, these fat, protein and starch interactions are very different
in the biscuit crumb with the alternative bulk sweetener. Also, the
structure (viewed under a scanning electron microscope) appears
very uneven; large gaps and major differences in fat distribution
were evident.
“All these observed differences contribute to very different eat-
ing sensations,” said Groves. Texture analysis reveals that the sugar
formula results in a harder biscuit than with the alternative bulk
sweetener product.
It is clear that removing sugar has enormous implications for a
biscuit’s microstructure, which in turn has implications for tex-
ture, flavor and shelflife. Developing a blueprint for a product’s
ingredient function, chemistry, nutritional value, texture and
other values provides a map for product formula and process
adjustment, or new product development.
“Once you start doing this, it gets better, it gets easier, you
become more informed—and you can extend that accumulated
knowledge to other product applications,” concluded Groves.
The Science Behind Sugar Reduction: Ingredient Functionality
Beyond Taste,” Prof. Kathy Groves, Head of Science & Microscopy
and Consultant, Leatherhead Food Research, Kathy.Groves@
LeatherheadFood.com
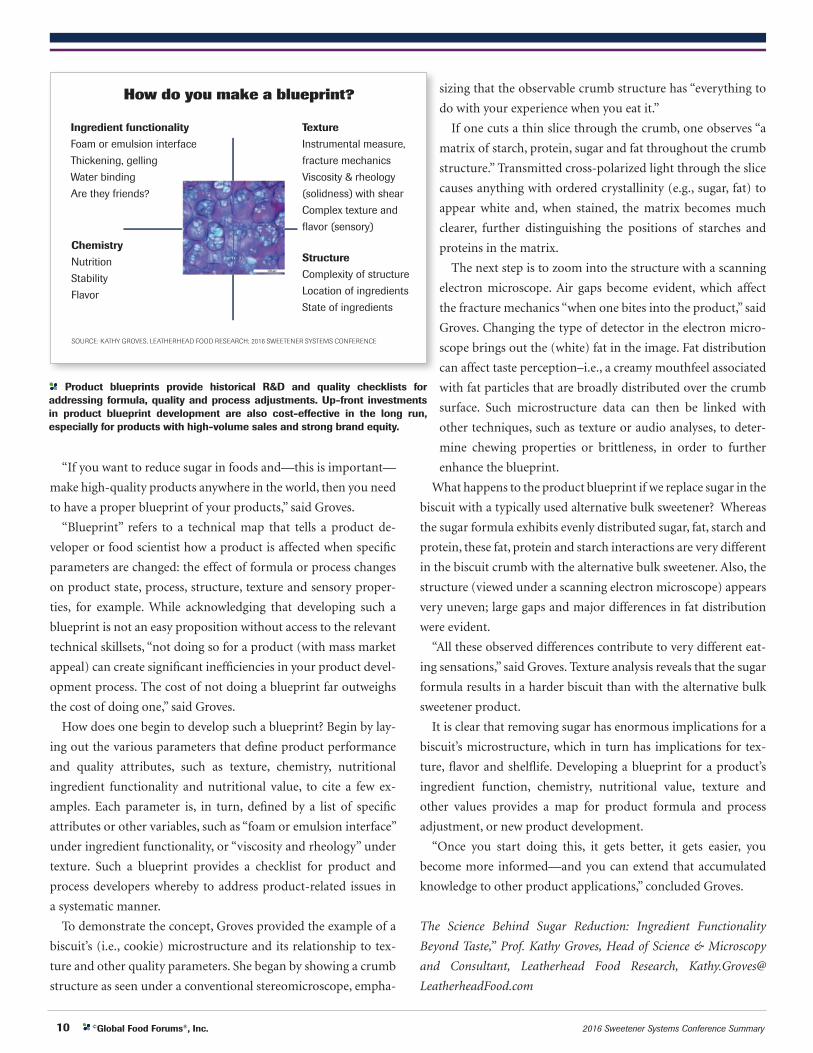
How do you make a blueprint?
SOURCE: KATHY GROVES, LEATHERHEAD FOOD RESEARCH; 2016 SWEETENER SYSTEMS CONFERENCE
Ingredient functionalityFoam or emulsion interface
Thickening, gelling
Water binding
Are they friends?
TextureInstrumental measure,
fracture mechanics
Viscosity & rheology
(solidness) with shear
Complex texture and
flavor (sensory)
StructureComplexity of structure
Location of ingredients
State of ingredients
ChemistryNutrition
Stability
Flavor
Product blueprints provide historical R&D and quality checklists for addressing formula, quality and process adjustments. Up-front investments in product blueprint development are also cost-effective in the long run, especially for products with high-volume sales and strong brand equity.
112016 Sweetener Systems Conference Summary ©Global Food Forums®, Inc.
Emerging Research in Aromas and Sweetness Enhancement The presentation by Thomas Colquhoun, Ph.D., Plant
Biologist at the University of Florida (Gainesville), built
further on the concept of multi-modal sweetness perceptions
developed by previous speakers. The focus was on the po-
tential role of volatiles and, perhaps also color and shape, on
sweetness perception.
“I run a plant biotech lab that is affiliated with the UF/IFAS
Plant Innovation Center, for which the overarching goal is to
better people’s lives through better plant products,” explained
Colquhoun. “We do this by enhancing the aesthetic appeal of
plants; increasing flavor and nutritional value; and delivering
plant products that consumers actually want.”
Colquhoun explained the process used:
“The first step is to test and quantify consumer expectations
and perceptions using methods referred to as ‘psychophysics.’
We try to understand what people’s perceptions are of plant
products, from taste and flavor to emotion and perceived
importance.”
Second, the germplasms of various plants are screened
for biochemicals and physical attributes linked to specific,
consumer-identified desirability traits. “We link molecular
biology, biochemistry and psychophysics,” said Colquhoun.
Finally, once the specific plant genes associated with de-
sirable traits are identified, breeding programs are developed
to imbed the desired characteristics into the targeted plants.
The laboratory’s first application of these methods iden-
tified that “sweetness” was the most desirable trait that
consumers identified with strawberries. The next step was to
categorize all available strawberry germ plasms by their re-
spective combinations of sugars, acids and volatiles (although,
Colquhoun noted, geography and growing conditions can
also affect these variables within specific cultivars). Sensory
analysis, using the psychophysics process, was then used to
identify the optimum combinations of these metabolites that
consumers associated with sweetness.
“Going through this process, we stumbled upon the phe-
nomenon of ‘volatile-enhanced taste,’” observed Colquhoun.
“We identified volatiles that significantly contribute to
the perception of sweetness without the presence of sugar
on the tongue.” This required the use of highly sophisticat-
ed and very expensive equipment, such as the laboratory’s
triple-quad mass spectrophotometer, because when dealing
with “human psychophysics data,” there is so much variation
in the sensory data that it is necessary to obtain the highest
resolution available at the biochemical level. Even minute
variations in biochemical data may be correlated to specific
taste and flavor perceptions. In time, the scientists developed
a relational model that was sufficiently and consistently
sensitive to be applicable to different fruits across different
harvest conditions.
“When we applied a hierarchical cluster analysis to
strawberries, tomatoes and blueberries, something very
interesting popped out,” said Colquhoun. All three of these
fruits’ consumer profiles clustered out according to perceived
sweetness; but, when clustered on the basis of their chemistry,
they grouped out on the basis of their fruit identity. Thus,
an important discrepancy was identified between the fruits’
basic chemical compositions and their perceived sweetness.
The question of “why?” necessitated building complex,
multivariate models capable of associating specific and
minute metabolite concentrations to specific sensory attri-
butes. The researchers found there were specific metabolites
associated with “sweet” taste; and others associated with salty
and bitter tastes, as well as “overall liking” and “overall fruit
flavor” perceptions. Most compelling were the following two
responses linked to sweetness:
1) The overall sweetness perceptions for blueberries were
considerably lower than those for strawberries, at a fixed sugar
content; i.e., it required a 2-3-fold higher sugar content in
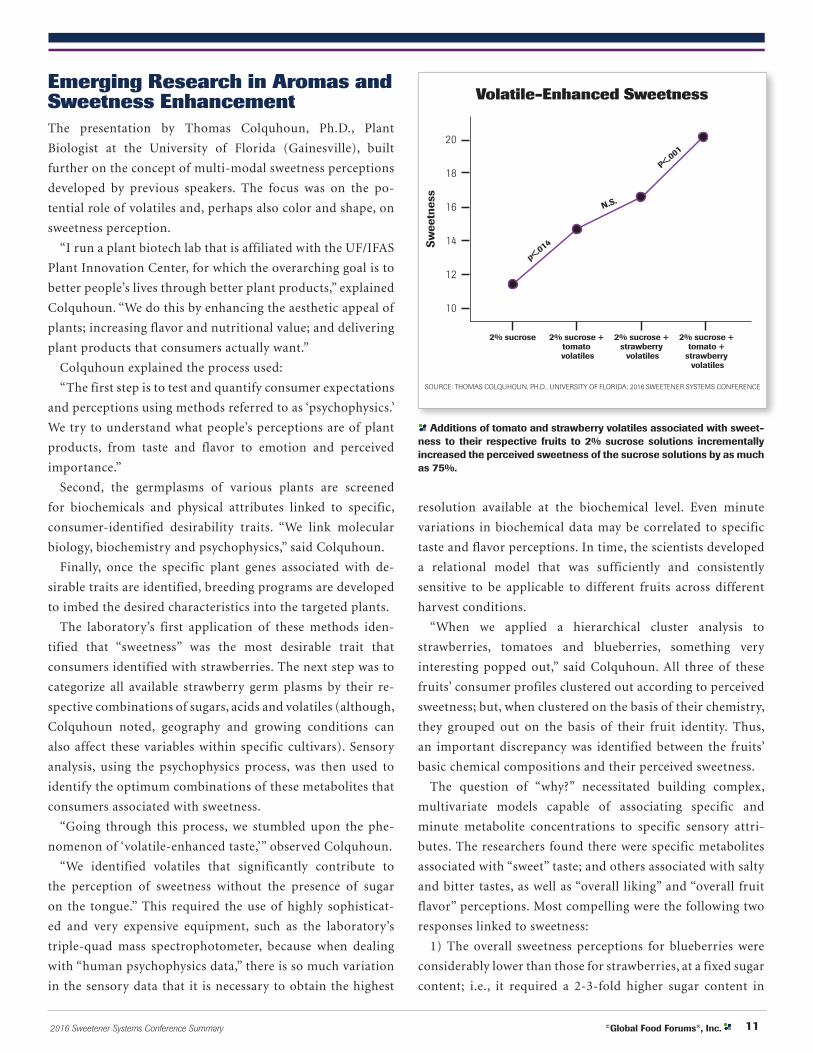
Volatile-Enhanced Sweetness
SOURCE: THOMAS COLQUHOUN, PH.D., UNIVERSITY OF FLORIDA; 2016 SWEETENER SYSTEMS CONFERENCE
Sw
eetn
ess
20
18
16
14
12
10
2% sucrose
P<.001
2% sucrose + tomato volatiles
2% sucrose + strawberry
volatiles
2% sucrose + tomato +
strawberry volatiles
p<.014
N.S.
Additions of tomato and strawberry volatiles associated with sweet-ness to their respective fruits to 2% sucrose solutions incrementally increased the perceived sweetness of the sucrose solutions by as much as 75%.
12 ©Global Food Forums®, Inc. 2016 Sweetener Systems Conference Summary
blueberries to match the perceived sweetness of strawberries.
This result appears to support data, presented in an earlier
presentation by Alex Woo, Ph.D., of W2O Food Innovation,
indicating that red colors strongly evoke sweetness percep-
tions in foods and beverages.
2) Adding specific volatiles gleaned from strawberries and
tomatoes to a 2% sucrose solution incrementally increased
the sweetness perceptions of the sucrose solutions by 25-75%.
In conclusion, the roles of volatiles in modulating percep-
tions of sweetness are very real and substantial, as are the
challenges of manipulating and measuring the presence of
the same volatiles in the fruit. Thus, even tiny changes can
offer enormous payoffs.
“Emerging Research in Aromas and Sweetness Enhancement,”
Thomas Colquhoun, Assistant Professor, Plant Biotechnology,
University of Florida, [email protected]
KEYNOTE SPEAKER: Understanding Consumer Reaction to Sweetened New Products The way consumers perceive sweetness can be said to be a “good
news, bad news” type of situation.
The bad news: Rising obesity has placed a spotlight on sweet-
eners, and 70% of consumers are concerned about how sugar
impacts their health. The WHO has urged a tax increase on sug-
ary drinks to reduce consumption, and bloggers, celebrities and
media outlets have painted HFCS as “the devil.”
However, backed by Mintel’s market research, which includes
gathering the opinions of 30,000 consumers each month and
tracking consumer spending in 3,000 markets across 34 countries,
Lynn Dornblaser, Director of Innovation & Insight at Mintel,
has good news to report. Taste and value still drive the consumer
mindset; a healthy percentage of people are willing to pay a pre-
mium for natural sweeteners like stevia; and, in short, consumers
still care about indulgence.
“Even consumers who are looking for healthfulness and
sugar restriction aren’t eating that way 100% of the time,”
Dornblaser said. “The good news is there’s room for everything
in the marketplace.”
New product introductions that make low- or reduced-sugar
claims are on the rise since 2012, “and at a faster pace than new
product introductions in general,” according to Mintel data. In
the “snacks/cereal/energy bars” category, consumers consider
low-sugar options as “unique” and “premium,” but are less
likely to purchase them—because they aren’t considered “good
value” or “tasty.”
“When you dig down, it’s not about the sugar,” Dornblaser said.
Many of the products are from smaller companies, and consumer
trust tends to be higher with bigger brands. Old Orchard’s Cran-
Naturals Cranberry Apple Juice got a 57% purchase intent score
compared to the 17% for Saluu’s “exciting” and “innovative” Aloe
vera drink.
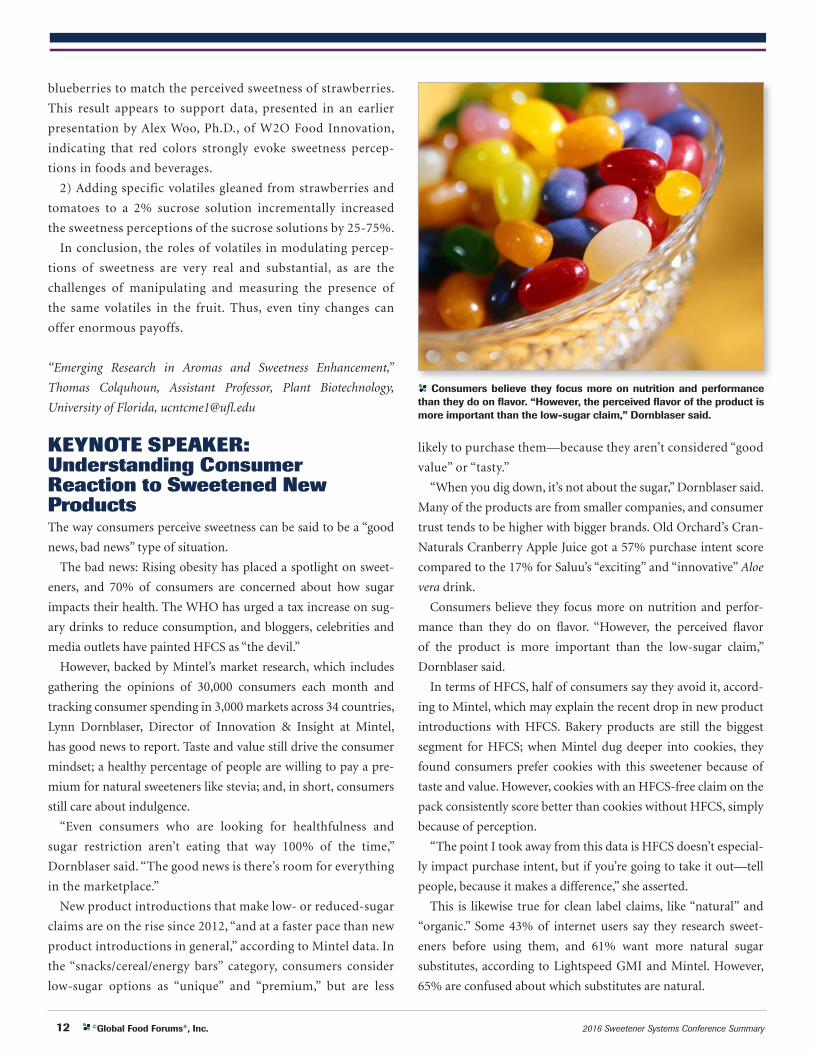
Consumers believe they focus more on nutrition and perfor-
mance than they do on flavor. “However, the perceived flavor
of the product is more important than the low-sugar claim,”
Dornblaser said.
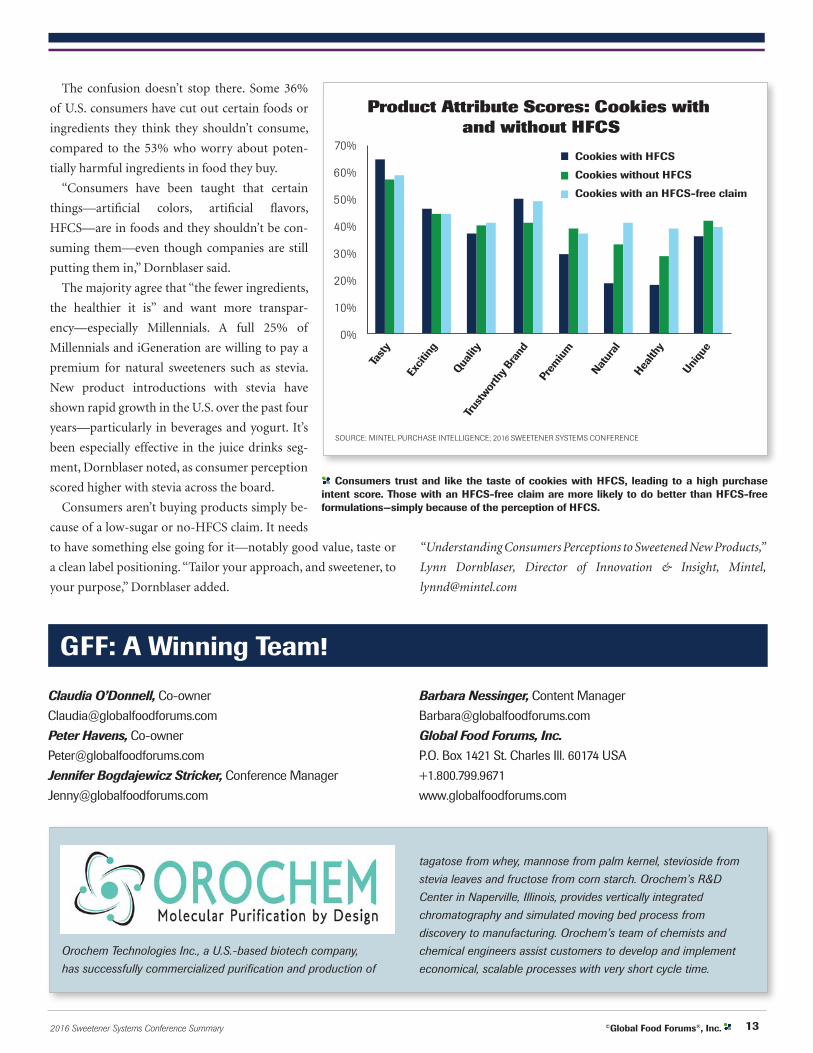
In terms of HFCS, half of consumers say they avoid it, accord-
ing to Mintel, which may explain the recent drop in new product
introductions with HFCS. Bakery products are still the biggest
segment for HFCS; when Mintel dug deeper into cookies, they
found consumers prefer cookies with this sweetener because of
taste and value. However, cookies with an HFCS-free claim on the
pack consistently score better than cookies without HFCS, simply
because of perception.
“The point I took away from this data is HFCS doesn’t especial-
ly impact purchase intent, but if you’re going to take it out—tell
people, because it makes a difference,” she asserted.
This is likewise true for clean label claims, like “natural” and
“organic.” Some 43% of internet users say they research sweet-
eners before using them, and 61% want more natural sugar
substitutes, according to Lightspeed GMI and Mintel. However,
65% are confused about which substitutes are natural.
Consumers believe they focus more on nutrition and performance than they do on flavor. “However, the perceived flavor of the product is more important than the low-sugar claim,” Dornblaser said.
132016 Sweetener Systems Conference Summary ©Global Food Forums®, Inc.
The confusion doesn’t stop there. Some 36%
of U.S. consumers have cut out certain foods or
ingredients they think they shouldn’t consume,
compared to the 53% who worry about poten-
tially harmful ingredients in food they buy.
“Consumers have been taught that certain
things—artificial colors, artificial flavors,
HFCS—are in foods and they shouldn’t be con-
suming them—even though companies are still
putting them in,” Dornblaser said.
The majority agree that “the fewer ingredients,
the healthier it is” and want more transpar-
ency—especially Millennials. A full 25% of
Millennials and iGeneration are willing to pay a
premium for natural sweeteners such as stevia.
New product introductions with stevia have
shown rapid growth in the U.S. over the past four
years—particularly in beverages and yogurt. It’s
been especially effective in the juice drinks seg-
ment, Dornblaser noted, as consumer perception
scored higher with stevia across the board.
Consumers aren’t buying products simply be-
cause of a low-sugar or no-HFCS claim. It needs
to have something else going for it—notably good value, taste or
a clean label positioning. “Tailor your approach, and sweetener, to
your purpose,” Dornblaser added.
“Understanding Consumers Perceptions to Sweetened New Products,”
Lynn Dornblaser, Director of Innovation & Insight, Mintel,
Product Attribute Scores: Cookies with and without HFCS
SOURCE: MINTEL PURCHASE INTELLIGENCE; 2016 SWEETENER SYSTEMS CONFERENCE
70%
60%
50%
40%
30%
20%
10%
0%
Tast
y
Exci
ting
Qualit
yTr
ustw
orth
y Bra
nd
Prem
ium
Natur
al
Health
y
Uniqu
e
Cookies with HFCS
Cookies without HFCS
Cookies with an HFCS-free claim
Consumers trust and like the taste of cookies with HFCS, leading to a high purchase intent score. Those with an HFCS-free claim are more likely to do better than HFCS-free formulations—simply because of the perception of HFCS.
Claudia O’Donnell, Co-owner
Peter Havens, Co-owner
Jennifer Bogdajewicz Stricker, Conference Manager
Barbara Nessinger, Content Manager
Global Food Forums, Inc.
P.O. Box 1421 St. Charles Ill. 60174 USA
+1.800.799.9671
www.globalfoodforums.com
GFF: A Winning Team!
Orochem Technologies Inc., a U.S.-based biotech company,
has successfully commercialized purification and production of
tagatose from whey, mannose from palm kernel, stevioside from
stevia leaves and fructose from corn starch. Orochem’s R&D
Center in Naperville, Illinois, provides vertically integrated
chromatography and simulated moving bed process from
discovery to manufacturing. Orochem’s team of chemists and
chemical engineers assist customers to develop and implement
economical, scalable processes with very short cycle time.
14 ©Global Food Forums®, Inc. 2016 Sweetener Systems Conference Summary
Additional Resources
2017 Sweetener Systems ConferenceDue to the success of its 2016 Sweetener Systems
Conference, Global Food Forums will hold its 2017
Sweetener Systems Conference on November 7th,
at the Westin Hotel, Lombard, Illinois, USA. (Near O’Hare International
Airport). For more information on table top exhibits and sponsorships,
please contact Peter Havens at [email protected] or
630-621-0230.
Go to www.globalfoodforums.com/sweetenersystems for links to past
and future Sweetener Systems Conferences.
Other Global Food Forums Events:
See www.globalfoodforums.com/clean-label for links to past and
future events.
See www.globalfoodforums.com/proteinseminar for links to past and
future events.
For all these events, Global Food Forums publishes complimentary
downloadable copies of post-conference summaries, as well as copies
of presentations, as permitted by speakers. For links to this information,
go to the “Store” tab for each archived event as found above or go to
www.globalfoodforums.com/store.
New! R&D Report on Protein IngredientsThe new Global Food Forums® 2017 R&D
Report: Protein Ingredients, conducted by NSM
Research, Inc., provides strategic analysis and actionable data on the
difficult-to-obtain key drivers of protein ingredient selection. Using
Global Food Forums’ contact database, 200 food, beverage and nu-
tritional product formulators were asked for their opinions on current
and future protein ingredient uses and needs.
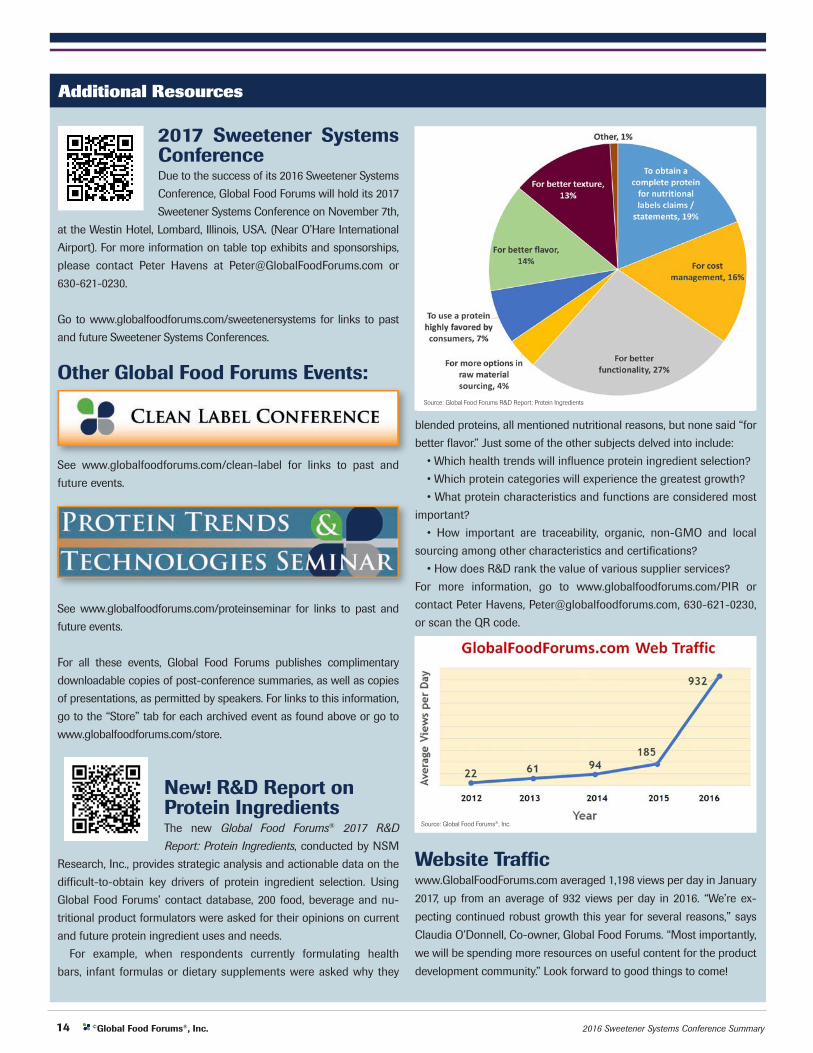
For example, when respondents currently formulating health
bars, infant formulas or dietary supplements were asked why they
blended proteins, all mentioned nutritional reasons, but none said “for
better flavor.” Just some of the other subjects delved into include:
• Which health trends will influence protein ingredient selection?
• Which protein categories will experience the greatest growth?
• What protein characteristics and functions are considered most
important?
• How important are traceability, organic, non-GMO and local
sourcing among other characteristics and certifications?
• How does R&D rank the value of various supplier services?
For more information, go to www.globalfoodforums.com/PIR or
contact Peter Havens, [email protected], 630-621-0230,
or scan the QR code.
Website Trafficwww.GlobalFoodForums.com averaged 1,198 views per day in January
2017, up from an average of 932 views per day in 2016. “We’re ex-
pecting continued robust growth this year for several reasons,” says
Claudia O’Donnell, Co-owner, Global Food Forums. “Most importantly,
we will be spending more resources on useful content for the product
development community.” Look forward to good things to come!
Source: Global Food Forums R&D Report: Protein Ingredients
Source: Global Food Forums®, Inc.

REGISTRANT INFORMATION METHOD OF PAYMENT
Name ________________________________ Enclosed is my check for $_______________made payable
Email ________________________________ to Global Food Forums, Inc. drawn on US funds
Phone ________________________________
Title ________________________________ Charge** my VISA MasterCard American Express
Company_______________________________ Card Number ____________________________________
Address ________________________________ Expiration Date ___________ Security Code____________
City____________________State___________ Amount $ ______________
Postal Code__________ Country ___________ Name on card ____________________________________
*List name as it should appear on badge : Signature ____________________________________
______________________________________
Special needs: __________________________________________________________________________________
Note: Your credit card statement will reflect a charge by Global Food Forums, Inc.
REGISTRATION & FEES (fees effective until expiration of Super Early Bird Discount on September 1, 2017) Food & Beverage Manufacturer-$695.00 Ingredient/Services Supplier-$795.00 _____________________________________________________________________________________ Attendees will receive a registration receipt confirmation email. Please contact Jenny for registration questions at [email protected] or 1-800-799-9671.**A $20.00 processing fee will be added to all credit card transactions. Registration includes receptions on Monday, November 6th (6:00-7:30 p.m.) and Tuesday, November 7th (5:00-6:30 p.m.), all general sessions, meals, networking events and an attendee bag and binder. I plan on attending: Monday Night Reception Tuesday Night Reception
Official Hotel-Westin Lombard, 70 Yorktown Shopping Center, Lombard, Illinois, 60148 USA. www.westinlombard.com A limited number of discounted rooms have been reserved at $145.00, plus tax, for Monday evening, November 6, 2017. For hotel reservations call 1-888-627-9031 and mention the 2017 Sweetener Systems Conference or visit www.GlobalFoodForums.com/2017-Sweetener-Systems (Registration & Fees tab). The cut-off date for discounted room reservations is October 23, 2017. Cancellation & Substitution Policy-Cancellations must be received in writing. For refund details or to update your reservation details visit www.GlobalFoodForums.com/2017-Sweetener-Systems. Alternative parties may be substituted at any time without penalty.
2017 Sweetener Systems Conference November 7, 2017 Westin, Lombard, IL. USA
MAIL OR FAX REGISTRATION TO: Global Food Forums, Inc. P.O. Box 1421, Saint Charles, IL., 60174 FAX: 1-208-246-2242
NOTE: Online registrations can be made at: www.GlobalFoodForums.com/2017-Sweetener-Systems
16 ©Global Food Forums®, Inc. 2016 Sweetener Systems Conference Summary
www.globalfoodforums.com/ProteinSeminar
New 2017 R&D Report: Protein IngredientsNew market research conducted by NSM Research, Inc. surveys R&D and food application
formulators on their attitudes, formulation issues and future trends, as related
to their use of protein ingredients. This 87 page Global Food Forums® R&D Report:
Protein Ingredients is now available. For more information go to:
http://goo.gl/WEJ4KQ or contact Jenny Stricker at [email protected]
or +1.800.799.9671 ext. 1.
www.globalfoodforums.com/CleanLabel
www.globalfoodforums.com/SweetenerSystems
Recommended