2016 Industry Snapshot
Compiled with support from
Employment & Physical Growth
Investment in the Industry
Drug Development Pipeline
What’s in a Number?
Index
1

Employment & Physical Growth
2

MA Biopharma Industry Employment
Industry jobs grew
by 4.2% in 2015,
for total growth of
37% over ten
years.
Source: Privately owned companies, U.S. Bureau of Labor Statistics, Quarterly Census of Employment and Wages (QCEW); MassBio
37%
3

Massachusetts
has more
employment
classified as
Biotechnology
Research and
Development
than any other
state.*
Biotech R&D
employment grew
by 5.3% in 2015.
*NAICS 541711:
Research and
development in
biotechnology. This
classification has only
existed since 2007.
Source: Privately owned companies, U.S. Bureau of Labor Statistics, Quarterly Census of Employment and Wages (QCEW)
9 and 1 Year Employment Performance:
Biotech Research & Development*
Top 5 in Job Growth Since 2007
2007 2014 2015% change
2007 - 2015
% change
2014 - 2015
Massachusetts 24,565 29,897 31,469 28.1% 5.3%
California 19,134 27,123 29,616 54.8% 9.2%
New Jersey 8,567 8,574 13,799 61.1% 60.9%
Pennsylvania 15,902 9,648 10,453 -34.3% 8.3%
Maryland 10,154 8,334 8,003 -21.2% -4.0%
North Carolina 7,042 7,251 7,804 10.8% 7.6%
New York 2,679 4,924 5,571 108.0% 13.1%
Texas 4,229 4,643 4,689 10.9% 1.0%
Ohio 2,696 3,352 3,616 34.1% 7.9%
Missouri 4,262 3,541 3,595 -15.6% 1.5%
Illinois 2,403 3,560 3,435 42.9% -3.5%
Washington 2,499 3,610 3,430 37.3% -5.0%
Delaware 0 3,250 2,891 n/a -11.0%
Florida 737 2,622 2,760 274.5% 5.3%
Michigan 4,670 2,686 2,751 -41.1% 2.4%
4
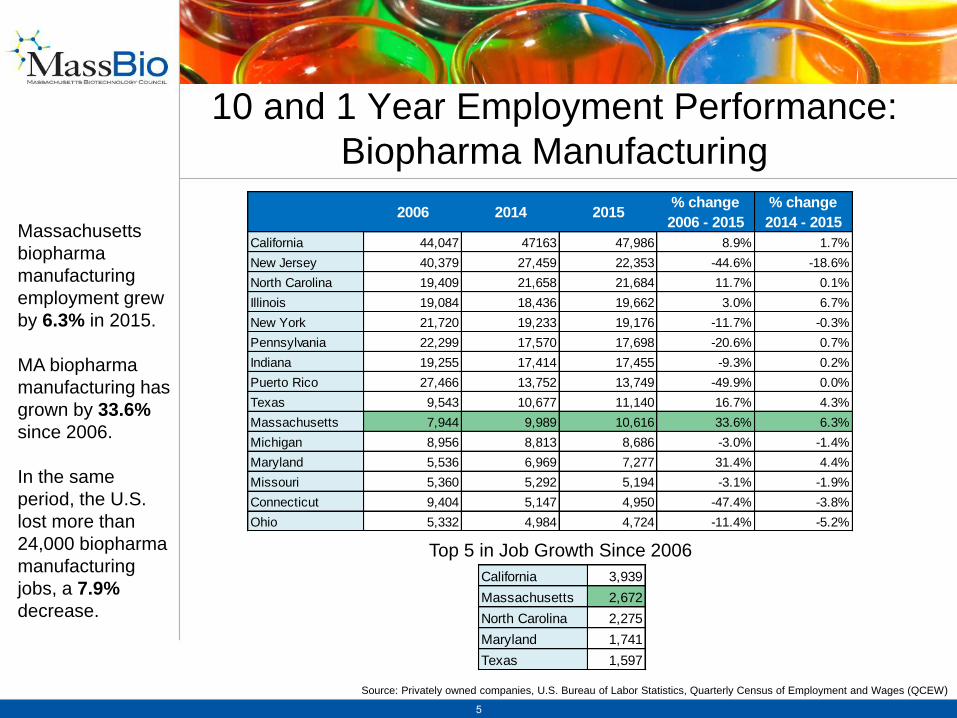
10 and 1 Year Employment Performance:
Biopharma Manufacturing
Top 5 in Job Growth Since 2006
Massachusetts
biopharma
manufacturing
employment grew
by 6.3% in 2015.
MA biopharma
manufacturing has
grown by 33.6%
since 2006.
In the same
period, the U.S.
lost more than
24,000 biopharma
manufacturing
jobs, a 7.9%
decrease.
Source: Privately owned companies, U.S. Bureau of Labor Statistics, Quarterly Census of Employment and Wages (QCEW)
California 3,939
Massachusetts 2,672
North Carolina 2,275
Maryland 1,741
Texas 1,597
2006 2014 2015% change
2006 - 2015
% change
2014 - 2015
California 44,047 47163 47,986 8.9% 1.7%
New Jersey 40,379 27,459 22,353 -44.6% -18.6%
North Carolina 19,409 21,658 21,684 11.7% 0.1%
Illinois 19,084 18,436 19,662 3.0% 6.7%
New York 21,720 19,233 19,176 -11.7% -0.3%
Pennsylvania 22,299 17,570 17,698 -20.6% 0.7%
Indiana 19,255 17,414 17,455 -9.3% 0.2%
Puerto Rico 27,466 13,752 13,749 -49.9% 0.0%
Texas 9,543 10,677 11,140 16.7% 4.3%
Massachusetts 7,944 9,989 10,616 33.6% 6.3%
Michigan 8,956 8,813 8,686 -3.0% -1.4%
Maryland 5,536 6,969 7,277 31.4% 4.4%
Missouri 5,360 5,292 5,194 -3.1% -1.9%
Connecticut 9,404 5,147 4,950 -47.4% -3.8%
Ohio 5,332 4,984 4,724 -11.4% -5.2%
5

Largest Biopharma Industry Employers in
MA, 2015
Sources: MassBio Membership Reports & Surveys; Boston Business Journal Book of Lists, 2016
Sanofi
Genzyme
continues to be
the largest
employer in the
industry in
Massachusetts.
GE Healthcare
Life Sciences is
a new addition
to the top 25
with 540
employees
following the
opening of their
new
headquarters in
Massachusetts.
Rank Company Employees
1 Sanofi Genzyme 5,000
2 Biogen 2,900
3 Shire 2,580
4 Novartis 2,516
5 Takeda 2,228
6 Pfizer 2,200
7 Parexel International 1,396
8 Quest Diagnostics 1,350
9 Vertex 1,300
10 Charles River Laboratories 1,000
11 EMD Millipore 1,000
12 EMD Serono 836
13 AbbVie 800
Rank Company Employees
14 Sunovion Pharmaceuticals 590
15 Merck 575
16 Alkermes 548
17 GE Healthcare Life Sciences 540
18 Amgen 502
19 AstraZeneca 400
20 Bristol-Myers Squibb 400
21 Merrimack 350
22 Alnylam 334
23 Immunogen 325
24 Lantheus 322
25 Ironwood 289
6

63,025 employees
$147,432 average salary
$9,292,062,129 total MA-based payroll
Source: Private sector, U.S. Bureau of Labor Statistics, Quarterly Census of Employment and Wages (QCEW)
Biopharma Economic Impact, 2015
7

10 and 1 Year Employment Performance:
Medical Device
Source: U.S. Bureau of Labor Statistics, Quarterly Census of Employment and Wages (QCEW)
MassBio has
seen growth in
drug-device
combinations
and
diagnostics.
New this year,
MassBio looked
at the
performance of
the medical
devices sector
of the industry.
2006 2014 2015% change
2006 - 2015
% change
2014 - 2015
California 61,000 65,833 65,870 8.0% 0.1%
Minnesota 28,247 28,731 29,179 3.3% 1.6%
Florida 24,198 23,263 23,455 -3.1% 0.8%
Indiana 17,477 18,091 18,228 4.3% 0.8%
New York 20,663 17,021 17,425 -15.7% 2.4%
Pennsylvania 19,611 16,519 16,549 -15.6% 0.2%
Massachusetts 17,010 15,818 15,831 -6.9% 0.1%
Puerto Rico 14,944 14,952 14,923 -0.1% -0.2%
Illinois 12,493 13,433 14,102 12.9% 5.0%
Texas 14,521 14,008 14,029 -3.4% 0.1%
New Jersey 13,926 13,487 13,787 -1.0% 2.2%
Utah 9,190 11,617 11,904 29.5% 2.5%
Michigan 9,795 12,233 11,715 19.6% -4.2%
Wisconsin 11,637 10,862 11,015 -5.3% 1.4%
Ohio 11,904 10,691 10,683 -10.3% -0.1%
8

Largest Medical Device Employers in MA,
2015
Sources: MassBio Membership Reports & Surveys; Boston Business Journal Book of Lists, 2016
Rank Company Employees
1 Philips 3,565
2 Boston Scientific 1,772
3 Thermo Fisher Scientific 1,750
4 DePuy Synthesis 1,500
5 Smith & Nephew 1,000
6 PerkinElmer 875
7 Nova Biomedical 780
8 Analogic 730
9 Hologic 586
10 ZOLL Medical 585
11 Haemonetics 570
12 Insulet 400
13 NxStage Medical 353
14 Abiomed 350
15 Cynosure 346
16 Tecomet 336
9

2007
Sources: Colliers Meredith & Grew, Life Science Review, 2007-2015; CBRE 2016
2016
25,075,230 s.f.
16,063,990 s.f.
New facilities in 2016 Over 9 million
square feet of
commercial lab
space has been
added to the
Massachusetts
market since
2007.
Of that 9
million, 4
million square
feet has been
added since
2013 alone.
Pfizer, 610 Main Street North, Cambridge
Bristol Myers Squibb, Devens
Life Sciences Lab Inventory Growth
10

Industry Geography
The immediate
western suburbs
include 75+ biotech
companies,
15 colleges, 3 million
s.f. of lab space.
128/Suburbs
50+ biotech companies,
WPI, UMass-Worcester,
and 16 other colleges.
Worcester/I-495 50+ biotech companies,
2 million+ s.f. in lab space,
UMass-Lowell and 11 other
colleges.
Northeast
Home of UMass-
Amherst and 21 other
colleges. Area known
as The Knowledge
Corridor.
West
Strong med device and
biopharma manufacturing
capacity, with numerous
land sites in BioReady®
communities and 10
colleges.
South Coast
250+ biotech companies,
the top 4 NIH-funded
hospitals in the U.S.,
and 48 colleges.
Boston-Cambridge
The life sciences
industry
continues to
grow across the
Commonwealth.
Source: MassBio Membership Reports
11

Forecasting Job Demand
*”Ancillary Sectors” is comprised of biotech-related jobs in five separate industries encompassing higher education,
healthcare, testing laboratories, and laboratory research instrumentation manufacturing
Source: Annual Job Trends Forecast 2016, MassBioEd
MassBioEd
published its first
Annual Job
Trends Forecast
to project future
job demand
trends through
May 2018.
The report
forecasts the
total increase by
May 2018 to be
4,325 new jobs,
a 6.7% increase
from May 2015.
12

Investment in the Industry
13

Top NIH-Funded States:
by Total Funding and Per Capita, 2015
Massachusetts
continues to
outpace other
states in terms of
NIH funding per
capita and ranks
second in total
NIH dollars.
Source: NIH, Research Portfolio Online Reporting, U.S. Census Bureau
Total Funding Funding Per Capita
State Funding
California $3,474,161,367
Massachusetts $2,424,537,355
New York $2,046,827,937
Pennslyvania $1,500,310,007
Maryland $1,292,799,651
North Carolina $1,055,162,620
Texas $1,004,412,330
Washington $885,339,570
Illinois $735,888,006
Ohio $670,051,590
US $22,821,341,439
14

Top NIH-Funded Independent Hospitals, 2015
Source: NIH, Research Portfolio Online Reporting
The top 4 and 5 of
the top 6 NIH-
funded
independent
hospitals are in
Massachusetts.
Only one
independent
hospital receiving
over $100 million
in NIH funding is
not located in
Massachusetts.
Please note:
NIH lists university-
operated hospitals
separately.
Organization City State Awards Funding
Massachusetts General Hospital Boston MA 769 $350,848,744
Brigham & Women's Hospital Boston MA 539 $333,214,883
Children's Hospital Corporation Boston MA 319 $137,431,827
Dana-Farber Cancer Inst. Boston MA 220 $125,295,828
Children's Hospital of Philadelphia Philadelphia PA 202 $114,023,148
Beth Israel Deaconess Medical Center Boston MA 236 $112,741,707
Cincinnati Childrens Hosp Med Ctr Cincinnati OH 257 $98,324,805
St. Jude Children's Research Hospital Memphis TN 94 $66,612,466
New York State Psychiatric Institute New York NY 93 $44,789,229
Cedars-Sinai Medical Center Los Angles CA 95 $41,464,366
Seattle Children's Hospital Seattle WA 84 $38,150,472
National Jewish Health Denver CO 56 $35,256,665
Boston Medical Center Boston MA 78 $30,632,865
Roswell Park Cancer Institute Corp Buffalo NY 67 $28,371,593
McLean Hospital Belmont MA 83 $26,164,845
15

Top Massachusetts NIH-Funded Non-Profits, 2015
Source: NIH, Research Portfolio Online Reporting
Massachusetts
non-profits are
significant
recipients of NIH
funding.
ORGANIZATION AWARDS FUNDING
Harvard Medical School 381 $182,207,074
Broad Institute, Inc. 64 $138,387,917
University of Massachusetts Medical School 325 $131,445,732
Harvard School of Public Health 188 $123,457,982
Boston University Medical Campus 238 $122,486,803
Massachusetts Institute of Technology 257 $100,256,843
Harvard University 121 $55,490,602
Tufts University Boston 127 $46,963,860
Boston University (Charles River Campus) 112 $37,356,161
Brandeis University 80 $27,769,696
Northeastern University 57 $20,512,090
University of Massachusetts Amherst 67 $19,181,224
Whitehead Institute for Biomedical Research 40 $19,078,604
National Bureau of Economic Research 27 $14,042,432
Boston College 27 $12,786,584
Josline Diabetes Center 33 $12,483,350
16
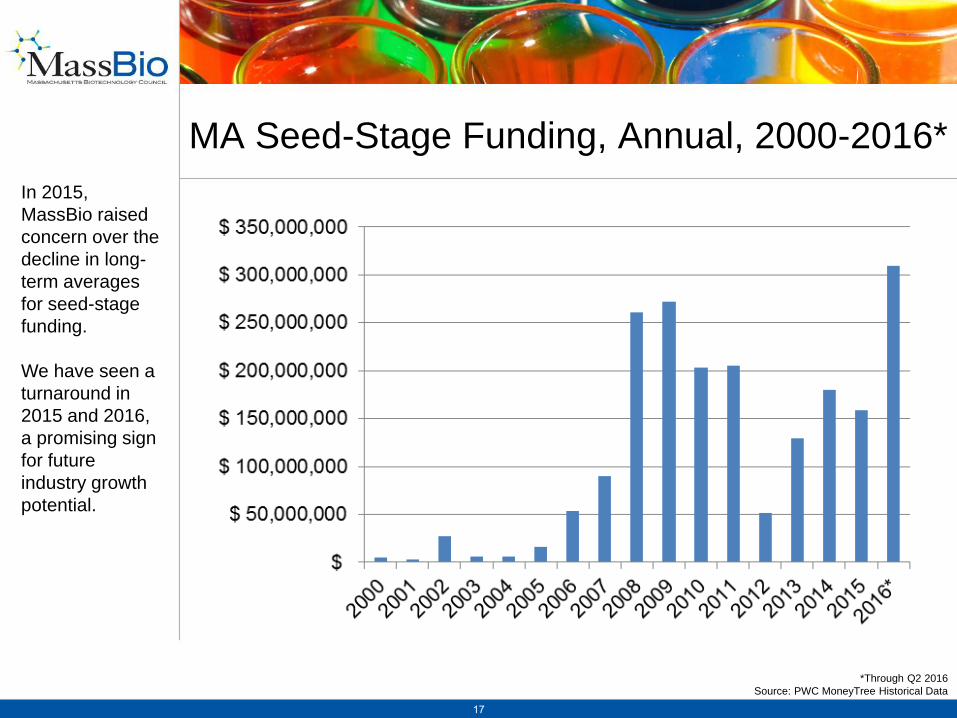
MA Seed-Stage Funding, Annual, 2000-2016*
*Through Q2 2016
Source: PWC MoneyTree Historical Data
In 2015,
MassBio raised
concern over the
decline in long-
term averages
for seed-stage
funding.
We have seen a
turnaround in
2015 and 2016,
a promising sign
for future
industry growth
potential.
17

Venture
investment in MA
rose to a record
$2.1 billion in
2015, an all-time
high.
Massachusetts
receives 28% of
all VC dollars in
biotech in the
U.S.
Source: PwC Money Tree Report
Investment in Massachusetts Biotech Companies, 2006-2015
Venture Capital Investment
18

Top 15 VC Financings in MA, 2015
Source: EvaluatePharma®, July 2016
CompanyInvestment
($ million)Financing Round
Moderna Therapeutics $450 Series D
Editas Medicine $120 Series B
Gritstone Oncology $102 Series A
Syndax Pharmaceuticals $80 Series C
Chiasma $70 Series E
Intellia Therapeutics $70 Series B
WAVE Life Sciences $66 Series B
Dimension Therapeutics $65 Series B
Voyager Therapeutics $60 Series B
UNUM Therapeutics $60 Series B
Ra Pharmaceuticals $59 Series B
Jounce Therapeutics $56 Series B
Constellation Pharmaceuticals $55 Series Undisclosed
RaNA Therapeutics $55 Series B
Neon Therapeutics $55 Series A
19

Top 10 VC Financings in MA, 2016*
Source: EvaluatePharma®, July 2016
*Through Q2 2016
CompanyInvestment
($m)Financing Round
C4 Therapeutics $73 Series A
Kala Pharmaceuticals $68 Series C
Vedanta Biosciences $50 Series Undisclosed
Entasis Therapeutics $50 Series B
Yumanity Therapeutics $45 Series A
Homology Medicines $43.5 Series A
Syros Pharmaceuticals $40 Series Undisclosed
Synlogic $40 Series B
Tarveda Therapeutics $38 Series C
Scholar Rock $36 Series B
20

Lead VC Location for MA Companies, 2015* (percent of dollar amount)
*Sum of MA biotech companies receiving VC dollars in 2015, narrowed down to lead investors
(excluding undisclosed investors and/or amounts and existing shareholder rounds)
Source: EvaluatePharma®, July 2016
Massachusetts
-based VCs
invested over
$596 million
into MA
biotechs,
representing
25% of the
total
investment.
Massachusetts
-based VCs
provided 79%
of the total
Seed Capital
and 49% of
Series A
funding for MA
biotechs in
2015.
21

Massachusetts IPOs, 2015
$86 M
Source: Nasdaq.com, BioSpace
Note: Figures refer to “offer amounts” (investment secured) at time of IPO
$4 M
$40 M
$147 M
$55 M
$60 M
$70 M
$65 M
$134 M There were 13
IPOs from
Massachusetts
companies in
2015.
$72 M
$102 M
$101.8 M
$70 M
22

Massachusetts IPOs, 2016*
Source: Nasdaq.com, BioSpace
Note: Figures refer to “offer amounts” (investment secured) at time of IPO
$147 M
$50 M
$52.8 M
$11.04
There were 7
IPOs from
Massachusetts
biotech
companies in
the first half of
2016.
$72 M
$70 M
$50 M
*Through Q2 2016
23

Geography of VC and IPOs, 2015
Location of VC-backed
Companies
Location of Companies
with IPOs
In 2015, 57%
of all
Massachusetts
biotechs
receiving
venture capital
were located
in Cambridge.
More than half
(54%) of
Massachusetts
biotechs with
Initial Public
Offerings
(IPOs) from
2015 were
located
outside of
Cambridge.
Source: EvaluatePharma®, July 2016
24

Drug Development Pipeline
25

Drug Development Pipeline, by Phase
The MA drug
development
pipeline includes
13 candidates
pending FDA
approval.
The number of
drug candidates
in clinical trials
has increased by
14% from 2015.
*Only
Massachusetts-
headquartered
company pipelines
are included.
1,645 MA Drug Candidates*
13% of US Pipeline
5.9% of Global Pipeline
Source: EvaluatePharma®, August 2016
26

Source: EvaluatePharma®, July 2016
There are 1,645
investigational
drugs being
researched in
Massachusetts,
an increase of
10% from 2015.
Only
Massachusetts-
headquartered
company pipelines
are included.
Massachusetts Pipeline by Therapeutic Area
27

MA Pipeline by Medical Indication (Top 25)
Massachusetts
researchers are
currently
researching and
developing
products for
patients with
362 different
medical
indications.
Source: EvaluatePharma®, August 2016
Medical Indication # of investigational drugs % of all activity
General cancer indications 187 11.35%
Solid tumour indications 166 10.08%
Undisclosed 72 4.37%
Other neurological indications 70 4.25%
General inflammatory disorders 56 3.40%
Other immune indications 49 2.98%
General blood malignancies 41 2.49%
Alzheimer's disease 39 2.37%
Breast cancer 38 2.31%
General bacterial indications 38 2.31%
Diabetes, type II (maturity onset) 31 1.88%
Other metabolic indications 30 1.82%
Non-small cell lung cancer (NSCLC) 29 1.76%
Ovarian cancer 29 1.76%
Leukaemia, acute myeloid (AML) 27 1.64%
Melanoma 27 1.64%
Multiple sclerosis (MS) 27 1.64%
Other musculoskeletal disorders 27 1.64%
Cystic fibrosis (CF) 27 1.64%
Non-Hodgkin lymphoma (NHL) 26 1.58%
General cardiovascular indications 26 1.58%
Duchenne muscular dystrophy 25 1.52%
Multiple myeloma 24 1.46%
Amyotrophic lateral sclerosis (ALS) 23 1.40%
General eye disorders 22 1.34%
28

New Drug Approvals for MA Companies*,
2015
*Approved drugs researched, developed or manufactured in Massachusetts
Source: CenterWatch
Orkambi; Vertex: For the treatment of cystic fibrosis
Varubi; Tesaro: For the prevention of delayed nausea and vomiting associated with
chemotherapy
Aristada; Alkermes: For the treatment of schizophrenia
Strensiq; Alexion: For the treatment of hypophosphatasia
Onivyde; Merrimack: For the treatment of metastatic pancreatic cancer following
gemcitabine-based therapy
Ninlaro; Takeda: For the treatment of treat multiple myeloma
Kanuma; Alexion: For the treatment of Lysosomal Acid Lipase (LAL) deficiency
Imlygic; Amgen: For the treatment of unresectable recurrent melanoma
29

New Drug Approvals for MA Companies*,
2016
*Approved drugs researched, developed or manufactured in Massachusetts through July 2016
Source: CenterWatch
Zinbryta; Biogen: To treat multiple sclerosis
Xiidra; Shire: To treat the signs and symptoms of dry eye disease fibrosis
30

Changing the Lives of Patients
Sources: EvaluatePharma®, August 2016
Massachusetts-
headquartered
companies have
developed 506
products that
focus on a wide
range of therapy
areas.
That includes
190 currently
marketed
products.
Approved Products by Therapy Area
Therapy Area Products
Central Nervous System 93
Dermatology 47
Respiratory 43
Gastro-Intestinal 37
Cardiovascular 35
Oncology & Immunomodulators 33
Musculoskeletal 31
Systemic Anti-infectives 21
Blood 19
Genito-Urinary 13
Sensory Organs 11
Endocrine 8
Various 115
Total 506
31

Changing the Lives of Patients
Sources: Developed from multiple sources including EvaluatePharma®, August 2016, emedicine medscape, NCBI, CDC, 2016
Massachusetts-headquartered companies have developed
therapies that focus on patient populations of
250,390,000 patients 1,821,278,000 patients
IN THE UNITED STATES AROUND THE WORLD
32

What’s in a Number?
33

Please note: Prior to 2012, MassBio used two different federal sources for
employment data. In order to present more consistent employment data on a more
timely basis, we no longer use County Business Patterns (CBP) data of the U.S.
Census Bureau but rely primarily on the U.S. Bureau of Labor Statistics, Quarterly
Census of Employment and Wages (QCEW) for this data.
As a result, historical employment data found in the 2012 -2015 Snapshots vary from
that found in past reports. Though the historical annual employment figures vary by
about 5% between the 2012 Snapshot and those of past years, the trend lines are
very similar.
Why use the QCEW? QCEW data is comprised of employment and wages from
unemployment insurance (UI) tax reports submitted by employers and is augmented
by both BLS worksite reports and the Annual Re-filing Survey (ARS), which surveys
one quarter of all private-sector establishments each year. The QCEW data is
available on a more timely basis than the CBP and is directly related to the state’s ES-
202 data, providing an additional, ongoing corroborative source.
What’s in a Number?
34

What is considered “biopharma” employment?
Using the North American Industry Classification System (NAICS), with which QCEW data is reported,
MassBio has determined that several NAICS classifications can be considered part of the biotechnology
and pharmaceutical industry. However, only in certain cases can the industry claim 100% of any one
NAICS code. MassBio determined that a percentage of some industry classifications could be used in
estimating overall industry employment. In some cases, the percentage determination for certain industry
codes was based on reports developed by other organizations. The following NAICS codes are utilized:
NAICS 3254: Pharmaceutical MFG, including Biologics (100%)
NAICS 541711: Research and Development in Biotechnology (100%)
NAICS 541712: R&D in Physical, Engineering, and Life Sciences (except biotech) (22%)
NAICS 334516: Analytical Laboratory Instrument MFG (30%)
NAICS 54138: Testing Laboratories (9%)
NAICS 622: Hospitals (4.5%)
NAICS 61131: Universities (1.9%)
NAICS 621511: Medical Testing Laboratories (100%)
NAICS 4242, Drug merchant wholesalers, is no longer included in any current or annual employment
figures. NAICS 621511, Medical Laboratories, is included. Prior to 2013, we omitted Medical Laboratories,
as these laboratories are health care services related, providing services to the medical delivery and
patient care system, rather than the biopharma research development and manufacturing industry. We now
acknowledge that Medical Laboratories are closely connected to the biopharma industry, requiring similar
capacity and skills found in the biopharma industry. MassBio also tracks employment for “green
biotechnology” classifications: 325199. 325221, 311222, and 311223. However, the QCEW does not reveal
employment data for these categories beyond minimum ranges, so this data is not included in the
employment figures presented in this Snapshot nor is it factored in comparisons with other states.
What’s in a Number?
35

What is considered “medical device” employment?
Using the North American Industry Classification System (NAICS), with which QCEW data is reported,
MassBio has determined that several NAICS classifications can be considered part of the medical device
industry. The following NAICS codes are utilized:
NAICS 3391: Medical Equipment and Supplies Manufacturing (100%)
NAICS 334510: Electromedical Apparatus Manufacturing (100%)
NAICS 334517: Irradiation Apparatus Manufacturing (100%)
What’s in a Number?
36

Questions?
As the premier source of information on life sciences in
Massachusetts, MassBio tracks industry statistics over time
and issues an overview Industry Snapshot each year.
For more information, contact:
Jessica Roche
Director of Communications @ MassBio
617-674-5146
37
Recommended