Rhode Island
Wildlife
Action Plan
Chapter 3
Threats to Rhode Island’s SGCN and Key
Habitats

CHAPTER 3: THREATS TO RHODE ISLAND’S SGCN AND KEY HABITATS
Chapter 3 - i
Chapter 3: Table of Contents
Introduction ................................................................................................................................................. 1
Threats in the Northeast Region ............................................................................................................... 1
Identifying Threats to Species of Greatest Conservation Need and Key Habitats in RI ..................... 3
Residential and Commercial Development ........................................................................................... 6
Invasive Species .................................................................................................................................... 14
Climate Change and Severe Weather .................................................................................................. 19
Vulnerability of Rhode Island Habitats to Climate Change .......................................................... 22
Highly Vulnerable Habitats ............................................................................................................... 23
Vulnerable Habitats ........................................................................................................................... 25
Less Vulnerable Habitats ................................................................................................................. 27
Ecological Land Units ....................................................................................................................... 27
Natural System Modifications .............................................................................................................. 30
Pollution .................................................................................................................................................. 32
Additional Threats to Species of Greatest Conservation Need and Species Groups ....................... 36
Biological Resource Use ....................................................................................................................... 37
Human Intrusion and Disturbance ....................................................................................................... 37
Wildlife Diseases .................................................................................................................................... 37
New Energy Developments ................................................................................................................... 38
Lack of Information, Planning and Outreach ...................................................................................... 39
Threats to Plants .................................................................................................................................... 39
Citations and Sources .............................................................................................................................. 40

CHAPTER 3: THREATS TO RHODE ISLAND’S SGCN AND KEY HABITATS
Chapter 3 - ii
Chapter 3: List of Figures
Figure 3-1. General Species Threats and Total Ranked Score .................................................................... 4
Figure 3-2. Aerial Photographs from 2008 and 2011 Showing the Development of a “Big Box” Complex (Dowling Village) in the Town of North Smithfield, RI ............................. 7
Figure 3-3. Rhode Island Prime Farmland Soil Loss by Development ......................................................... 8
Figure 3-4. Aerial Photograph from 1988 of a Portion of the Westerly Moraine ........................................... 9
Figure 3-5. Aerial Photograph from 2008 of a Portion of the Westerly Moraine ......................................... 10
Figure 3-6. Projected Future Land Use in Rhode Island 2025 ................................................................... 11
Figure 3-7. Conserved Land in Rhode Island ............................................................................................. 13
Figure 3-8. Frequency of Invasive Plants in Surveyed Rhode Island Emergent Marshes ......................... 14
Figure 3-9. Distribution of Aquatic Invasive Species in Rhode Island Freshwaters Based on Surveys Performed 2007-2012 .......................................................... 16
Figure 3-10. Map of Calf Pasture Point Area in North Kingstown, Rhode Island Showing Marsh Migration Patterns Based on Projected Sea Level Rise ....... 21
Figure 3-11. View of Twin Ponds in Narragansett, RI ................................................................................. 24
Figure 3-12. Dominant Ecological Land Units ............................................................................................. 28
Figure 3-13. Ecological Land Units Diversity .............................................................................................. 29
Figure 3-14. Aerial View of Kingston Pine Barrens in South Kingston in 1981 .......................................... 31
Figure 3-15. Aerial view of the Kingston Pine Barrens, South Kingstown in 2011 ..................................... 31
Figure 3-16. Locations of 281 Wetlands Assessed by the RI Wetlands Monitoring and Assessment Program 2006-2011............................................. 34
Chapter 3: List of Tables
Table 3-1. Key Threats Identified by Northeastern States in Their Wildlife Action Plans ............................. 2
Table 3-2. General Threats and Percent of SGCN Affected......................................................................... 5
Table 3-3. Key Threats to Rhode Island Key Habitats .................................................................................. 5
Table 3-4. Population Growth Rates in Rhode Island Municipalities 2000 – 2010 ....................................... 6
Table 3-5. Total Miles of Public Roads in Rhode Island ............................................................................... 9
Table 3-6. Key Habitats in Rhode Island Negatively Impacted by Invasive Species with Representative Species of Greatest Conservation Need ......................................................... 17
Table 3-7. Vulnerability of Key Rhode Island Habitats to the Impacts of Climate Change Determined by the Wildlife Action Plan Habitat Technical Team.............................................. 23
Table 3-8. Losses and gains in Rhode Island salt marsh habitat predicted by SLAMM modeling for three Sea Level Rise Scenarios. ....................................................... 24
Table 3-9. Types of Stressors within the 500’ Buffers of 245 Assessed Wetlands .................................... 33
Table 3-10. Prevalence of In-Wetland Stresses in 164 Assessed Wetlands .............................................. 34

CHAPTER 3: THREATS TO RHODE ISLAND’S SGCN AND KEY HABITATS
Chapter 3 - 1
Introduction
Rhode Island’s SGCN and their key habitats face numerous problems or threats that may adversely affect
them and compromise their status in the state. Some of these threats are global or national in scale, while
others may be regional, statewide, or local. Identifying the threats to Rhode Island’s SGCN and key
habitats is an important component in developing effective conservation actions for this SWAP. Once
identified, threats can be addressed through actions that RI DEM DFW and its partners have developed
throughout this SWAP process, and implemented for long-term conservation of SGCN and key habitats
as resources and opportunities allow. The previous two chapters identified Rhode Island’s SGCN
(Element 1) and key habitats (Element 2); this chapter addresses the threats affecting these important
conservation targets (Element 3).
SWAPs are required to identify the “problems which may adversely affect species of conservation need
and their habitats.” These “problems” include threats that stress wildlife species and habitats, as well as
management challenges such as deficiencies in data or resources for particular species or habitats. Human
activities and natural processes that affect wildlife species and habitats in negative or detrimental ways
are threats, while the effects of these threats on particular wildlife species or habitats are known as stress
responses or stressors. Threats may be species-specific, affecting a species by a direct action or through
indirect impacts by limitation of a particular habitat condition, or limiting factor. Although terms are often
used interchangeably, the word “threat” is used in this document as an umbrella term referring to all
aspects of the process by which human actions or natural events may jeopardize fish and wildlife species
and their habitats. This RI WAP uses the IUCN categories of threats (Salafsky et al. 2008) to describe and
present them in a consistent way, as recommended by the Northeast Lexicon and Synthesis (Crisfield and
NEFWDTC 2013; Terwilliger and NEFWDTC 2013).
All species have likely been impacted by human activities. Some have taken advantage of the conditions
found in developed areas; alien and invasive species such as European Starling, Rock Pigeon, Tree-of-
heaven, and many others have thrived. A few native species have found a surrogate habitat in urban areas
as natural habitats have diminished. Some examples of these opportunists in Rhode Island include the
Common Nighthawk, Chimney Swift, and Peregrine Falcon. The majority of Rhode Island’s wildlife
populations are vulnerable to multiple threats associated with human activities, and the SGCN list
identifies the most vulnerable. Following this chapter (Chapter 4), threats are targeted and addressed by
the actions to implement long-term conservation of SGCN and key habitats.
Threats in the Northeast Region
There is no comprehensive assessment of threats across the northeastern region. However, numerous
threats to fish, wildlife, and their habitats have been identified by the northeastern states as part of their
individual SWAPs. After the completion of the 2005 CWCSs, a survey was conducted to identify
common threats listed by states (AFWA 2011) and the predominant threats are listed in Table 3-1 in
descending order. The 13 northeastern states and the District of Columbia identified 37 common,
recurring threats to SGCN or their habitats (AFWA unpublished and 2011). The most frequently
mentioned threats included invasive species (mentioned by 100% of northeastern states) and industrial
effluents (pollution); commercial and industrial areas; housing and urban development; and agricultural
and forestry effluents (all of which were mentioned by at least 83% of northeastern states). Other
important challenges mentioned by 50% or more of the northeastern states included: dams and water

CHAPTER 3: THREATS TO RHODE ISLAND’S SGCN AND KEY HABITATS
Chapter 3 - 2
management; habitat shifting and alteration; recreational activities; roads and railroads; storms and
flooding; temperature extremes; logging and wood harvesting; problematic native species; harvest or
collection of animals; lack of information or data gaps; and droughts. In addition to the specific threats
mentioned in the 2005 CWCSs, recent work by the northeastern states has emphasized the importance of
additional, emerging threats such as climate change, exurban developments, new invasive species, and
disease. The following table fails to convey the fact that climate change can exacerbate other threats, as
previously discussed in Chapter 1 within taxonomic group discussions. A few examples of exacerbated
effects from climate change: heavier rains are more effective at transporting nutrients and pollutants to
water bodies than light rains (negatively impacting water quality), heavy rains cause worse erosion, and
invasives thrive in warmer temperatures (M. Staudinger, NECSC pers. comm. 2015).
Table 3-1. Key Threats Identified by Northeastern States in Their Wildlife Action Plans
Key Threats Identified by Northeastern States in their Wildlife Action Plans (in descending order of listing recurrences)
Invasive & Other Problematic Species & Genes: Invasive non-native/alien species
Pollution: Household sewage & urban waste water
Pollution: Industrial & military effluents
Pollution: Agricultural & forestry effluents
Residential & Commercial Development: Housing & urban areas
Residential & Commercial Development: Commercial & industrial areas
Human Intrusions & Disturbance: Recreational activities
Natural System Modifications: Dams & water management/use
Climate Change & Severe Weather: Habitat shifting & alteration
Climate Change & Severe Weather: Storms & flooding
Climate Change & Severe Weather: Temperature extremes
Barriers/Needs: Lack of biological information/data gaps
Climate Change & Severe Weather: Droughts
Transportation & Service Corridors: Roads & railroads
Biological Resource Use: Harvesting/collecting terrestrial animals
Biological Resource Use: Logging & wood harvesting
Natural System Modifications: Other ecosystem modifications
Invasive & Other Problematic Species & Genes: Problematic native species
Biological Resource Use: Harvesting aquatic resources
Pollution: Air-borne pollutants
Barriers/Needs: Natural Resource Barriers: Low population levels, insufficient habitat requirements,
etc.
Pollution: Garbage & solid waste
Agriculture & Aquaculture: Wood & pulp plantations
Pollution: Excess energy

CHAPTER 3: THREATS TO RHODE ISLAND’S SGCN AND KEY HABITATS
Chapter 3 - 3
Key Threats Identified by Northeastern States in their Wildlife Action Plans (in descending order of listing recurrences)
Barriers/Needs: Lack of capacity/funding for conservation actions
Barriers/Needs: Lack of education/outreach with public and other stakeholders
Natural System Modifications: Fire & fire suppression
Agriculture & Aquaculture: Non-timber crops
Residential & Commercial Development: Tourism & recreation areas
Barriers/Needs: Lack of monitoring capacity/infrastructure
Barriers/Needs: Lack of capacity/infrastructure for data management
Barriers/Needs: Administrative/political barriers
Transportation & Service Corridors: Shipping lanes
Biological Resource Use: Gathering terrestrial plants
Energy Production & Mining: Renewable energy
Energy Production & Mining: Mining & quarrying
To provide consistency in identifying threats to SGCN and key habitats, the IUCN standard lexicon of
threats (and actions, described in Chapter 4) was adopted for use in SWAPs (Salafsky et al. 2008).
“Threats” are defined as, “the proximate human activities or processes that have caused, are causing, or
may cause the destruction, degradation, and/or impairment of biodiversity targets.” The RI WAP
technical committees applied this lexicon when identifying the specific threats to Rhode Island SGCN and
key habitats, the results of which are outlined in Table 3-2 and 3-3.
Identifying Threats to Species of Greatest Conservation Need and Key Habitats in RI
The IUCN threat classification system was also used in RI to report threats at the state level, the taxa
level, the habitat level and the species level. The Northeast Lexicon was used to assess degree of threat.
The RI WAP Technical and Scientific Teams reviewed and reevaluated the threats listed in the 2005
CWCS as well as additional updated threat information according to these standardized protocols.
Climate change and emerging diseases are examples of threats where more updated information was
incorporated into the threats determination, assessment and ranking process.
Over 100 existing conservation programs and plans were identified through a literature search and were
used as a foundation from which to develop the list of threats in this chapter, the WAP, its Profiles and
the companion document. Key citations are listed at the end of this chapter on threats to SGCN and their
habitats, and additional threats were compiled from current local, state and regional, national and
international conservation plans listed in Appendix 1a. Appendix 3 represents threat classification system
used by the many partners to identify and rank threats for the RI WAP.
Through a series of workshops, teams of experts, partners and stakeholders identified and ranked the 2005
and additional updated information on threats to SGCN. Teams then grouped and condensed these threats,
where similar, for species suites, habitat associations, or broader taxa applicability. A similar process was
conducted for identifying and updating threats to each key habitat. Habitat threats were also grouped and

CHAPTER 3: THREATS TO RHODE ISLAND’S SGCN AND KEY HABITATS
Chapter 3 - 4
condensed to higher tier habitat groupings whenever possible to reduce redundancy and highlight
common threats. Table 2-3 presented the best available assessment (by the Technical and Habitat Teams)
of degree of threat to each key habitat and its relative condition.
To highlight the link from threats and actions, priority actions presented in this document are linked to the
threat addressed. Threats are coupled with actions and are listed for each hierarchical level (from general
statewide to specific species) in Chapter 4, and are listed in Appendix 4 and the species and habitat
profiles. Appendix 3 outlines threats at the statewide, taxa, and habitat levels.
The following tables and figures depict the key threats identified to Rhode Island fish and wildlife. Figure
3-1 depicts the ranked threats to the SGCN. The ranking for this table was produced using a rank
coefficient for each threat and the number of times that the threat is given for each of these. Should a
threat be listed first (revealing a rank of 1), the Rank Coefficient if 10; should a threat be listed second
(revealing a rank of 2), the Rank Coefficient is 3.1623, should a threat be listed third (revealing a rank of
3) the Rank Coefficient is 1.7783, and so on with an exponential decrease (decrease by square root) in
Rank Coefficient, with a place of seventh the Rank Coefficient is only 1.0366. The purpose of this simple
method is to give greater weight to initial levels, focusing on making the primary level the priority. Table
3-2 depicts the threats to SGCN taxa and Table 3-3 depicts the threats to Rhode Island’s key habitats.
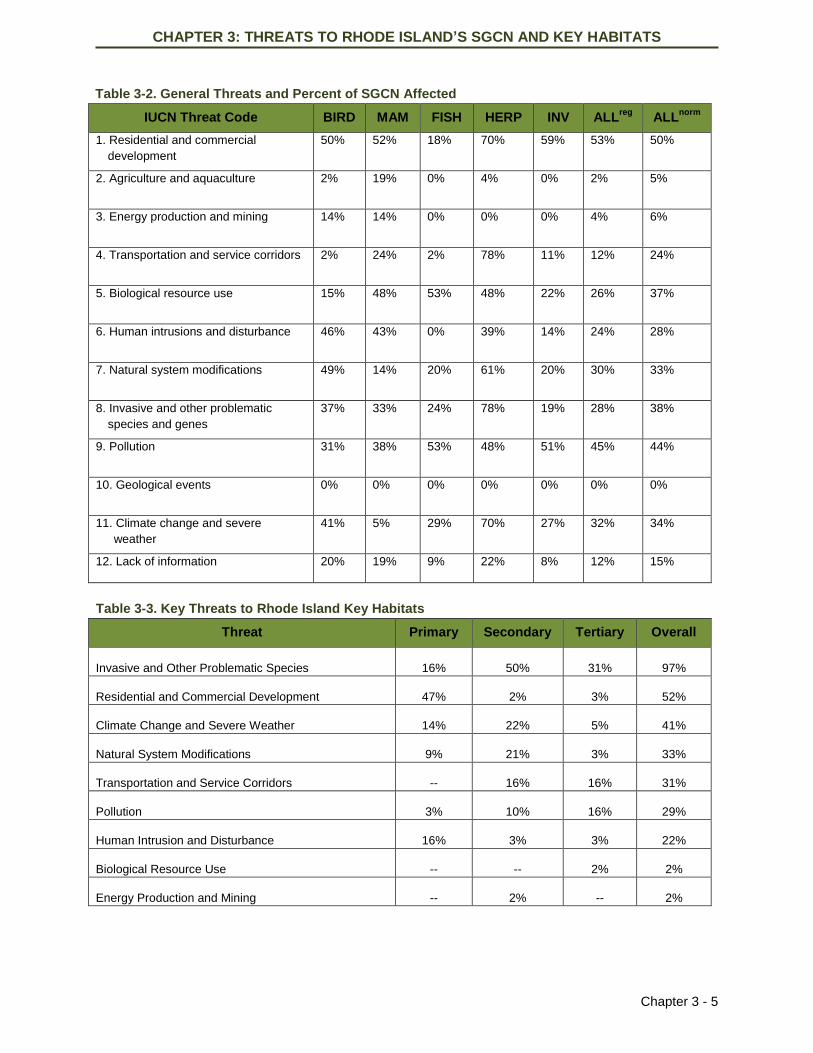
It is clear that residential and commercial development pose the greatest threat overall to SGCN. Natural
systems modifications, pollution, biological resource use, and invasive species are other top threats to
species. In comparison, invasive species are listed as a top threat to Rhode Island’s key habitats followed
by pollution and development.
Figure 3-1 General Species Threats and Total Ranked Score
CHAPTER 3: THREATS TO RHODE ISLAND’S SGCN AND KEY HABITATS
Chapter 3 - 5
Table 3-2. General Threats and Percent of SGCN Affected
IUCN Threat Code BIRD MAM FISH HERP INV ALLreg
ALLnorm
1. Residential and commercial
development
50% 52% 18% 70% 59% 53% 50%
2. Agriculture and aquaculture 2% 19% 0% 4% 0% 2% 5%
3. Energy production and mining 14% 14% 0% 0% 0% 4% 6%
4. Transportation and service corridors 2% 24% 2% 78% 11% 12% 24%
5. Biological resource use 15% 48% 53% 48% 22% 26% 37%
6. Human intrusions and disturbance 46% 43% 0% 39% 14% 24% 28%
7. Natural system modifications 49% 14% 20% 61% 20% 30% 33%
8. Invasive and other problematic
species and genes
37% 33% 24% 78% 19% 28% 38%
9. Pollution 31% 38% 53% 48% 51% 45% 44%
10. Geological events 0% 0% 0% 0% 0% 0% 0%
11. Climate change and severe
weather
41% 5% 29% 70% 27% 32% 34%
12. Lack of information 20% 19% 9% 22% 8% 12% 15%
Table 3-3. Key Threats to Rhode Island Key Habitats
Threat Primary Secondary Tertiary Overall
Invasive and Other Problematic Species 16% 50% 31% 97%
Residential and Commercial Development 47% 2% 3% 52%
Climate Change and Severe Weather 14% 22% 5% 41%
Natural System Modifications 9% 21% 3% 33%
Transportation and Service Corridors -- 16% 16% 31%
Pollution 3% 10% 16% 29%
Human Intrusion and Disturbance 16% 3% 3% 22%
Biological Resource Use -- -- 2% 2%
Energy Production and Mining -- 2% -- 2%

CHAPTER 3: THREATS TO RHODE ISLAND’S SGCN AND KEY HABITATS
Chapter 3 - 6
Residential and Commercial Development
A primary threat to Rhode Island’s fish, wildlife, and their habitats is conversion of land by human
development for housing, urban areas, commercial, industrial, and recreational uses. Since its
colonization 400 years ago, southern New England continues to be one of the most densely populated
regions in the country. Rhode Island is the second most densely populated state, with 1,052,567 residents
(US Census 2010) occupying roughly 1,045 square miles. This figure is only about 0.4% higher than the
population reported in the 2000 Census, and is the lowest rate of population growth of the New England
states, which averaged 3.8% for the region (US Census 2010).
Although Rhode Island’s population has not grown appreciably there has been a continuing trend of
population declines in cities and towns within the urbanized corridor, and population increases in rural
communities (Table 3-4). For example, the town of West Greenwich, one of the more rural communities
in the western part of the state, experienced the highest growth rate at 20.6%, an increase of
approximately 1,050 new residents. The town of South Kingstown added more than 2,700 new residents
for a growth rate of 9.7% (US Census 2010). Increases in rural populations tend to be accompanied by a
rise in new homes. For example, in West Greenwich during the seven year period of 2006-2012 there was
a 23% increase in the number of housing units.
Table 3-4. Population Growth Rates in Rhode Island Municipalities 2000 – 2010
Urban Communities* Suburban Communities Rural Communities
City/Town GR City/Town GR City/Town GR
Providence +2.5 Cumberland +5.2 W. Greenwich +20.6
Central Falls +2.4 Smithfield +4.0 N. Smithfield +12.7
Cranston +1.4 Bristol +2.2 S. Kingstown +9.7
N. Providence - 1.0 Johnston +2.0 Foster +7.8
W. Warwick - 1.3 E. Greenwich +1.5 Richmond +6.7
Pawtucket - 2.5 Portsmouth +1.4 Exeter +6.3
E. Providence - 3.4 Lincoln +1.0 Hopkinton +4.5
Warwick - 3.7 N. Kingstown +0.6 Block Island +4.1
Woonsocket - 4.7 Westerly - 0.8 Coventry +4.0
Newport - 6.8 Barrington - 3.0 Tiverton +3.4
Narragansett - 3.0 Burrillville +1.0
Jamestown - 3.9 Scituate 0
Warren - 6.6 Charlestown - 0.4
Middletown - 6.8 Glocester - 2.0
Lit. Compton - 2.8
Overall GR - 0.8 Overall GR +0.3 Overall GR +5.2
Source: US Census, GR=Growth Rate
* Communities assigned to Urban, Suburban, and Rural categories based on designations provided by
GrowSmart RI (2000).
Commercial and industrial development inevitably accompanies housing, and recent trends in commercial
development have been spacious “big box” developments, superstores, shopping villages, and regional
distribution facilities that consume large acreages of habitat.
Increases in residential and commercial development in rural areas accounts for much of the reported
losses in wildlife habitat and other natural resources. The 2008 forest survey of Rhode Island conducted
CHAPTER 3: THREATS TO RHODE ISLAND’S SGCN AND KEY HABITATS
Chapter 3 - 7
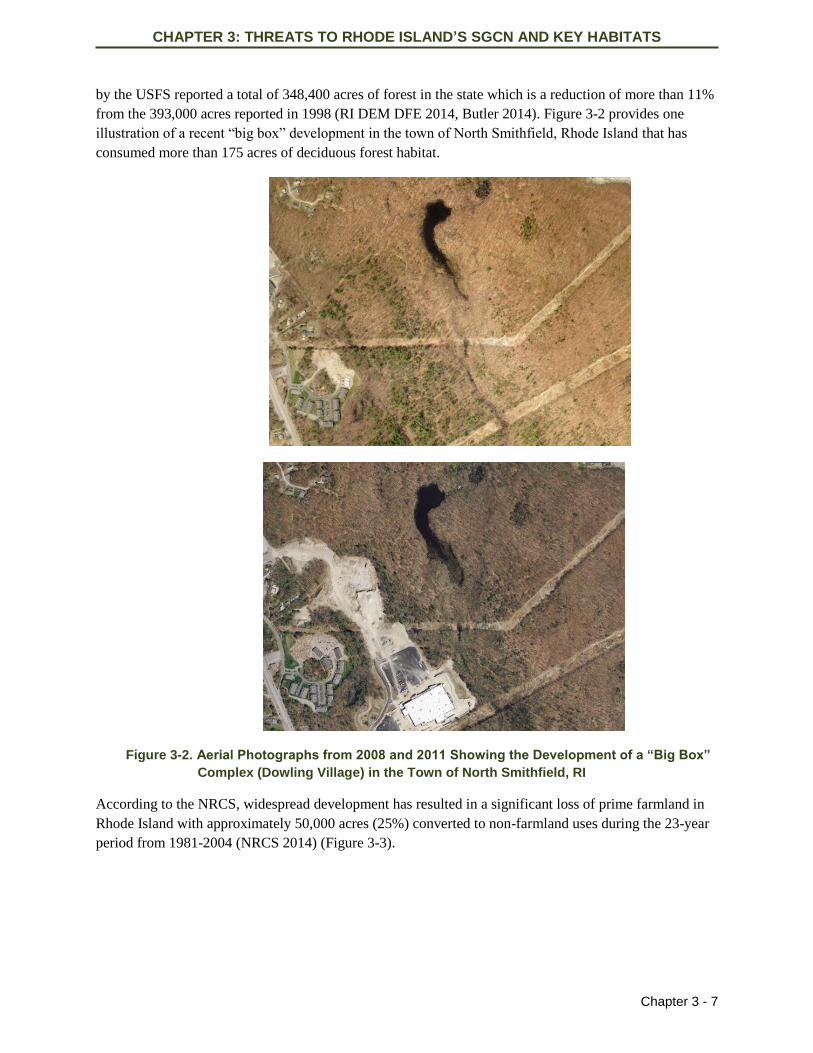
by the USFS reported a total of 348,400 acres of forest in the state which is a reduction of more than 11%
from the 393,000 acres reported in 1998 (RI DEM DFE 2014, Butler 2014). Figure 3-2 provides one
illustration of a recent “big box” development in the town of North Smithfield, Rhode Island that has
consumed more than 175 acres of deciduous forest habitat.
Figure 3-2. Aerial Photographs from 2008 and 2011 Showing the Development of a “Big Box”
Complex (Dowling Village) in the Town of North Smithfield, RI
According to the NRCS, widespread development has resulted in a significant loss of prime farmland in
Rhode Island with approximately 50,000 acres (25%) converted to non-farmland uses during the 23-year
period from 1981-2004 (NRCS 2014) (Figure 3-3).

CHAPTER 3: THREATS TO RHODE ISLAND’S SGCN AND KEY HABITATS
Chapter 3 - 8
Figure 3-3. Rhode Island Prime Farmland Soil Loss by Development. Source: NRCS 2014

CHAPTER 3: THREATS TO RHODE ISLAND’S SGCN AND KEY HABITATS
Chapter 3 - 9
Transportation infrastructure that accompanies development compounds impacts by further fragmenting
habitats and interrupting wildlife travel corridors to breeding, spawning, and wintering habitats. Table 3-5
provides an indication of the increase in miles of public roads in Rhode Island.
Results of the Geospatial Condition Analyses (Anderson et al. 2013) shed additional light on the extent of
these threats in the Northeast. In general, high density development of natural habitats can change local
hydrology, increase recreation pressure, introduce invasive species either by design or by accident with
the introduction of vehicles, and bring significant disturbance to the area. Urbanization and forest
fragmentation are inextricably linked to the effects of climate change, because the dispersal and migration
of forest plants and animals are disrupted by development and roads.
Fragmentation subdivides large contiguous areas of natural land into smaller patches, resulting in each
patch having more edge habitat and less interior. Because edge habitat contrasts strongly with interior the
surrounding edge habitat tends to isolate the interior region and contribute to its degradation. Thus
fragmentation can lead to an overall deterioration of ecological quality and integrity, and a shift in
associated species from interior specialists to edge generalists.
Table 3-5. Total Miles of Public Roads in Rhode Island. Source: US DOT 2013
Road Type 1995 2000 2012
Urban 4572 4720 5256
Rural 1321 1333 1224*
Total 5893 6053 6480
* 2012 figure for rural roads reflects a reclassification of previously designated “rural” areas to “urban” areas, rather than a
decline in the number of rural road miles.
In Figure 3-4, Westerly Airport is at the top, the Atlantic Ocean on the bottom. The 1988 photo clearly
shows the complex of vernal ponds in this area, with housing development beginning to encroach from
the west.
Figure 3-4. Aerial Photograph from 1988 of a Portion of the Westerly Moraine
The 2008 photo (Figure 3-5) shows the amount of development that occurred in 20 years and how the
ponds have been isolated and amphibian movement corridors compromised.

CHAPTER 3: THREATS TO RHODE ISLAND’S SGCN AND KEY HABITATS
Chapter 3 - 10
Figure 3-5. Aerial Photograph from 2008 of a Portion of the Westerly Moraine
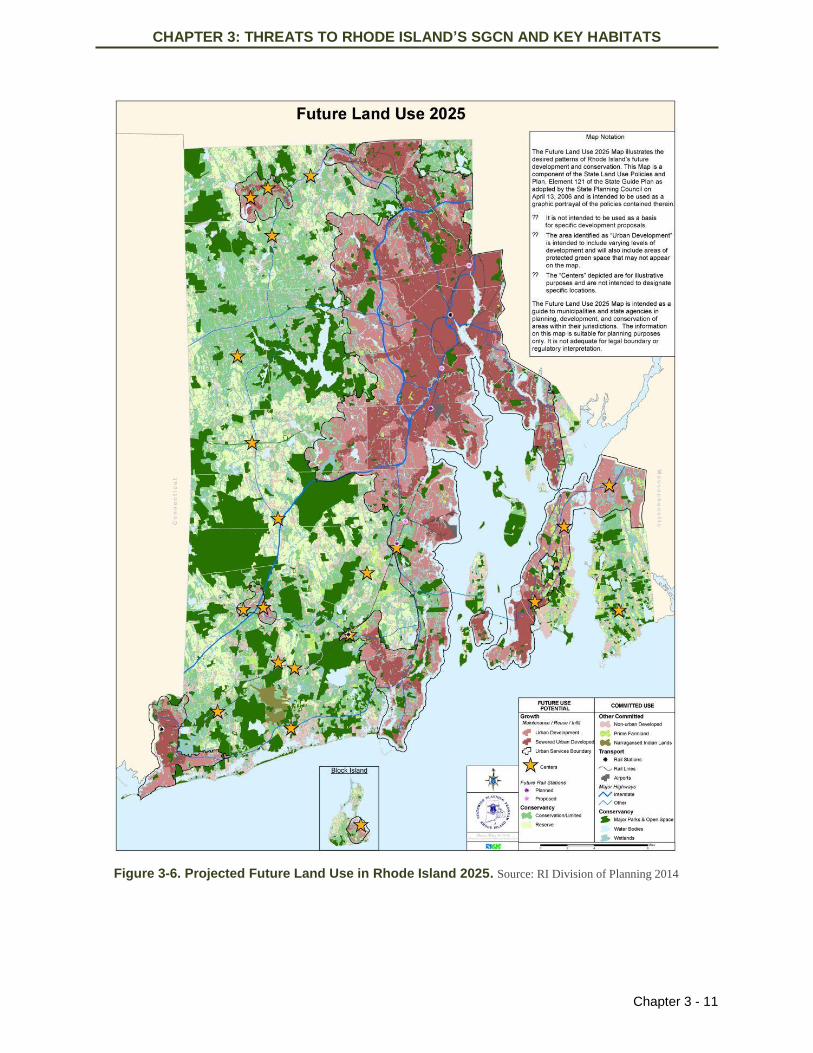
Development patterns in Rhode Island have been described in the single word, “sprawl.” Grow Smart
Rhode Island (2000) described sprawl as, land development trends and patterns that are more wasteful,
impact larger amounts of natural resources, require redundant capital investments (public facilities and
infrastructures), and impact considerable human resources requiring longer commute distances. In
recognition of this development pattern, the Rhode Island Division of Planning has published Land Use
2025 State Land Use Policies and Plan as the major State Guide Plan for conservation and development
in the 21st Century. This plan envisions Rhode Island as a constellation of community centers connected
by infrastructure corridors and framed by greenspace (see Figure 3-6).
Coordination with ongoing planning efforts will be important. This includes RhodeMap RI, a coordinated
effort by the state intended to make Rhode Island a better place to live and work by mobilizing state and
community assets in a new way. RhodeMap RI, offers a possibility to strengthen the economy, meet
current and future housing needs, and plan for future growth through the development of an integrated
plan that will also include strategies for transportation, land use, and environmental protection.
RhodeMap RI is funded with a Sustainable Communities Initiative Grant, one of several offered through
the Federal Partnership for Sustainable Communities, a collaboration of the U.S. Department of Housing
and Urban Development, EPA, and the U.S. Department of Transportation (US DOT). The Sustainable
Communities Regional Planning Grant Program supports metropolitan and multi-jurisdictional planning
efforts that integrate housing, land use, economic and workforce development, transportation, and
infrastructure investments in a manner that empowers jurisdictions to consider the interdependent
challenges of: (1) economic competitiveness and revitalization; (2) social equity, inclusion, and access to
opportunity; (3) energy use and climate change; and, (4) public health and environmental impact. For
more information about RhodeMap RI, see: http://rhodemapri.org/.
CHAPTER 3: THREATS TO RHODE ISLAND’S SGCN AND KEY HABITATS
Chapter 3 - 11
Figure 3-6. Projected Future Land Use in Rhode Island 2025. Source: RI Division of Planning 2014

CHAPTER 3: THREATS TO RHODE ISLAND’S SGCN AND KEY HABITATS
Chapter 3 - 12
The RI DEM Land Conservation Program, operating through the Division of Planning and Development
(DPD), works to preserve the state’s natural areas, to guarantee their permanent protection, and to ensure
proper management of land having high intrinsic resource value. With an emphasis on the following
critical elements - working farms, forests, drinking water protection, recreation, and natural
heritage/biodiversity - RI DEM works to ensure that these resources remain available for future
generations. The Program prioritizes parcels of land whose resource value, size, location, and relationship
to existing conservation land make them significant to the state’s welfare.
RIDEM’s DPD manages and supports statewide land conservation programs, coordinates land
conservation activities with other state, federal and non-profit programs, and works to preserve land
consistent with state plans and state regulations. The DPD conducts land protection in Rhode Island
through three programs. The State Land Conservation Program is administered by the RI DEM Land
Acquisition Committee (LAC), which makes recommendations regarding real estate transactions that will
enhance RI DEM’s Management Areas, Parks, and Forest Lands. Funding for these real estate
acquisitions is provided by State Open Space bonds, with contributions from municipalities and land
trusts, from local partners such as The Nature Conservancy and the Champlin Foundations, and from
various federal programs including the USFS Forest Legacy program, USFWS, NOAA, Federal Highway
Administration, and the National Park Service’s (NPS’s) Land and Water Conservation Fund (LWCF). In
addition, this program combines its funding with the Local Open Space Grants Program and the
Agricultural Land Preservation Program to complement its conservation projects.
The Local Open Space Grant Program supports cities and towns, land trusts, and non-profit organizations
in their protection and acquisition of natural areas that are deemed priorities at the municipal level. This
critical partnership works to leverage funds from municipal, non-profit, and federal agencies for the
protection of Rhode Island’s resources with RI DEM providing up to 50% funding to successful
applicants and adding a layer of protection to the conserved parcels to ensure they remain undeveloped in
perpetuity. All grant applications are reviewed and scored by the Rhode Island Natural Heritage
Preservation Commission Advisory Committee according to the following criteria: habitat protection,
presence of rare species and communities, greenway or regional linkage, planning consistency, resource
protection, water resource protection, and multi-community partnerships. Final awards are determined by
the Natural Heritage Commission with the State’s share of funding provided by State Open Space Bonds.
The Agricultural Land Preservation Program, which is administered by the Agricultural Land
Preservation Commission (ALPC) and staffed by RI DEM, preserves agricultural lands through the
purchase of farmland development rights (PDR) which enables farmers to retain ownership of their
property while protecting their lands for agricultural use. At the same time, it provides farmers with a
financially competitive alternative to development and helps to ensure that farming remains viable in the
state. Applications for PDR are reviewed and scored by the ALPC according to parcel size; soil quality;
agricultural operation and viability; protection of water supplies and quality; open space, cultural and
scenic features; flood protection; relative development pressure; and consistency with state and local
plans. Funding for this program is obtained through Open Space Bonds, The Nature Conservancy, the
Champlin Foundations, the USDA Farm and Ranch Lands Protection Program, and through the
leveraging of land trust and municipal funds.
During the 10-year period of 2002-2012, funding provided through these three land conservation
programs protected 15,502 acres with a land value of $171.5 million, and 73% of this value provided by

CHAPTER 3: THREATS TO RHODE ISLAND’S SGCN AND KEY HABITATS
Chapter 3 - 13
federal and local contributions. When added to land already protected, more than 20% of the state has
been preserved as open space, for recreation, and for agricultural use (Figure 3-7) (RI DEM DPD 2012).
RI DEM announced a new Open Space Grants totaling $5 million, with funding provided from the 2008
and 2012 Open Space Bond Authorizations. Moreover, an additional Clean Water, Open Space and
Healthy Communities bond included on the November 2014 ballot was passed (RI DEM press release,
March 11, 2014).
Figure 3-7. Conserved Land in Rhode Island. Source RI GIS 2014

CHAPTER 3: THREATS TO RHODE ISLAND’S SGCN AND KEY HABITATS
Chapter 3 - 14
Invasive and Other Problematic Species
The spread of exotic invasive species poses a significant threat to SGCN throughout the Northeast.
Invasive species go by many names – exotics, aliens, pests, or weeds, but all are introduced, non-
indigenous organisms that can aggressively usurp populations of native species and devastate natural
habitats. With NEAFWA funding through the RCN Grant Program, Klopfer (2012) identified 238
invasive species from 12 groups with a potential to adversely affect SGCN, while at the same time
acknowledging that this is not a complete list of invasive species for the Northeast. The majority of
species identified are plants (68%), and the majority of these (58%) occurred in seven or more states.
There were 71 (30%) invasive species common to all states in the Northeast. The habitat identified with
the greatest number of invasive species was classed as “forest edge” with 115 species (48%), followed by
pasture and grassland with 94 and 86 species respectively (39% and 36%).
The RI WAP Habitat Technical Committee has determined that nearly all (97%) of the key habitats in
Rhode Island are threatened by invasive species. Focusing on freshwater wetland habitats, the RI DEM
OWR and the RINHS (2014) concluded that invasive species were present in 48% of all surveyed
wetlands (n = 281) and 60% of wetlands excluding the relatively undisturbed vernal pools and cedar
swamps, bogs and fens. In particular, open emergent marshes were found to be vulnerable to the spread of
invasive species with 90% of surveyed sites impacted, especially by plants such as Common Reed
(Phragmites australis), European Bittersweet (Celastrus orbiculatus), and Purple Loosestrife (Lythrum
salicaria) (Figure 3-8; RI DEM OWR and RINHS 2014)
Figure 3-8. Frequency of Invasive Plants in Surveyed Rhode Island
Emergent Marshes. Source: DEM OWR and RINHS 2014

CHAPTER 3: THREATS TO RHODE ISLAND’S SGCN AND KEY HABITATS
Chapter 3 - 15
In 2007, the RI DEM OWR Surface Water Monitoring Program began to survey Rhode Island's
freshwater rivers and lakes to map the statewide distribution of Aquatic Invasive Species (AIS) (Figure 3-
9). Monitoring allows RI DEM personnel to determine the presence and location of the species in Rhode
Island and to track their spread. RI DEM uses this information to prioritize where to direct future
monitoring efforts in order to detect new invasions, and to inform stakeholders about infestations in their
lakes and the surrounding watershed.
RI DEM coordinated with the Coastal Resources Management Council (CRMC) and other partners to
form the Rhode Island AIS Working Group in 2007. The group grew out of the process of developing the
Rhode Island AIS Management Plan, which outlines recommended actions for managing invasives and
provides a framework for coordinating state and federal management efforts. The AIS Working Group,
co-chaired by RI DEM and CRMC, facilitates the implementation of the Rhode Island AIS Management
Plan which was approved by the federal Aquatic Nuisance Task Force in November 2007. A copy of the
plan is available at: http://www.anstaskforce.gov/State%20Plans/RI_SMP_Draft.pdf.
K.
Pro
ft
Phragmites invading tidewaters

CHAPTER 3: THREATS TO RHODE ISLAND’S SGCN AND KEY HABITATS
Chapter 3 - 16
Figure 3-9. Distribution of Aquatic Invasive Species in Rhode Island Freshwaters Based on Surveys
Performed 2007-2012. Source RI DEM OWR 2013 AIS refers to invasive plant species present in
floating and submergent plant communities
Several aquatic invasive animals have also been documented in Rhode Island waters. Although aquatic
invasive animals are often harder to find than large invasive plant populations, invasive animals can have
devastating effects on freshwater ecosystems. Most invasive animals are small and larvae or adults can be
transported in bilge water, bait buckets, or attached to boats. Others are used as live bait with extras
discarded into the water, and some species intentionally stocked. Regardless of the means of introduction,
the spread of invasive animals constitutes a serious threat facing river and lake habitats. Ecologically,
aquatic invasive animals may cause the local extirpation of native aquatic species, degrade habitats, alter
food webs, and degrade water quality. Moreover, aquatic invasive animals may reduce the numbers of
sport fish by competing for food and destroying habitats, and invasive shellfish can foul boats and motors.
Currently, two important aquatic invasive animals species found in Rhode Island to date include the Asian

CHAPTER 3: THREATS TO RHODE ISLAND’S SGCN AND KEY HABITATS
Chapter 3 - 17
Clam and several species of carp. The Zebra Clam which is a particularly damaging species has yet to be
found in Rhode Island (RI DEM OWR 2013).
In 2010, a cooperative effort between the Rhode Island CRMC and the URI Outreach Center developed
the Invasive Plant Management Certification Program (IPMCP) to train green industry professionals and
other interested individuals working in the coastal zone to provide sustainable invasive plant management
services to clients, and to facilitate restoration of degraded coastal habitats. Professionals completing a
two-day certification training program are recognized as Coastal Invasives Managers by the CRMC. For
more information about this program refer to: http://www.uri.edu/cels/ceoc/LR_IPMCP.html.
The marine environment is not immune to the incidence of invasive species as many alien plants and
animals are transported to Rhode Island estuaries in the ballast of container ships and other vessels. In
2000, CRMC, the Narragansett Bay Estuary Program, and others, organized the first surveys of marine
aquatic invasive species in the state. Marine aquatic invaders that have become established in Rhode
Island include the European Green Crab (Carcinus maenas), Asian Shore Crab (Hemigrapsus
sanguineus), Lace Bryozoan (Membranipora membranacea), Codium (Codium fragile), the Red
Macroalgae (Grateloupia turuturu), and various species of sea squirts and shellfish pathogens (CRMC
2014).
Most SGCN are indirectly impacted by the spread of invasive plants. The changes most evident in an
invaded community are declines in native plant diversity and a consequent restructuring of the community
that in many situations can negatively alter habitats of SGCN. However, some invasions may be
considered beneficial, such as the patches of primarily invasive shrubs in old fields near the coast that
serve as habitat for early successional species and migratory songbirds. Table 3-6 identifies key habitats
most impacted by invasive species in Rhode Island.
Table 3-6. Key Habitats in Rhode Island Negatively Impacted by Invasive Species with
Representative Species of Greatest Conservation Need
Key Habitat Invasive species SGCN
Beaches, beach strand, dunes Japanese Sand Sedge Tiger beetles, Piping Plover
Coastal shrublands Multiflora Rose, Autumn Olive,
European Bittersweet
Early successional birds
Ruderal forest Many trees and shrubs Migratory birds
Pasture (selective grazing) Woody shrubs; Black
Swallowwort
Grassland birds
Emergent marsh, wet meadow Purple Loosestrife, Phragmites Marsh Wren, rails
Salt/brackish marsh Phragmites Saltmarsh Sparrow, rails
Impoundment Phragmites, Purple Loosestrife,
aquatic invasives
Waterfowl
Graminoid fen, sea level fen Phragmites Dragonflies
Coastal salt pond Phragmites Marsh birds
Lakes and ponds Water Chestnut, other aquatic
plants
Forests Woody shrubs, Japanese Stilt
Grass, many others
Forest interior birds
Source: WAP Habitat Team
The proliferation of invasive plants is principally abetted by anthropogenic disturbances. While
disturbance is a normal part of natural ecosystem dynamics, in many systems the alteration of disturbance
regimes and the introduction of novel disturbances produce increased opportunities for invasion (Hobbs
2000). The fragmentation of forest habitats by residential development and land management practices

CHAPTER 3: THREATS TO RHODE ISLAND’S SGCN AND KEY HABITATS
Chapter 3 - 18
create patches of disturbed land and opportunities for invasion, and the linear openings formed by roads
and utility rights-of-way serve as the pathways for spread of invasives. Invasive woody shrubs (e.g.,
Multiflora Rose, Autumn Olive, and European Bittersweet) typically appear in forest openings because
they produce abundant fruit and seeds carried long distances by birds. Other species produce abundant
seeds or propagate by root fragments that are transported on vehicle tires or the soles of hiking shoes.
Woody shrubs are also typical invaders in grassland habitats, especially old fields where mowing and
other management mechanisms have been curtailed. In pastures, invasive shrubs with abundant thorns
(e.g., Japanese Barberry and Multiflora Rose) are mostly avoided by grazing animals and may eventually
overrun some fields. The USFWS has identified invasive shrubs as a major concern on several Rhode
Island wildlife refuges and has conducted periodic burning and other control measures to restore invaded
habitats to benefit grassland birds (USFWS 2013).
Palustrine and estuarine wetlands are highly vulnerable to the spread of invasive species that take
advantage of situations where these habitats have been altered by filling, dredging, increased
sedimentation, and other flood and tide control operations. Maritime beaches and dune systems have
typically not been habitats favored by invasive plants as these dynamic habitats are normally sparsely
vegetated by the relatively few plants capable of withstanding the extreme conditions. However, an
exception is the appearance of Japanese Sand Sedge (Carex kobomugi) at several Rhode Island beaches
(Enser 2006). This invasive plant crowds out native plants, creating densely vegetated patches that can
limit available habitat for some listed animals. In the mid-Atlantic there have been documented impacts
on federally listed species, including Piping Plover and Northeastern Beach Tiger Beetle (Wootten 2006).
There is also concern that Japanese Sand Sedge may change beach profiles, making dunes lower because
the plant is smaller and cannot catch as much sand as larger native plants. Lowering of dunes could
significantly impact the ability of these barriers to ameliorate storm surge (Wootten 2006).
In 2009, RINHS, in close partnership with the RI DEM, was awarded a $673,000 grant through the USFS
to establish the Forest Health Works Project (FHWP). The primary purpose of this grant was to control
non-native invasive plants that threatened priority forests in Rhode Island by training “green industry”
professionals such as landscapers and arborists. Other aspects of forest health were incorporated into the
project, including wildlife management, native plant propagation and marketing, recreational use, and
environmental education (Barnes 2012). Intensive field work resulted in the most comprehensive
inventory of invasive plants ever conducted in Rhode Island, and most likely southern New England.
Efforts were concentrated in the western part of the state, based on stakeholder input and innovative GIS
analysis. As a result, a total of 2,228 acres of invasive plants were mapped and over 166 acres treated for
invasives across 41 sites. In addition, a pilot Rhode Island Youth Conservation League (YCL) project was
run under the auspices of FHWP in which deer exclosures were built to demonstrate over time the
relationship between invasives, deer, and forest health (Barnes 2012).
The final report (Barnes 2012) offered the following recommendations for continuing efforts to reduce the
threat of invasive species in Rhode Island:
1. Reconvene the Rhode Island Invasive Species Council which has been defunct since 2005 due to
lack of funding. In its absence there has not been a clear set of statewide policies for invasive
species.

CHAPTER 3: THREATS TO RHODE ISLAND’S SGCN AND KEY HABITATS
Chapter 3 - 19
2. Develop closer coordination between conservation organizations on invasives and forest health
because in a period of declining financial resources, but increasing environmental challenges,
cooperation and partnership between stakeholders (inter- and intra-state) is critical for success.
3. Dedicate resources to follow-up treatment on FHWP-treated sites and others across the state
because invasive plant control is a long-term management activity that requires follow-up.
4. Monitor and manage deer to improve forest health as deer densities have surpassed levels for
sustainable forest regeneration in many areas of the state, which promotes many invasive plants,
Lyme disease, and other issues.
5. Permanently establish the Rhode Island YCL to meet three goals: cost-effective natural area
maintenance, environmental opportunities for youth in a state that has few, and improved public
image of conservation.
6. Expand and promote Rhody Native which has proven to be a great potential as a unique
conservation agency/nursery industry partnership and should be prioritized in plant restoration
and consumer outreach efforts.
7. Continue Green Industry Workforce Development to train a cohort of landscapers, arborists,
nurserymen and others.
8. Analyze the FHWP GIS dataset which has generated an extremely comprehensive geodatabase
which should be used for research and management purposes.
Although not invasive, under various circumstances native species may become overabundant and
problematic. White-tailed Deer are overabundant in much of the U.S. due to a lack of natural predators,
an increase in human altered, and fragmented landscapes, and changing social values about hunting. In
suburban areas, where landscaping provides excellent forage for deer and hunting is not allowed, growth
of the herd is unimpeded. Unmanaged deer populations can lead to over population and potentially
threaten native species and habitats (Tefft 2011).
Recognizing the detrimental impacts of an overabundant deer population, the RI DEM DFW reviewed
and revised its deer management strategy in 2010. A new approach was based on an analysis of habitat,
deer harvest demographics, and deer-auto collision data. The resulting town-by-town profile of harvest
versus road kill enabled a logical division of deer management zones to begin the process of reducing
deer overabundance and increasing sustainability (Tefft 2011).
Climate Change and Severe Weather
The changing climate is now recognized as a potential major threat to fish and wildlife habitats,
populations, and communities. Indeed, there is evidence that climate change may already be affecting
ecosystems as distributions of animals and plants change, ecological phenologies are disrupted, and
community compositions and structures are altered. Species and populations likely to have greater
vulnerabilities to climate change include those with highly specialized habitat requirements, native
species already near temperature limits or having other narrow environmental tolerances, currently
isolated, rare, or declining populations with poor dispersal abilities, and groups especially sensitive to
pathogens. Species with these traits will be even more vulnerable if they have a small population, a low
reproductive rate, long generation times, low genetic diversity, or are threatened by other factors
(NFWPCAP 2014).
The Intergovernmental Panel on Climate Change (IPCC) defines vulnerability as three distinct
components: 1) exposure: magnitude and rate of climate change a resource is likely to experience, 2)

CHAPTER 3: THREATS TO RHODE ISLAND’S SGCN AND KEY HABITATS
Chapter 3 - 20
sensitivity: characteristics that mediate tolerance to climate change of a particular resource, and 3)
adaptive capacity: the inherent ability of the target to moderate the impacts of climate change (IPCC
2007, Glick et al. 2011). The Northeast Climate Science Center (NECSC) is currently developing a
synthesis of regional information on Climate Change (USGS in progress; http://necsc.umass.edu/). Once
developed this will be applied over the next decade through implementation of the 2015 RI WAP.
Climate modeling analyses for the northeastern region of the U.S. have projected major changes over the
rest of this century, although the magnitudes of these changes are likely to vary spatially across the
region. Using recent modeling studies the Manomet Center for Conservation Sciences (MCCS) projected
the following changes in the climate of the Northeast by 2070-2099 (NWF and MCCS 2014).
The annual average air temperature across the region will increase by 2-5 °C (3.6- 9.0 °F)
depending on the emissions scenario.
The annual average temperature increase will have seasonal and geographical components,
being greatest in the winter months and at higher latitudes.
An annual increase in precipitation levels by about 7-15%, most falling as rain during the
winter months, with longer dry streaks between events (particularly in the summer).
The number of extreme heat days per year (>50 °C, 90 °F) will increase from the current 10
to 20-40 days depending on the emissions scenario.
The length of the plant growing season (days between last and first killing frosts) will extend
by 30-50 days, depending on the emissions scenario, and the plant hardiness zones will
advance north.
Soil moisture content (percent saturation) may decrease, particularly during the summer
months (by about 1-2%), due to longer dry streaks between precipitation events.
Winter and spring floods of shorter duration but higher intensity and more frequent.
Ice formation occurring later in the year and melting earlier and many lower elevation lakes
and rivers might no longer have sustained ice cover.
Accelerating rising sea levels are another manifestation of the changing climate. Under rising global
temperatures, sea water is undergoing spatial expansion, and ice caps and glaciers are melting and
contributing to rising sea levels. Sea level rise (SLR) poses significant threats to coastal ecosystems that
may become inundated, resulting in habitat changes and losses, and adverse impacts to species or
communities that depend on these habitats. Indeed, it is generally considered by climate scientists that
coastal ecological resources are likely to be among the most vulnerable to the changing climate, and that
the climate change impacts to ecosystems over the next few decades will be most marked in the coastal
zones (Frumhoff et al. 2007; Karl et al. 2009, IPCC 2007).
Future SLR projections have evolved over the last decade. One estimate (IPCC 2007) was that global
mean sea level would rise over the course of this century by between 18 and 59 centimeters (cm),
depending on the emissions scenario. However, more recent studies that include measurements of Arctic
and Antarctic ice melt have produced larger SLR estimates between 0.5 meter (m) and 2.0 m., depending
on the emissions scenario. Furthermore, storms are likely to become more destructive in the future as SLR
contributes to higher storm surges and erosion (Anthes et al. 2006). Tebaldi et al. (2012) projected future
change in frequency of today’s 100-year flooding event through the year 2050 and estimated return

CHAPTER 3: THREATS TO RHODE ISLAND’S SGCN AND KEY HABITATS
Chapter 3 - 21
frequencies of every 5 years for Portland, ME, a 30-year return frequency for Boston, MA and a 10-year
return frequency for Providence, RI.
Recently, a cooperative effort between The Nature Conservancy, Rhode Island Sea Grant, URI, Rhode
Island Coastal Resources Center, and CRMC have applied SLAMM modeling to project the likely paths
for salt marsh migration in Rhode Island coastal communities due to SLR. A pilot project (Ruddock
2011) was conducted in the town of North Kingstown and an example of the mapping derived for this
community is shown in Figure 3-10. Mapping for all Rhode Island coastal communities has recently been
completed and can be viewed at: http://www.crmc.ri.gov/maps/maps_slamm.html.
The newest modeling tools go beyond the abilities of SLAMM models and are starting to be able to
estimate coastline's dynamic versus static response to SLR. Dr. Robert Thieler and colleagues at USGS
(Nathaniel Plant and Dean Gesch) and Columbia University (Radley Horton), recently completed their
study evaluating sea-level rise impacts in the northeastern U.S. The project developed a new method to
distinguish coastal areas in the northeastern U.S. (Virginia-Maine) that will likely experience a
predominantly inundation (e.g., flooding) response to sea-level rise (SLR) from those that will likely
respond dynamically by moving or changing (e.g., landforms such as barrier islands and marshes). They
found that areas likely to inundate include urban regions of intense development and/or coastal
engineering, as well as bedrock coasts. Alternatively, areas likely to respond dynamically include
beaches, unconsolidated cliffs, barrier islands, and wetlands (M. Staudinger, NECSC pers. comm. 2015).
https://necsc.umass.edu/projects/research-and-decision-support-framework-evaluate-sea-level-rise-
impacts-northeastern-us
Figure 3-10. Map of Calf Pasture Point Area in North Kingstown, Rhode Island Showing
Marsh Migration Patterns Based on Projected Sea Level Rise. Source: Ruddock 2011
The projected changes posed by climate change and SLR pose significant threats to SGCN and key
habitats. Given many uncertainties, from the amount of global warming to the impacts on ecosystems, it
is difficult to determine how individual species will respond. For example, we are certain that it is
CHAPTER 3: THREATS TO RHODE ISLAND’S SGCN AND KEY HABITATS
Chapter 3 - 22
warming, but less so about how much, and for planners this means that it is important to prepare for full
range of scenarios instead of some mean value. There are a variety of vulnerability assessments that have
been conducted to better understand the magnitude of these threats. All of these studies include some
combination of specifying likely climate impacts, estimating exposure to these impacts, and accounting
for non-climate stressors.
Examples of non-climate stressors include invertebrate pests, over-abundant White-tailed Deer, pollution,
land use change, and invasive exotic plants that may already be threatening some communities. While
climate change may increasingly exert adverse effects on these habitats, the current stressors will also
continue to be important, conceivably more important as these interactions may exacerbate the impacts of
the changing climate. The most obvious examples concern the “beneficial” effects that climate change
may have on the life cycles of pest species. There is already evidence that some forest pests are benefiting
from a warming climate, for example Hemlock Wooly Adelgid has spread north and impacted hemlock
stands that were previously not vulnerable to this temperature-limited pest (NFWPCAP 2014).
Understanding ecological vulnerabilities provides valuable information that may be used to better inform
existing decision processes and may also suggest new policies or adaptation strategies to reduce future
impacts. Several studies have been reviewed to develop an assessment of the vulnerability of Rhode
Island SGCN and key habitats. These include an assessment of the likely impacts of climate change on
Northeast habitats and SGCN conducted through a collaborative effort of the NEAFWA, MCCS, and the
National Wildlife Federation (NWF; NWF and MCCS 2014), and a series of assessments previously
conducted by MCCS for the Massachusetts Division of Fish and Wildlife (MADFW; MCCS and
MADFW 2010).
Vulnerability of Rhode Island Habitats to Climate Change
Table 3-7 provides a summary of the vulnerability of key Rhode Island habitats to the impacts of climate
change as determined by the SWAP Habitat Technical Team. The habitats of highest vulnerability are
estuarine wetlands and other coastal habitats, primarily due to the combined impacts of SLR and increases
in storm frequency and intensity. Much of Rhode Island’s coastline is recognized as being of ecological
and conservation importance and is protected in local, state, and federal reserves. This protection mosaic
has successfully conserved important populations of plants and animals and their habitats. Many of the
reserves are recognized as “showcase” sites that demonstrate that ecological resources can be conserved
despite growing human pressures. However, this reserve system was established during a time when the
challenge of climate change and resulting shifting coastlines and habitats was not fully appreciated. As a
result of climate change, the boundaries of reserve systems may not continue to contain the environmental
features to support the fish and wildlife for which they were originally designed to offer protection.
It is also important for local conservation organizations, such as land trusts and watershed associations, to
consider the impacts of a changing climate. A 2013 report prepared by Rhode Island Sea Grant and
Coastal Resources Center (Rubinoff et al. 2013), as a pilot study for the South Kingstown Land Trust,
outlined a five-step approach for assessing vulnerability and monitoring both adaptation actions and
habitat changes. These changes create a new set of challenges and opportunities that have the potential to
greatly affect the conservation strategies of land trusts and other conservation organizations. For example,
preserved forest areas should be relatively large to function effectively as resilient reserves, and some
larger organizations or partnerships of various groups are capable of assembling such acquisitions.

CHAPTER 3: THREATS TO RHODE ISLAND’S SGCN AND KEY HABITATS
Chapter 3 - 23
Critical habitats ─ areas in which targeted species can persist and/or relocate over time may provide a
refuge from climate change impacts and become high-priority candidates for acquisition and enhanced
conservation efforts. Land trusts involved with agricultural operations can promote innovative pest
management, monitoring, irrigation methods, and other farming practices designed to address climate
change. Research can be conducted to identify structurally diverse and species-rich habitats as well as
important movement corridors. Monitoring for new invasive plants, insects and other pests may be
implemented. Cool water streams and cold water fish habitat can be incorporated into a land trust’s or
watershed association’s buffer strategy in order to conserve connected water bodies and protect vegetative
canopies over streams to help reduce impacts of warming temperatures. Local conservation groups have
the ability and knowledge to take the lead in habitat and buffer restoration utilizing diverse native species,
thereby increasing the resiliency of habitats to the stresses of climate change and shifting environmental
condition.
Table 3-7. Vulnerability of Key Rhode Island Habitats to the Impacts of Climate Change
Determined by the Wildlife Action Plan Habitat Technical Team
Degree of Vulnerability Habitat Type
Highly Vulnerable Brackish marshes
Tidal flats
Vulnerable
Maritime beaches/dunes
Northern hardwood forests
Hemlock forests
Cold water streams
Cold water ponds
Shrub swamps/wet meadows
Emergent marshes
Vernal pools
Hardwood (Red Maple) swamps
Atlantic White Cedar swamps
Floodplain forests
Salt marshes
Less Vulnerable
Pitch Pine woodlands/barrens
Oak-Pine forests
Warm water rivers and ponds
Highly Vulnerable Habitats
Brackish Marshes, Tidal Flats and Salt Marshes
SLAMM modeling conducted at several coastal Massachusetts USFWS wildlife refuges has determined
that the habitat types likely to suffer the greatest reductions in extent under most SLR scenarios are
brackish marsh and tidal flats, with likely reductions in area on the order of 50%-99% (NWF and MCCS
2014). In contrast, the extent of salt marsh and estuarine open water is projected to increase greatly at
each of these two sites. These results can be explained by postulating that as sea level rises land that is
currently intertidal will become subtidal (hence, the increase in open water and loss of tidal flats), while
salt marsh will extend further up gradient as the inundation and salinity changes, at the expense of the
brackish marshes, which it will replace (NWF and MCCS 2014). A projected global rise of only 0.39m
(the most optimistic of current estimates) is sufficient to result in major habitat changes, particularly
losses in brackish marsh and tidal flats and gains in salt marsh. These changes generally become more
marked as the SLR scenario is increased.

CHAPTER 3: THREATS TO RHODE ISLAND’S SGCN AND KEY HABITATS
Chapter 3 - 24
The recently completed SLAMM modeling in Rhode Island (Boyd and Rubinoff 2014) is projecting
significant changes in the extent of salt marsh, depending on the SLR scenario applied. As shown in
Table 3-8, the acreage of salt marsh is predicted to increase initially with the inland migration of this
habitat type, at the expense of brackish marshes and tidal flats, as was shown in the Massachusetts
SLAMM modeling cited above. However, the opportunities for salt marsh migration begin to lessen with
further increases in sea level, with a net loss of this habitat type of more than 1000 acres predicted under
the 5-foot SLR scenario (Boyd and Rubinoff 2014). There are also indications that sea level rise could
result in a conversion of salt marsh to open water where rising sea level rapidly alters marsh drainage
patterns and the rate of sea level rise outpaces marsh accretion rates.
Table 3-8. Losses and gains in Rhode Island salt marsh habitat predicted by SLAMM modeling
for three Sea Level Rise Scenarios.
Sea Level Rise Scenarios
1-foot SLR 3-foot SLR 5-foot SLR
Salt Marsh Losses 450 acres 1895 acres 3189 acres
Salt Marsh Gains 1057 acres 1148 acres 2151 acres
Net Loss/Gain + 607 acres - 747 acres - 1038 acres
Source: CRMC 2014
In addition, there are predicted to be sizable losses in the extent of freshwater marsh along the coast as
these wetlands are inundated by salt water. Under the three scenarios (1, 3, and 5-foot SLR) there is
projected to be losses of 204, 635, and 1059 acres of freshwater marsh respectfully.
Freshwater tidal marshes, the rarest subtype, will likely be completely lost as estuaries move upstream
and salinity increases, and because there is a lack of suitable adjoining areas to accommodate upland
migration. Reduction in extent and complexity of these highly productive interfaces between land and
water will have impacts on ecological function (e.g., storm buffering, flood storage, fish nurseries, and
water filtering) and biodiversity within the state. An example of the impact of SLR on habitats is shown
in Figure 3-11.
Figure 3-11. View of Twin Ponds in Narragansett, RI
These ponds include large portions of brackish emergent marsh dominated by cattails. Rising sea level
and increased storms will likely breach the barriers of these ponds converting them to salt marsh.

CHAPTER 3: THREATS TO RHODE ISLAND’S SGCN AND KEY HABITATS
Chapter 3 - 25
Vulnerable Habitats
Maritime Beaches/Beach Strand
Sims (2012) modeled the consequences of SLR over the next 100 years for Piping Plover nesting habitat
in Rhode Island focusing on five mainland beaches that are currently used by the birds as breeding sites.
The SLR predictions used in the study were increases of 0.5, 1.0 and 1.5m, and three future scenarios
were modeled. First, that rapid SLR would disrupt the inland migration of the sites (the “stationary
model”); second, that the pace of SLR would allow the inland migration of the coastal system (the
“migration without development model”); and third, that the pace of SLR would allow the inland
migration of the sites but that current development would prevent that to some extent (the “migration with
development model”). The model was based on one previously developed by Seavey et al. (2011) for
barrier islands in New York.
Under the stationary model the area of habitat available to Piping Plovers would decrease by different
extents at all five sites and the amount of reduction would be a function of the degree of SLR, with
greater SLR resulting in more habitat loss. Without considering current development as a blockage to
habitat migration all sites showed large increases in beach habitat, and four of them continued to show an
increase at the 1.5m SLR scenario. If, however, current development blocks beach migration the results
were mixed, with three sites continuing to show habitat increases even at the 1.5m SLR scenario and the
other two sites showing habitat decreases or little change at the higher SLR scenarios.
Results from the Sims (2012) and Seavey et al. (2011) analyses suggest that the implications of SLR for
nesting habitat of Piping Plovers in the Northeast may be complicated. The studies agree that if sites or
habitats are constrained in their ability to move inland or upslope the result is likely to be habitat loss, and
the losses will increase with increasing SLR. However, if the sites or habitats are able to migrate under
SLR, then new habitat would be created and the total area of Piping Plover nesting habitat might be
expanded (this assumption is based on there being enough sand in the system). However, if more intense
or frequent coastal storms and surges accompany SLR, nesting habitat could be significantly reduced.
Palustrine Wetlands
Freshwater wetlands (emergent marshes, shrub swamps, wet meadows, vernal pools, hardwood and
coniferous swamps) are likely to be affected by climate change similarly due to changes in hydrology.
Although modeling suggests that under both the lower and higher emissions scenarios precipitation levels
in the Northeast will increase by about 10%, much of this increase will occur during winter months, with
more precipitation falling as rain than snow and reduced snowpack that leads to changes in spring
seasonal flows and floods. Summer months will be characterized by rising temperatures, greater
evapotranspiration rates, and little or no increase in precipitation or perhaps even precipitation reductions
(in terms of summer average amounts) due to more consecutive dry days. These circumstances would
lead to seasonal drying out of wetland soils and more protracted and severe droughts. Hayhoe et al.
(2007) project that, under the higher emissions scenario, summer droughts lasting 1-3 months in duration
may occur each year, rather than once every 2-3 years as at present, and that medium-term droughts
(lasting 3-6 months) will become more frequent. These changes will likely result in loss of wetland
habitat as upper areas dry out during the summer and the vegetation is eventually replaced by mesophytic
or xeric upland species. As such, marshes and swamps will contract inward toward currently deeper or
more reliable water sources, and smaller, less well-watered marshes could be entirely replaced by upland
vegetation. Larger marshes could become fragmented and reduced in area (MCCS and MADFW 2010).

CHAPTER 3: THREATS TO RHODE ISLAND’S SGCN AND KEY HABITATS
Chapter 3 - 26
An additional stressor in wetland communities will be the further spread of invasive plant species,
especially Purple Loosestrife and Phragmites, two species highly tolerant of seasonal soil drying and
drought – more so than most native species that have more restrictive hydrological requirements.
Seasonal drying of marsh soils and drought is likely to increase the competitive advantage of these
species and result in further loss of native habitat.
In general, emergent marshes are considered more vulnerable to climate change than other freshwater
wetlands because of their limited extent in the state. However, more widespread types (shrub swamps and
forested swamps) are similarly vulnerable to projected changes in hydrology. Shrub swamps could suffer
a net loss of habitat; however, in some areas the effect could be that the shrub swamp will contract inland
toward more saturated soils and areas where the water table is currently closer to the surface. If the shrub
swamps surround open water habitat or emergent marshes they could move inward, replacing those
habitats as the overall wetland dries. In such cases there may be relatively little shrub swamp habitat loss;
indeed, it is feasible that there could be a net gain (MCCS and MADFW 2010).
Forested swamps may also suffer a net loss due to changes in hydrology, and rising temperatures could be
accompanied by the increase in additional stressors such as increased risk of fire and insect attack. Due to
its apparent ability to exist in areas with markedly higher temperatures (e.g., Florida and the Gulf Coast),
it is unlikely that Atlantic White Cedar would be adversely affected by increasing temperature. Indeed, it
is possible that rising temperatures could be beneficial, but it is more likely that the most important
climatic factors that might affect the distribution of this habitat type will be those that have adverse
impacts on site hydrology (MCCS and MADFW 2010).
In dry, warm springs vernal pools may dry out earlier in the summer and amphibian breeding seasons may
become truncated, with resulting low productivity and possibly complete failure in many pools (Brooks et
al. 2004). Thus, the earlier drying out projected under climate change, particularly under the higher
emissions scenario could have adverse consequences for vernal pools, particularly smaller pools.
Cold Water Streams and Associated Riparian Zones
The limited distribution and quantity of these habitats in Rhode Island makes them particularly fragile and
susceptible to projected changes in climate. As air temperatures increase, the suitability of cold water
streams for critical species such as Brook Trout will decline. In many locations the critical water
temperature threshold is already being exceeded, particularly during the late summer months in shallow
reaches. This has important ramifications on the abundance of not only top predators like Brook Trout,
but also on many important aquatic organisms that support a dynamic food web within streams and
adjoining terrestrial ecosystems (MCCS and MADFW 2010).
Northern Hardwood Forests
Northern hardwood forests will likely be reduced through the attrition of several dominant trees due to
increase in average annual temperature. Sugar Maple is projected to retract its range northward, and
Eastern Hemlock will also be reduced because higher temperatures are more favorable to the spread of
Hemlock Wooly Adelgid. In addition, several herbaceous plants with northern affinities that typify the
understory layer of northern hardwood forests will likely be reduced and eventually eliminated from the
Rhode Island flora (MCCS and MADFW 2010).

CHAPTER 3: THREATS TO RHODE ISLAND’S SGCN AND KEY HABITATS
Chapter 3 - 27
Less Vulnerable Habitats
Upland forests
With the exception of the northern hardwood type, upland forests that typify much of the Rhode Island
landscape will likely be less affected by climate change. In fact, the overall oak-dominated types that
typify areas south of Rhode Island may benefit from a warming climate, with oaks expanding their range
to include areas currently occupied by northern hardwood forests (MCCS and MADFW 2010).
Pitch Pine occurs in significantly warmer climates to the south of Rhode Island in New Jersey and
Maryland. If the only determinant of its distribution were climate it would be likely that its distribution in
Rhode Island would expand under a warming climate; however, non-climatic factors, mainly the
distribution of sandy, nutrient-poor soils, fire frequency, and development are also important factors and
are likely to more important determinants in the future extent of Pitch Pine barrens (MCCS and MADFW
2010).
Ecological Land Units
A changing climate poses a significant challenge for conservationists: how can they protect habitats for
plants and animals when the composition of the ecological communities will be rapidly changing over the
next century. The identification and protection of ecological land units (ELUs) , a concept developed by
The Nature Conservancy, may help the conservation community assess the potential value of "the stage"
to ensure the maintenance of rich communities of native plants and animals as climate change effects
manifest themselves (Anderson et al. 2010). As explained by Mark Anderson, regional scientist for The
Nature Conservancy, it is difficult to protect the specific “actors” (i.e., the plants and animals) because we
do not know who they will be as climate change effects occur, but we can protect the “stage” (i.e., the
physical habitat) on which they will thrive. Landscapes with high biodiversity tend to be more resilient to
disturbances and are able to continue delivering important ecosystem services. Other criteria also inform
conservation decisions, such as the size and connectedness of protected lands and the mission and goals
of individual land trusts and conservation organizations, but the number and diversity of ELUs found in a
candidate site is an additional important factor to consider.
ELUs areas on the landscape with unique physical properties based on soil characteristics and
topography. ELUs provide an ecological setting for plant communities. Areas with many different ELUs
often have diverse plant and animal communities and show high levels of biodiversity. Therefore, ELUs
help identify landscapes that will support high future biodiversity as plant communities shift in response
to climate change. Many factors determine which species of plants and animals live in an area. For
animals, the variety and species of plants in an area are important components of “habitat.” For plants, the
physical properties of a site frequently determine the suitability of the area for supporting specific species.
Critical physical properties are elevation, slope, aspect, geology, soils, and hydrology; information that is
already available to conservationists and the general public through the RI GIS website. For example,
some species of plants such as Pitch Pine thrive in gravelly, well-drained soils, in dry landscapes whereas
other species, such as Red Maple, prefer moist, highly organic soils in poorly-drained locations. The land
use and disturbance history of a site are also very important and can, in some cases, be the most important
factors in determining the richness of biodiversity. This is particularly true when land use destroys
habitat, alters hydrology, or replaces natural vegetation with impervious surfaces.
Research by many scientists confirms that there is a strong positive relationship between the diversity of
physical characteristics on the landscape and the variety of plants that may be found in a particular

CHAPTER 3: THREATS TO RHODE ISLAND’S SGCN AND KEY HABITATS
Chapter 3 - 28
location. This relationship occurs at site-level scales (five acre study plots) and larger landscape scales
that may contain tens and hundreds of acres and even whole states (Anderson et al. 2010).
The relationship between physical diversity and ecological diversity has important relevance to the
conservation community – protected lands that are highly variable with respect to physical properties will
likely support diverse communities of plants and animals as the climate changes. Therefore, the
identification of areas on the landscape that are physically diverse may be important targets for
conservationists because they are likely to support high biodiversity in the future as climactic conditions
change. Figures 3-12 and 3-13 illustrate how ELUs have been defined and identified in Rhode Island and
the level of diversity among those ELUs (Rubinoff et al. 2013). More detailed information about ELUs
can be found on the ELU website hosted by the Environmental Data Center at URI. This interactive web
site contains maps, data, and on-line mapping tools for using ELUs in conservation planning:
www.edc.uri.edu/elu/.
Figure 3-12. Dominant Ecological Land Units. Source: Rubinoff et al. 2013

CHAPTER 3: THREATS TO RHODE ISLAND’S SGCN AND KEY HABITATS
Chapter 3 - 29
Figure 3-13. Ecological Land Units Diversity. Source: Rubinoff et al. 2013

CHAPTER 3: THREATS TO RHODE ISLAND’S SGCN AND KEY HABITATS
Chapter 3 - 30
Natural System Modifications
Natural system modifications are defined as threats from actions that convert or degrade habitat in service
of “managing” natural or seminatural systems, often to improve human welfare (Salafsky et al. 2008). In
general, identified modifications tend to be associated with natural disturbances that if allowed to occur
under normal frequencies and intensities could result in damage to property and/or loss of life; however,
management of natural disturbance often results in the minimization or elimination of processes essential
to the maintenance of natural communities.
One example of a natural system modification is the suppression of fire. Natural, lightning-caused fire is a
dominant force in the western and Midwestern portions of the U.S. that naturally perpetuates several
community types, most notably prairies and savannahs. However, in the Northeast and especially in
southern New England, lightning-strike fires are rare events. Instead, historical fire disturbance in this
region was primarily the result of Native Americans employing fire as a land management tool. Across
the region White-tailed Deer represent the most abundant faunal remains in archaeological sites, and
management of forest understory habitat and structure to promote larger deer populations was consistent
with the hunter-gatherer subsistence pattern that characterized Native American populations in the region
(Foster and Motzkin 2003). Although there is little evidence that fire was purposely used to generate
sizable areas of open habitat (Foster and Motzkin 2002) it is apparent that the selective burning employed
by Native Americans helped create and maintain fire-dependent habitats in southern New England,
especially Pitch Pine barrens.
Following European colonization and up to the mid-1900s the use of fire as a management tool was
abandoned because of the threat posed to human settlements; however, wild fires caused by accident or in
some cases by arson continued to maintain fire-dependent communities in some areas. For example,
Tucker (1979) documented the occurrence of fire in the Kingston Pine Barrens of Rhode Island, finding
that the area had severely burned twice in 1905 and 1910, and smaller portions had burned between 1930
and 1968, the year of the last recorded fire.
Lack of fire in Pitch Pine barrens results in succession of these communities with increase in hardwoods
and reduction in Scrub Oak understories that support the unique assemblage of plants and animals
characteristic of barrens habitats. Recognition of this consequence of fire suppression has spurred
conservation organizations and agencies throughout the Northeast to conduct controlled burns to manage
Pitch Pine barrens and other fire dependent habitats (Simmons 2006).
In Rhode Island the use of controlled burns to manage Pitch Pine barrens is complicated by the residential
development within and adjacent to these habitats. Figures 3-14 and 3-15 illustrate the level of
development that has taken place since 1981 at the Kingston Pine Barrens in South Kingston. At several
Pitch Pine sites in Rhode Island the selective cutting of trees has been employed as an alternative to fire
management in order to stimulate understory growth. However, many species of barrens’ plants and
animals depend on fire to reduce competition from fire-intolerant species or to stimulate a physiological
response, such as the high temperatures needed to release the seeds from Pitch Pine cones.

CHAPTER 3: THREATS TO RHODE ISLAND’S SGCN AND KEY HABITATS
Chapter 3 - 31
Figure 3-14. Aerial View of Kingston Pine Barrens in South Kingston in 1981. Source: RIGIS
2014
Figure 3-15. Aerial view of the Kingston Pine Barrens, South Kingstown in 2011. Source:
RIGIS 2014
The Pitch Pine dominated barrens appear as a broad band running southwest from the northeastern corner.
The comparison illustrates how residential development has inhibited the use of fire to maintain the Pitch
Pine community.
Another natural system modification identified as a threat to many wetland habitats is water management,
a broad category that includes dam construction, surface water diversion, withdrawals from surface and
groundwater sources, and other operations that alter water flow patterns from their natural range of
variation either deliberately or as a result of other activities.

CHAPTER 3: THREATS TO RHODE ISLAND’S SGCN AND KEY HABITATS
Chapter 3 - 32
As the birthplace of the American Industrial Revolution, Rhode Island has a long history of water
management. In 1789, Slater Mill on the Blackstone River was established, beginning an era that would
result in the formation of mill villages along all of the state’s major rivers and tributaries, each operation
constructing dams to guarantee a steady supply of water. In the 1900s larger dams were built to create
reservoirs of drinking water, culminating with the construction of a 3,200-foot dam to create the 5.3
square miles Scituate Reservoir that supplies water to nearly half the state’s population. Today, there are
43 reservoirs in Rhode Island that supply drinking water to about 75% of the state’s residents (RI DEM
OWR 2014) and 668 inventoried dams (RI DEM OCI 2012).
Of particular concern to fish and wildlife resources is the construction of dams on major rivers that has
prevented the migration of anadromous fish to inland breeding locations (see Chapter 1), and have also
impeded the inland flow of tidal waters resulting in the nearly total loss of the unique Freshwater Tidal
Marsh community described in Chapter 2.
A natural system modification that has been identified as a threat to forest ecosystems is management
conducted to retard natural succession. This circumstance is particularly relevant in Rhode Island where
nearly all of the original forest was historically removed. Although large portions of the original forest
had regenerated by the 1960s, tracts of forest have continued to be cut for timber, firewood, and wildlife
management purposes. Even in undisturbed forests it may take centuries for native forest plants to
recolonize former agricultural sites (Flinn and Velland 2005), but re-colonization is prevented from
occurring in areas where patches of trees are continually being removed. Moreover, the creation of forest
openings provides the disturbed conditions that benefit the spread and establishment of invasive species.
Pollution
Compared to other regions, the Northeast consists of some of the smallest geographically sized states and
highest population densities. The combination of large metropolitan areas, bustling towns, and thriving
industries generates significant amounts of waste in the form of household sewage, solid waste, and
industrial effluents. Pollutants from these sources impair key riparian, aquatic, and terrestrial habitats
throughout the region. Changes in water quality and quantity now pose serious threats to all northeastern
aquatic systems.
Climate change can exacerbate the impacts of other stressors, like pollution. Inputs of contaminators and
nutrients will increase with projected increases in precipitation and extreme events, effecting the health,
structure and function of downstream ecosystems including coastal areas. Rising temperatures are also
expected to increase methylation rates of mercury. It is also possible that increased temps will increase
the trophic transfer and biomagnification rates of some contaminants (Pinkney et al. 2015).
The Northeast is not only the most populated area of the country but its buildings and infrastructure
reflect its older character and often contain out-of-date septic and wastewater systems. Household
sewage, garbage, solid waste, storm run-off, and other types of urban waste generated by the many
northeastern cities and towns leach residual contaminants into ground waters and riparian areas. Garbage
and solid waste in particular are a major concern, and throughout the region many landfills are closing
and seeking ways to turn trash into energy.
Industries are generally located near populated areas with essential water and transport, so the problem of
industrial pollution is magnified in the densely populated Northeast, resulting in additional impairment of
aquatic and terrestrial habitat throughout the region. Storm water runoff further degrades water quality

CHAPTER 3: THREATS TO RHODE ISLAND’S SGCN AND KEY HABITATS
Chapter 3 - 33
through erosion, and the ever-increasing amount of impervious surfaces in drainage areas poses a major
threat to small streams and the aquatic communities they support. Roadway runoff, acid mine drainage,
siltation/sedimentation, and even acid deposition and mercury originating in the industrial Midwest, cause
soil chemistry degradation here.
Indications of the degree of potential sources of pollution to wetland habitats is provided by analyses
performed during the first six years of the Rhode Island Wetland Monitoring and Assessment program
(DEM OWR and RINHS 2014, Figure 3-16). The most common stressors within 500-foot buffers of 245
assessed wetlands were raised road beds and unsewered residential development (Table 3-9); and, the
most common in-wetland stressors for 164 assessed wetlands were anthropogenic fluvial inputs, and
filling and dumping (Table 3-10). Anthropogenic fluvial inputs included nutrients, sediments, toxins, and
salts.
Table 3-9. Types of Stressors within the 500’ Buffers of 245 Assessed Wetlands
All WAU Restoration
Units Vernal Pools
Cedar Swamps, Bogs and
Fens
Raised road beds 168 113 9 20 26
Unsewered residential
development 106 77 5 11 13
Footpaths / trails 95 69 1 16 9
Commercial or industrial
development 47 38 6 2 1
Row crops, turf, or nursery
plants 38 27 1 8 2
Sewered residential
development 36 26 3 5 2
Golf course / recreational
development 31 26 1 4 0
Other* 23 16 1 2 4
Orchards, hay fields or pasture 19 14 1 1 3
Channelized streams or
ditches 18 9 6 0 3
New construction 13 10 1 2 0
Sand and gravel operations 8 4 1 1 2
Landfill or waste disposal 3 1 2 0 0
Piers, docks or boat ramps 2 2 0 0 0
Poultry or livestock operations 1 0 0 1 0
Total 546 378 37 65 66
Source: DEM OWR and RINHS 2014
Wetland assessment units (WAU) defined on the basis of hydrologic discontinuity (n=146);
Restoration Units defined by the extent of restoration activities (n=10); Vernal Pools defined based on
vegetative community (n=36); and Cedar Swamps, Bogs and Fens defined based on vegetation
community (n=53).

CHAPTER 3: THREATS TO RHODE ISLAND’S SGCN AND KEY HABITATS
Chapter 3 - 34
Table 3-10. Prevalence of In-Wetland Stresses in 164 Assessed Wetlands
All WAU
Cedar Swamps,
Bogs, and Fens
Restoration Units
Anthropogenic fluvial inputs 107 76 21 10
Filling and dumping 99 79 12 8
Invasive species 94 76 8 10
Impoundment 73 54 17 2
Excavation and other substrate
disturbances 51 39 8 4
Draining or diversion of water 48 37 6 5
Vegetation and detritus removal 28 24 2 2
Total 500 385 74 41
Source: DEM OWR and RINHS 2014
Wetland Assessment Units (WAU, n=101) defined on the basis of hydrologic discontinuity; Restoration
Units (n=10) defined by the extent of restoration activities; and Cedar Swamps, Bogs and Fens (n=53)
defined based on vegetation community.
Figure 3-16. Locations of 281 Wetlands Assessed by the RI Wetlands
Monitoring and Assessment Program 2006-2011. Source DEM OWR and RINHS 2014
Trends in water quality and aquatic life of rivers and streams have been monitored through the
cooperative efforts of RI DEM, individual Watershed Councils, URI and other partners. Changes in water
quality have been well-documented, as important aquatic systems and habitats continue to degrade and
become unsuitable as fish and wildlife habitat. Three families of benthic macroinvertebrates,

CHAPTER 3: THREATS TO RHODE ISLAND’S SGCN AND KEY HABITATS
Chapter 3 - 35
Ephemeroptera (mayflies), Plecoptera (stoneflies), and Trichoptera (caddisflies), have been monitored as
indicators of water quality and degraded aquatic conditions. RI DEM routinely monitors and maps trends
in water quality, aquatic life support and sources of impairment for the state’s rivers, streams, lakes,
ponds, estuaries and marine waters (RI DEM 2006). The Wood River has served as a reference site for
detailed monitoring since 1993 (RI DEM 2006), and the Wood-Pawcatuck Watershed Association
(WPWA) conducts detailed monitoring of several stream reaches in the Pawcatuck River watershed
(Burgess 2002, Saila et al. 2004). RI DEM’s Narragansett Bay Estuary Program continues to identify
degraded aquatic habitats for restoration. The Environmental Data Center at URI also has a variety of
digital resources related to aquatic habitats such as aquifer protection, drainage basin, discharges, and
water quality classification maps: http://www.edc.uri.edu/riatlas/.
The Nature Conservancy has recently initiated an assessment of the streams and rivers throughout the
Lower New England / Northern Piedmont ecoregion, determining which are the most intact and
functional for each river and stream type. Assessment parameters include ecological land type (elevation,
geology, slope, etc.), fish species, road crossings, road density, developed land, natural cover, number of
dams, and other characteristics.
The EPA has also conducted a threats assessment – the Index of Watershed Indicators (IWIs) – on the
watersheds of North America (U.S. EPA 2002). Based on data obtained primarily in the 1990s and using
8-digit Hydrologic Unit Code (HUC) for watersheds, the IWIs assessed the health and threats to each
watershed for 18 or more indicators. Indicators include water quality parameters, the loss of wetlands,
urban and agricultural runoff potential, atmospheric deposition, contaminated sediments, and other
variables that affect the health of aquatic ecosystems. Table 3-4 highlights the threats assessment for the
four, 8-digit HUC watersheds in Rhode Island – Blackstone, Narragansett, Pawcatuck-Wood, and
Quinebaug. For their period of assessment (the late 1990s), all four watersheds were found to have less
serious water quality problems. The Narragansett watershed was the only one of the four found to have a
high vulnerability to problems threatening its aquatic ecosystem, with contaminated sediments, urban
runoff, ambient water quality indicators, hydrologic modification due to dams, and estuarine pollution
found to be significant problems (U.S. EPA 2002). This threats assessment is outdated, so it is unknown
whether these watershed characterizations and threat classifications are reflective of current conditions in
Rhode Island. An updated assessment of these aquatic indicators has been identified as a SWAP research
need in order to determine if the state’s watersheds are improving or degrading over time.
Pesticides by their nature, as substances that in many cases are designed to kill pests, can pose risks to
humans and the environment. The EPA works to reduce those risks in several ways. The Office of
Pesticide Program's Conventional Reduced Risk Pesticide Program expedites the review and regulatory
decision-making process of conventional pesticides that pose less risk to human health and the
environment than existing conventional alternatives. The goal of this program is to quickly register
commercially viable alternatives to riskier conventional pesticides such as neurotoxins, carcinogens,
reproductive and developmental toxicants, and groundwater contaminants.
EPA gives priority in its registration program for conventional chemical pesticides to pesticides that meet
reduced risk criteria including low-impact on human health, low toxicity to non-target organisms (birds,
fish, and plants), low potential for groundwater contamination, lower use rates, low pest resistance
potential, and compatibility with Integrated Pest Management (IPM).

CHAPTER 3: THREATS TO RHODE ISLAND’S SGCN AND KEY HABITATS
Chapter 3 - 36
Recently, a draft memorandum of understanding (MOU) was developed between the EPA Office of
Pesticide Programs (OPP) and the USFWS to protect migratory birds. The purpose of this MOU is to
promote the conservation of migratory bird populations through enhanced collaboration between EPA’s
OPP and USFWS on actions carried out by OPP. Migratory birds are an important component of
biological diversity, and as such, conserving them and their habitats supports ecological integrity,
contributes to public conservation education, and enhances the growing interest in outdoor recreation
opportunities (U.S. EPA 2014). For more information on this MOU between EPA and USFWS see:
http://www.epa.gov/oppfead1/cb/csb_page/updates/2014/birdtreaty.html.
Use of chemical pesticides for agricultural purposes has been partially curtailed in recent years with the
wider development of organic farms. Organic food is produced by farmers who emphasize the use of
renewable resources and the conservation of soil and water to enhance environmental quality for future
generations. Organic food is produced without using most conventional pesticides, fertilizers made with
synthetic ingredients, or sewage sludge, bioengineering or ionizing radiation. On organic farms, soil
fertility is maintained with compost, cover crops, rock mineral powders and other natural fertilizers. Pests
and diseases are controlled by crop rotation and biological control and by applying non-synthetic
materials. Weeds are managed by practices such as cultivation, mulches and flaming (NOFA 2014).
Farms may be certified “organic” by agents accredited by the USDA; in Rhode Island the RI DEM
Division of Agriculture has administered the state’s Organic Certification Program since 2002. In 2010,
26 farms in Rhode Island were certified organic.
Additional Threats to Species of Greatest Conservation Need and
Species Groups
In addition to the primary threats to key habitats identified by the SWAP Habitat Technical Team, the
individual taxa teams have identified threats that impact individual SGCN or groups of species.
In addition to the direct loss of habitat by conversion of land to residential and commercial development,
there are incidental impacts and causes of mortality to some species of wildlife that are associated with
development. For example, building collisions cause high bird mortality with a recent assessment by Loss
et al. (2014) estimating that between 365 and 988 million birds are killed by building collisions annually
in the U.S. A breakdown of these numbers indicates that roughly 56% of this mortality is at low-rise
buildings, 44% at residences, and <1% at high-rises. Moreover, it appears that several species are
disproportionately vulnerable to collisions at all building types, including Canada Warbler, Wood Thrush
and Worm-eating Warbler, three SGCN in Rhode Island (Loss et al. 2014).
Furthermore, it is estimated that free-ranging domestic cats are the single greatest source of anthropogenic
mortality for birds and mammals in the U.S. Findings by Loss et al. (2013) indicate that 1.3–4.0 billion
birds and 6.3–22.3 billion mammals are killed annually in the U.S., mostly by feral cats as opposed to
owned pets. The conservation strategy for the New England Cottontail has suggested that, although there
is little direct evidence regarding the role of domestic cats in influencing New England Cottontail
populations, given the high human population and housing densities throughout most of their range,
domestic cats may be important predators of this species (Fuller and Tur 2012).

CHAPTER 3: THREATS TO RHODE ISLAND’S SGCN AND KEY HABITATS
Chapter 3 - 37
Biological Resource Use
This category includes threats from the consumptive use of biological resources including deliberate and
unintentional harvesting, as well as the persecution or control of specific species (Salafsky et al. 2008).
This threat has been identified as an issue for 46% of SGCN reptiles and amphibians primarily due to the
collection of animals for the pet trade.
Several SGCN birds and mammals are game species and therefore subject to “deliberate harvesting.” For
instance, cottontail rabbits are considered small game animals and are legally hunted in four of the six
states inhabited by New England Cottontail. States have the jurisdictional authority to regulate Eastern
Cottontail and New England Cottontail harvest and may adopt regulations to maintain healthy populations
according to local circumstances.
Maine (where only the New England Cottontail is found) recently closed its cottontail hunting season,
and New Hampshire has prohibited taking cottontail rabbits in parts of the state where New England
Cottontail are known to live. Massachusetts, Connecticut, Rhode Island, and New York permit taking
both species during regulated hunting seasons, but because hunting pressure is low relative to the overall
abundance of cottontails and not considered significant compared to other mortality factors, its impact on
the New England Cottontail population is believed to be minimal (Fuller and Tur 2012). However, the
recent rediscovery of New England Cottontail at three sites in Rhode Island (Tefft 2013) suggests that
limitations on the take of New England Cottontail in the state should be reconsidered since the size of
their populations is currently unknown.
Human Intrusion and Disturbance
This category includes threats from human activities that alter, destroy and disturb habitats and species
associated with non-consumptive uses of biological resources (Salafsky et al. 2008). In a state with a high
population density, the threat of human disturbance to many fish and wildlife species and their habitats
can be considerable, and some species are particularly vulnerable to this threat.
Maritime beaches and the unique suite of species they support are vulnerable because of the extreme use
of these habitats for human recreation. Beach-nesting birds, including Piping Plover and Least Tern, are
particularly vulnerable because human disturbance often curtails breeding success. Foot and vehicular
traffic may crush nests or young and excessive disturbance may cause the parents to desert the nest,
exposing eggs or chicks to the summer sun and predators. Interruption of feeding may stress juvenile
birds during critical periods in their development. In addition pets, especially dogs, may harass the birds,
and developments near beaches provide food that attracts increased numbers of predators such as
raccoons, skunks, and foxes. Domestic and feral cats are also very efficient predators of small mammals
and birds, including the Piping Plover.
The USFWS assists partners with management at 16 nesting sites from Westerly to Middletown,
including Block Island. Since management efforts in 1992, the population in southern Rhode Island has
increased 690% from 10 nesting pairs in 1992 to 69 nesting pairs in 2009.
Wildlife Diseases
Wildlife diseases have the potential to impact a broad range of wildlife. An emerging disease that has
received particular attention in the Northeast is White-nosed Syndrome (WNS) in bats. The RCN Grant
Program has funded two projects to begin research and to address the threat of WNS that has killed more
than 5.7 million hibernating bats in the northeastern states. The disease is named for its causative agent, a
CHAPTER 3: THREATS TO RHODE ISLAND’S SGCN AND KEY HABITATS
Chapter 3 - 38
white fungus (Geomyces destructans) that invades the skin of hibernating or otherwise torpid bats.
Research has demonstrated that bats affected by WNS arouse from hibernation significantly more often
than healthy bats. The severity of cutaneous fungal infection correlates with the number of arousal
episodes from torpor during hibernation. The increased frequency of arousal from torpor likely
contributes to WNS-associated mortality, but the question of how fungal infection induces increased
arousals remains unanswered. Other research has focused on the development of methodologies to
combat WNS in bats to test potential treatments against cultured Geomyces destructans under laboratory
conditions, test potential treatments for safety in healthy bats, and test potential treatments for efficacy
against G. destructans in hibernating bats. In Rhode Island, RI DEM DFW has implemented
comprehensive surveys of all bats to understand the implications of WNS in the state – to date the disease
has not been documented in Rhode Island (Brown pers. comm., 2014).
Since 2009, Timber Rattlesnakes from separate populations in eastern, central and western Massachusetts
have been found to have a significant disease identified as fungal dermatitis. Fungal dermatitis has been
previously documented as a cause of morbidity and mortality in both captive and free-ranging Viperidae
snakes (Cheatwood et al. 2003). With funding from the RCN Grant Program, researchers are actively
trying to understand the spread of this disease and factors that contribute to its virulence in rattlesnake
populations.
New Energy Developments
There are many potential impacts of new energy development on wildlife in the northeastern states,
ranging from effects of hydraulic fracturing and off shore drilling on aquatic systems, the development of
biomass and consequent forest harvesting, and the direct mortality of birds and bats from wind turbines
along mountain and coastal flyways.
A Risk Assessment of Marine Birds in the Northwest Atlantic Ocean is under way through NALCC and
partners to develop a series of maps depicting the distribution, abundance and relative risk to marine birds
from offshore activities (e.g., off shore drilling and wind energy development) in the northwestern
Atlantic Ocean. The goal is to develop and demonstrate techniques to document and predict areas of
frequent use and aggregations of birds and the relative risk to marine birds within these areas. This
NALCC project is supporting several components of map and technique development by leveraging
several large, ongoing projects funded by the Bureau of Ocean Energy Management (BOEM),
Department of Energy (DOE), USGS, and NOAA and involving research groups at the Biodiversity
Research Institute, North Caroline State University, City University of New York-Staten Island, the
USGS Patuxent Wildlife Research Center, and the NOAA National Centers for Coastal Ocean Science-
Biogeography Branch.
On September 5, 2014, Deepwater Wind received the final federal approval needed to build the Block
Island Wind Farm, the nation's first offshore wind farm. The 30-megawatt wind farm, consisting of five
turbines, will be located three miles off the coast of Block Island entirely within Rhode Island state
waters. Offshore construction is expected to begin during the summer of 2015 with the wind farm in-
service in 2016. BOEM is still reviewing the permit for the transmission line from Block Island to the
mainland, but it is expected that approval will be received.
Wind turbines pose a potential threat to birds, although compared to other sources of fatality (e.g.,
collisions with buildings and communication towers and predation by cats) wind turbines, at the current

CHAPTER 3: THREATS TO RHODE ISLAND’S SGCN AND KEY HABITATS
Chapter 3 - 39
rate of development, appear to be a relatively minor source of mortality; however, these fatalities are
cumulative and may become more pronounced over time. As turbine size increases and development
expands into new areas with higher densities of birds, risk to birds could increase (The Wildlife Society
2007).
Lack of Information, Planning and Outreach
Although not a direct threats each of these are considered action drivers or needs that call for important
actions to address conservation of SGCN and key habitats. Lack of information on the distribution, status,
and ecology of SGCN and key habitats is considered here because of the importance of having accurate
information to respond appropriately and meaningfully to identified threats. A threat identified in the
2005 CWCS as an Overarching Statewide Conservation Action was, “Lack of GCN species and key
habitat data incorporated into comprehensive strategy” (RI DEM 2005). These needs for information and
planning call for the continuing processes of planning and gathering of additional information that has
been identified and prioritized. However, primarily due to budgetary constraints, there has been little
accomplished in regard to the acquisition and management of data to complete conservation actions
identified in the CWCS. The same is true with the need for outreach and need for dissemination of these
data.
A 2005 action to “Identify all critical habitats” has been partially completed through the Photoscience
project described in Chapter 2 for mapping RI ecological communities, although Phase 2 of this project,
which would enhance the coverage with more detailed mapping of rare communities, remains to be done.
Some additional actions to “assess threats to species and habitats” by research and monitoring have
occurred since 2005, but the goal of this work, “to recognize or create de facto wildlife “preserves”, or
conservation areas, has not been completed. The Conservation Opportunity Area maps in Chapter 4
provide some of the natural resource information needed to designating these areas, but a finer scale
delineation of focal areas (a key ingredient of the COA process) is not yet possible without more site-
specific information on SGCN and Key Habitats. Some of this information is available in disparate
databases, much of it remains to be gathered, all of it should be incorporated into a central database to
insure accuracy and consistency.
Threats to Plants
Threats to plants are essentially the same as those that face animals, especially the loss of habitat by
conversion to development. Individual plant species are projected to face additional pressures from the
effects of climate change, as detailed in the climate change section above. Some plants are especially
prone to the threat of over-browsing by animals, especially White-tailed Deer. Several families of plants,
including the orchids (Orchidaceae), and lilies (Liliaceae) are prone to deer browsing, and species within
these families have undergone declines and extirpations during the past 25 years (Enser in prep.). Plants
are also affected by subtle changes in soil chemistry, losses of symbiotic mycorrhizal fungi, species-
specific alien pests, and introduced animals (earthworms).
Many plants are also the targets of collectors for various purposes. Although all plants and animals are
prohibited from collection on state properties without a permit, this regulation is rarely enforced.
However, only a handful of plants are threatened by collection. A recent example is the loss of the last
population of Walking Fern (Asplenium rhizophyllum).

CHAPTER 3: THREATS TO RHODE ISLAND’S SGCN AND KEY HABITATS
Chapter 3 - 40
Citations and Sources
Anderson, M.G., & C.E. Ferree. 2010. Conserving the stage: Climate change and the geophysical
underpinnings of species diversity. PLoS ONE, 5(7), e11554.
Anderson, M.G., M. Clark, C.E. Ferree, A. Jospe, and A. Olivero Sheldon. 2013. Condition of the
Northeast Terrestrial and Aquatic Habitats: a geospatial analysis and tool set. The Nature
Conservancy, Eastern Conservation Science, Eastern Regional Office. Boston, MA.
Anthes, R.A., R.W. Corell, G. Holland, J.W. Hurrell, M.C. MacCracken, and K.E. Trenberth, 2006:
Hurricanes and Global Warming—Potential Linkages and Consequences. Bulletin of the
American Meteorological Society, 87, 623–628.
Association of Fish and Wildlife Agencies (AFWA). 2011. Measuring the Effectiveness of State Wildlife
Grants Final Report. 186 pp.
Barnes, J.S. 2012. The Rhode Island Forest Health Works Project, November 2009 – November 2011. RI
Natural History Survey and RI Dept. Environmental Management, Division of Forest
Environment and Division of Fish and Wildlife. 1-42.
Brooks, R.P., D.H. Wardrop and J.A. Bishop. 2004. Assessing Wetland Condition on a Watershed Basis
in the Mid-Atlantic Region Using Synoptic Land-Cover Maps Environmental Monitoring and
Assessment. 94; 1-3, pp 9-22
Burgess, D. 2002. Wood-Pawcatuck Watershed Association 2002 aquatic benthic macroinvertebrate
sampling project. Wood-Pawcatuck Watershed Association, Hope Valley, Rhode Island.
Available online at
http://www.wpwa.org/Reports/Aquatic%20Invertebrates%20Report%202002.pdf.
Butler, B.J. 2014. Forests of Rhode Island, 2013. Resources Update FS-18. Newtown Square, PA. U.S.
Department of Agriculture, Forest Service, Northern Research Station. 4 p.
Cheatwood, J.L., E.R. Jacobson, P.G. May, T.M. Farrell, B.L. Homer, D.A. Samuelson, and J.W.
Kimbrough. 2003. An Outbreak of Fungal Dermatitis and Stomatitis in a Free-ranging Population
of Pigmy Rattlesnakes (Sistrurus Milliarius Barbouri) in Florida. Journal of Wildlife Diseases:
April 2003, Vol. 39, No. 2, pp. 329-337.
Coastal Resources Management Council (CRMC). 2014. Draft Sea Level Affecting Marshes Model
(SLAMM) Maps. http://www.crmc.ri.gov/maps/maps_slamm.html. Accessed December 10,
2014.
Crisfield, E. and the Northeast Fish and Wildlife Diversity Technical Committee (NFWDTC). 2013. The
Northeast Lexicon: Terminology Conventions and Data Framework for State Wildlife Action
Plans in the Northeast Region. A report submitted to the Northeast Fish and Wildlife Diversity
Technical Committee. Terwilliger Consulting, Inc., Locustville, VA.
Enser, S. 2006. Is Carex kobomugi (Asiatic Sand Sedge) in coastal Rhode Island a threat to the
maritime/beach dune community? The Naturalist 13(1), Rhode Island Natural History Survey,
Kingston, RI.
Flinn, K.M. and M. Vellend. 2005. Recovery of forest plant communities in post-agricultural landscapes.
Frontiers in Ecology and Environment. 3(5):243-250.
Foster, D.R. and G. Motzkin. 2002. Grasslands, heathlands, shrublands in New England: historical
interpretation and approaches to conservation. Journal of Biogeography 29:1569-1590.
Foster, D.R. and G. Motzkin. 2003. Interpreting and conserving the openland habitats of coastal New
England: insights from landscape history. Forest Ecology and Management. 185:127-150.

CHAPTER 3: THREATS TO RHODE ISLAND’S SGCN AND KEY HABITATS
Chapter 3 - 41
Frumhoff, P.C., J.J. McCarthy, J.M. Melillo, S.C. Moser, and D.J. Wuebbles. 2007. Confronting Climate
Change in the U.S. Northeast: Science, Impacts, and Solutions. Synthesis report of the Northeast
Climate Impacts Assessment (NECIA). Cambridge, MA: Union of Concerned Scientists (UCS).
147pp.
Fuller, S. and A. Tur. 2012. Conservation strategy for the New England cottontail (Sylvilagus
transitionalis). New England Cottontail Technical Committee. 1-143.
Glick, P.; Stein, B. A.; Edelson, N. A., editors. 2011. Scanning the conservation horizon: A guide to
climate change vulnerability assessment. Washington, D.C.: National Wildlife Federation. 168
p.
Gu, L., Hanson, P.J., Mac Post, W., Kaiser, D.P., Yang, B., Nemani, R., Pallardy, S.G., Meyers, T., 2008.
The 2007 eastern US spring freezes: increased cold damage in a warming world? Bioscience 58,
253–262.
Hobbs, R.J. 2000. Land use changes and invasions. Pages 55-64, In: Mooney, H.A. and R.J. Hobbs.
Invasive species in a changing world. Island Press, Washington, D.C.
Hayhoe, K., C. P. Wake, T. G. Huntington, L. Luo, M. D. Schwartz, J. Sheffield, E. Wood, B. Anderson,
J. Bradbury, A. Degaetano, T. J. Troy, and D. Wolfe, 2007. Past and Future Changes in Climate
and Hydrological Indicators in the U.S. Northeast. Climate Dynamics 28:381-407, DOI 10.1007.
www.northeastclimateimpacts.org/pdf/tech/hayhoe_et_al_climate_dynamics_2006.pdf
Hufkens, K., Friedl, M. A., Keenan, T. F., Sonnentag, O., Bailey, A., O'Keefe, J. and Richardson, A. D.
(2012), Ecological impacts of a widespread frost event following early spring leaf-out. Global
Change Biology, 18: 2365–2377. doi: 10.1111/j.1365-2486.2012.02712.x
Intergovernmental Panel on Climate Change (IPCC). 2007. Climate Change 2007: Synthesis Report.
Contribution of Working Groups I, II and III to the Fourth Assessment Report of the
Intergovernmental Panel on Climate Change [Core Writing Team, Pachauri, R.K and Reisinger,
A. (eds.)]. IPCC, Geneva, Switzerland, 104 pp.
Karl, T.R., J.M. Melillo, and T.C. Peterson. 2009. Global Climate Change Impacts in the United States.
Cambridge University Press.
Klopfer, S. 2012. Final Report: Identifying Relationships between Invasive Species and SGCN
in the Northeast. Conservation Management Institute. 18 pp.
Loss, S.R., T. Will and P.P. Marra. 2013. The impact of free-ranging cats on wildlife of the United States.
Nature Communications. Article No. 1346.
Loss, S.R., T. Will, S.S. Loss, and P.P. Marra. 2014. Bird-building collisions in the United States:
Estimates of annual mortality and species vulnerability. The Condor. 116(1):8-23.
Manomet Center for Conservation Sciences (MCCS) and the Massachusetts Division of Fisheries and
Wildlife (MADFW). 2010. Climate Change and Massachusetts Fish and Wildlife: Volume 2,
Habitat and Species Vulnerability. 21 pp. with attachments.
National Fish, Wildlife and Plants Climate Adaptation Partnership (NFWPCAP). 2014. National Fish,
Wildlife and Plants Climate Adaptation Strategy. Association of Fish and Wildlife agencies,
Council on Environmental Quality, Great Lakes Indian Fish and Wildlife Commission, National
Oceanic and Atmospheric Administration, and U.S. Fish and Wildlife Service. Washington, DC.
National Wildlife Federation (NWF) and Manomet Center for Conservation Sciences (MCCS). 2014. The
vulnerabilities of northeastern fish and wildlife habitats to sea level rise. A report to the
Northeastern Association of Fish and Wildlife Agencies and the North Atlantic Landscape
Conservation Cooperative, Manomet, Plymouth, MA
CHAPTER 3: THREATS TO RHODE ISLAND’S SGCN AND KEY HABITATS
Chapter 3 - 42
Natural Resource Conservation Service (NRCS). 2014. RI Soil Survey - Prime and Important Farmland.
http://www.nrcs.usda.gov/wps/portal/nrcs/detail/ri/soils/?cid=nrcs144p2_016661. Accessed
December 10, 2014.
Northeast Fish and Wildlife Diversity Technical Committee (NEFWDTC). 2013. Taking Action
Together: Northeast Regional Conservation Synthesis for State Wildlife Action Plan Revisions.
Prepared by Terwilliger Consulting Inc. December 2013 Revised April 2014.
http://rcngrants.org/project-final-reports
Northeast Organic Farming Association (NOFA). 2014. http://www.nofa.org/. Accessed December 10,
2014.
Pinkney, A.E., C.T. Driscoll, D.C. Evers, M.J. Hooper, J. Horan, J.W. Jones, R.S. Lazarus, H.G.
Marshall, A. Milliken, B.A. Rattner, J. Schmerfeld, D. Sparling 2015. Interactive effects of
climate change with nutrients, mercury, and freshwater acidification on key taxa in the North
Atlantic Landscape Conservation Cooperative region. Integrated Environmental Assessment and
Management Magazine. 2015;X:000–000. © 2014 SETAC
Rhode Island Department of Administration Division of Planning (RI Division of Planning). 2014. Land
Use 2025 State Land Use Policies and Plan.
http://www.planning.ri.gov/statewideplanning/land/landuse.php. Accessed December 10, 2014.
Rhode Island Department of Environmental Management (RI DEM) Division of Forest Environment
(DFE). 2014. http://www.dem.ri.gov/programs/bnatres/forest/. Accessed December 10, 2014.
RI DEM Division of Planning and Development (DPD). 2012. Land Conservation and Acquisition
Program Annual Report Fiscal Year 2012. 22pp.
RI DEM Office of Compliance and Inspection (OCI). 2012. Annual report on the activities of the Dam
Safety Program. 34pp.
RI DEM Office of Water Resources (OWR). 2006. State of the State’s Waters Report - 305 (b) Report.
243pp.
RI DEM Office of Water Resources (OWR). 2013.
http://www.dem.ri.gov/programs/benviron/water/wetlands/pdfs/invasive.pdf. Accessed December
10, 2014.
RI DEM Office of Water Resources (OWR). 2014.
http://www.dem.ri.gov/programs/benviron/water/quality/surfwq/lakeindx.htm. Accessed
December 10, 2014.
RI DEM Office of Water Resources (OWR) and Rhode Island Natural History Survey (RINHS). 2014.
Rhode Island DEM Freshwater Wetland Monitoring and Assessment, Years 1 through 6.
Developing and Applying a Rapid Assessment Protocol for Wetland Condition in Rhode Island.
Rhode Island Geographic Information System (RIGIS). Data Distribution System. Environmental Data
Center, University of Rhode Island, Kingston, Rhode Island. http://www.edc.uri.edu/rigis.
Accessed December 10, 2014.
Rubinoff, P, C. Rubin, D. Robadue, J. Riccitelli, C. Collins, D. Robadue, C. Damon, K. Ruddock, P.
August, C. Chaffee, E. Horton-Hall, and A. Ryan. 2013. Building Capacity to Adapt to Climate
Change through Local Conservation Efforts: A South Kingstown Land Trust Pilot Project.
Technical Report. Rhode Island Sea Grant, Narragansett, RI.
Ruddock, K. 2011. Modeling Likely Paths for Salt Marsh Migration in Response to Sea Level Rise: A
Pilot Project Using Sea Level Affecting Marsh Migration Model 6.0.1 in North Kingstown,
Rhode Island. The Nature Conservancy, RI Sea Grant, RI Coastal Resources Center, University
of RI, RI Coastal Resources Management Council.

CHAPTER 3: THREATS TO RHODE ISLAND’S SGCN AND KEY HABITATS
Chapter 3 - 43
Saila, S., E. Lewis, M. Cheeseman, and D. Poyer. 2004. Assessing habitat requirements for brook trout
(Salvelinus fontinalis) in low order streams. Wood-Pawcatuck Watershed Association, Hope
Valley, Rhode Island. http://www.wpwa.org/Reports/FishAssemblage2004.pdf. Accessed on
August 4, 2004.
Salafsky, N. D. Salzer, A. J. Stattersfield, C.Hilton-Taylor, et al. 2008. A Standard Lexicon for
Biodiversity Conservation: Unified Classifications of Threats and Actions. Conservation Biology
22 (4): pp.897–911
Seavey J.R, Gilmer B, McGarigal K.M. 2011. Effect of sea-level rise on piping plover (Charadrius
melodus) breeding habitat. Biological Conservation 144: 393-401.
Sims, S.A. 2012. Effects of Projected Sea Level Rise on Piping Plover (Charadrius melodus) Nesting
Habitat in Rhode Island. MSc. Thesis to the Department of Environmental Studies, Antioch
University New England. July 2012.
Simmons, T. 2006. Using prescribed fire to manage habitats in the Northeast. Pages in: Managing
grasslands, shrublands, and young forests for wildlife: A guide for the Northeast. Massachusetts
Division of Fisheries and Wildlife.
Staudinger, Michelle D. 2015. (Science Coordinator, DOI Northeast Climate Science Center) Personal
communication of March 24, 2015.
Tefft, B. 2011. Deer management in Rhode Island: Crossroads of issues. Wild Rhode Island 4(1): pages 1
and 4.
Tefft, B. 2013. New England cottontail rabbits – a rare species returns to Narragansett Bay islands. Wild
Rhode Island 6(3): 1-2.
The Wildlife Society. 2007. Impacts of wind energy facilities on wildlife and wildlife habitat. Technical
Review 07-2. 1-50.
Tucker, G. 1979. Flora of the South Kingstown pine barrens. MS Thesis, Cornell University.
U.S. Census Bureau (US Census). 2010. http://www.census.gov/2010census/. Accessed December 10,
2014.
U.S. Department of Transportation (US DOT) Federal Highway Administration. 2013. State Statistical
Abstracts 2012. http://www.fhwa.dot.gov/policyinformation/statistics/abstracts/2012/ri.cfm.
Accessed December 10, 2014.
U.S. Environmental Protection Agency (U.S. EPA). 2002. Index of Watershed Indicators.
http://yosemite.epa.gov/water/owrccatalog.nsf/065ca07e299b464685256ce50075c11a/74cc02b72
597630785256b0600723d41!OpenDocument
U.S. EPA. 2014. Memorandum of Understanding on the Migratory Bird Treaty Act.
http://www.epa.gov/oppfead1/cb/csb_page/updates/2014/birdtreaty.html. Accessed December 10,
2014.
U.S. Fish and Wildlife Service (USFWS) 2013. Rhode Island National Wildlife Refuge Complex.
http://www.fws.gov/refuge/Ninigret/About_the_Complex/. Accessed December 10, 2014.
Wootten, L. 2006. Invasive Asiatic sand sedge (Carex kobomugi): New Jersey. Minutes of Mid-Atlantic
Panel on Aquatic Invasive Species, meeting of Sept. 13-14, 2006. p. 2-3.
Recommended