SDE
2014 A to F Report Card Technical Guide
January 2014

Copy as of: Friday, January 31, 2014
1
Table of Contents
Introduction to the A-F School Grading System ............................................................................. 3
Significant Changes from the 2013 Report Card Guide .................................................................. 3
Who Is Eligible for an A-F Report Card? .......................................................................................... 4
Calculation of the Overall Letter Grade .......................................................................................... 4
Student Performance .................................................................................................................. 4
Student Growth ........................................................................................................................... 5
Bonus Points ................................................................................................................................ 5
The Overall Letter Grade ............................................................................................................. 5
Test Participation ........................................................................................................................ 8
A Special Note about Virtual Education Providers ...................................................................... 8
Federally Required Supplemental Information ........................................................................... 9
Component 1: Student Performance .............................................................................................. 9
Students who take an EOI in Middle School Grades ................................................................. 10
Calculation of the Student Performance Component .............................................................. 10
Component 2: Student Growth .................................................................................................... 15
Overall Student Growth ............................................................................................................ 16
Bottom 25 Percent Student Growth ......................................................................................... 20
Bonus Points ................................................................................................................................. 25
Elementary Schools ............................................................................................................... 25
Middle Schools....................................................................................................................... 25
High Schools ........................................................................................................................... 26
Description of Each Criterion .................................................................................................... 26
Student Attendance (Elementary and Middle) ..................................................................... 26
Advanced Coursework (Middle) ............................................................................................ 26
Dropout Rate (Middle) .......................................................................................................... 27
Four-Year Adjusted Cohort Graduation Rate (High School) .................................................. 28

Copy as of: Friday, January 31, 2014
2
Advanced Coursework (High School) .................................................................................... 29
College Entrance Exams (High School) .................................................................................. 31
Low Performing Eighth Grade Cohort Graduation Rate (High School) ................................. 31
Overall EOI Performance ....................................................................................................... 32
Year-to-year Growth .............................................................................................................. 32
District Report Cards ..................................................................................................................... 33
State Report Card .......................................................................................................................... 33
Appendix A: Supplemental Information ....................................................................................... 33
Assessment Data ....................................................................................................................... 33
School Designation .................................................................................................................... 34
Graduation Rate ........................................................................................................................ 34
College Information ................................................................................................................... 34
Teacher Quality Information ..................................................................................................... 34
National Assessment of Educational Progress (NAEP) statistics ............................................... 35
Contact Information ...................................................................................................................... 35
Glossary ......................................................................................................................................... 35

Copy as of: Friday, January 31, 2014
3
Introduction to the A-F School Grading System
The A-F School Grading System was adopted into law by the Oklahoma Legislature in 2011 (and
revised in 2013) to incentivize schools to strive for and reach high levels of college- and career-
readiness. Unlike previous systems of school accountability, this initiative shows how students
within a school are meeting or advancing toward grade-level academic standards in a
framework that anyone can understand.
As this is still a relatively new system, we must ensure that the A-F system is both
understandable and interpreted appropriately. Even though the A-F system is conceptually easy
to understand, the intricate specifics that are required to generate the report card are more
complex. Thus, the goal of this document is to provide a detailed description of how all aspects
of the A-F Report Card are calculated, from where we receive the data to how all components
are combined into a single letter grade. As this is a technical document, it is meant for
individuals already familiar with the A-F system. If you are new to the A-F Grading System, we
recommend you first read the “2014 A to F Report Card Introductory Guide” available on the
SDE website.
This guide will first describe any significant changes made to the guide from the previous year
along with a brief description of which schools are eligible to receive an A-F Report Card.
Secondly, the guide will provide a general description of the major components that comprise
the A-F Report Card. Thirdly, it will describe the calculation of each component in detail,
including the calculation of bonus points. Finally, the guide will describe the calculation of
district and state report cards along with a list of all the supplemental information included in
the report card but not part of the grade calculation. A glossary of terms and contact
information for the Office of Accountability and Assessments staff is also included.
Significant Changes from the 2013 Report Card Guide
A table of contents, introductory section, and glossary were added.
A description of eligibility requirements was added.
Fifth-Grade Social Studies and Eighth-Grade U.S. History are no longer pilot exams.
Beginning in 2013-2014, OMAAP exams are only available to second-time EOI testers
who previously took an OMAAP. Therefore, OMAAP exams are no longer used in the A-F
Report Card, and there is no longer a 2 percent OMAAP cap.
Rules surrounding virtual education providers are clarified.

Copy as of: Friday, January 31, 2014
4
The section on how middle school students who take EOIs are used in the Student
Performance Component was revised.
How exams are paired for the Student Growth components has been clarified.
Calculation of the Bottom 25 Percent Growth sub-component has been clarified.
Additional details for bonus point calculations have been added.
Who Is Eligible for an A-F Report Card?
All public school sites in Oklahoma will receive an A-F report card unless they meet one of the
following criteria:
The site is a pre-kindergarten-only center.
The site’s highest grade served is kindergarten, first grade or second grade, and there is
no other site where at least 60 percent of the original site’s students attend third grade
(which is described in more detail in the following section).
The site serves any grade between third grade and 12th grade (inclusive) but has fewer
than 10 unique students with valid Oklahoma State Testing Program (OSTP) exam
scores. Even though these schools will not receive an A-F Report Card, No Child Left
Behind (NCLB) still requires that we have some form of accountability for these schools.
Please see the document, “Federal Small School Accountability Guide,” available on the
SDE website for the accountability system used for these sites.
Calculation of the Overall Letter Grade
The A-F Report Card is comprised of two primary components, each worth one-half of the
overall grade: Student Performance and Student Growth. In addition, schools will have the
opportunity to earn up to 10 bonus points that are added to their final grade.
Student Performance
The Student Performance component includes performance on all Oklahoma State Testing
Program (OSTP) exams administered by the State Board of Education pursuant to 70 O.S. §
1210.508 during the most recent school year, including the Oklahoma Core Curriculum Tests
(OCCT), End-of-Instruction (EOI) exams, and the Oklahoma Alternative Assessment Program
(OAAP). OAAP scores are subject to the 1 percent cap on allowable proficient and advanced
scores established by federal No Child Left Behind regulations at 34 C.F.R. § 200.13(c)(1). Every
content area is included (Reading, Math, Science, Social Studies, History, Geography, Writing,
Algebra I, Geometry, Algebra II, English II, English III, Biology I and US History Exams). All testing
sessions (Summer, Winter/Trimester, Winter Retest, Spring Retest and Spring) are included.

Copy as of: Friday, January 31, 2014
5
However, testing records designated as “Second Time Test” (EOIs only), “Not Full Academic
Year (NFAY)” or “Other Placement” will be excluded from all calculations.1
Student Growth
The Student Growth component is divided into two sub-components: growth of all students in a
school and growth of the bottom 25 percent of students in the school. The student growth
section includes only Reading and Mathematics OCCTs in grades 3-8, and the Algebra I EOI and
English II EOI exams in high school. Records included in the Student Performance component
will be paired with a previous reading or math score to evaluate growth, if available. The paired
scores must come from similar versions of the exam. For example, a regular exam must be
compared to a regular exam, and a portfolio assessment must be compared to a portfolio
assessment. If one of the sub-components cannot be calculated, then the remaining category
will carry the full weight for the Student Growth grade.
Bonus Points
Schools have the opportunity to earn up to 10 bonus points added to their final grade. These
bonus points can be earned by achieving established criteria in attendance, advanced
coursework, dropouts, graduation, college entrance exams and/or overall EOI performance.
The Overall Letter Grade
A final percentage grade will be calculated for each component and subsequently combined
according to their respective weights to create a total percentage ranging from 0 percent to
100 percent for the school. Intermediate calculations (e.g., Student Performance * .50) are
carried out to two decimal places.
Any bonus points earned will be added to the total percentage as extra credit to create the
Final Report Card Index. Thus, the maximum possible score will be 110 percent. The Final
Report Card Index will be used to assign the Final Letter Grade to a school.
1 Geography exams will be field test exams in the 2013-2014 school year. Thus, these exams will not be included in
the performance calculations only for 2013-2014.

Copy as of: Friday, January 31, 2014
6
The tables below indicate the weight each component will carry (Table 1), how the overall
report card index will be calculated from the component indices (Table 2) and how the final
index will be converted to a letter grade (Table 3).
Table 1 Table 2
Component Weights in Final Grade Report Card Index Calculation
Component Weight (Student Performance Index * .50) +
Student Performance 50% (Overall Student Growth Index * .25) +
Student Growth (Bottom 25% Growth Index * .25) +
Overall Student Growth 25% (Bonus Points) =
Bottom 25% Growth 25% Final Report Card Index
Table 3
Final Index to Letter Grade
Final Index Range
Final Index Grade
Final Index Range
Final Index Grade
97% and above A+ 77% -79% C+
93% - 96% A 73% - 76% C
90% - 92% A- 70% - 72% C-
87% -89% B+ 67% -69% D+
83% - 86% B 63% - 66% D
80% - 82% B- 60% - 62% D-

Copy as of: Friday, January 31, 2014
7
Table 4 provides an example of the calculation for a school’s overall grade. Because the report
card index is 86, the overall grade would be a “B”.
Table 4
Example Calculation
Component Index Multiplier Weighted Points
Student Performance 76 .50 38.00
Student Growth
Overall Student Growth 73 .25 18.25
Bottom 25% Growth 88 .25 22.00
Bonus Points *** *** 8
Overall Calculated Index 86%
Overall Letter Grade B
A component or sub-component must have at least 10 unique students with valid test scores in
order to calculate an index for that component. A school will not earn a grade in any
component unless the minimum N-size is met (bonus points do not require a minimum N-size
because, unlike the Student Performance and Student Growth components, the number of
students is not included on the report card). When there are fewer than 10 students in a
component or sub-component, the component weights will change accordingly. For example, if
a school has fewer than 10 students in the bottom 25-percent category, the Overall Student
Growth sub-component is the sole determining factor in the Student Growth component of the
final grade (i.e., 50 percent).
Additionally, if an elementary school site does not have tested grades (e.g. kindergarten
through second grade) but is still eligible for an A-F Report Card, it will receive both the Student
Performance score and the Student Growth score of its associated feeder pattern school (with
the exception of bonus points, which will be determined by the original school’s attendance
rather than that of the associated school). A feeder pattern school is defined as the school to
which 60 percent or more of the students from the school without tested grades are enrolled
upon promotion to third grade. A feeder pattern school that will be associated with a school
without tested grades will be identified by the Oklahoma State Department of Education using
enrollment records from the WAVE. If there is no school to which 60 percent or more of the

Copy as of: Friday, January 31, 2014
8
students from the original school are enrolled upon promotion to the third grade, then that
school will not receive an A-F Report Card.
Test Participation
Schools are expected to test 100 percent of eligible students enrolled in that school during the
testing window for every OSTP exam for which they are eligible, regardless of FAY status.
Schools that do not test a sufficient percentage of eligible students will be penalized as follows
(all percentages are rounded to the nearest whole number):
The school’s Overall Letter Grade will be reduced by one whole letter grade if fewer
than 95 percent of all eligible test records have valid scores.
The school’s Overall Letter Grade will automatically be reduced to an “F” if fewer than
90 percent of all eligible test records have valid scores.
For example, if a school has 50 eligible third-grade students, 50 eligible fourth-grade students
and 50 eligible fifth-grade students, then it would be expected to produce valid scores for 150
Math exams, 150 Reading exams, 50 Writing exams, 50 Social Studies exams and 50 Science
exams (450 total). If the school originally earned an “A-“ on the report card, but only has 425
exams with valid scores (94.44 percent), then the Overall Letter Grade would be reduced to a
“B-”. Likewise, if the school only has 402 exams with valid scores (89.33 percent), then the
Overall Letter Grade would be reduced to an automatic “F”.
A Special Note about Virtual Education Providers
For the 2013-2014 school year, virtual education providers who have contracted with a public school district to provide full-time virtual education to non-resident students of the district will be treated as a separate school site. . If the virtual education provider has contracted with more than one school district, then that provider will be considered a single site for each district with which the provider contracts. As a site separate from the district, virtual education providers will receive an A-F Report Card (assuming they meet all other eligibility requirements). The report card of virtual education providers will detail the performance and growth of only non-resident students of the contracting district. Resident students will be reported with the school of residence even if they are enrolled in an online program. In other words, if XYZ High School has a contract with a virtual education provider to educate students who do not live in XYZ district, then XYZ Virtual High School will receive a report card composed of non-resident students that is separate from the brick-and-mortar XYZ High School.
Furthermore, full-time virtual charter schools that serve pre-kindergarten through 12th grade
will receive a separate report card for each of the following grade spans: elementary (PK – 5),
middle (6 – 8) and high (9 – 12). Thus, these full-time virtual charter schools will be treated as
six (6) separate sites for purposes of the A-F Report Card: elementary, middle, and high school

Copy as of: Friday, January 31, 2014
9
report cards composed of residents of the sponsoring district and elementary, middle, and high
school sites composed of non-residents of the sponsoring district. As with brick-and-mortar
schools, any virtual school site (either as a site contracted with a district or a charter school site)
that is not eligible for an A – F Report Card due to having less than 10 students will be subject to
the accountability system as described in the “Federal Small School Accountability Guide.”
Beginning July 14, 2014, no school district shall offer full-time virtual education to students who
do not reside within the boundaries of the school district. The Statewide Virtual Charter School
Board will assume existing contracts to provide full-time virtual education to non-resident
students, and those schools will become statewide virtual charter schools. The district of
residence of statewide virtual charter schools will be considered the State of Oklahoma.
Federally Required Supplemental Information
In addition to information required to calculate a letter grade, report cards will also include a
variety of additional reports as required by the U.S. Department of Education. These reports
are not used in any A-F calculation and are solely for reporting purposes. A list of these
additional reports can be found in appendix A.
Component 1: Student Performance Each school will receive a Student Performance Index (PI) based on student performance on all
eligible exams administered in the Oklahoma State Testing Program (OSTP) during the most
recent school year. The student PI will be worth 50 percent of the Final Report Card Index.
Content areas included are those assessed on the OCCT, EOI, and OAAP (Reading, Math,
Science, Social Studies, History, Geography, Writing, Algebra I, Geometry, Algebra II, English II,
English III, Biology and US History).
All testing sessions (the previous Summer, Winter/Trimester, Winter Retest, Spring Retest and
Spring) are included. However, testing records designated as “Second Time Test” (EOIs only),
“Not Full Academic Year” (NFAY) or “Other Placement” will be excluded from all calculations.
OAAP exams are subject to the 1 percent cap on proficiency level. Retained students taking
OCCTs or OAAP exams will be included in the Student Performance component.
Which test records belong to which schools is determined using the county, district and site
codes on the test record itself. Thus, the school code that is on the testing record should reflect
the school the student was enrolled in at testing (which is not necessarily the school where the
student actually took the test).

Copy as of: Friday, January 31, 2014
10
Students who take an EOI in Middle School Grades
In addition to test records from the current year, the Student Performance component for
schools that serve ninth grade will include any previous EOI test records that the current year’s
ninth-grade cohort took as middle school students if the following conditions are met:
The previous record(s) can be located (via matching State Testing Numbers).
The student was enrolled as a ninth grader at the current school on Oct. 1.
The student took the EOI exam in grades six, seven or eight.
The test record met eligibility criteria the year it was taken (i.e., FAY, not “Second Time
Test,” not “Other Placement”).
The current school does not also serve grades six, seven or eight.
In other words, the school that the ninth grader currently attends will receive credit for any
previous EOIs taken by that student while s/he was in middle school unless the current school
also serves the same grade that the student was in when the test was originally taken.
Calculation of the Student Performance Component
The Student Performance component will be calculated by dividing the number of test scores
that were “Proficient” or “Advanced” by the total number of eligible test records with valid
scores.2 The result will then be multiplied by 100 and rounded to the nearest whole number to
form the Performance Index (PI). The formula for calculating the PI is shown below:
A school must have at least 10 unique students with valid test scores before a Performance
Index is calculated. If that index cannot be calculated, then the school will not receive an A-F
Report Card but instead will be subject to the Small School Accountability System mentioned
earlier. Furthermore, if a school has fewer than 10 students in a specific subject area, a PI will
not be calculated for that specific subject (although the records will still be used to calculate the
overall Performance Index).
2 EOI test records that indicate the student is exempted due to previously demonstrating mastery of the material
via an alternate exam (e.g., ACT) will be considered as “Proficient” for the purposes of the A-F Report Card.

Copy as of: Friday, January 31, 2014
11
The PI has a range of zero to 100. If every student tested has a proficiency level of
“Unsatisfactory” or “Limited Knowledge,” then the index
would equal zero. If every student tested has a proficiency
level of “Proficient” or “Advanced,” then the Performance
Index would equal 100. Each school will receive a letter grade
based on its PI (see Table 5). Please note that the letter grade
is solely to aid in interpreting the PI. Only the Performance
Index itself will be used in calculating the final index and letter
grade.
Tables 6 and 7 provide an example of how the Performance
Index will be calculated for a traditional elementary school. For
these and all subsequent tables, it will be assumed that no
exams have an adjusted performance level due to the 1 percent OAAP cap. A PI calculation
based on the total numbers from all subject areas combined is displayed on the last line of the
table. In addition, a letter grade for each content area will be displayed on the report card so
strengths and weaknesses can be highlighted. Note that even though Tables 6 and 7 illustrate
the calculations, only the total number tested, PI and letter grade of each subject area will
appear on the report cards.
Table 6 Example Distribution of Scores for an Elementary School
Content Unsatisfactory
Limited
Knowledge Proficient Advanced
Total
Tested
Mathematics 2 8 100 19 129
Reading 3 13 93 20 129
Science 0 4 32 8 44
Social Studies 2 5 27 10 44
Writing 0 4 34 8 46
Total 7 34 286 65 392
Table 5
Performance
Index
Letter Grade
90 and Above A
80 – 89 B
70 – 79 C
60 – 69 D
59 and below F
Copy as of: Friday, January 31, 2014
12
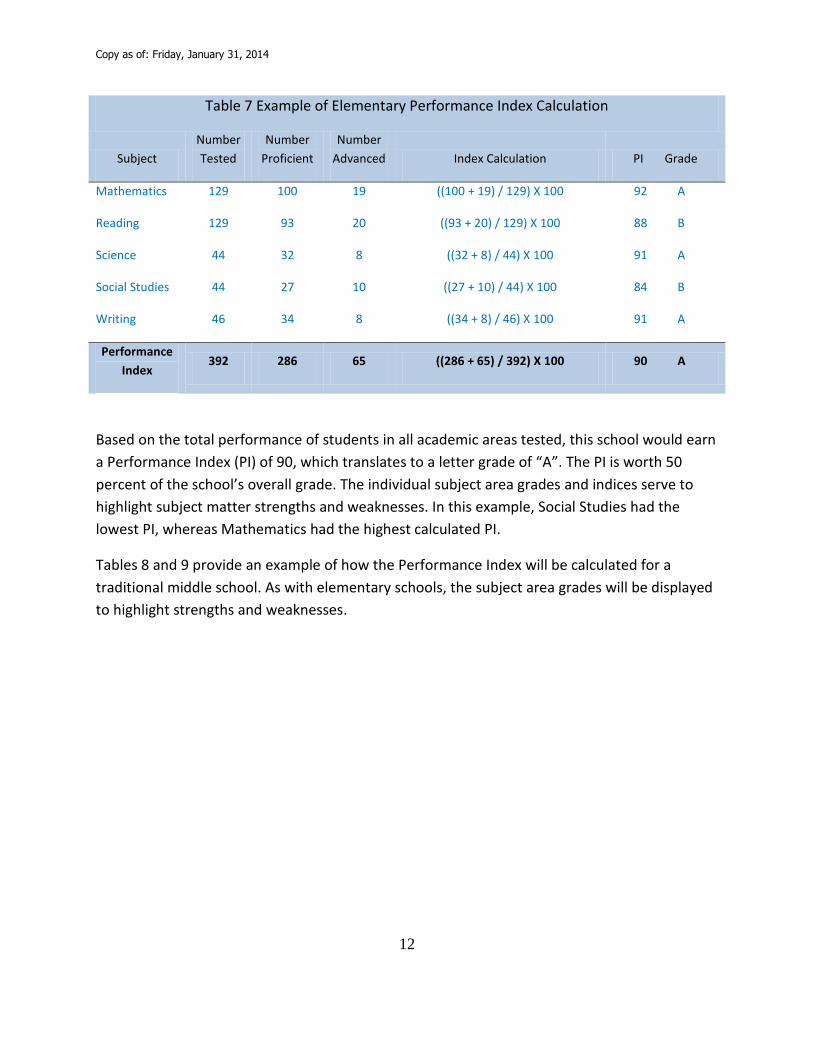
Table 7 Example of Elementary Performance Index Calculation
Subject
Number
Tested
Number
Proficient
Number
Advanced Index Calculation PI Grade
Mathematics 129 100 19 ((100 + 19) / 129) X 100 92 A
Reading 129 93 20 ((93 + 20) / 129) X 100 88 B
Science 44 32 8 ((32 + 8) / 44) X 100 91 A
Social Studies 44 27 10 ((27 + 10) / 44) X 100 84 B
Writing 46 34 8 ((34 + 8) / 46) X 100 91 A
Performance
Index 392 286 65 ((286 + 65) / 392) X 100 90 A
Based on the total performance of students in all academic areas tested, this school would earn
a Performance Index (PI) of 90, which translates to a letter grade of “A”. The PI is worth 50
percent of the school’s overall grade. The individual subject area grades and indices serve to
highlight subject matter strengths and weaknesses. In this example, Social Studies had the
lowest PI, whereas Mathematics had the highest calculated PI.
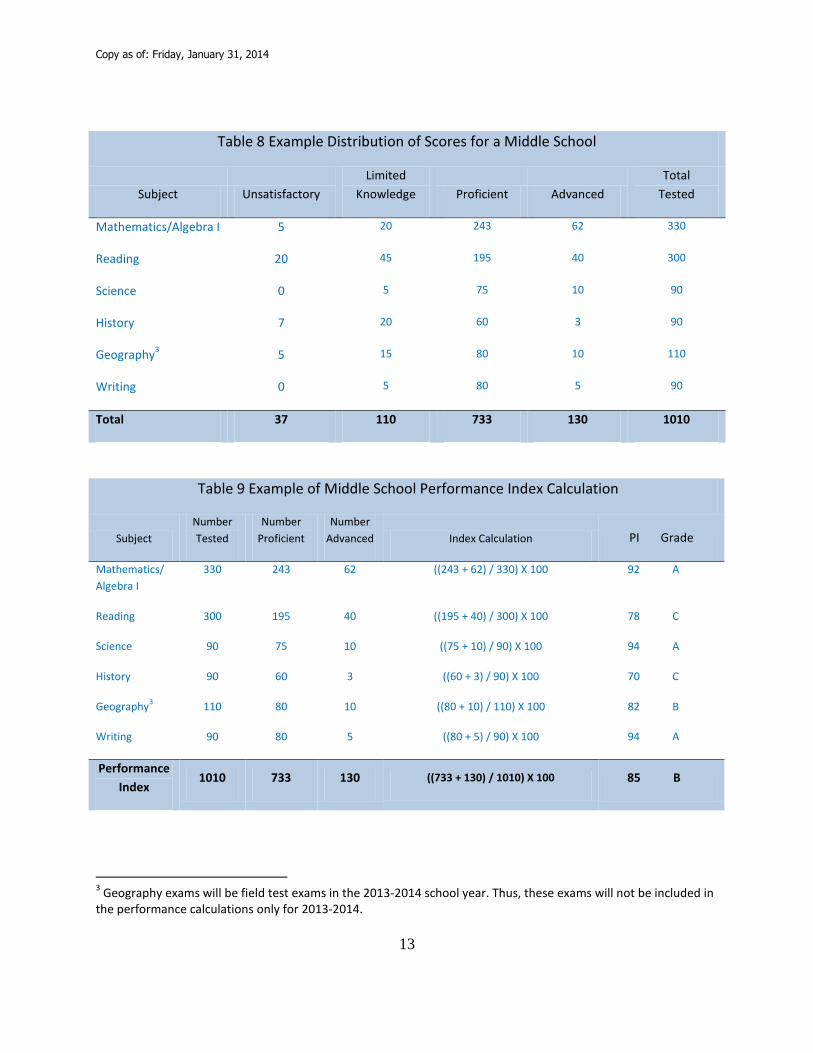
Tables 8 and 9 provide an example of how the Performance Index will be calculated for a
traditional middle school. As with elementary schools, the subject area grades will be displayed
to highlight strengths and weaknesses.
Copy as of: Friday, January 31, 2014
13
Table 8 Example Distribution of Scores for a Middle School
Subject Unsatisfactory
Limited
Knowledge Proficient Advanced
Total
Tested
Mathematics/Algebra I 5 20 243 62 330
Reading 20 45 195 40 300
Science 0 5 75 10 90
History
7 20 60 3 90
Geography3
5 15 80 10 110
Writing 0 5 80 5 90
Total 37 110 733 130 1010
Table 9 Example of Middle School Performance Index Calculation
Subject
Number
Tested
Number
Proficient
Number
Advanced Index Calculation PI Grade
Mathematics/
Algebra I
330 243 62 ((243 + 62) / 330) X 100 92 A
Reading 300 195 40 ((195 + 40) / 300) X 100 78 C
Science 90 75 10 ((75 + 10) / 90) X 100 94 A
History 90 60 3 ((60 + 3) / 90) X 100 70 C
Geography3
110 80 10 ((80 + 10) / 110) X 100 82 B
Writing 90 80 5 ((80 + 5) / 90) X 100 94 A
Performance
Index 1010 733 130 ((733 + 130) / 1010) X 100 85 B
3 Geography exams will be field test exams in the 2013-2014 school year. Thus, these exams will not be included in
the performance calculations only for 2013-2014.
Copy as of: Friday, January 31, 2014
14
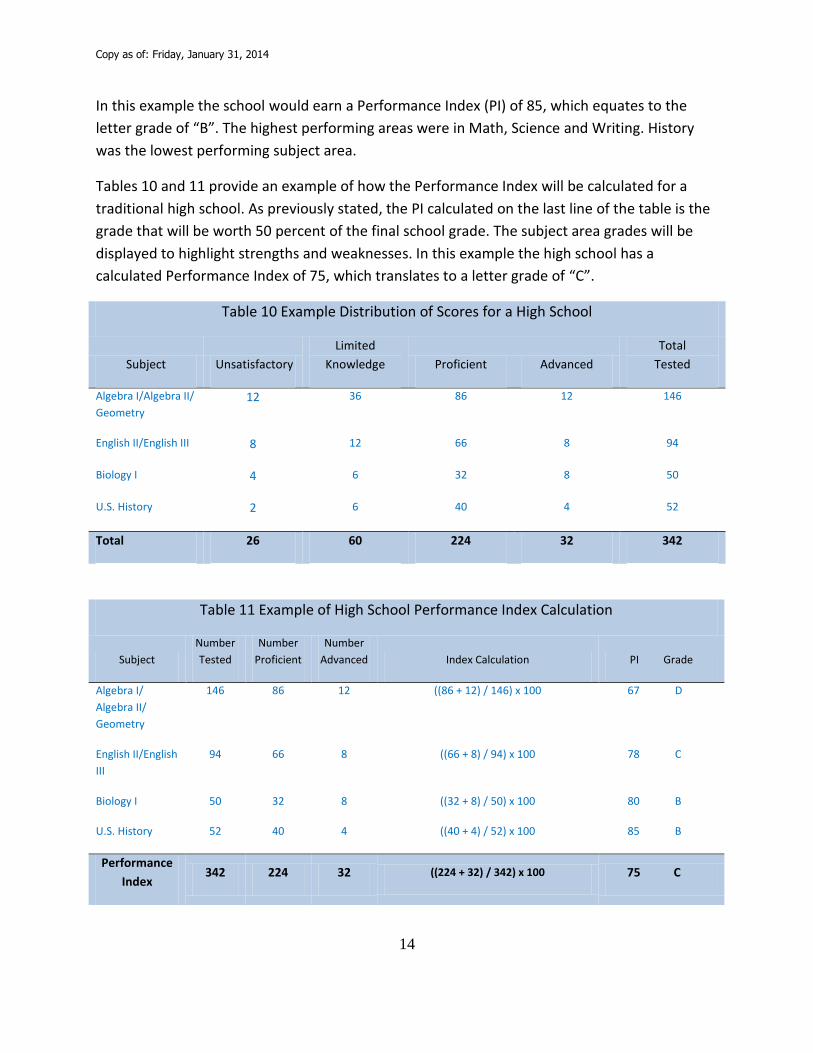
In this example the school would earn a Performance Index (PI) of 85, which equates to the
letter grade of “B”. The highest performing areas were in Math, Science and Writing. History
was the lowest performing subject area.
Tables 10 and 11 provide an example of how the Performance Index will be calculated for a
traditional high school. As previously stated, the PI calculated on the last line of the table is the
grade that will be worth 50 percent of the final school grade. The subject area grades will be
displayed to highlight strengths and weaknesses. In this example the high school has a
calculated Performance Index of 75, which translates to a letter grade of “C”.
Table 10 Example Distribution of Scores for a High School
Subject Unsatisfactory
Limited
Knowledge Proficient Advanced
Total
Tested
Algebra I/Algebra II/
Geometry
12 36 86 12 146
English II/English III 8 12 66 8 94
Biology I 4 6 32 8 50
U.S. History 2 6 40 4 52
Total 26 60 224 32 342
Table 11 Example of High School Performance Index Calculation
Subject
Number
Tested
Number
Proficient
Number
Advanced Index Calculation PI Grade
Algebra I/
Algebra II/
Geometry
146 86 12 ((86 + 12) / 146) x 100 67 D
English II/English
III
94 66 8 ((66 + 8) / 94) x 100 78 C
Biology I 50 32 8 ((32 + 8) / 50) x 100 80 B
U.S. History 52 40 4 ((40 + 4) / 52) x 100 85 B
Performance
Index 342 224 32 ((224 + 32) / 342) x 100 75 C

Copy as of: Friday, January 31, 2014
15
Component 2: Student Growth Schools will also be assigned a grade based on individual student growth, worth 50 percent of
the overall school grade. Because only math and reading are tested consistently from year to
year, the growth indices will be based only on third through eighth grade Math and Reading
exams, and Algebra I and English II exams. The Student Growth component will include all of
the current year’s third- through eighth-grade Math and Reading, Algebra I and English II test
records that were included in the Student Performance component and can be paired with a
previous test record. Please note that as with the Student Performance component, 3-8 OCCT
and OAAP exams of retained students are include in the Student Growth component. The
criteria for the pairing of test records are as follows:
Both test records must have identical State Testing Numbers.
Both test records must have valid scores.
Both records must be from the same subject and testing program (e.g., math exams can
only be paired with math exams; OAAP exams can only be paired with OAAP exams). 4
For 3-8 Math and Reading, the previous exam record must be only one year removed.
For Algebra I, the previous exam record must be from the most recent corresponding
OCCT exam students could have taken (e.g., seventh grade if the EOI is taken in eighth
grade; eighth grade if the EOI is taken in ninth grade or later).
For English II, the previous exam record must be the eighth-grade OCCT Reading exam. 5
The previous exam record can come from any school in the state. In other words, students do
not need to be in the same school two consecutive years to be included in the growth
calculations.
Test records are not eligible to be included in Overall Student Growth if they are not also
included in the Student Performance component. In other words, the record must be marked
as FAY, not “Other Placement” and not “Second Time Test.” This restriction, however, does not
apply to the previous exam record. For example, if John Doe was NFAY in third-grade math last
year but FAY in fourth-grade math the current year, then John Doe will still be included in the
growth calculations because eligibility requirements only apply to the current year’s exam, not
the previous exam. Also please note that the 1 percent cap on OAAP exams does not apply to
Student Growth. Thus, all OAAP exams will be able to use their original performance levels.
4 Because OMAAP exams are no longer available for third through eighth grade Reading and Math, all students
who took an OMAAP exam in 2012-2013 will not be included in any growth calculation for 2013-2014, as there will not be a corresponding OMAAP exam with which to pair it. 5 Middle schools students will always use the grade level OCCT Reading exams to assess growth, even if they take
the English II EOI.

Copy as of: Friday, January 31, 2014
16
As stated earlier, only the current year’s Algebra I and English II exams may be included in the
Student Growth component. Thus, even though the previous EOI records of middle school
students now in the ninth grade were included in the Student Performance component, they
are not included in the Student Growth component.
The Student Growth component is divided into two sub-components:
1) Overall Student Growth: student growth for all students in a school
2) Bottom 25 Percent Growth: student growth for the bottom 25 percent of students in a
school
Each sub-component is worth 25 percent of the overall final grade for a school. Like the
performance component, a school must have at least 10 unique students with valid test score
pairings in order to calculate each sub-component. If the number of unique students with
paired exams is less than 10, then the Overall Growth and the Bottom 25 Percent Growth will
not be calculated. In this situation, the Student Performance component will be worth 100
percent of the final grade. If only the Bottom 25 Percent Growth sub-component contains
fewer than 10 unique students with paired exams but the Overall Student Growth sub-
component has 10 or more unique students, then the Overall Student Growth sub-component
will constitute the entire Student Growth component (50 percent of the overall grade). As with
the Student Performance component, if a school has fewer than 10 unique students with paired
exams in a specific subject area, that subject area will not report out on the report card,
although it will still be used to calculate the growth index.
Overall Student Growth
Overall Student Growth is measured by comparing proficiency levels across paired exams for all
students who meet the eligibility requirements for the Student Growth component (see above).
An Overall Growth Index (GI) will be calculated for each subject area (Math/Algebra I and
Reading/English II) by identifying students who meet at least one of the following criteria for
growth:
The student scores either “Proficient” or “Advanced” on both the current exam and the
previous exam.
The student’s performance level on the current exam is higher than the student’s
performance level on the previous exam (“Advanced” is higher than “Proficient,” which
is higher than “Limited Knowledge,” which is higher than “Unsatisfactory”).
The student demonstrates an increase in his or her Oklahoma Performance Index (OPI)
score from the previous exam to the current exam that is greater than or equal to the
statewide average of positive growth. The statewide average of positive growth is
Copy as of: Friday, January 31, 2014
17
defined as the average OPI increase amongst all students who raised their OPI score
from one year to the next.6 The statewide average of positive growth is calculated
separately for each grade level and subject.
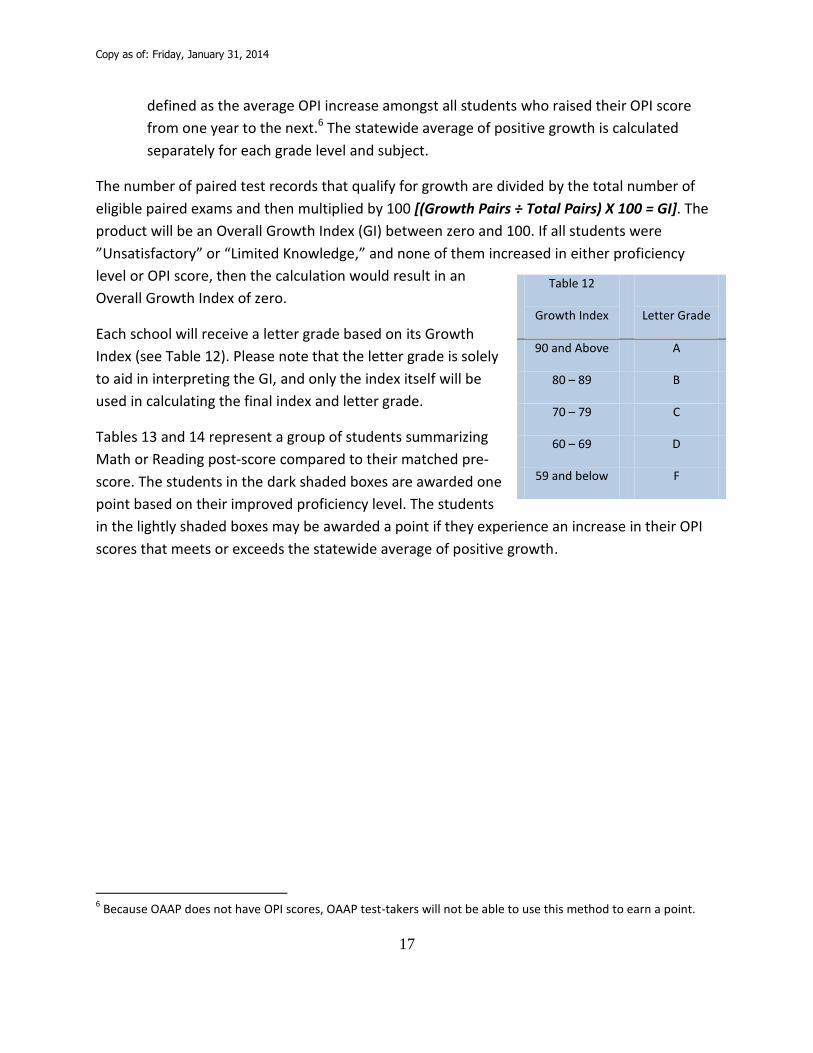
The number of paired test records that qualify for growth are divided by the total number of
eligible paired exams and then multiplied by 100 [(Growth Pairs ÷ Total Pairs) X 100 = GI]. The
product will be an Overall Growth Index (GI) between zero and 100. If all students were
”Unsatisfactory” or “Limited Knowledge,” and none of them increased in either proficiency
level or OPI score, then the calculation would result in an
Overall Growth Index of zero.
Each school will receive a letter grade based on its Growth
Index (see Table 12). Please note that the letter grade is solely
to aid in interpreting the GI, and only the index itself will be
used in calculating the final index and letter grade.
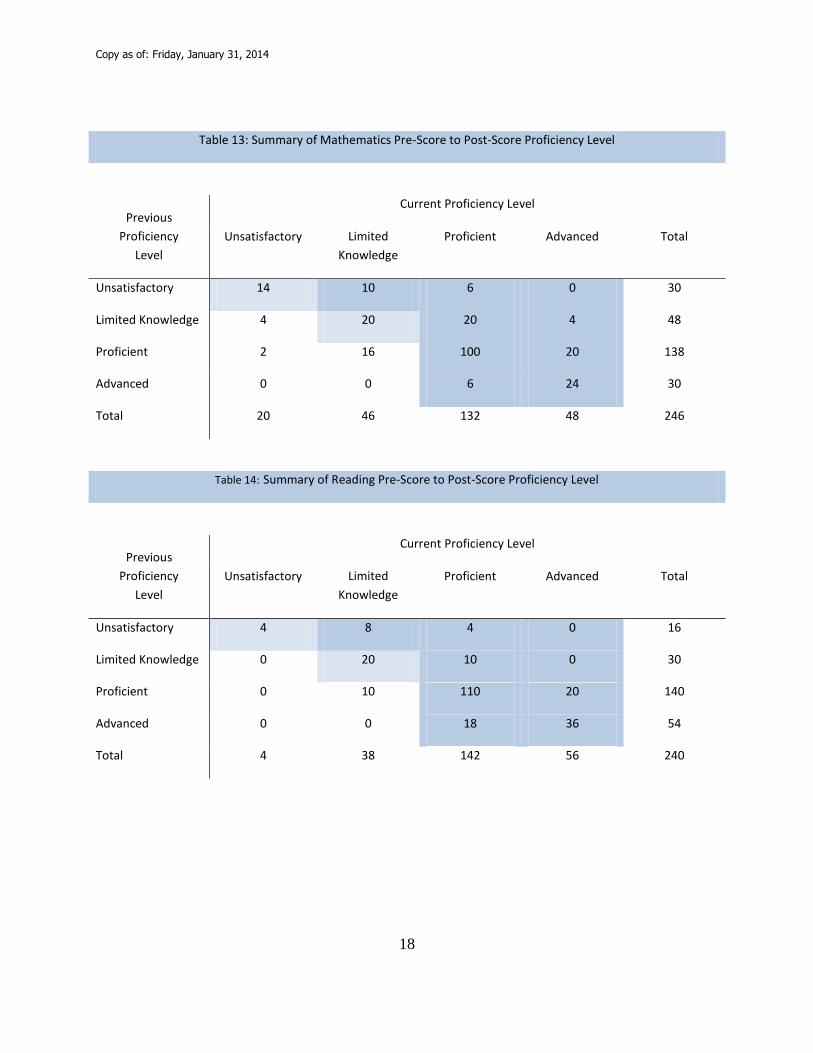
Tables 13 and 14 represent a group of students summarizing
Math or Reading post-score compared to their matched pre-
score. The students in the dark shaded boxes are awarded one
point based on their improved proficiency level. The students
in the lightly shaded boxes may be awarded a point if they experience an increase in their OPI
scores that meets or exceeds the statewide average of positive growth.
6 Because OAAP does not have OPI scores, OAAP test-takers will not be able to use this method to earn a point.
Table 12
Growth Index
Letter Grade
90 and Above A
80 – 89 B
70 – 79 C
60 – 69 D
59 and below F
Copy as of: Friday, January 31, 2014
18
Table 13: Summary of Mathematics Pre-Score to Post-Score Proficiency Level
Previous
Proficiency
Level
Current Proficiency Level
Unsatisfactory Limited
Knowledge
Proficient Advanced Total
Unsatisfactory 14 10 6 0 30
Limited Knowledge 4 20 20 4 48
Proficient 2 16 100 20 138
Advanced 0 0 6 24 30
Total 20 46 132 48 246
Table 14: Summary of Reading Pre-Score to Post-Score Proficiency Level
Previous
Proficiency
Level
Current Proficiency Level
Unsatisfactory Limited
Knowledge
Proficient Advanced Total
Unsatisfactory 4 8 4 0 16
Limited Knowledge 0 20 10 0 30
Proficient 0 10 110 20 140
Advanced 0 0 18 36 54
Total 4 38 142 56 240

Copy as of: Friday, January 31, 2014
19
An example of how the Overall Growth Index is calculated from Tables 13 and 14 is provided in
Tables 15-17. An Overall Growth Index of 84 translates to a letter grade of “B” and is worth 25
percent of the final grade.
Table 15: Calculation of Points for Mathematics
Calculation of Points for Mathematics Number of Students Points
Number Proficient or Advanced Remaining Proficient or Above 150 150
Number of Unsatisfactory Improving to Limited Knowledge 10 10
Number of Unsatisfactory Improving to Proficient 6 6
Number of Unsatisfactory Improving to Advanced 0 0
Number of Limited Knowledge Improving to Proficient 20 20
Number of Limited Knowledge Improving to Advanced 4 4
Number with OPI Growth greater than State Average 8 8
Total Math Points 198
Total Number of Students 246
Table 16: Calculation of Points for Reading
Calculation of Points for Reading Number of Students Points
Number Remaining Proficient or Above 184 184
Number of Unsatisfactory Improving to Limited Knowledge 8 8
Number of Unsatisfactory Improving to Proficient 4 4
Number of Unsatisfactory Improving to Advanced 0 0
Number of Limited Knowledge Improving to Proficient 10 10
Number of Limited Knowledge Improving to Advanced 0 0
Number with OPI Growth greater than State Average 4 4
Total Reading Points 210
Total Number of Students 240

Copy as of: Friday, January 31, 2014
20
Table 17: Calculation of Overall Growth Index
Number of
Students
Number of
Points
Calculation
Points ÷ Students GI Grade
Mathematics 246 198 198 ÷ 246 X 100 80 B
Reading 240 210 210 ÷ 240 X 100 89 B
Total 486 408 408 ÷ 486 X 100 84 B
Bottom 25 Percent Student Growth
The Bottom 25 Percent Growth Index is calculated in the same way as the Overall Growth
index (GI). As with overall growth, a school must have at least 10 unique students with valid
test score pairings in order to calculate this sub-component. If a school has fewer than 10
students in a specific subject area with valid exam pairings, then that subject area will not
report out on the report card (although it will still be used to calculate the Overall Growth
Index). If the number of unique students with valid exam pairings total is less than 10, then the
bottom 25 Percent Growth index is not included in the final grade and the Overall Growth Index
grade is worth 50 percent of the final grade.
The bottom 25 percent is determined by rank ordering all of the test record pairs that were
included in the Overall Student Growth sub-component by the previous exam score (e.g., for
current fourth graders, the previous exam scores are their third-grade exams). The rank
ordering is done separately for each subject area/test program combination (i.e., Math-OCCT,
Math-OAAP, Reading-OCCT, Reading-OAAP). All grade levels are ranked together (e.g., third-
through eighth-grade OCCT Math and OCCT Algebra I are combined together in the rankings).
The bottom quartile of test record pairings for each grade-level-specific subject/exam
combination will be used in the Bottom 25 Percent Growth calculation. A school must have at
least four exams of the same type (e.g., OMAAP Math, OAAP Reading, etc.) in order to identify
a bottom 25 percent for that specific type. In the event of multiple student records with the
same previous OPI score, those records will be reverse rank ordered on their current OPI score.
In other words, ties will be broken by favoring pairings with the most growth for inclusion in the
Bottom 25 Percent Growth sub-component.
Table 18 provides the Reading data from the previous Overall Growth discussion. For this
group, the bottom 25 percent would consist of the 60 students with the lowest reading pre-
scores (240 X .25 = 60). In other words, for this specific example, the bottom 25 percent would
include all students who scored “Unsatisfactory” or “Limited Knowledge” on the previous test

Copy as of: Friday, January 31, 2014
21
and the 14 students with the lowest OPI scores among those who scored
“Satisfactory/Proficient” on the previous test (16 + 30 + 14 = 60).
Table 18: Summary of Reading Pre-Score to Post-Score Proficiency Level
Previous
Proficiency
Level
Current Proficiency Level
Unsatisfactory
Limited
Knowledge Proficient Advanced Total
Added to
bottom 25%
Unsatisfactory 4 8 4 0 16 16
Limited Knowledge 0 20 10 0 30 30
Proficient 0 10 110 20 140 14
Advanced 0 0 18 36 54 0
Total 4 38 142 56 240 60
Likewise, Table 19 repeats the Math data from the previous discussion. For this group, the
bottom 25 percent would consist of the 61 students with the lowest reading pre-scores (246 X
.25 = 61.5; rounded down). In other words, the bottom 25 percent would include all students
who scored “Unsatisfactory” on the previous test and 31 students with the lowest OPI score
among those who scored “Limited Knowledge” on the previous test (30 + 31 = 61).
Table 19: Summary of Mathematics Pre-Score to Post-Score Proficiency Level
Previous
Proficiency
Level
Current Proficiency Level
Unsatisfactory
Limited
Knowledge Proficient Advanced Total
Added to
bottom 25%
Unsatisfactory 14 10 6 0 30 30
Limited Knowledge 4 20 20 4 48 31
Proficient 2 16 100 20 138 1
Advanced 0 0 6 24 30 0
Total 20 46 132 48 246 62

Copy as of: Friday, January 31, 2014
22
Tables 20 and 21 provide the progress of the 60 lowest-performing students for Reading and
the 61 lowest performing students for Math, respectively.
Table 20: Reading Pre-Score to Post-Score Proficiency Level
Previous
Proficiency
Level
Current Proficiency Level
Unsatisfactory
Limited
Knowledge Proficient Advanced Total
Unsatisfactory 4 8 4 0 16
Limited Knowledge 0 20 10 0 30
Proficient 0 5 8 1 14
Table 21: Mathematics Pre-Score to Post-Score Proficiency Level
Previous
Proficiency
Level
Current Proficiency Level
Unsatisfactory
Limited
Knowledge Proficient Advanced Total
Unsatisfactory 14 10 6 0 30
Limited Knowledge 4 15 12 0 31
Copy as of: Friday, January 31, 2014
23
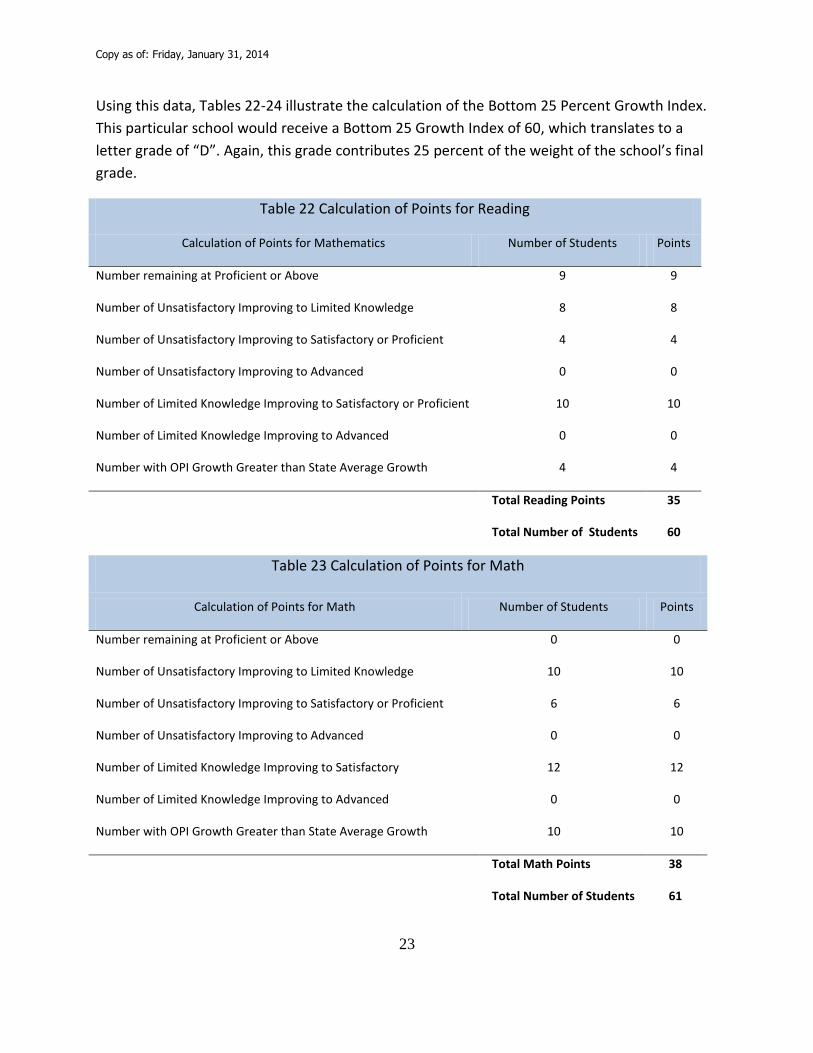
Using this data, Tables 22-24 illustrate the calculation of the Bottom 25 Percent Growth Index.
This particular school would receive a Bottom 25 Growth Index of 60, which translates to a
letter grade of “D”. Again, this grade contributes 25 percent of the weight of the school’s final
grade.
Table 22 Calculation of Points for Reading
Calculation of Points for Mathematics Number of Students Points
Number remaining at Proficient or Above
Number of Unsatisfactory Improving to Limited Knowledge
9
8
9
8
Number of Unsatisfactory Improving to Satisfactory or Proficient 4 4
Number of Unsatisfactory Improving to Advanced 0 0
Number of Limited Knowledge Improving to Satisfactory or Proficient 10 10
Number of Limited Knowledge Improving to Advanced 0 0
Number with OPI Growth Greater than State Average Growth 4 4
Total Reading Points 35
Total Number of Students 60
Table 23 Calculation of Points for Math
Calculation of Points for Math Number of Students Points
Number remaining at Proficient or Above
Number of Unsatisfactory Improving to Limited Knowledge
0
10
0
10
Number of Unsatisfactory Improving to Satisfactory or Proficient 6 6
Number of Unsatisfactory Improving to Advanced 0 0
Number of Limited Knowledge Improving to Satisfactory 12 12
Number of Limited Knowledge Improving to Advanced 0 0
Number with OPI Growth Greater than State Average Growth 10 10
Total Math Points 38
Total Number of Students 61

Copy as of: Friday, January 31, 2014
24
Table 25 Calculation of Bottom 25% Growth Index
Number of
Students
Number of
Points
Calculation
Points ÷ Students Letter Grade
Reading 60 35 35 ÷ 60 X 100 58 = F
Mathematics 61 38 38 ÷ 61 X 100 63 = D
Total 121 73 72 ÷ 107 X 100 60 = D

Copy as of: Friday, January 31, 2014
25
Bonus Points Schools can receive up to 10 bonus points to be applied toward their final grade. Bonus items
and/or their point value differ depending on whether the site is an elementary, middle or high
school. Each component is all or nothing (e.g., if attendance is worth six points, then a school
will either receive all six or zero points).
Each school will be classified as elementary, middle or high school based on the highest grade
served in the school (sixth for
elementary school, 10th for middle
school, and 11th or 12th for high school).
For example, if a school serves students
in grades two through six, then the
school will be classified as an elementary
school. If the school serves students in
grades seven through nine, it will be
classified as a middle school. If a school
serves grade 11 or above, then it will be
classified as a high school. Table 26
serves as a guide for classification. It is
important to note that this classification
is for the distribution of bonus points
only and does not necessarily match the
classification assigned via the Office of
Accreditation.
Below is a brief description of the criteria
for elementary, middle and high schools.
A more detailed description of each
criterion will follow:
Elementary Schools
Elementary schools can earn 10 bonus
points for achieving an attendance rate of 94 percent or higher.
Middle Schools
Middle schools can earn six bonus points for achieving an attendance rate of 94 percent or
higher. Schools can earn an additional two points if their dropout rate is equal to or lower than
Highest Grade
Served
Table 26
Elementary Middle High
Kindergarten Yes
First Yes
Second Yes
Third Yes
Fourth Yes
Fifth Yes
Sixth Yes
Seventh Yes
Eighth Yes
Ninth Yes
Tenth Yes
Eleventh Yes
Twelfth Yes

Copy as of: Friday, January 31, 2014
26
0.9 percent. Finally, middle schools can earn two points for achieving a participation index of 30
or higher in advanced coursework.
High Schools
High schools can earn five bonus points if their four-year adjusted cohort graduation rate is 90
percent or higher. High schools can also earn one additional bonus point for meeting the
performance target on each of the following criteria: participation or performance in advanced
coursework, participation or performance in college entrance exams (ACT or SAT), low-
performing eighth-grade cohort graduation rate, overall EOI performance and year-to-year
growth in any of the above criteria.
Description of Each Criterion
This section explains how each criterion is calculated and what constitutes acceptable
performance.
Student Attendance (Elementary and Middle)7
Student Attendance is calculated as the Average Daily Attendance (ADA) divided by the
Average Daily Membership (ADM) and multiplying by 100 to create a percentage. ADA is
calculated by dividing the total number of days students were present by the number of days in
the school calendar. ADM is calculated by dividing the total number of days students were
enrolled in school by the number of days in the school calendar. These numbers are provided to
the Office of Accountability through State Aid. Note that pre-kindergarten is not included in the
attendance calculation. The final Student Attendance rate is rounded to the nearest whole
number, and bonus points will be awarded for attendance rates of 94 percent or higher.
Advanced Coursework (Middle)
Advanced coursework at the middle school level includes traditional high school courses for
students in eighth grade and below, pre-Advanced Placement courses or honors courses.
Middle schools can earn bonus points based on the participation and successful completion of
students taking advanced coursework. For schools that are categorized as middle schools and
also serve ninth and/or 10th grade, students in those grades can also receive credit for
advanced coursework as defined by the high school criteria (see below for courses that qualify
as high school advanced coursework).
7 Attendance is reported at the site level. Therefore, it is not possible to separate the attendance of residents and
non-residents for virtual sites. Thus, the report card for non-residents will receive the same attendance rate as the
report card for residents.

Copy as of: Friday, January 31, 2014
27
Successful completion is defined as receiving a “D” or better for every term grade. A
participation index will be calculated using the following formula:
Participation Index = (Number of successfully completed courses ÷ October 1 enrollment of grades 6 and
up) X 100
Calculations will be rounded to the nearest whole number. Because qualifying advanced
coursework will be very uncommon for students in grades pre-k through five, these grades will
be excluded from the denominator for middle school sites that serve them (pre-k to eighth-
grade schools). For example, if a middle school has 80 students in grades six through eight, 20
of which successfully completed two advanced courses each, then that school’s participation
index will be ((20 * 2) / 80) * 100 =50. Middle schools will earn bonus points with a participation
index of 30 or greater.
The Office of Accountability and Assessments will use the data provided by the Advanced
Coursework WAVE Application to calculate this bonus category.
Dropout Rate (Middle)
Middle schools can also earn bonus points based on the number of students reported as
dropouts to the Oklahoma State Department of Education on the Annual Dropout Report. The
calculation of the dropout rate will use the methodology set by the National Center for
Educational Statistics (NCES) for Common Core of Data [OAC 210:10-13-20(2)(B)(iii)] and as
defined in 70 O.S. § 35e.
NCES defines a dropout as an individual under the age of 19 who:
a) was enrolled in school at some time during the previous school year and was not
enrolled on Oct. 1 of the current school year; or
b) was not enrolled on Oct. 1 of the previous school year although expected to be in
membership (i.e., was not reported as a dropout the year before); and
C) has not graduated from high school or completed a state- or district-approved
educational program and
D) does not meet any of the following exclusionary conditions:
i) transfer to another public school district, private school, or state- or district-
approved education program,

Copy as of: Friday, January 31, 2014
28
ii) temporary school-recognized absence due to suspension or illness, or
iii) death.
More details about what does and does not count as a dropout can be found at the following
website: http://nces.ed.gov/pubs2013/2013309rev.pdf#page=33.
Because the dropout window follows the federal fiscal year (Oct. 1 through Sept. 30), the
dropout rate included on the A-F Report Card will be from the previous school year. The rate is
calculated using the following formula:
Dropout Rate = (Number of reported dropouts) ÷ (October 1 Enrollment) X 100%
The dropout rate will be rounded to the nearest 10th of a percent. Middle schools will receive
bonus points if their dropout rate is 0.9 percent or below.
Four-Year Adjusted Cohort Graduation Rate (High School)
As with the dropout data for middle schools, the four-year adjusted cohort graduation rate
(hereafter referred to as the four-year graduation rate) will be calculated using graduation data
from the previous year.
The four-year graduation rate is defined by the U.S. Department of Education in 34 C.F.R. §
200.18 (b)(i)(A) and 70 OS § 3-151.1 as “the number of students who graduate in four years with
a regular high school diploma divided by the number of students who form the adjusted cohort
for that graduating class" (i.e., entered high school four years earlier, adjusting for transfers in
and out, émigrés and deceased students).
In other words, students will be assigned to a cohort based on the year they are expected to
graduate on a four-year plan. For example, students entering the ninth grade in the 2009-2010
school year would be assigned to the 2013 cohort. The four-year graduation rate will then be
calculated using the following formula:
The school that the student was last enrolled in at the end of the reporting year (e.g., Sept. 30,
2013 for the 2013 cohort) will be the school that is held accountable for that student (although
Copy as of: Friday, January 31, 2014
29
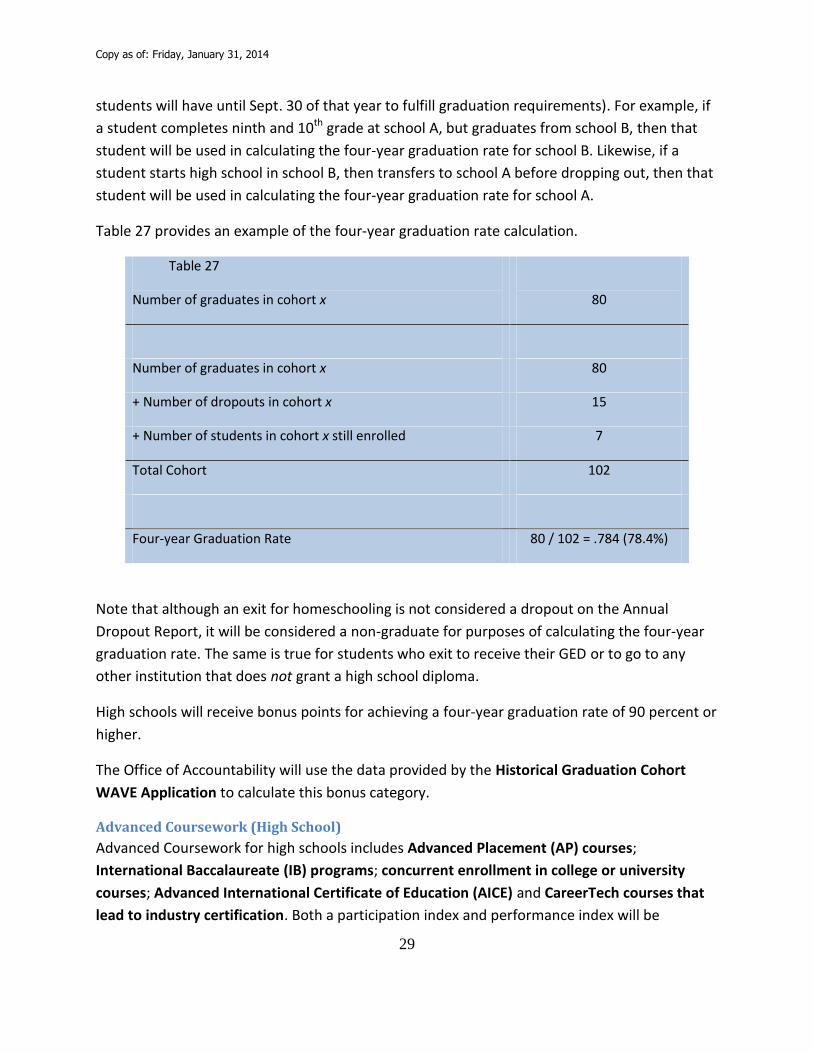
students will have until Sept. 30 of that year to fulfill graduation requirements). For example, if
a student completes ninth and 10th grade at school A, but graduates from school B, then that
student will be used in calculating the four-year graduation rate for school B. Likewise, if a
student starts high school in school B, then transfers to school A before dropping out, then that
student will be used in calculating the four-year graduation rate for school A.
Table 27 provides an example of the four-year graduation rate calculation.
Table 27
Number of graduates in cohort x
80
Number of graduates in cohort x 80
+ Number of dropouts in cohort x 15
+ Number of students in cohort x still enrolled 7
Total Cohort 102
Four-year Graduation Rate 80 / 102 = .784 (78.4%)
Note that although an exit for homeschooling is not considered a dropout on the Annual
Dropout Report, it will be considered a non-graduate for purposes of calculating the four-year
graduation rate. The same is true for students who exit to receive their GED or to go to any
other institution that does not grant a high school diploma.
High schools will receive bonus points for achieving a four-year graduation rate of 90 percent or
higher.
The Office of Accountability will use the data provided by the Historical Graduation Cohort
WAVE Application to calculate this bonus category.
Advanced Coursework (High School)
Advanced Coursework for high schools includes Advanced Placement (AP) courses;
International Baccalaureate (IB) programs; concurrent enrollment in college or university
courses; Advanced International Certificate of Education (AICE) and CareerTech courses that
lead to industry certification. Both a participation index and performance index will be

Copy as of: Friday, January 31, 2014
30
calculated for high schools. A high school will be able to earn one bonus point if it satisfies the
requirement for either participation or performance. The participation index will be calculated
using the following formula:
As with middle schools, successful completion is defined as receiving a “D” or better for every
semester/trimester. Students participating in a block schedule will need to receive a “D” or
better in two quarterly grades. For high schools, however, the numerator will include all
students enrolled, whereas the denominator only considers the enrollment for 11th and 12th
grades. For example, school A serves grades nine-12 and has 20 students in each grade. Thirty
students in school A successfully complete two advanced courses each. School A’s participation
index will be ((30 * 2) / (20 + 20)) * 100 = 150.
The performance index will be calculated using the following formula:
The performance index is rounded to the nearest whole number. For most courses, a
completed course will qualify for performance if the student receives a “C” or better for every
semester/trimester. Students participating in a block schedule will need to receive a “C” or
better in two quarterly grades. IB and AP courses, however, will qualify for performance if the
student receives a “4” on the IB exam or a “3” on the AP exam. For example, if school A has 60
advanced courses that count toward participation, but only 55 qualified for performance, then
school A would receive a performance index of (55 / 60) * 100 = 92.
High schools can earn the bonus point if at least one of the following applies:
The participation index is 70 or greater.
The performance index is 90 or greater.
The Office of Accountability will use the data provided by the Advanced Coursework WAVE
Application to calculate this bonus category in addition to data provided by the districts (for IB

Copy as of: Friday, January 31, 2014
31
courses), the College Board (for AP exams) or CareerTech (for courses that lead to industry
certification).
College Entrance Exams (High School)8
Schools can also receive a bonus point for college entrance exam (ACT or SAT) participation or
performance. Each year ACT and the College Board deliver to the State Department of
Education a file containing all students scheduled to graduate in the current year (i.e., current
12th graders) with all of their ACT/SAT scores. Students will be counted one time for each
examination (ACT or SAT), regardless of the number of times either exams are taken. The most
recent test score on file will be used. The school that is listed on the exam record is the school
that will receive credit for the exam. Only exams taken on nationwide testing days will be
included.
Entrance exam participation will be calculated by dividing the total of entrance exams
associated with a school by the total number of 12th graders on the Oct. 1 Accreditation Report.
Entrance exam performance will be calculated by dividing the number of exams associated with
a school that has met a pre-determined score (20 or greater for the ACT and 1,410 or greater
for the SAT) by the total of entrance exams associated with a school.
High schools will receive bonus points when either a participation rate or a performance rate is
75 percent or better.
Low Performing Eighth Grade Cohort Graduation Rate (High School)
High schools can also receive a bonus point for helping low-achieving eighth-grade students
graduate from high school in four years. Low-achieving students are defined as those scoring
“Limited Knowledge” or “Unsatisfactory” on the eighth-grade Reading or Mathematics OSTP
assessments. The formula for computing this graduation rate is identical to the four-year
graduation rate except that instead of using all students within a cohort, only students who
scored below “Proficient” on the eighth-grade Reading or Math OSTP assessment will be
included:
8 Because of limitations in the data, college entrance exams are coded to the school rather than the individual
student. Therefore, it is not possible to separate the performance/participation of residents and non-residents for virtual sites. Thus, the report card for non-residents will receive the same performance and participation indices as the report card for residents.

Copy as of: Friday, January 31, 2014
32
Table 28 provides an example of the Low-Performing Eighth-Grade Cohort Graduation Rate.
Table 28
Number of low performing graduates in cohort x
28
Number of low performing graduates in cohort x 28
+ Number of low performing dropouts in cohort x 8
+ Number of low performing students in cohort x still enrolled 3
Total low performing Cohort 39
Low Performing 8th grade Graduation Rate 28 / 39 = .718 (71.8%)
High schools will receive a bonus point for achieving a Low-Performing Eighth-Grade Cohort
Graduation Rate of 85 percent or above.
Overall EOI Performance
High schools can earn bonus points if 80 percent of graduates from the previous year have
scored either a “Proficient” or “Advanced” on six out of the seven EOI assessments (Algebra I,
Algebra II, English II, English III, Biology I, US History and Geometry). Only actual EOI exams (i.e.,
no alternative exams or placement) can count toward the fulfillment of this bonus point.
Year-to-Year Growth
As data become available, high schools can earn bonus points by improving their rates in at
least three of the five previous bonus sections from year to year. The specific criterion for
improvement is dependent on the bonus section.
For graduation rates, high schools must improve by at least 10 percent of the difference
between the previous year’s graduation rate and 100 percent. For example, if school A had a
graduation rate of 80 percent on the previous report card, then school A would need to
increase its graduation rate by ((100 – 80) * .1) = 2 percent to 82 percent in order to qualify as
improvement.
For college entrance exams and overall EOI performance, highs schools must again improve by
at least 10 percent of the difference between the previous year’s rate and 100 percent. The
performance may occur either in participation or performance for the entrance exams.

Copy as of: Friday, January 31, 2014
33
For advanced coursework, high schools must improve by 5 percent of the original index or
more.
Additionally, maintaining satisfactory performance on any of the previous categories for two
consecutive years (i.e., receiving bonus points in the same category for both the previous and
current years’ report cards) will be considered as improvement. Thus, for example, a school
with a graduation rate of 100 percent for two consecutive years will still be able to count
graduation rate toward their year-to-year growth.
District Report Cards District report cards will be calculated in exactly the same manner as site report cards with the
following exceptions:
Students who are NFAY for the school site but FAY for the district will be included in the
calculations.
Districts are not eligible for bonus points.
Current ninth grade students who previously took an EOI in middle school grades will
not be carried forward at the district level.
State Report Card The State report card will be calculated in exactly the same manner as the district report cards
with the following exception:
Students who are NFAY for the district but FAY for the state will be included in the
calculations.
Appendix A: Supplemental Information Each report card will also contain a variety of supplemental summary statistics as mandated by
the U.S. Department of Education. This information will be for reporting purposes only, and will
not be used in any grade calculations. To ensure FERPA compliance, any statistic that consists of
fewer than 10 students will not be reported.
Assessment Data
The following information will be presented in charts/tables for all students (FAY and NFAY
combined) and for all subgroups (race, ethnicity, gender, IEP status, migrant status, ELL status
and Free/reduced lunch status) where applicable:

Copy as of: Friday, January 31, 2014
34
AMOs (actual performance and target) Percentage of students at each proficiency level (total)
The following will be presented for all students:
Percentage of students tested by subjects not covered in AMOs Comparison of proficiency rates with previous year, district and state by subject and grade The number of recently arrived ELL students exempted from ELA assessment Original performance levels for OMAAP and OAAP exams (before the 3 percent cap adjustment)
School Designation
If the school receives a designation (Focus, Priority, Targeted Intervention or Reward), then it
will be displayed here. District report cards will have a list of all district schools with each
designation.
Graduation Rate
District and State four- and five-year graduation rates (lagged one year) will be given here in
order to compare with the site (if applicable).
College Information
This section will report the following information for all students (FAY and NFAY combined) and
for all subgroups (race, ethnicity, gender, IEP status, migrant status, ELL status and
Free/reduced lunch status) where applicable:
The total number of students earning a regular high school diploma
The number and percentage of four-year graduates (lagged one year; if applicable) who have enrolled in an in-state Institute of Higher Education (IHE)
The number and percentage of four-year graduates (lagged three years) enrolled in a public IHE within 16 months of graduation who have completed at least one year’s worth of college credit within two years of initial enrollment
Teacher Quality Information
For the state report card only, the following data will also be aggregated across schools in the
top and bottom quartiles of Free/reduced lunch status:
Percentage of teachers with bachelor’s, master’s or doctoral degrees
Percentage of teachers with special licensure
Percentage of classes in core subjects (English, Reading/Language Arts, Math, Science, Foreign Language, Civics, Government, Economics, Arts, History and Geography) taught by Highly Qualified Teachers (state certified, has at minimum a bachelor’s degree and has demonstrated competence in the subject area s/he is teaching)

Copy as of: Friday, January 31, 2014
35
National Assessment of Educational Progress (NAEP) statistics
NAEP statistics cannot be disaggregated beyond the state level. Thus, this section will be the
same for all report cards and will include:
Percentage of students at each NAEP achievement level for reading and math (grades four and eight) for all students and disaggregated by race, ethnicity, IEP status, ELL status and Free/reduced lunch status
Participation rates for IEP and ELL students
Contact Information Office of Accountability and Assessments
Email: [email protected] Phone: (405) 521-3341
Maridyth McBee, Ph.D.
Assistant State Superintendent of Accountability and Assessments
Email: [email protected] Phone: (405) 522-5169
Michael Tamborski, Ph.D.
Executive Director of Accountability
Email: [email protected] Phone: (405) 521-3341
Glossary ACT. A college placement exam offered multiple times per year. The ACT has four major sub-
tests assessing English, mathematics, reading and science reasoning.
Advanced. One of the four possible performance levels on an OSTP exam. Advanced means
that the student demonstrates superior performance on challenging subject matter.
Advanced Coursework WAVE Application. The Advanced Coursework WAVE application is the
WAVE application through which a district can view and certify the data used to calculate the
advanced coursework bonus points.
Advanced International Certificate of Education (AICE). AICE is one of the types of coursework
that qualifies for the advanced coursework bonus points for high school. AICE is a rigorous
curriculum intended to prepare students for honors programs in higher education. To date, it is
not being offered by any Oklahoma school.
Advanced Placement (AP) courses. AP is one of the types of coursework that qualifies for the
advanced coursework bonus points for high school. AP courses offer a college-level curriculum

Copy as of: Friday, January 31, 2014
36
to high school students with the opportunity for college credit. AP courses are identified in the
WAVE by an instructional level of “Advanced Placement” in the local student information
system.
A-F Report Card. The A-F Report Card is the end result of the A-F School Grading System. It
consists of three main components: Student Performance, Student Growth and bonus points
that are combined to produce an overall grade for each school and district.
A-F School Grading System. Oklahoma’s A-F School Grading System is based on the concept
that parents and community members should be able to quickly and easily determine how
students at their local schools are doing. This grading system is part of an effort to strengthen
the effectiveness and performance of public schools. As part of this effort, schools are required
to report standardized testing results to the Oklahoma State Department of Education. That
information is then used to generate a report card with an overall letter grade for each school
and its student body.
Annual Dropout Report. The Dropout Report is a report that districts submit to the Oklahoma
State Department of Education detailing all of the students who dropped out of school between
Oct. 1 and Sept. 30 of the most recent year.
Average Daily Attendance (ADA). ADA is calculated by dividing the total number of days
students were present in a site by the number of days in the school calendar for the district. A
student can be present for a portion of the day and still be counted in the ADA.
Average Daily Membership (ADM). ADM is calculated by dividing the total number of days
students were enrolled in school by the number of days in the school calendar. A student must
be enrolled for the entire school day to count toward the ADM.
Bonus Points. Bonus Points are the third major component of the report card and are worth a
maximum of 10 points. The criteria for bonus points are dependent on whether the school is an
elementary, middle or high school. Bonus points are treated as extra credit in the calculation of
the overall grade.
Bottom 25 Percent Growth Index. The Bottom 25 Percent Growth Index is calculated by
comparing the bottom 25 percent (as determined by a rank order of previous years’ tests) of
the students used to calculate the overall growth index.
CareerTech courses that lead to industry certification. This is one of the types of coursework
that qualifies for the advanced coursework bonus points for high school. CareerTech refers to
the Oklahoma Department of Career and Technology Education. As only courses taken at a
Copy as of: Friday, January 31, 2014
37
CareerTech center can count as leading to an industry certification, all qualifying courses will be
provided by CareerTech. To learn more about CareerTech, go to http://www.okcareertech.org/.
College Board. An association responsible for developing and administering standardized tests
and curricula such as the SAT, PSAT and Advanced Placement (AP) tests.
Concurrent enrollment in college or university courses. Concurrent enrollment is one of the
types of coursework that qualifies for the advanced coursework bonus points for high school.
The WAVE identifies concurrent enrollment by an instructional level of “college level” in the
local student information system.
County code. Each of the 77 counties in Oklahoma has been assigned a two-digit number (01-
77) in order to make it easier to identify. This is the first part of the three-step process that
creates the nine-character Fullcode (the combination of the County, District and Site codes),
which is used to identify a specific school site.
District code. The District code is a four-character code beginning with a letter and ending with
three digits. This is the second part of the three-step process that creates the nine-character
Fullcode (the combination of the County, District and Site codes), which is used to identify a
specific school site.
Dropout. A dropout is an individual under the age of 19 who: a) was enrolled in school at some
time during the previous school year and was not enrolled on October 1 of the current school
year; or b) was not enrolled on October 1 of the previous school year although expected to be
in membership (i.e., was not reported as a dropout the year before); and C) has not graduated
from high school or completed a state- or district-approved educational program and D) does
not meet any of the following exclusionary conditions: i) transfer to another public school
district, private school, or state- or district-approved education program, ii) temporary school-
recognized absence due to suspension or illness, or iii) death.
Eligible Student. Any student enrolled in third grade through eighth grade or taking a high
school course associated with an EOI is considered an eligible student unless s/he has a first-
year English Language Learner exemption, an emergency exemption for medical reasons or an
exemption due to previous demonstration of mastery (Algebra II, English II, Geometry and US
History EOIs only) approved by the State Department of Education. Sites are responsible for 100
percent of eligible students enrolled during the testing window.
Eligible test records. For purposes of calculating participation rates, the test records of all
eligible students except those identified as “Other Placement” are eligible test records. For

Copy as of: Friday, January 31, 2014
38
purposes of calculating student performance, the test records of all eligible students except
those identified as “Other Placement” or “NFAY” are eligible test records. Each student can only
count once for each site and for each test. If a student has multiple records for the same testing
subject at the same site, then records with valid scores are given preference to records without
valid scores.
Elementary School. For purposes of the A-F Report Card, an elementary school is any school
where the highest grade served is the sixth grade or lower.
End-of-Instruction (EOI) Exams. End-of-Instruction (EOI) exams are given at the completion of
core high school courses (Algebra I, Algebra II, Geometry, Biology I, English II, English III and US
History).
Feeder Pattern School. A feeder patter school is a school in which 60 percent or more of the
students from a school without tested grades (three-12) are enrolled upon promotion to third
grade.
Final Report Card Index. This index is the zero-110 scale that determines the Final Letter Grade
of a school, district or state.
Final letter grade. The final letter grade is the grade (A-F) given to each school, district or state
based on the Final Report Card Index.
Four-Year Adjusted Cohort Graduation Rate. The Four-Year Adjusted Cohort Graduation Rate is
the number of students who graduate in four years with a regular high school diploma divided
by the number of students who form the adjusted cohort for that graduating class (i.e., entered
high school four years earlier, adjusting for transfers in and out, émigrés and deceased
students).
Full Academic Year (FAY)/Not Full Academic Year (NFAY). A student is considered Full
Academic Year (FAY) for a particular exam if s/he has been continuously enrolled from the first
day of October to the time of the test administration and has not experienced an enrollment
lapse (dropped from enrollment) of 10 or more consecutive school days throughout that
timeframe. Please note that depending on when tests are administered, it is possible for a
student to be FAY for some exams but not others. Students who are not FAY are considered
NFAY for either the site, district or state. Students who are “NFAY site” are students who do not
qualify for FAY status at the site level but do qualify within the district. Students who are “NFAY
district” are students who do not qualify for FAY status at the site or district level but do qualify
within the state. Finally, students who are “NFAY state” are students who do not qualify for FAY
status at the site, district or state level.

Copy as of: Friday, January 31, 2014
39
High School. For purposes of the A-F Report Card, a high school is any school where the highest
grade served is the 11th or 12th grade.
Historical Graduation Cohort WAVE Application. The Historical Graduation Cohort WAVE
Application is the WAVE application through which districts can view and certify the data that
will be used to calculate the graduation bonus points.
Honors Course. An honors course is one of the types of coursework that qualifies for the
advanced coursework bonus points for middle school. Honors courses are intellectually
challenging and require rigor beyond the traditional course. Honors courses are identified in the
WAVE by the instructional level set by the local student information system.
International Baccalaureate (IB) programs. IB is one of the types of coursework that qualifies
for the advanced coursework bonus points for high school. IB is a two-year program that
focuses on interdisciplinary and critical thinking. IB course information is provided directly to
the State Department of Education by the districts that offer it.
Limited Knowledge. One of the four possible performance levels on an OSTP exam. “Limited
Knowledge” means that the student demonstrates partial mastery of the essential knowledge
and skills appropriate to their grade level, course or level of education as applicable.
Middle School. For purposes of the A-F Report Card, a middle school is any school where the
highest grade served is between the seventh and 10th grade (inclusive).
No Child Left Behind (NCLB). The No Child Left Behind Act of 2001 (NCLB) is the reauthorization
of the Elementary and Secondary Education Act (ESEA) first passed by the U.S. Congress in
1965. NCLB requires that all states, including Oklahoma, establish state academic standards and
assessments that meet federal requirements for monitoring the Adequate Yearly Progress of
schools. Failure to meet Adequate Yearly Progress results in a district or school being placed in
District/School in Need of Improvement status. In 2011, Oklahoma submitted a request to the
U.S. Department of Education for waivers of certain ESEA requirements. These waivers allow
the State to implement a series of reforms, including the A-F School Grading System, that will
lead to college, career and citizen-readiness for all students.
Office of Accountability and Assessments. The Office of Accountability and Assessments is the
division of the Oklahoma State Department of Education charged with administering the
Oklahoma State Testing Program (Assessments) and using those test results to implement a
system of recognition, accountability and support as required by the ESEA Flexibility Waiver
(Accountability). This is not to be confused with the Office of Educational Quality and
Accountability, which is overseen by the Oklahoma Secretary of Education.

Copy as of: Friday, January 31, 2014
40
Office of Accreditation. The Office of Accreditation is a division within the State Department of
Education that monitors and assures compliance with the School Laws of Oklahoma.
Oklahoma Alternative Assessment Program (OAAP). The Oklahoma Alternate Assessment
Program (OAAP), or Portfolio assessment, is designed to assess students whose cognitive
disabilities prevent them from being able to complete an OCCT or EOI exam. The OAAP is
implemented by the Department of Special Education within the State Department of
Education.
Oklahoma Core Curriculum Tests (OCCT). The OCCT is the general testing program for grades
three through eight administered in Oklahoma public schools. Reading and Math tests are
administered in grades three through eight. Science, Social Studies and Writing tests are given
in the fifth grade. A Geography test is given in the seventh grade. Science, US History and
Writing tests are given in the eighth grade.
Oklahoma Performance Index (OPI). The OPI is the standardized scale score for OCCT and EOI
exams. An OPI score of 700 is set to be the threshold for a proficient performance level.
Oklahoma State Department of Education. The State Department of Education is the state
education agency for Oklahoma tasked with the administration of Oklahoma’s public school
system. Its mission is to improve student success through: service to schools, parents and
students; leadership for education reform; and regulation/deregulation of state and federal
laws to provide accountability while removing any barriers to student success.
Oklahoma State Testing Program (OSTP). The OSTP refers to all tests administered pursuant to
the Oklahoma School Testing Program Act (70 O.S. § 1210.505). These include all OCCT, EOI and
OAAP tests.
One Percent Cap. The United States Department of Education set a cap of 1 percent on the
percentage of students within a district whose scores can be counted as Proficient or Advanced
based on an assessment using alternate achievement standards. The alternate assessment used
in Oklahoma is the Oklahoma Alternate Assessment Program (OAAP). The cap is only applied to
OCCT Reading, OCCT Math, Algebra I and English II exams. The cap is determined by first
calculating 1 percent (rounded up) of all test takers in the district, regardless of FAY or second-
time test status, in each of the four testing subjects. This result (the number of OAAP exams
allowed) is divided by the total number of Proficient or Advanced OAAP exams (FAY and first-
time tests only) in the district in that testing subject. This produces a ratio of the number of
OAAP exams allowed to count as Proficient or higher to the actual number of OAAP exams that
scored Proficient or higher. As a formula:

Copy as of: Friday, January 31, 2014
41
If this ratio is greater than or equal to 1.0 for a testing subject, then no OAAP exams will need
to be adjusted in the district for that subject. If the ratio is less than 1.0, then it is multiplied by
the number of Proficient or Advanced OAAP exams (FAY and first-time tests only) at each site.
The result (rounded up) is the number of OAAP exams for the site that are allowed to count as
Proficient or Advanced. Any OAAP exams above that cap must then be counted as Limited
Knowledge in the Performance component of the A-F Report Card. Please note that the 1
percent cap only applies to accountability measures and does not overwrite the original
performance level that goes on the student record. For more details, please see the “OAAP (1
percent) Explanation” document at:
http://ok.gov/sde/sites/ok.gov.sde/files/documents/files/Appendix_B-
One_Percent_Explanation.pdf.
Other Placement. A student placed by state or court order in a facility within a district other
than the student’s original district of residence, or a student placed in a healthcare facility in a
district other than the student’s original district of residence, is considered to be “Other
Placement.”
Overall Growth Index (GI). The Overall Growth Index is calculated based on comparing student
performance on all eligible exams administered in the Oklahoma State Testing Program (OSTP)
during the most recent school year with a comparable exam from a previous school year.
Performance Index (PI). The Performance Index (PI) is calculated based on student
performance on all eligible exams administered in the Oklahoma State Testing Program (OSTP)
during the most recent school year.
Pre-Advanced Placement (Pre-AP) Course. Pre-AP is one of the types of coursework that
qualifies for the advanced coursework bonus points for middle school. Pre-AP is based on the
expectation that all students can perform well at rigorous academic levels and the belief that it
students can prepare for higher intellectual engagement as early as possible by starting the
development of skills and acquisition of knowledge. Addressed effectively, the middle and high
school years can provide a powerful opportunity to help all students acquire the knowledge,
concepts and skills needed to engage in a higher level of learning. Pre-AP courses will be
identified in the WAVE if either “Pre-AP” is the course title or if the instructional level of the
course is set to “honors” in the local student information system.

Copy as of: Friday, January 31, 2014
42
Proficient. One of the four possible performance levels on an OSTP exam. “Proficient” means
that the student demonstrates mastery of appropriate grade-level subject matter and that the
student is ready for the next grade, course or level of education, as applicable.
Public school site. Any site that provides free educational services and is funded by state, local
and/or federal government is considered a public school.
Resident students/ Non-Resident Students. The residence for any child in Oklahoma is the
school district in which the parent(s), guardian(s) or person(s) having legal custody holds legal
residence. Any student who receives services from a district outside of his/her residence is
considered a Non-Resident Student. If the student receives services from the district in which
they reside, then s/he is a Resident Student.
SAT. The SAT reasoning test is a college placement exam administered by the College Board. It
has three main sections: Mathematics, Critical Reading and Writing.
School of Residence. The school of residence is the school associated with the legal residence
of a child’s parent(s), guardian(s) or person(s) having legal custody.
Second Time Test. This status applies to any EOI exam that is not administered at the end of
the instruction in that subject. This includes both retakes and EOI exams given to students
transferring from out of state in order to fulfill ACE graduation requirements.
Site code. Each site is assigned a three-digit code from 100-989 that denotes the grade range of
the school. This is the third part of the three-step process that creates the nine-character
Fullcode (the combination of the County, District and Site codes), which is used to identify a
specific school site.
State Aid. The State Aid office is responsible for the state education funding formula, school
activity funds and grants distribution.
State Testing Numbers (STN). The STN, or State Testing Number, is a unique 10-digit ID
assigned by the State Department of Education to associate a student longitudinally to records.
It is assigned upon enrollment in any school in Oklahoma, and remains with a student until
graduation. If the student leaves the state for any reason and then later returns, then the
original ID is still valid.
Student Attendance. Student attendance is a bonus point category for elementary and middle
schools. It is calculated by dividing the Average Daily Attendance with the Average Daily
Membership.

Copy as of: Friday, January 31, 2014
43
Term Grade. Term Grades are the grades used to determine whether a course qualifies for the
participation or performance indices for the advanced coursework bonus points. These will be
either semester or trimester grades depending on the school calendar in the district.
Traditional High School Courses. One of the types of coursework that qualifies for the
advanced coursework bonus points for middle school. To be eligible, the course must have a
state course code in the local student information system indicating the course is high school
level, and the student enrolled in it must be enrolled in grades six through eight.
U.S. Department of Education. The U.S. Department of Education is a division of the U.S.
federal government that administrates federal assistance to public schools across the nation.
Unique Student. For purposes of the A-F Report Card, students are differentiated by their State
Testing Numbers (STNs). Thus, the number of unique students is determined by the number of
unique STNs in the testing data.
Unsatisfactory. One of the four possible performance levels on an OSTP exam. “Unsatisfactory”
means that the student does not perform at least at the “Limited Knowledge” level.
Valid Score. Any record that has a performance level between one and four is a valid score. Any
test record in which five or more questions have been attempted will be given a performance
level. All fifth- and eighth-grade Writing exams will also be considered to have a valid score
unless an explanation for why there is no response for that student is given (e.g., the student
was absent, no longer enrolled, etc.).
WAVE. The WAVE is Oklahoma’s statewide student information system.
Recommended