2013 AUSTRALIAN AFFILIATEBENCHMARKING SURVEY SURVEY RESULTSAn independent study into the current usage and intention of Australian companies engaging in affiliate marketing, commissioned by dgmAustralia and conducted by edentify in September 2013
Supported By

2For more information contact [email protected] | +61 2 8569 0000 | www.dgm-au.com
COntents
Executive Summary / Five Key Findings ....................................................................... 03
Finding 1: There are signs of solid growth for both agencies and direct advertisers ........... 04
Finding 2: Fashion Retailers are the newcomers while Finance are the old-hands ............. 14
Finding 3: Coupons, cash back and loyalty/rewards are growing ...................................... 27
Finding 4: Lots of new entrants indicate more room for growth ........................................ 30
Finding 5: Mobile has more potential ........................................................................... 33
Methodology ............................................................................................................. 36
About dgmdgm works with Australia’s leading advertisers, web site publishers and agencies to devise and deliver online marketing campaigns across key areas of search engine marketing, affiliate marketing and display advertising. dgm’s clients have access to sophisticated proprietary technology and are guided by experienced account management and consultancy teams, to achieve high-performing online marketing campaigns that fulfill their business objectives such as more leads, more sales and greater brand awareness.Web: www.dgm-au.comFollow: http://twitter.com/dgmAustraliaFacebook: http://www.facebook.com/dgmaustraliaLinkedIn: http://www.linkedin.com/company/684702?trk=NUS_CMPY_FOL-nhre
About edentifyEdentify focuses on developing consumer insight technology, finding new and innovative ways of collecting information and providing businesses with the tools to quickly understand and analyse results.
We combine innovations in technology with a high quality service performed by a dedicated research project management team.
We have been developing our research tools and service in Australia and overseas since the beginning of 2000, being one of the first companies specialising in online research in Australia.Web: http://www.edentify.com.au

3For more information contact [email protected] | +61 2 8569 0000 | www.dgm-au.com
Executive Summary
dgm is pleased to announce the results of our second Australian Affiliate Benchmark Survey. The study, conducted by edentify, commissioned by dgm and supported by PerformanceIN had a total of 156 respondents, with 39 respondents from media agencies and 117 from client side.
This is the second annual study into the use of affiliate marketing by media agencies and advertisers in Australia. This year, the study received a total of 156 responses, with media agencies accounting for 39 respondents and direct clients 117 respondents.
This year, a series of questions on mobile were added, as that channel continues to grow in importance.
The dominant sectors among direct clients were Finance and Retail, with a high number of new entrants this year from Fashion Retail.
Overall indications are that there is still plenty of room for growth in affiliate marketing as spending levels and intentions for the future remain strong.
KEY FINdINGSFinding 1There are signs of solid growth for the affiliate marketing channel across both media agencies and direct clients
Finding 2Fashion Retailers are the newcomers to the affiliate marketing channel, while Finance are the old-hands
Finding 3Coupons, cash back, and loyalty/rewards have experienced growth in popularity as types of affiliate marketing being undertaken
Finding 4The high number of new entrants to affiliate marketing indicates there is more room for growth in the channel
Finding 5There is more potential for the mobile channel to deliver more sales, as well as more companies to adopt a mobile optimised web presence

4For more information contact [email protected] | +61 2 8569 0000 | www.dgm-au.com
Finding 1
There are solid signs of growth for the Affiliate Marketing sector overall. For the past year, 65% of respondents said they increased spend in the channel, and 18% said their spend remained the same. This is slightly higher than last year’s results of 63% and 14% respectively.
Expectations for the coming year are also strong, with around 6 in 10 respondents anticipating an increase in spend for 2014. This is similar for both agencies and direct clients. Overall, 17% of respondents expect their spend to remain static for 2014.
Compared to other online channels, 43% of respondents claim an increase in spend on affiliate over 2012 (vs 40% last year). For agencies, there has been a drop in those claiming an increase in spend on affiliate over other online channels, at 44% compared to 61% in 2012, which may be explained by agencies funnelling more spend into other Performance Channels including their trading desks. However for direct clients there has been an increase in those claiming greater affiliate spend at the expense of other online channels, at 43% this year compared to 29% last year.
Average spend is down for both agencies and direct clients, with 24% spending over $25,000 per month compared to 44% in 2012. However, there is a much higher number of respondents spending <$5,000 per month in this year’s survey, at 47% of respondents compared to 22% in 2012, and importantly, a much higher number of respondents saying they have engaged in affiliate marketing for less than a year (29% in 2013 vs 12% in 2012). This indicated a significant influx of new users to the channel and accounts for the drop in average spend.
Proportion attributed to the channelThis year, the gap has narrowed between agencies and direct clients when it comes to the amount of their budget allocated to the affiliate channel. While in 2012, 67% of agencies were spending upwards of 10% of their budgets on affiliate compared to 46% of direct clients, for 2013 the results are 48% for agencies and 39% for direct clients.
Cap or no capThe number of respondents who are capping their monthly spend on affiliate has halved since last year, to 22%. The most significant change in attitudes towards affiliate budgets has been in agencies, where now just 22% of respondents are capping budgets compared to 63% last year. For direct clients, capping has dropped from 34% of respondents in 2012 to 21% this year.
While there has been a slight decrease in respondents allocating their affiliate spend from the marketing budget, this remains largely true across the board with 79% saying their affiliate spend comes from marketing compared to 83% last year. However, the decrease in capped spending appears to be recognition that the affiliate channel is more closely related to sales than marketing – as publishers are only paid when transactions are verified.
Overall, three in four respondents indicated they currently engage in affiliate marketing, which is a slight drop from last year. While direct clients are still more likely to engage in affiliate marketing than agencies, the gap has narrowed, with 74% of agencies saying they engage in affiliate marketing this year compared to 69% last year. The gap between direct clients and agencies has dropped to 7 points, compared to 12 points last year.
There are signs of solid growth for the affiliate marketing channel across both media agencies and direct clients

5For more information contact [email protected] | +61 2 8569 0000 | www.dgm-au.com
Usage of Affiliate Marketing
❱ In total, three quarters of respondents indicated that they currently engage in affiliate marketing. This has dropped slightly from last year.
❱ As last year, direct clients are more likely to engage in affiliate marketing than agencies, however this gap has narrowed since last year to 7%pts (vs 12%pts).
Figure One: “Do you currently engage in affiliate marketing?”
Affiliate Marke,ng Use by Company: 2012 vs. 2013
Base 2012 n=134/2013 n=156
0% 10% 20% 30% 40% 50% 60% 70% 80% 90% 100%
Total Agency Direct
Q5: Do you currently engage in Affiliate Marke,ng?
2012
2013
• In total, three quarters of respondents indicated that they currently engage in Affiliate MarkeOng. This has dropped slightly from last year.
• As last year, direct clients are more likely to engage in Affiliate MarkeOng than agencies, however this gap has narrowed since last year to 7%pts (vs 12%pts).

6For more information contact [email protected] | +61 2 8569 0000 | www.dgm-au.com
Spend
❱ The proportion of advertisers spending $25k plus is down year on year, with 24% spending over $25k, compared to 44% in 2012.
❱ This trend applies to both agencies and direct clients.
Figure Two: “What is your average monthly spend on affiliate marketing?”
❱ Last year’s gap in allocation of spend between agencies and direct clients has narrowed, with 48% of agencies attributing 10% or more, compared to 39% of direct clients.
Figure Three: “What percentage of your online marketing spend is attributed to the affiliate channel?”
0%
10%
20%
30%
40%
50%
60%
70%
80%
90%
100%
Total 2012 Total 2013 Agency 2012 Agency 2013 Direct 2012 Direct 2013
Q8: % of online marke,ng spend aSributed to the affiliate channel
51%+
31-‐50%
21-‐30%
10-‐20%
<10%
Propor,on of online spend aSributed to the Affiliate Channel by Company Type: 2012 vs. 2013
Base 2012: Total n=98, Agency n=37. Direct n=67 Base 2013: Total 116; Agency n=27; Direct n=89
• Last year’s gap in allocaOon of spend between agencies and direct clients has narrowed, with 48% of agencies airibuOng 10% or more, compared to 39% of direct clients. This is mainly due to an increase in agencies spending under 10%.
Average Monthly Spend by Company Type: 2012 vs. 2013
Total 2012 Total 2013 Agency 2012
Agency 2013
Direct 2012 Direct 2013 0%
10%
20%
30%
40%
50%
60%
70%
80%
90%
100%
Q7: Average Monthly Spend on Affiliate Marke,ng
$101k +
$51k-‐$100k
$26k-‐$50k
$11k-‐$25k
$6k-‐$10k
$0k-‐$5k
Nil
Base 2012 n=104; Agency n=37; Direct n=67 Base 2013 n=116; Agency n=27; Direct n=89
• Average spend is down year on year, with 24% spending over $25k, compared to 44% in 2012. • This trend applies to both agencies and direct clients.
7For more information contact [email protected] | +61 2 8569 0000 | www.dgm-au.com
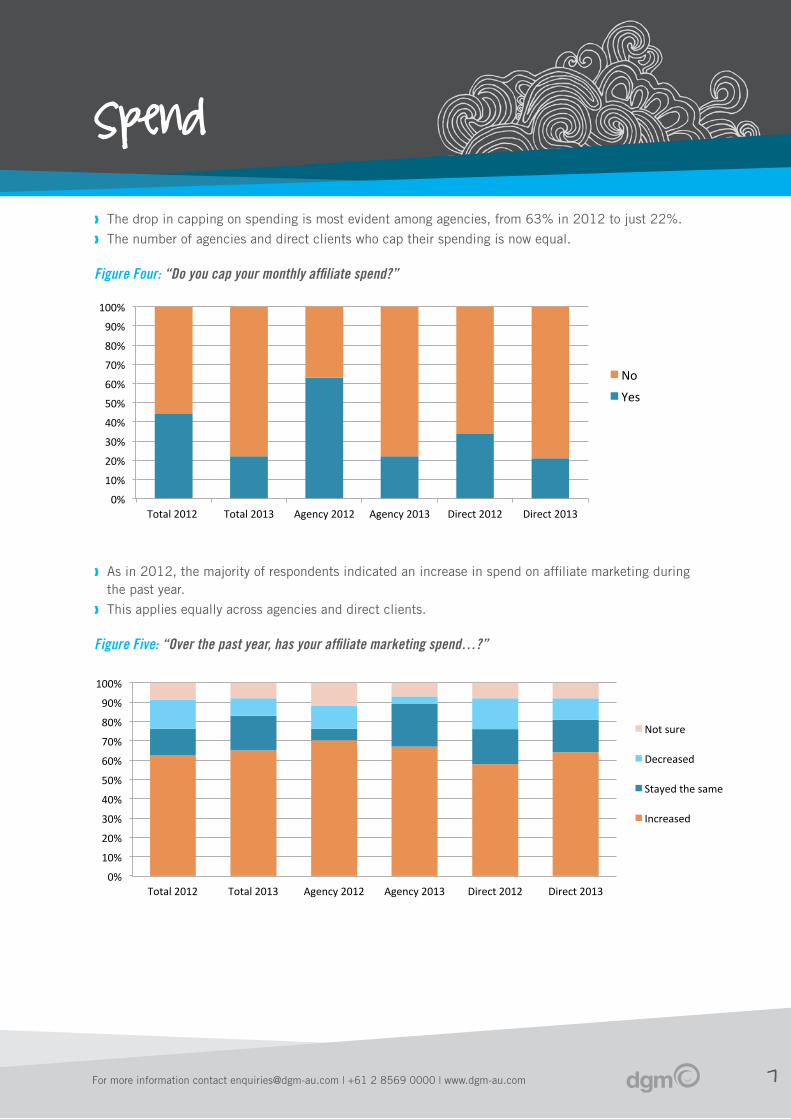
❱ The drop in capping on spending is most evident among agencies, from 63% in 2012 to just 22%.
❱ The number of agencies and direct clients who cap their spending is now equal.
Figure Four: “Do you cap your monthly affiliate spend?”
❱ As in 2012, the majority of respondents indicated an increase in spend on affiliate marketing during the past year.
❱ This applies equally across agencies and direct clients.
Figure Five: “Over the past year, has your affiliate marketing spend…?”
Change in Spend by Company Type: Past Year
Base 2012 n=94; Agency n=34; Client n =60 Base 2013 n=116; Agency n=27; Direct n=89
• As in 2012, the majority of respondents indicated an increase in spend on affiliate markeOng during the past year.
• This applies equally across agencies and direct clients.
Total 2012 Total 2013 Agency 2012 Agency 2013 Direct 2012 Direct 2013 0%
10%
20%
30%
40%
50%
60%
70%
80%
90%
100%
Q10: Over the past year, has your affiliate marke,ng spend:
Not sure
Decreased
Stayed the same
Increased
Cap on Monthly Affiliate Spend by Company Type: 2012 vs. 2013
Base 2012: Total n=98, Agency n=37. Direct n=67 Base 2013: Total 116; Agency n=27; Direct n=89
Total 2012 Total 2013 Agency 2012 Agency 2013 Direct 2012 Direct 2013 0%
10%
20%
30%
40%
50%
60%
70%
80%
90%
100%
Q9: Do you cap your monthly affiliate spend?
No
Yes
• The drop in capping on spending is most evident among agencies, from 63% in 2012 to just 22%. • The number of agencies and direct clients who cap their spending is now equal.
Spend

8For more information contact [email protected] | +61 2 8569 0000 | www.dgm-au.com
❱ Positivity about future spend continues from last year, with 6 in 10 confident that spending will go up over the next year – this applies to both agencies and direct clients.
❱ Direct clients intending to increase investment year on year increased from 53% in 2012 to 61% in 2013.
❱ The opposite was true of agencies with the number of respondents reporting an intent to increase spend dropping from 71% in 2012 to 63% in 2013.
Figure Six: “Thinking about your affiliate marketing spend over the next year, will it…?”
❱ Fewer agency respondents claim an increase in spend compared to last year, however there has been an increase in direct clients’ relative spend – 43% now claim an increase in spend compared to 29% in 2012.
Figure Seven: “Has your percentage of affiliate marketing spend increased in relation to your other online spend?”
Increase in Spend on Affiliate Marke,ng vs. Other Online Spend by Company: 2012 vs. 2013
Total 2012 Total 2013 Agency 2012 Agency 2013 Direct 2012 Direct 2013 0%
10%
20%
30%
40%
50%
60%
70%
80%
90%
100%
Q12: Has your % of affiliate marke,ng spend increased in rela,on to your other online spend?
Yes
Not sure
No
• Fewer agency respondents claim an increase in spend compared to last year, however there has been an increase in direct client’s relaOve spend – 43% now claim an increase in spend compared to 29% in 2012.
Base 2012 n=92; Agency n=33; Direct n=59 Base 2013: n=116; Agency n=27; Direct n=89
Change in Spend by Company Type: Next Year
Base 2012 n=94; Agency n=34; Client n =60 Base 2013 n=116; Agency n=27; Direct n=89
• PosiOvity about future spend conOnues from last year, with 6 in 10 confident that spending will go up over the next year – this applies to both agencies and direct clients.
Total 2012 Total 2013 Agency 2012 Agency 2013 Direct 2012 Direct 2013 0% 10% 20% 30% 40% 50% 60% 70% 80% 90% 100%
Q11: Thinking about your affiliate marke,ng spend over the next year, will it:
Not sure
Stay the same
Go down
Go up
Spend

9For more information contact [email protected] | +61 2 8569 0000 | www.dgm-au.com
❱ Agency respondents remain slightly more likely to take their affiliate marketing spend from marketing than direct clients.
❱ eCommerce was added as a category in this year’s survey due to an increase in retail clients utilising the channel.
Figure Eight: “Which department does your affiliate marketing budget currently come from?”
Affiliate Marke,ng Budget by Company Type: 2012 vs. 2013
0%
10%
20%
30%
40%
50%
60%
70%
80%
90%
100%
Total 2012 Total 2013 Agency 2012 Agency 2013 Direct 2012 Direct 2013
Q13: Which department does your affiliate marke,ng budget currently come from?
Other
eCommerce
Product
Sales
MarkeOng
• Agency respondents remain slightly more likely to take their Affiliate MarkeOng spend from markeOng than direct clients.
Base 2012 n=92; Agency n=33; Direct n=59 Base 2013: n=116; Agency n=27; Direct n=89
Spend

10For more information contact [email protected] | +61 2 8569 0000 | www.dgm-au.com
Number of affiliate networks
❱ The majority of both agencies and direct clients use 1-2 affiliate networks to manage their campaigns.
❱ Around 1 in 5 of both agencies and direct clients use four or more networks.
Figure Nine: “How many affiliate networks manage your current campaign?”
Number of Affiliate Networks by Company Type: 2012 vs 2013
• The majority of both agencies and direct clients use 1-‐2 affiliate networks to manage their campaigns.
• Around 1 in 5 in both agencies and direct clients manage their own campaigns.
0%
10%
20%
30%
40%
50%
60%
70%
80%
90%
100%
Total 2012 Total 2013 Agency 2012 Agency 2013 Direct 2012 Direct 2013
Q16: How many affiliates manage your current campaign?
We don't have a current campaign
None, we manage our own program
4 or more
3
2
1
Base 2012 n=90; Agency n=31; Direct n=59 Base 2013: n=116; Agency n=27; Direct n=89

11For more information contact [email protected] | +61 2 8569 0000 | www.dgm-au.com
De-duplication
❱ 84% of agencies indicated that they de-duplicate affiliate sales against other online channels. This compares to just 64% for direct clients.
❱ There were no major changes between agencies and direct year on year.
Figure Ten: “Do you de-duplicate affiliate sales against other online channels?”
De-‐duplicate Affiliate Sales by Company Type: 2012 vs. 2013
Total 2012 Total 2013 Agency 2012 Agency 2013 Direct 2012 Direct 2013 0%
10%
20%
30%
40%
50%
60%
70%
80%
90%
100%
Q17: Do you de-‐duplicate affiliate sales against other online channels?
No
Yes
• 84% of agencies indicated that they de-‐duplicate affiliate sales against other online channels. This compares to just 64% for direct clients.
Base 2012 n=89; Agency n=31; Direct n=58 Base 2013: n=116; Agency n=27; Direct n=89

12For more information contact [email protected] | +61 2 8569 0000 | www.dgm-au.com
Likelihood of recommending affiliate marketing
❱ 77% of all respondents said they would recommend affiliate marketing – a slight decrease from 2012 (85%).
❱ Perhaps not surprisingly, those who use affiliate marketing would be more likely to recommend it than non users (84% vs. 58%).
Figure Eleven: “How likely are you to recommend affiliate marketing to someone in a similar position to you?”
❱ As in 2012, agencies are more likely to recommend affiliate marketing than direct clients, however the gap is marginally smaller in 2013 (10%pt difference in 2013, compared to 12%pts in 2012).
Figure Twelve: “How likely are you to recommend affiliate marketing to someone in a similar position to you?”
Likelihood of Recommending Affiliate Marke,ng by Users/Non-‐users: 2012 vs. 2013
Do not use Affiliate MarkeOng 2013
Do not use Affiliate MarkeOng 2012
Use Affiliate MarkeOng 2013
Use Affiliate MarkeOng 2012
Total 2013
Total 2012
0% 10% 20% 30% 40% 50% 60% 70% 80% 90% 100%
Q18: How likely are you to recommend affiliate marke,ng to someone in a similar posi,on to you?
Very likely Likely Neutral Unlikely Very unlikely
• 77% of all respondents said they would recommend Affiliate MarkeOng -‐ a slight decrease from 2012 (85%).
• Perhaps not surprisingly, those who use Affiliate MarkeOng would be more likely to recommend it than non users (84% vs. 58%).
Base 2012 n=134; Users n=109; Non-‐Users n=25 Base 2013: n=156; Users n=116; Non-‐Users n=40
Likelihood of Recommending Affiliate Marke,ng by Company Type: 2012 vs. 2013
Direct 2013
Direct 2012
Agency 2013
Agency 2012
Total 2013
Total 2012
0% 10% 20% 30% 40% 50% 60% 70% 80% 90% 100%
Q18: How likely are you to recommend affiliate marke,ng to someone in a similar posi,on as you?
Very likely Likely Neutral Unlikely Very unlikely
• As in 2012, agencies are more likely to recommend Affiliate MarkeOng than direct clients, however the gap is marginally smaller in 2013 (10%pt difference in 2013, compared to 12%pts in 2012).
Base: Total 2012 n=108; Agency n=42; Direct n=66 Total 2013 n=156; Agency n=39; Direct n=117

13For more information contact [email protected] | +61 2 8569 0000 | www.dgm-au.com
Knowledge of affiliate marketing
❱ Perhaps unsurprisingly, CEOs at companies that don’t currently use affiliate marketing have less knowledge of it.
❱ There is little difference year on year in CEOs’ knowledge of affiliate marketing.
Figure Thirteen: “How much knowledge of affiliate marketing does your CEO have?”
❱ Knowledge remains higher among direct clients – 58% of direct clients think their CEO has good or excellent knowledge of affiliate marketing, compared to 49% of those at agencies.
Figure Fourteen: “How much knowledge of affiliate marketing does your CEO have?”
Knowledge of Affiliate Marke,ng by Users/Non-‐users: 2012 vs. 2013
Do not use Affiliate MarkeOng 2013
Do not use Affiliate MarkeOng 2012
Use Affiliate MarkeOng 2013
Use Affiliate MarkeOng 2012
Total 2013
Total 2012
0% 20% 40% 60% 80% 100%
Q19: How much knowledge of affiliate marke,ng does your CEO have?
No knowledge Poor knowledge Good knowledge Excellent knowledge I don't know
• Perhaps unsurprisingly, CEOs at companies that don’t currently use Affiliate MarkeOng have less knowledge of it.
• There is liile difference year on year in CEO’s knowledge of Affiliate MarkeOng.
Base 2012 n=134; Users n=109; Non-‐Users n=25 Base 2013: n=156; Users n=116; Non-‐Users n=40
Knowledge of Affiliate Marke,ng by Company Type: 2012 vs. 2013
Direct 2013
Direct 2012
Agency 2013
Agency 2012
Total 2013
Total 2012
0% 10% 20% 30% 40% 50% 60% 70% 80% 90% 100%
Q19: How much knowledge of affiliate marke,ng does your CEO have?
No knowledge Poor knowledge Good knowledge Excellent knowledge I don't know
• Knowledge remains higher among direct clients -‐ 58% of direct clients think their CEO has good or excellent knowledge of Affiliate MarkeOng, compared to 49% of those at agencies.
Base: Total 2012 n=108; Agency n=42; Direct n=66 Total 2013 n=156; Agency n=39; Direct n=117

14For more information contact [email protected] | +61 2 8569 0000 | www.dgm-au.com
Finding 2
Fashion Retailers are the newcomers to the affiliate marketing channel, while Finance are the old-hands There are strong signs of growth in the Fashion Retail sector. While these respondents indicated the lowest proportion of their spend in the affiliate channel, the sector also has the highest number of respondents indicating they had been engaging in affiliate marketing for less than a year (42%). They are also the category most likely not to engage in affiliate marketing with 30% not utilising the channel, more than any other reported category.
They were the sector most likely to take their affiliate spend from their ecommerce budget, suggesting a closer link between affiliate and sales, rather than marketing which is still the most common across the board. Similarly, 85% said they do not cap their spend in the channel, which is slightly above average.
Half of the Fashion Retail respondents indicated they are spending <$5,000 per month in the affiliate channel – reflective of the number of new entrants in the past year – while 73% said their affiliate spend represented less than 10% of their overall online spend.
Fashion Retailers like a wide range of affiliate types, with content and aggregators the most popular at 58% of respondents, followed by comparison engines, coupons, loyalty/rewards and cashback.
This was the first year the survey separated Fashion Retail from other Online Retail, on the back of significant growth in new entrants, and spend, in the sector. This means there are no comparisons to be made from the previous survey.
The most mature sector in affiliate marketing is Finance. This sector engages in the highest amounts of affiliate marketing, spends the most in the channel, is the most likely to manage their own campaigns and most likely to de-duplicate affiliate sales against other online channels.
There has been an increase in Finance respondents engaging in affiliate marketing, with 88% compared to 82% in 2012. Spend is the highest of any sector, with a third of Finance respondents saying they spend >$100,000 a month on affiliate marketing. This is double the response from last year, and significantly more than the 47% of respondents overall who spend <$5,000 per month.
One in 10 Finance respondents allocates half of their budget to affiliate marketing, compared to just 2% of respondents overall, while 68% of Finance respondents spend more than 10% of their online budget on affiliate. This compares to around 40% for respondents overall. Additionally, almost 6 in 10 Finance respondents said they increased their affiliate spend from the previous year.
This sector has been engaging in affiliate marketing longer than any other sector, with 34% of finance respondents saying they have used the channel for 6+ years, and two-thirds having used the channel for 4+ years.
Aggregators and comparison engines are by far the most popular types of affiliate marketing that Finance respondents engage in, while the other sectors including Fashion Retail, Online Retail and Consumer electronics prefer a wider range of affiliate types.

15For more information contact [email protected] | +61 2 8569 0000 | www.dgm-au.com
Usage of Affiliate Marketing
❱ Those operating in the Finance sector are more likely to engage in affiliate marketing than those in other sectors.
❱ Respondents from the Fashion Retail category were less likely to engage in affiliate marketing with 30% not using the channel.
Figure Fifteen: “Do you currently engage in affiliate marketing?
❱ Those operating in the Finance sector are the most likely to engage in Affiliate Marketing (88%).
❱ Engagement in Affiliate Marketing has increased year on year in the finance and fashion/online retail sectors, but decreased in consumer electronics and other sectors.
Figure Sixteen: “Do you currently engage in affiliate marketing?”
Affiliate Marke,ng Use by Sector: 2013
0% 10% 20% 30% 40% 50% 60% 70% 80% 90% 100%
Finance Online Retail Consumer Electronics
Fashion Retail Other
Q5: Do you currently engage in Affiliate Marke,ng?
Yes
No
• Those operaOng in the Finance sector are more likely to engage in Affiliate MarkeOng than those in other sectors.
Base: n=156
Affiliate Marke,ng Use by Sector: 2012 vs. 2013
• Those operaOng in the Finance sector are the most likely to engage in Affiliate MarkeOng (88%). • Engagement in Affiliate MarkeOng has increased year on year in the finance and fashion/online
retail sectors, but decreased in consumer electronics and other sectors.
0% 10% 20% 30% 40% 50% 60% 70% 80% 90% 100%
Finance/ Insurance Fashion/Online Retail
Consumer Electronics
Other
Q5: Do you currently engage in Affiliate Marke,ng?
2012
2013
Base 2012 n=134/2013 n=156

16For more information contact [email protected] | +61 2 8569 0000 | www.dgm-au.com
Spend
❱ Overall, spend on affiliate marketing is highest in the financial sector, with a third spending over $100k per month.
❱ The most common level of spend is $0-$5k, with 47% spending in this bracket each month.
❱ 50% of Fashion Retailers and 57% of Online Retailers spend between $0-$5k a month.
Figure Seventeen: “What is your average monthly spend on affiliate marketing?”
❱ Overall, higher spends on affiliate marketing have decreased year on year, with 24% spending over $25k, compared to 44% in 2012.
❱ However, top level spend in the finance sector has doubled year on year, with a third now spending over $100k on affiliate marketing.
Figure Eighteen: “What is your average monthly spend on affiliate marketing?”
Average Monthly Spend by Sector: 2013
Total Finance/ Insurance
Fashion Retail
Online Retail Consumer Electronics
Other 0% 10% 20% 30% 40% 50% 60% 70% 80% 90% 100%
Q7: Average Monthly Spend on Affiliate Marke,ng
$101k +
$51k-‐$100k
$26k-‐$50k
$11k-‐$25k
$6k-‐$10k
$0k-‐$5k
Nil
• Overall, spend on Affiliate MarkeOng is highest in the financial sector, with a third spending over $100k per month.
• The most common level of spend is $0-‐$5k, with 47% spending in this bracket each month.
Base: Total n=116, Finance n=21. Fashion n=26; Online n=56; Consumer Elec n=20; Other n=41
Average Monthly Spend by Sector: 2012 vs. 2013
Total 2012 Total 2013 Finance 2012 Finance 2013 Fashion/ Online Retail/ Consumer Electronics 2012
Fashion/ Online Retail/ Consumer Electronics 2013
Other 2012 Other 2013 0%
10%
20%
30%
40%
50%
60%
70%
80%
90%
100%
Q7: Average Monthly Spend on Affiliate Marke,ng
$101k +
$51k-‐$100k
$26k-‐$50k
$11k-‐$25k
$6k-‐$10k
$0k-‐$5k
Nil
• Overall, higher spends on Affiliate MarkeOng have decreased year on year, with 24% spending over $25k, compared to 44% in 2012.
• However, top level spend in the finance sector has doubled year on year, with a third now spending over $100k on Affiliate MarkeOng.
Base 2012 n=104; Finance n=46; Retail n=45; Other n=43 Base 2013 n=116; Finance n=21; Retail n=82; Other n=41

17For more information contact [email protected] | +61 2 8569 0000 | www.dgm-au.com
❱ Around 40% of those who engage in affiliate marketing allocate at least 10% of their online marketing spend to this channel.
❱ The finance sector attributes the highest proportion of spend to affiliate marketing, with two thirds allocating at least 10%, and 10% allocating over half their budget. The lowest is fashion retail, with just 27% allocating over 10%, and 73% allocating under 10%.
Figure Nineteen: “What percentage of your online marketing spend is attributed to the affiliate channel?
❱ There has not been much change year on year across the sectors, although higher percentages of spend have decreased this year among ‘other’ sectors.
Figure Twenty: “What percentage of your online marketing spend is attributed to the affiliate channel?
0%
10%
20%
30%
40%
50%
60%
70%
80%
90%
100%
Total Finance/ Insurance
Fashion Retail Online Retail Consumer Electronics
Other
Q8: % of online marke,ng spend aSributed to the affiliate channel
51%+
31-‐50%
21-‐30%
10-‐20%
<10%
Propor,on of online spend aSributed to the Affiliate Channel by Sector: 2013
• Around 40% of those who engage in Affiliate MarkeOng allocate at least 10% of their online markeOng spend to this channel.
• The finance sector aiributes the highest proporOon of spend to Affiliate MarkeOng, with two thirds allocaOng at least 10%, and 10% allocaOng over half their budget. The lowest is fashion retail, with just 27% allocaOng over 10%, and 73% allocaOng under 10%.
Base: Total n=116, Finance n=21. Fashion n=26; Online n=56; Consumer Elec n=20; Other n=41
0%
10%
20%
30%
40%
50%
60%
70%
80%
90%
100%
Total 2012 Total 2013 Finance 2012 Finance 2013 Fashion/ Online Retail/ Consumer Electronics 2012
Fashion/ Online Retail/ Consumer Electronics 2013
Other 2012 Other 2013
Q8: % of online marke,ng spend aSributed to the affiliate channel
51%+
31-‐50%
21-‐30%
10-‐20%
<10%
Propor,on of online spend aSributed to the Affiliate Channel by Sector: 2012 vs. 2013
Base 2012 n=104; Finance n=46; Retail n=45; Other n=43 Base 2013 n=116; Finance n=21; Retail n=82; Other n=41
• There has not been much change year on year across the sectors, although higher percentages of spend have decreased this year among ‘other’ sectors.
Spend

18For more information contact [email protected] | +61 2 8569 0000 | www.dgm-au.com
❱ Overall, over 75% stated that they do not cap their monthly affiliate spend.
❱ The consumer electronics sector has a slightly greater propensity to cap its spend than other sectors, at 30%.
Figure Twenty-one: “Do you cap your monthly affiliate spend?”
❱ Compared to last year, there has been a drop in capping on monthly spend across the board.
❱ Both the Finance and combined Fashion/Online Retail categories shifted 32 percentage points in favour of not capping year on year.
Figure Twenty-two: “Do you cap your monthly affiliate spend?”
Cap on Monthly Affiliate Spend by Sector: 2013
• Overall, over ¾ stated that they do not cap their monthly affiliate spend. • The consumer electronics sector has a slightly greater propensity to cap its spend than other
sectors.
Total Finance/ Insurance
Fashion Retail Online Retail Consumer Electronics
Other 0%
10%
20%
30%
40%
50%
60%
70%
80%
90%
100%
Q9: Do you cap your monthly affiliate spend?
No
Yes
Base 2013: Total n=116, Finance n=21, Fashion Retail n=26, Online Retail n=56, Consumer Elec n=20, Other n=41
Cap on Monthly Affiliate Spend by Sector: 2012 vs. 2013
Base 2013: Total n=116, Finance n=21, Fashion Retail n=26, Online Retail n=56, Consumer Elec n=20, Other n=41
Total 2012 Total 2013 Finance 2012 Finance 2013 Fashion/ Online Retail/ Consumer Electronics 2012
Fashion/ Online Retail/ Consumer Electronics 2013
Other 2012 Other 2013 0%
10%
20%
30%
40%
50%
60%
70%
80%
90%
100%
Q9: Do you cap your monthly affiliate spend?
No
Yes
• Compared to last year, there has been a drop in capping on monthly spend across the board.
Spend

19For more information contact [email protected] | +61 2 8569 0000 | www.dgm-au.com
❱ Over the past year, 95% of spend in the finance sector increased or stayed the same. This is in comparison to between 73-87% in the other sectors. However, only half of those in the finance sector are predicting an increase in spend next year – this is lower than the other sectors, where 60-66% are confident that spending will go up.
Figure Twenty-three: “In terms of affiliate marketing over the past year, has your spend…?”
Figure Twenty-four: “Now thinking about your spend over the next year, will it…?”
Change in Spend by Sector: 2013
• Over the past year, 95% of spend in the finance sector increased or stayed the same. This is in comparison to between 73-‐87% in the other sectors. However, only half of those in the finance sector are predicOng an increase in spend next year – this is lower than the other sectors, where 60-‐66% are confident that spending will go up.
Total
Finance/Insurance
Fashion Retail
Online Retail
Consumer Electronics
Other
0% 10% 20% 30% 40% 50% 60% 70% 80% 90% 100%
Q10: Over the past year, has your spend:
Increased Stayed the same Decreased Not sure
Base: Total n=116, Finance n=21. Fashion n=26; Online n=56; Consumer Elec n=20; Other n=41
Change in Spend by Sector Past Year: 2012 vs. 2013
Base 2012 n=104; Finance n=46; Retail n=45; Other n=43 Base 2013 n=116; Finance n=21; Retail n=82; Other n=41
Total
Finance/Insurance
Fashion Retail
Online Retail
Consumer Electronics
Other
0% 10% 20% 30% 40% 50% 60% 70% 80% 90% 100%
Q11: Thinking about spend over next year, will it:
Go up Go Down Stay the same Not sure
Spend

20For more information contact [email protected] | +61 2 8569 0000 | www.dgm-au.com
❱ Overall, increase in spend over the past year has remained relatively constant.
❱ There has been a drop in those who say spending has decreased (15% in 2012 to 9% in 2013).
Figure Twenty-five: “In terms of affiliate marketing over the past year, has your spend…?”
❱ A similar number to last year are predicting an increase in spend on affiliate marketing next year (61%).
Figure Twenty-six: “Now thinking about your spend over the next year, will it…?”
Change in Spend by Sector Past Year: 2012 vs. 2013
Base 2012 n=104; Finance n=46; Retail n=45; Other n=43 Base 2013 n=116; Finance n=21; Retail n=82; Other n=41
• Overall, increase in spend over the past year has remained the same. • There has been a drop in those who say spending has decreased (15% in 2012 to 9% in 2013).
Total 2012 Total 2013 Finance 2012 Finance 2013 Fashion/ Online Retail/ Consumer Electronics 2012
Fashion/ Online Retail/ Consumer Electronics 2013
Other 2012 Other 2013 0%
10%
20%
30%
40%
50%
60%
70%
80%
90%
100%
Q10: Over the past year, has your affiliate marke,ng spend:
Not sure
Decreased
Stayed the same
Increased
Change in Spend by Sector Next Year: 2012 vs. 2013
Base 2012 n=104; Finance n=46; Retail n=45; Other n=43 Base 2013 n=116; Finance n=21; Retail n=82; Other n=41
Total 2012 Total 2013 Finance 2012 Finance 2013 Fashion/ Online Retail/ Consumer Electronics 2012
Fashion/ Online Retail/ Consumer Electronics 2013
Other 2012 Other 2013 0% 10% 20% 30% 40% 50% 60% 70% 80% 90% 100%
Q11: Thinking about your affiliate marke,ng spend over the next year, will it:
Not sure
Stay the same
Go down
Go up
• A similar number to last year are predicOng an increase in spend on affiliate markeOng next year (61%).
Spend
21For more information contact [email protected] | +61 2 8569 0000 | www.dgm-au.com
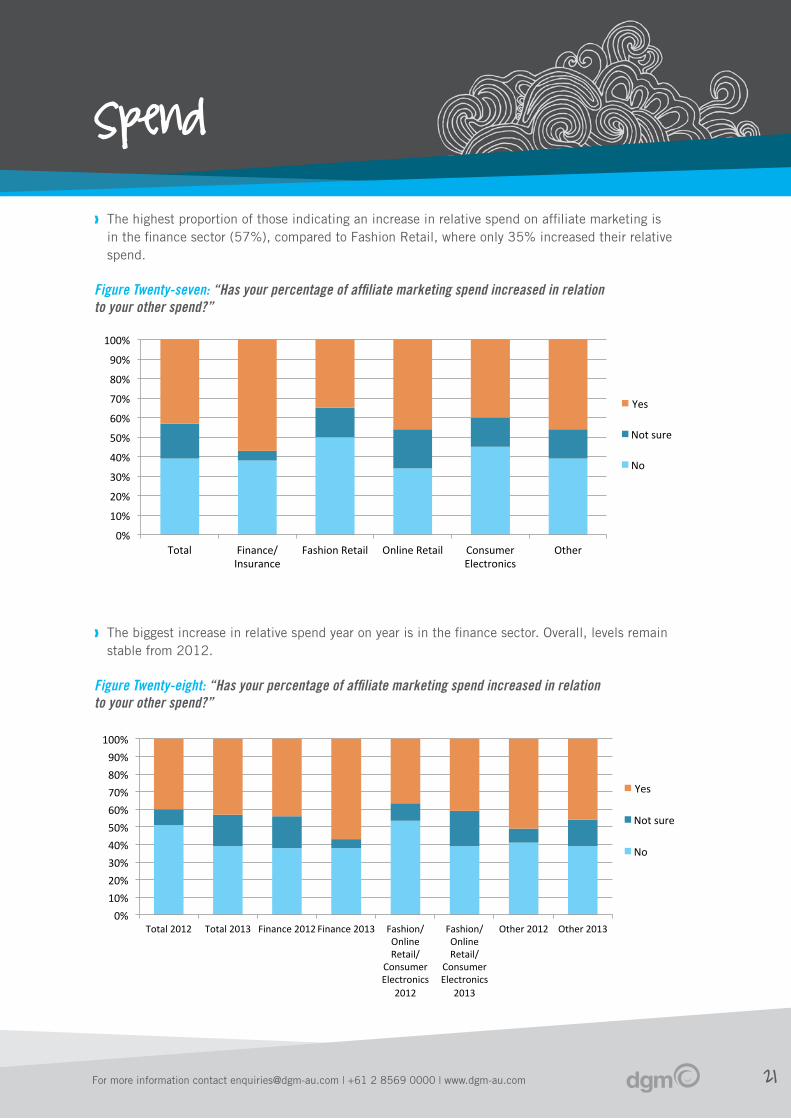
❱ The highest proportion of those indicating an increase in relative spend on affiliate marketing is in the finance sector (57%), compared to Fashion Retail, where only 35% increased their relative spend.
Figure Twenty-seven: “Has your percentage of affiliate marketing spend increased in relation to your other spend?”
❱ The biggest increase in relative spend year on year is in the finance sector. Overall, levels remain stable from 2012.
Figure Twenty-eight: “Has your percentage of affiliate marketing spend increased in relation to your other spend?”
Increase in Spend on Affiliate Marke,ng vs. Other Online Spend by Sector: 2013
Base: Total n=116, Finance n=21. Fashion n=26; Online n=56; Consumer Elec n=20; Other n=41
• The highest proporOon of those indicaOng an increase in relaOve spend on Affiliate MarkeOng is in the finance sector (57%).
Total Finance/ Insurance
Fashion Retail Online Retail Consumer Electronics
Other 0%
10%
20%
30%
40%
50%
60%
70%
80%
90%
100%
Q12: Has your % of affiliate marke,ng spend increased in rela,on to your other online spend?
Yes
Not sure
No
Increase in Spend on Affiliate Marke,ng vs. Other Online Spend by Sector: 2012 vs. 2013
Base 2012 n=92; Finance n=39; Retail n=41;Other n=37 Base 2013: Total n=116; Finance n=21; Retail n=82; Other n=41
• The biggest increase in relaOve spend year on year is in the finance sector. Overall, levels remain stable from 2012.
Total 2012 Total 2013 Finance 2012 Finance 2013 Fashion/ Online Retail/ Consumer Electronics 2012
Fashion/ Online Retail/ Consumer Electronics 2013
Other 2012 Other 2013 0% 10% 20% 30% 40% 50% 60% 70% 80% 90% 100%
Q12: Has your % of affiliate marke,ng spend increased in rela,on to your other online spend?
Yes
Not sure
No
Spend

22For more information contact [email protected] | +61 2 8569 0000 | www.dgm-au.com
❱ For the vast majority of respondents, their affiliate marketing spend comes out of their marketing budget, followed by eCommerce (22% of all respondents).
❱ Those in the fashion sector are more likely to take their affiliate marketing spend from eCommerce (38%).
Figure Twenty-nine: “Which department does your affiliate marketing budget currently come from?”
❱ There are no big differences year on year, other than a slight decrease in sales in the retail and other sectors.
Figure Thirty: “Which department does your affiliate marketing budget currently come from?”
Affiliate Marke,ng Budget by Sector
0%
10%
20%
30%
40%
50%
60%
70%
80%
90%
100%
Total Finance/ Insurance
Fashion Retail Online Retail Consumer Electronics
Other
Q13: Which department does your affiliate marke,ng budget currently come from?
Other
eCommerce
Product
Sales
MarkeOng
• For the vast majority of respondents, their Affiliate MarkeOng spend comes out of their markeOng budget, followed by eCommerce (22% of all respondents).
• Those in the fashion sector are more likely to take their Affiliate MarkeOng spend from eCommerce (38%).
Base: Total n=116, Finance n=21. Fashion n=26; Online n=56; Consumer Elec n=20; Other n=41
Affiliate Marke,ng Budget by Sector: 2012 vs. 2013
0% 10% 20% 30% 40% 50% 60% 70% 80% 90% 100%
Total 2012 Total 2013 Finance 2012 Finance 2013 Fashion/ Online Retail/ Consumer Electronics 2012
Fashion/ Online Retail/ Consumer Electronics 2013
Other 2012 Other 2013
Q13: Which department does your affiliate marke,ng budget currently come from?
Other
eCommerce
Product
Sales
MarkeOng
• There are no big differences year on year, other than a slight decrease in sales in the retail and other sectors.
Base 2012 n=92; Finance n=39; Retail n=41; Other n=37 Base 2013: n=116; Finance n=21; Retail n=82, Other n=41
Spend

23For more information contact [email protected] | +61 2 8569 0000 | www.dgm-au.com
Number of affiliate networks
❱ Overall, the most common number of affiliate networks managing current campaign is 1, with 47%.
❱ 29% of those in the finance sector are using four or more networks.
Figure Thirty-one: “How many affiliate networks manage your current campaign?”
❱ Across the board, there has not been much change year on year, other than a decrease in those in the finance sector managing their own campaigns.
Figure Thirty-two: “How many affiliate networks manage your current campaign?”
Number of Affiliate Networks by Sector
• Overall, the most common number of affiliate networks managing current campaign is 1. • A third of those in the finance sector manage their own campaign.
0%
10%
20%
30%
40%
50%
60%
70%
80%
90%
100%
Total Finance/ Insurance
Fashion Retail Online Retail Consumer Electronics
Other
Q16: How many affiliate networks manage your current campaign?
We don't have a current campaign
None, we manage our own program
4 or more
3
2
1
Base: Total n=116, Finance n=21. Fashion n=26; Online n=56; Consumer Elec n=20; Other n=41
Number of Affiliate Networks by Sector: 2012 vs. 2013
• Across the board, there has not been much change year on year, other than an increase in those in the finance sector managing their own campaigns.
Base 2012 n=90; Finance n=37; Retail n=40; Other n=36 Base 2013: n=116; Finance n=21; Retail n=82, Other n=41
0%
10%
20%
30%
40%
50%
60%
70%
80%
90%
100%
Total 2012 Total 2013 Finance 2012 Finance 2013 Fashion/ Online Retail/ Consumer Electronics 2012
Fashion/ Online Retail/ Consumer Electronics 2013
Other 2012 Other 2013
Q16: How many affiliate networks manage your current campaign?
We don't have a current campaign
None, we manage our own program
4 or more
3
2
1

24For more information contact [email protected] | +61 2 8569 0000 | www.dgm-au.com
De-duplication
❱ In general, around seven out of ten respondents stated that they de-duplicate their affiliate sales against other online channels.
❱ Those in the finance sector are the most likely to do so (86%).
Figure Thirty-three: “Do you de-duplicate affiliate sales against other online channels?”
❱ Again, there has been minimal change since 2012 in those who de-duplicate affiliate sales against other online channels, remaining at around two thirds.
❱ This is higher in the finance sector, with 86% doing so.
Figure Thirty-four: “Do you de-duplicate affiliate sales against other online channels?”
De-‐duplicate Affiliate Sales by Sector
Total Finance/ Insurance
Fashion Retail Online Retail Consumer Electronics
Other 0%
10%
20%
30%
40%
50%
60%
70%
80%
90%
100%
Q17: Do you de-‐duplicate affiliate sales against other online channels?
No
Yes
• In general, around seven out of ten respondents stated that they de-‐duplicate their affiliate sales against other online channels.
• Those in the finance sector are the most likely to do so (86%).
Base: Total n=116, Finance n=21. Fashion n=26; Online n=56; Consumer Elec n=20; Other n=41
De-‐duplicate Affiliate Sales by Sector: 2012 vs. 2013
Total 2012 Total 2013 Finance 2012 Finance 2013 Fashion/ Online Retail/ Consumer Electronics 2012
Fashion/ Online Retail/ Consumer Electronics 2013
Other 2012 Other 2013 0% 10% 20% 30% 40% 50% 60% 70% 80% 90% 100%
Q17: Do you de-‐duplicate affiliate sales against other online channels?
No
Yes
• Again, there has been minimal change since 2012 in those who de-‐duplicate affiliate sales against other online channel, remaining at around two thirds.
• This is higher in the finance sector, with 86% doing so.
Base 2012 n=89; Finance n=37; Retail n=40; Other n=35 Base 2013: n=116; Finance n=21; Retail n=82, Other n=41

25For more information contact [email protected] | +61 2 8569 0000 | www.dgm-au.com
Likelihood of recommending
affiliate marketing
❱ Those in the finance and consumer electronics sectors are the most likely to recommend affiliate marketing.
Figure Thirty-five: “How likely are you to recommend affiliate marketing to someone in a similar position to you?”
❱ Across the sectors, there has been a general trend of a slight decrease in likelihood to recommend since last year.
Figure Thirty-six: “How likely are you to recommend affiliate marketing to someone in a similar position to you?”
Likelihood of Recommending Affiliate Marke,ng by Sector: 2013
Other
Consumer Electronics
Online Retail
Fashion Retail
Finance/ Insurance
Total
0% 10% 20% 30% 40% 50% 60% 70% 80% 90% 100%
Q18: How likely are you to recommend affiliate marke,ng to someone in a similar posi,on to you?
Very likely Likely Neutral Unlikely Very unlikely
• Those in the finance and consumer electronics sectors are the most likely to recommend Affiliate MarkeOng.
Base: Total n=156, Finance n=24. Fashion n=37; Online n=70; Consumer Elec n=27; Other n=64
Likelihood of Recommending Affiliate Marke,ng by Sector: 2012 vs. 2013
Other 2013
Other 2012
Retail 2013
Retail 2012
Finance 2013
Finance 2012
Total 2013
Total 2012
0% 10% 20% 30% 40% 50% 60% 70% 80% 90% 100%
Q18: How likely are you to recommend affiliate marke,ng to someone in a similar posi,on to you?
Very likely Likely Neutral Unlikely Very unlikely
• Across the sectors, there has been a general trend of a slight decrease in likelihood to recommend since last year.
Base: Total 2012 n=108; Finance n=43; Retail n=51; Other n=43 Total 2013 n=156; Finance n=24; Retail; n=106; Other n=64

26For more information contact [email protected] | +61 2 8569 0000 | www.dgm-au.com
Knowledge of affiliate marketing
❱ Knowledge is lowest in the consumer electronics sector (37% good/excellent), and highest in the finance sector (63% good/excellent).
Figure Thirty-seven: “How much knowledge of affiliate marketing does your CEO have?”
❱ Across all sectors, around 1 in 4 claim their CEO has a good knowledge of affiliate marketing. This is slightly lower in the ‘other’ sector.
Figure Thirty-eight: “How much knowledge of affiliate marketing does your CEO have?”
Knowledge of Affiliate Marke,ng by Sector
Other
Consumer Electronics
Online Retail
Fashion Retail
Finance/ Insurance
Total
0% 20% 40% 60% 80% 100%
Q19: How much knowledge of affiliate marke,ng does your CEO have?
No knowledge Poor knowledge Good knowledge Excellent knowledge I don't know
• Knowledge is lowest in the consumer electronics sector (37% good/excellent), and highest in the finance sector (63% good/excellent).
Base: Total n=156, Finance n=24. Fashion n=37; Online n=70; Consumer Elec n=27; Other n=64
Knowledge of Affiliate Marke,ng by Sector: 2012 vs. 2013
Other 2013
Other 2012
Retail 2013
Retail 2012
Finance 2013
Finance 2012
Total 2013
Total 2012
0% 10% 20% 30% 40% 50% 60% 70% 80% 90% 100%
Q19: How much knowledge of affiliate marke,ng does your CEO have?
No knowledge Poor knowledge Good knowledge Excellent knowledge I don't know
• Across all sectors, around 1 in 4 claim their CEO has a good knowledge of markeOng. This is slightly lower in the ‘other’ sector.
Base: Total 2012 n=108; Finance n=43; Retail n=51; Other n=46 Total 2013 n=156; Finance n=24; Retail; n=106; Other n=64

27For more information contact [email protected] | +61 2 8569 0000 | www.dgm-au.com
Finding 3
Coupons, cash back, and loyalty/rewards have experienced growth in popularity as types of affiliate marketing being undertaken While comparison engines remain the most popular type of affiliate marketing undertaken, this survey has seen growth in other types of affiliate marketing. Notable are coupons, which jumped to 56% of respondents indicating they use coupons vs 29% last year; loyalty/rewards, at 45% this year compared to 27% last year; and cash back, which more than doubled to 44% from 18% last year.
This leap in respondents using cash back as a type of affiliate marketing is linked to the rapid growth experienced by the retail sector in the past year. We have seen cash back’s popularity among retailers in more established markets such as the UK, and expect to see this type of affiliate marketing jump up again as the retail sector continues to grow and establish itself locally. It’s a similar story for coupons, another type of affiliate marketing that works particularly well for the retailers.
In this survey, 45% of retail respondents said they were using cash back, up from 28% last year. For coupons, almost 7 in 10 retail respondents are now using this type of affiliate marketing, up from 5 in 10 last year, while loyalty/rewards – also being driven by retail – saw a small increase from 43% to 51%.
The growth seen in content as a type of affiliate marketing by fashion retailers is due to advertisers actively seeking exposure for their products on blogs and content sites. This year, 63% of respondents reported using content, up from 55% last year.

28For more information contact [email protected] | +61 2 8569 0000 | www.dgm-au.com
❱ Other types of affiliate marketing have gained in popularity this year, particularly coupons, loyalty/rewards and cashback.
❱ Aggregators and Affiliate Search were added for the first time this year and as such there is no corresponding data for 2012. Similarly Other PPC and Brand Bidding PPC have been removed from this year’s study and consolidated under Brand Bidding PPC.
Figure Thirty-nine: “Which of the following affiliate marketing types do you work with?”
❱ Overall, Comparison Engines are the most widely used type of affiliate marketing.
❱ Those operating in the retail sectors use a much wider variety of affiliate marketing types than those in finance.
Figure Forty: “Which of the following affiliate marketing types do you work with?”
Types of Affiliate Marke,ng: 2012 vs. 2013
0%
10%
20%
30%
40%
50%
60%
70%
Comparison Engines
Content Coupons Aggregators Loyalty/ Rewards
Cashback Affiliate Search
Other Other PPC Brand Bidding PPC
Q14: Which of the following affiliate marke,ng types do you work with?
Total 2012 Total 2013
• Other types of Affiliate MarkeOng have gained in popularity this year, parOcularly coupons, loyalty/rewards and cashback.
Base 2012 n=90; 2013 n=116
Types of Affiliate Marke,ng by Sector
0% 10% 20% 30% 40% 50% 60% 70% 80% 90%
Comparison Engines
Content Coupons Aggregators Loyalty/ Rewards
Cashback Affiliate Search Other
Q14: Which of the following affiliate marke,ng types do you work with
Total Finance/ Insurance Fashion Retail Online Retail Consumer Electronics Other
• Overall, Comparison Engines are the most widely used type of Affiliate MarkeOng. • Those operaOng in the retail sectors use a much wider variety of Affiliate MarkeOng types than
those in finance.
Base: Total n=116, Finance n=21. Fashion n=26; Online n=56; Consumer Elec n=20; Other n=41
Types of affiliate marketing

29For more information contact [email protected] | +61 2 8569 0000 | www.dgm-au.com
❱ Use of comparison engines has fallen slightly among all sectors, and other types of affiliate marketing have gained in popularity since last year, resulting in a more even spread of types used this year.
Figure Forty-one: “Which of the following affiliate marketing types do you work with?”
❱ The top affiliate type used among agencies is aggregators (70%), and among direct clients, coupons (62%).
❱ Direct clients appear to use a wider range of affiliate marketing types than agencies.
Figure Forty-two: “Which of the following affiliate marketing types do you work with?”
Types of Affiliate Marke,ng by Sector: 2012 vs. 2013
0% 10% 20% 30% 40% 50% 60% 70% 80%
Other
Brand Bidding PPC
Cashback
Other PPC
Loyalty/Rewards
Coupons
Content
Comparison Engines
2012 Other Retail Finance
• Use of comparison engines has fallen slightly among these sectors, and other types of Affiliate MarkeOng have gained in popularity since last year, resulOng in a more even spread of types used this year.
Base 2012 n=90; Finance n=37; Retail n=40; Other n=36 Base 2013: Total n=116; Finance n=21; Retail n=82; Other n=41
0% 20% 40% 60% 80% 100%
Other
Aggregators
Cashback
Affiliate Search
Loyalty/Rewards
Coupons
Content
Comparison Engines
2013 Other Retail Finance
Q14: Which of the following affiliate marke,ng types do you work with?
Types of Affiliate Marke2ng by Company Type: 2012 vs. 2013
• The top type among agencies is aggregators (70%), and among direct clients, coupons (62%). • Direct clients appear to use a wider range of Affiliate MarkeEng types than agencies.
Base 2012 n=90; Agency n=31; Direct n=59 Base 2013 n=116; Agency n=27; Direct n=89
0% 10% 20% 30% 40% 50% 60% 70%
Other
Affiliate Search
Brand Bidding PPC
Cashback
Other PPC
Aggregators
Loyalty/Rewards
Comparison Engines
Coupons
Content
Direct 2013 Direct 2012
0% 10% 20% 30% 40% 50% 60% 70% 80% 90%
Other
Loyalty/Rewards
Cashback
Other PPC
Brand Bidding PPC
Affiliate Search
Content
Coupons
Comparison Engines
Aggregators
Agency 2013 Agency 2012
Q14: Which of the following affiliate marke2ng types do you work with?
Types of affiliate marketing

30For more information contact [email protected] | +61 2 8569 0000 | www.dgm-au.com
Finding 4
The high number of new entrants to affiliate marketing indicates there is more room for growth in the channelThere has been a big rise in those new to affiliate marketing since last year, mainly in the fashion/retail and other sectors.
Potential growth is shown among direct clients indicated by the following:
❱ there has been an increase year on year in spend among direct clients and a decrease among agencies
❱ an increase in the number of direct clients who have been engaged in affiliate marketing for under a year
❱ accompanied by an increase of proportional spend allocated to affiliate marketing by direct clients.
One in three respondents overall is new to affiliate marketing, indicating they have been engaging in the channel for less than a year. Nearly two-thirds of respondents have used affiliate marketing for three years or less.
By sector, half of respondents from consumer electronics are new to the channel this year, 42% of fashion retail respondents are new, and 29% of online retail respondents.
The fashion retail sector is indicating future growth. While it is the sector that spends the lowest proportion of their budget on affiliate marketing, it is also the sector with the most new entrants saying they have engaged in the channel for less than a year. They are the sector most likely to take their affiliate marketing spend from their ecommerce budget, and they engage in a wide range of affiliate marketing types. This presents an opportunity for the publishers to diversify their offering to tap into this growth.

31For more information contact [email protected] | +61 2 8569 0000 | www.dgm-au.com
❱ Nearly two thirds of all those surveyed have been engaged in affiliate marketing in Australia for three years or less.
❱ Affiliate marketing is more established in the finance sector (34% have been engaged for 6+ years), and newer in fashion and online retail.
Figure Forty-three: “How long has your agency/company engaged in affiliate marketing in Australia?”
❱ There has been a big rise in those new to affiliate marketing since last year - this is mainly in the retail and other sectors.
Figure Forty-four: “How long has your agency/company engaged in affiliate marketing in Australia?”
Length of Time Engaged in Affiliate Marke,ng by Sector: 2012 vs. 2013
0%
10%
20%
30%
40%
50%
60%
70%
80%
90%
100%
Total 2012 Total 2013 Finanace 2012
Finance 2013 Fashion/ Online Retail/ Consumer Electronics 2012
Fashion/ Online Retail/ Consumer Electronics 2013
Other 2012 Other 2013
Q15: How long has your company been engaged in affiliate marke,ng in Australia?
Over 8 years
Between 6-‐8 years
Between 4-‐5 years
Between 1-‐3 years
Under a year
• There has been a big rise in those new to Affiliate MarkeOng since last year -‐ this is mainly in the retail and other sectors.
Base 2012 n=90; Finance n=37; Retail n=40; Other n=36 Base 2013: n=116; Finance n=21; Retail n=82, Other n=41
Length of time using affiliate marketing
Length of Time Engaged in Affiliate Marke,ng by Sector
0%
10%
20%
30%
40%
50%
60%
70%
80%
90%
100%
Total Finance/ Insurance
Fashion Retail Online Retail Consumer Electronics
Other
Q15: How long has your company been engaged in affiliate marke,ng in Australia?
Over 8 years
Between 6-‐8 years
Between 4-‐5 years
Between 1-‐3 years
Under a year
• Nearly two thirds of all those surveyed have been engaged in Affiliate MarkeOng in Australia for three years or less.
• Affiliate MarkeOng is more established in the finance sector (34% have been engaged for 8+ years), and newer in fashion and online retail.
Base: Total n=116, Finance n=21. Fashion n=26; Online n=56; Consumer Elec n=20; Other n=41
Finance

32For more information contact [email protected] | +61 2 8569 0000 | www.dgm-au.com
❱ There has been a big increase in the number of direct clients engaged in affiliate marketing for less than a year since 2012 (14% - 35%).
Figure Forty-five: “How long has your agency/company engaged in affiliate marketing in Australia?”
Length of Time Engaged in Affiliate Marke,ng by Company Type: 2012 vs. 2013
0%
10%
20%
30%
40%
50%
60%
70%
80%
90%
100%
Total 2012 Total 2013 Agency 2012 Agency 2013 Direct 2012 Direct 2013
Q15: How long has your agency/company engaged in affiliate marke,ng in Australia?
Over 8 years
Between 6-‐8 years
Between 4-‐5 years
Between 1-‐3 years
Under a year
• There has been a big increase in the number of direct clients engaged in affiliate markeOng for less than a year since 2012 (14% -‐ 35%). This could reflect a possible increase in the number of direct clients engaged in affiliate markeOng.
Base 2012 n=90; Agency n=31; Direct n=59 Base 2013: n=116; Agency n=27; Direct n=89
Length of time using affiliate marketing

33For more information contact [email protected] | +61 2 8569 0000 | www.dgm-au.com
Finding 5
There is potential for the mobile channel to deliver more sales, as well as more companies to adopt a mobile optimised web presenceThis year, we added questions on the mobile channel for the first time.
Less than 10% of sales are being driven by mobile for the majority of respondents (58%). Retail shows the highest attribution of sales from mobile, with 15% of respondents in both Online Retail and Fashion retail saying mobile drives more than 30% of their sales.
Consumer electronics has the lowest sales results in mobile, with three-quarters of respondents indicating that mobile drives less than 10% of their sales. This is despite the fact consumer electronics has the highest number of respondents saying they have a mobile optimised website.
For fashion retailers, three-quarters say they have a mobile enabled website, while a third report 16% or more in sales driven by the channel.
Overall, three in 10 respondents said they do not have a mobile enabled website. This is the same across both agencies and direct advertisers.
In a recent Mobile Report published by dgm, we noted that Australia is driving more clicks from smartphones and tablets compared to the UK, however sales percentages are the same or below those in the UK where more advertisers have mobile optimised websites. We believe once Australian advertisers offer a better mobile shopping experience to the customer, this will close the gap.
The below graph from the report shows this difference (Source: dgm Mobile Report October 2013 http://www.dgm-au.com/weblog/2013/10/18/lack-mobile-shopper-experience-costing-business-sales/):
dgmAustralia 2013 Australian Affiliate Benchmarking Survey 37
Mobile enabled websites
• There is not much difference across sectors, other than the consumer electronics sector, who are the most likely to have a mobile enabled website (89%).
Figure Forty-six: “Do you have a mobile enabled website?” [SLIDE 49]
• Across both agencies and direct clients, 7 in 10 have a mobile enabled website.
0%
5%
10%
15%
20%
25%
Smartpho
ne Clicks
Tablet Clicks
Smartpho
ne Sales
Tablet Sales
Mob
ile Clicks
Mob
ile Sales
AU vs UK Comparison
UK
AU
0% 20% 40% 60% 80%
100% Q20: Do you have a mobile
enabled website?
No

34For more information contact [email protected] | +61 2 8569 0000 | www.dgm-au.com
Mobile enabled websites
❱ There is not much difference across sectors, other than the consumer electronics sector, who are the most likely to have a mobile enabled website (89%).
Figure Forty-six: “Do you have a mobile enabled website?”
❱ Across both agencies and direct clients, 7 in 10 have a mobile enabled website.
Figure Forty-seven: “Do you have a mobile enabled website?”
Mobile Enabled Website by Sector
Total Finance/ Insurance
Fashion Retail Online Retail Consumer Electronics
Other 0%
10%
20%
30%
40%
50%
60%
70%
80%
90%
100%
Q20: Do you have a mobile enabled website?
No
Yes
• There is not much difference across sectors, other than the consumer electronics sector, who are the most likely to have a mobile enabled website (89%).
Base: Total n=156, Finance n=24. Fashion n=37; Online n=70; Consumer Elec n=27; Other n=64
Mobile Enabled Website by Company Type
Total Agency Direct 0%
10%
20%
30%
40%
50%
60%
70%
80%
90%
100%
Q20: Do you have a mobile enabled website?
No
Yes
• Across both agencies and direct clients, 7 in 10 have a mobile enabled website.
Base: Total n=156, Agency n=39; Direct n=117

35For more information contact [email protected] | +61 2 8569 0000 | www.dgm-au.com
❱ For the majority of respondents (58%), under 10% of online sales are driven by mobile.
❱ Fashion Retailers drive the highest volume of sales through mobile, with 26% of respondents achieving over 21% of sales through mobile devices.
Figure Forty-eight: “What percentage of your total online sales are driven by mobile?”
❱ A higher percentage of direct clients’ online sales are driven by mobile (29% over 16%)
Figure Forty-nine: “What percentage of your total online sales are driven by mobile?”
Online Sales Driven by Mobile by Sector
Total Finance/ Insurance
Fashion Retail Online Retail Consumer Electronics
Other 0%
10%
20%
30%
40%
50%
60%
70%
80%
90%
100%
Q21: What % of your total online sales are driven by mobile?
31%+
21-‐30%
16-‐20%
11-‐15%
5-‐10%
<5%
• For the majority of respondents (58%), under 10% of online sales are driven by mobile.
Base: those with mobile enabled website n=107, Finance n=17. Fashion n=27; Online n=47; Consumer Elec n=24; Other n=42
Online Sales Driven by Mobile by Company Type
Total Agency Direct 0%
10%
20%
30%
40%
50%
60%
70%
80%
90%
100%
Q21: What % of your total online sales are driven by mobile?
31%+
21-‐30%
16-‐20%
11-‐15%
5-‐10%
<5%
• A higher percentage of direct clients online sales are driven by mobile (29% over 20%)
Base: those with mobile enabled website n=107, Agency n=28; Direct n=79
Mobile enabled websites

36For more information contact [email protected] | +61 2 8569 0000 | www.dgm-au.com
Methodology
In the 2013 dgm Affiliate Marketing benchmarking study, edentify surveyed 156 Australian online media buyers that included 39 media buying agencies and 117 large online advertisers and brands. The online survey began on 18 September and was completed on 30 September 2013.
Questions provided to the survey participants asked about their use of, attitudes to, and the decision making process when considering affiliate marketing.
edentify defines “affiliate marketing” as a type of performance-based marketing in which a business rewards one or more affiliates for each visitor or customer brought about by the affiliate’s own marketing efforts.
Recommended