EEI 2013 FINANCIAL REVIEW 33
Business StrategiesRegulated Electric revenue increased 4.7%, despite a minimal 0.1% in-crease in nationwide electric output. Competitive Energy revenue had a modest 1.5% increase, while its asset total was virtually unchanged.
2013 Revenue by SegmentRegulated Electric revenue in-
creased by $10.9 billion, or 4.7%, to $245.4 billion from $234.5 billion in 2012. The segment’s share of to-tal industry revenue grew to 66.2% from 66.0% in 2012, totals that are now well above the 52.1% level of 2005.
Business Segmentation—RevenuesU.S. INVESTOR-OWNED ELECTRIC UTILITIES
($ Millions) 2013 2012r Difference
Regulated Electric Competitive EnergyNatural Gas Distribution Natural Gas PipelineNatural Gas and Oil Exploration & ProductionOther
Eliminations/Reconciling Items
Total Revenues
% Change
Note: Difference and Percent Change columns may reflect rounding. Totals may reflect rounding.
Source: Based on segment reporting from SEC filings of 57 U.S. Investor-Owned Electric Utilities
245,441 234,504 10,938 4.7% 68,171 67,187 984 1.5% 36,269 32,328 3,942 12.2% 6,175 6,658 (483) (7.3%) 941 1,750 (809) (46.2%) 13,641 12,773 869 6.8% (14,151) (15,303) 1,152 (7.5%) 356,488 339,896 16,592 4.9%
r = revised
Business Segmentation
The industry’s regulated business segments, Regulated Electric and Natural Gas Distribution, showed the largest revenue gains in both dol-lar and percentage terms in 2013, and were the only categories with as-set growth. Continuing a multi-year trend, the industry’s regulated asset base grew and accounted for a larger share of total industry assets. Regu-lated Electric assets grew to a 66.4% share of total assets, providing most of the industry’s asset growth.
Natural Gas Distribution revenue had significant gains for the second straight year, rising by $3.9 billion, or 12.2%, from $32.3 billion in 2012 to $36.3 billion in 2013. This followed a 15.6% increase the year before. Annual revenue here has his-torically fluctuated due to significant swings in natural gas prices.
Total regulated revenue—the sum of the Regulated Electric and Natu-ral Gas Distribution segments— increased by $14.9 billion, or 5.6%, to $281.7 billion in 2013. The year-to-year change for this metric has

BUSINESS STRATEGIES
34 EEI 2013 FINANCIAL REVIEW
growth in recent years and the fact that several companies sold off non-core businesses during the period.
Regulated ElectricRegulated Electric segment op-
erations include the generation, transmission and distribution of regulated electricity for residential, commercial and industrial custom-ers. Regulated Electric revenue gains were widespread across the industry, summing to the overall $10.9 bil-lion, or 4.7%, increase. Forty-six of 54 companies (85%) had higher revenues for this segment, with five companies (9%) reporting double-digit percentage growth. The seg-ment’s overall increase was support-ed by a continued record-high level of capital expenditures and a gener-ally constructive regulatory environ-ment at the state level. An offsetting factor was the 9% decline in cooling- degree days, although they were 11%
Source: EEI Finance Department and company annual reports
Revenue Breakdown 2013U.S. INVESTOR-OWNED ELECTRIC UTILITIES
RegulatedElectric66.2%
Natural Gas Distribution
9.8%Natural Gas
Pipeline 1.7%
18.4%
Competitive Energy
Natural Gas and Oil Exploration & Production
0.3%
Other 3.7%
Revenue Breakdown 2012U.S. INVESTOR-OWNED ELECTRIC UTILITIES
RegulatedElectric66.0%
Natural Gas Distribution
9.1%Natural Gas
Pipeline 1.9%
18.9%
Competitive Energy
Natural Gas and Oil Exploration & Production
0.5%
Other 3.6%
2013 Assets by SegmentRegulated Electric assets increased
from 65.5% of total industry assets at December 31, 2012 to 66.4% at December 31, 2013, rising by $23.5 billion, or 2.7%, over the year-end 2012 level. Competitive Energy as-sets were nearly unchanged, with a $39 million decrease from the prior year. Natural Gas Distribution assets grew by $6.5 billion, or 6.4%, while the two smaller natural-gas-related categories, Pipeline and Exploration & Production, experienced declines of 0.4% and 27.6%, respectively.
Total regulated assets (Regulated Electric plus Natural Gas Distribu-tion) accounted for 74.3% of total industry assets at year-end 2013, up from 73.1% on December 31, 2012. This aggregate measure has grown steadily from 61.6% at year-end 2002, underscoring the indus-try’s significant regulated rate base
varied in recent years, falling by $13.0 billion in 2012 (-4.7%) and $2.1 billion (-0.8%) in 2011, ris-ing $4.1 billion (+1.5%) in 2010, declining $20.6 billion (-6.9%) in 2009 and increasing $22.5 billion (+7.7%) in 2008 and $14.4 billion (+5.2%) in 2007. Despite the year-to-year dollar fluctuations, regulated operations have steadily grown as a percentage of total industry revenue in recent years. Total regulated reve-nue accounted for 76.0% of total in-dustry revenue in 2013, extending a steady upward trend from 65.3% in 2005. The Business Segmentation— Revenues table presents the industry’s revenue breakdown by business seg-ment. Eliminations and reconciling items were added back to total rev-enue to arrive at the denominator for the segment percentage calcula-tions shown in the graphs Revenue Breakdown 2013 and 2012.
Business Segmentation—AssetsU.S. INVESTOR-OWNED ELECTRIC UTILITIES
r = revised
Note: Difference and Percent Change columns may reflect rounding. Totals may reflect rounding.
Source: Based on segment reporting from SEC filings of 55 U.S. Investor-Owned Electric Utilities
($ Millions) 12/31/13 12/31/12r Difference % Change
Regulated Electric 902,569 879,092 23,476 2.7%
Competitive Energy 202,921 202,960 (39) 0.0%
Natural Gas Distribution 107,964 101,455 6,510 6.4%
Natural Gas Pipeline 36,269 36,420 (151) (0.4%)
Natural Gas and Oil Exploration
& Production 2,653 3,666 (1,013) (27.6%)
Other 105,907 118,153 (12,246) (10.4%)
Eliminations/Reconciling Items (66,058) (78,482) 12,423 (15.8%)
Total Assets 1,292,225 1,263,265 28,960 2.3%

BUSINESS STRATEGIES
EEI 2013 FINANCIAL REVIEW 35
growth in recent years and the fact that several companies sold off non-core businesses during the period.
Regulated ElectricRegulated Electric segment op-
erations include the generation, transmission and distribution of regulated electricity for residential, commercial and industrial custom-ers. Regulated Electric revenue gains were widespread across the industry, summing to the overall $10.9 bil-lion, or 4.7%, increase. Forty-six of 54 companies (85%) had higher revenues for this segment, with five companies (9%) reporting double-digit percentage growth. The seg-ment’s overall increase was support-ed by a continued record-high level of capital expenditures and a gener-ally constructive regulatory environ-ment at the state level. An offsetting factor was the 9% decline in cooling- degree days, although they were 11%
Source: EEI Finance Department and company annual reports
Revenue Breakdown 2013U.S. INVESTOR-OWNED ELECTRIC UTILITIES
RegulatedElectric66.2%
Natural Gas Distribution
9.8%Natural Gas
Pipeline 1.7%
18.4%
Competitive Energy
Natural Gas and Oil Exploration & Production
0.3%
Other 3.7%
Revenue Breakdown 2012U.S. INVESTOR-OWNED ELECTRIC UTILITIES
RegulatedElectric66.0%
Natural Gas Distribution
9.1%Natural Gas
Pipeline 1.9%
18.9%
Competitive Energy
Natural Gas and Oil Exploration & Production
0.5%
Other 3.6%
prices and a slow economic recov-ery, as well as plant divestitures and merchant operations sales. The seg-ment’s 2012 revenue was the low-est annual total for this category to date, based on data covering the last decade. The highest annual revenue over the last decade was $113.2 bil-lion in 2008. Competitive Energy covers the generation and/or sale of electricity in competitive markets, including both wholesale and retail transactions. Wholesale buyers are typically electric utilities seeking to supplement generation capacity, along with regional power pools and large industrial customers. Competi-tive Energy also includes the trading and marketing of natural gas. Of the 29 companies that have Competitive Energy operations, approximately half (14 companies, or 48%) grew these assets during 2013, while 59% had revenue gains.
higher than normal. The industry is less impacted by heating degree days, which rose by 19%.
The 2013 revenue increase fol-lows declines in the preceding two years, at 2.8% in 2012 and 0.6% in 2011. These were caused by a slug-gish U.S. economy and the impact of continued low natural gas prices on the fuel component of rates. In 2010, favorable weather drove a 2.4% revenue increase. U.S. electric output decreased by 1.8% in 2012 and 0.6% in 2011 after growing by 3.7% in 2010, and falling 3.7% in 2009 and 0.9% in 2008. Year-to-year output declines have historically been rare events for an industry that typically experiences low-single-digit percent annual demand growth. Energy efficiency and demand-side management programs continue to be factors behind the flat growth.
During 2013, 60% of companies increased regulated assets as a percent of total assets (or maintained a 100% regulated structure). OGE Energy had the largest increase, raising its regulated percentage from 72.8% at year-end 2012 to 84.2% at year-end 2013. The rise reflects a lower asset total for its natural gas pipeline seg-ment. The company reduced its pri-mary business segments from three to two over the last year, the result of its newly formed master limited partnership with CenterPoint Energy and ArcLight Capital Partners.
Competitive EnergyCompetitive Energy segment rev-
enue increased by 1.5% in 2013, gaining $984 million to $68.2 bil-lion from $67.2 billion in 2012. This follows a sharp decline of $22.4 billion, or 26.0%, in 2012 that was due to continued weak electricity

BUSINESS STRATEGIES
36 EEI 2013 FINANCIAL REVIEW
The Natural Gas Pipeline and Natural Gas E&P segments had de-clines in both revenues and assets in 2013. Natural Gas Pipeline assets fell by $151 million, or 0.4%, while its revenues were $483 million, or 7.3%, lower. Natural Gas E&P assets decreased by $1.0 billion, or 27.6%, along with a $809 million, or 46.2%, decline in revenues.
Over the longer term, the Pipeline and E&P segments have accounted for a declining share of total indus-try assets. This is due to a combina-tion of growth in the other business segments and divestitures within these two. Natural Gas Pipeline and Natural Gas E&P fell from 3.7% and 2.1% shares of total assets on December 31, 2003 to 2.7% and 0.2% on December 31, 2013, with their combined total assets down by $11.8 billion, or 23%, over this ten-year time frame.
In comparison, 94%, 62%, 75% and 91% of companies had year-to-year revenue declines in 2012, 2011, 2010 and 2009 respectively, while 89% experienced gains in 2008.
Natural Gas Distribution includes the delivery of natural gas to homes, businesses and industrial customers throughout the United States, while the Natural Gas Pipeline business concentrates on the transmission and storage of natural gas for local distribution companies, marketers and traders, electric power generators and natural gas producers. Added together, Natural Gas Distribution, Natural Gas Pipeline and Explora-tion & Production (E&P) activities produced $43.4 billion of the indus-try’s revenue in 2013, up from $40.7 billion in 2012. In percentage terms, the revenue contribution from natu-ral gas activities increased to 11.8% in 2013 from 11.5% in 2012.
Natural Gas DistributionNatural Gas Distribution revenue
increased by $3.9 billion, or 12.2%, in 2013, reversing a declining trend in each of the previous four years. The higher revenues correlate with a 19% increase in heating degree days in 2013. On the other hand, natu-ral gas prices continued to be de-pressed, spending much of the year under $4/mmBTU. The 2013 rise in revenue follows declines of $6.2 billion, or 15.6% in 2012, $701 mil-lion, or 1.7%, in 2011, $1.5 billion, or 3.6%, in 2010 and a much larger decline of $9.8 billion, or 19.1%, in 2009 due to sharply falling gas prices and the impact of the eco-nomic downturn. Natural gas pric-es peaked above $12/mmBTU in 2008, a year marked by very high price volatility. Overall, 28 of the 32 companies (88%) that report gas distribution revenue showed year-to-year revenue increases in 2013.
Source: EEI Finance Department and company annual reports
Asset BreakdownAs of December 31, 2013
U.S. INVESTOR-OWNED ELECTRIC UTILITIES
RegulatedElectric66.4%
Natural Gas Distribution
7.9%
Natural Gas Pipeline 2.7%
14.9%
Competitive Energy
Natural Gas and Oil Exploration & Production
0.2%
Other 7.8%
Asset BreakdownAs of December 31, 2012
U.S. INVESTOR-OWNED ELECTRIC UTILITIES
RegulatedElectric65.5%
Natural Gas Distribution
7.6%
Natural Gas Pipeline 2.7%
15.1%
Competitive Energy
Natural Gas and Oil Exploration & Production
0.3%
Other 8.8%

BUSINESS STRATEGIES
EEI 2013 FINANCIAL REVIEW 37
2013 Year-End List of Companies by Category
Early in each calendar year we update our list of investor-owned electric utility holding companies by business category based on the previ-ous year-end’s business segmentation data presented in 10Ks and supple-mented by discussions with parent companies. Our categories are as follows: Regulated (80% of holding company assets are regulated); Mostly Regulated (50%-79% of holding company assets are regulated); Diversified (less than 50% of hold-ing company assets are regulated).
We use assets rather than revenue for determining categories because we think assets provide a clearer picture of strategic trends. Fluctu-ating natural gas and power prices can impact revenue so greatly that some companies’ strategic approach to business segmentation is distorted by reliance on revenue data alone.
List of Companies by Category at December 31, 2013
AlleteAlliant EnergyAmeren American Electric PowerAvista Black HillsCleco CMS EnergyConsolidated EdisonDPL DTE EnergyDuke EnergyEdison International
El Paso ElectricEmpire District ElectricEntergyGreat Plains EnergyIberdrola USAIDACORP Integrys Energy Group IPALCO EnterprisesNortheast UtilitiesNorthWestern EnergyOGE EnergyOtter Tail PowerPepco Holdings
PG&EPinnacle West CapitalPNM ResourcesPortland General Electric Puget EnergySouthernTECO EnergyUIL HoldingsUnitil UNS EnergyWestar EnergyWisconsin EnergyXcel Energy
Regulated (39)
CenterPoint EnergyDominion ResourcesExelonFirstEnergyMGE Energy
MidAmerican Energy Holdings NextEra EnergyNiSourcePPL
Public Service Enterprise GroupSCANASempra EnergyVectren
Mostly Regulated (13)
Energy Future Holdings Hawaiian Electric MDU ResourcesDiversified (3)
Comparing the list of companies from year to year reveals company migrations between categories and indicates the general trend in indus-try business models. We also base our quarterly category financial data during the year on this list.
The overall trend toward a more regulated industry continued in 2013. The Regulated group totaled 39 companies at year-end, represent-ing 71% of the industry’s compa-nies, up from 67% last year. OGE Energy, Otter Tail Power and Pepco Holdings migrated from the Mostly Regulated to the Regulated category. OGE’s regulated asset percentage grew from 72.8% at year-end 2012 to 84.2% at year-end 2013, reflect-ing a lower asset total for its natural gas pipeline segment. The company reduced its primary business seg-ments from three to two over the last year, the result of its newly formed master limited partnership with
CenterPoint Energy and ArcLight Capital Partners. Otter Tail’s increase from 76.5% to 80.9% relates to a decline in its Corporate asset divi-sion, which is categorized as Other for our purposes. Pepco reshuffled its segments over the prior year, re-moving its Other Non-Regulated Category. This was driven by the company’s termination of its inter-ests in its cross-border energy lease investments during 2013.
The Diversified category added Hawaiian Electric from the Mostly Regulated Category, as the compa-ny continues to straddle to 50.0% threshold of regulated assets. Hawai-ian’s regulated percentage fell from 50.3% to 49.2% over the last year, after making an opposite jump in categories the previous year.
The total number of companies in the EEI universe fell from 58 at year-end 2012 to 55 at year-end 2013, the result of merger activity. The buyouts of CH Energy (acquired by Fortis Inc. in 2013), NV Energy (acquired by MidAmerican Energy in 2013) and Central Vermont Power (acquired by Gaz Metro LP in 2012) caused the decrease. At the close of 2013, there were 39 Regulated, 13 Mostly Regulated and 3 Diversified companies (see List of Companies by Category at December 31, 2013).

BUSINESS STRATEGIES
38 EEI 2013 FINANCIAL REVIEW
Ameren Divests Merchant Generation to Dynegy
The year’s first major transaction, announced on March 14, took the form of Ameren’s move to exit the competitive generation business by selling its coal-fired merchant gen-eration fleet, comprised of five plants in Illinois, and a related energy mar-keting business to independent pow-er producer Dynegy. Ameren said the sale was motivated by its desire to focus the company exclusively on rate-regulated electric, natural gas and transmission operations, clarify-ing both its strategic direction and source of value to shareholders. The company said it expects the transac-tion will reduce business risk, im-prove the predictability of future earnings and cash flows, strengthen its credit profile and support its divi-dend. The divestiture was valued at approximately $900 million, includ-ing removal of $825 million of debt from Ameren’s consolidated balance sheet and an estimated $180 mil-lion of tax benefits expected to be substantially realized in 2015, par-tially offset by about $75 million in transaction-related costs and pen-sion liabilities retained by Ameren. Ameren received no cash proceeds as a result of the transaction. Ame-ren also announced plans for $8.1 billion in infrastructure investment from 2013 to 2017, largely in de-livery and transmission in Illinois and Missouri.
Seeking to boost its exposure to a power and capacity market recovery in the Midwest, Dynegy said the ac-quisition would build scale in a key market with assets similar to its cur-rent Illinois-based coal fleet while cre-ating operating synergies estimated
single state utilities with good organ-ic growth potential as profitable ad-ditions to larger holding companies.
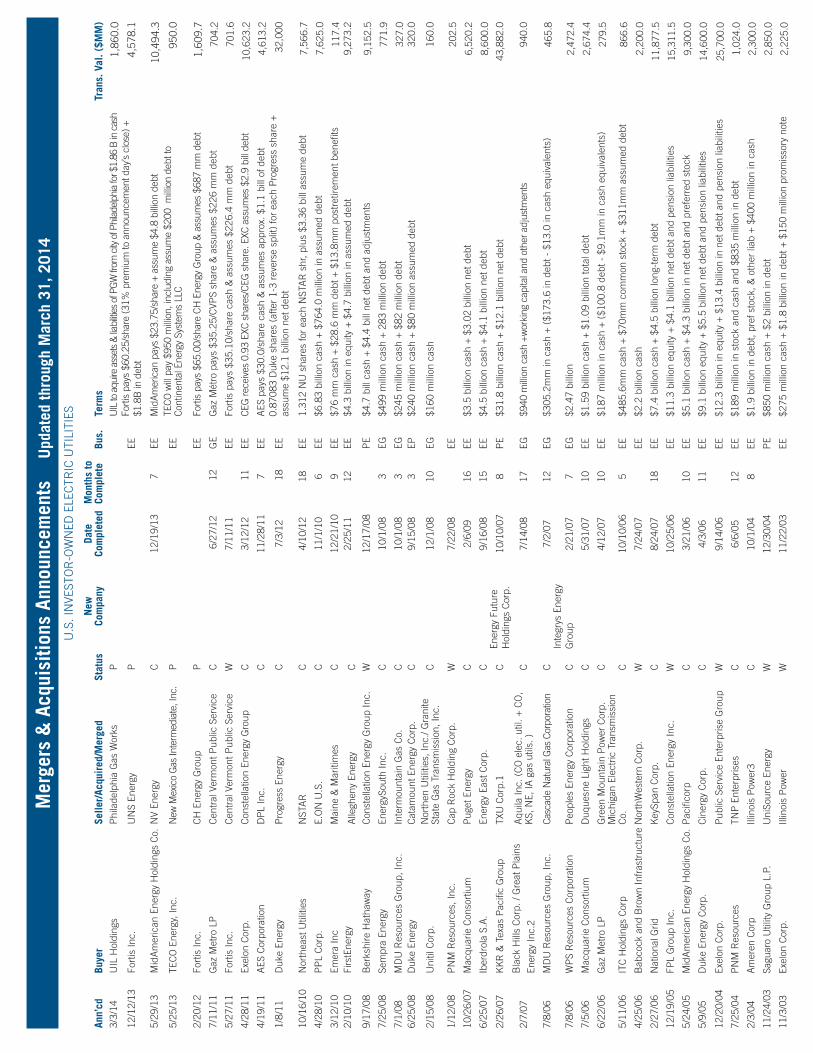
There were four whole company deals announced during the year: i) Ameren’s divestiture of merchant coal assets to Dynegy in a “back-to-basics” move; ii) MidAmerican’s acquisition of Nevada’s NV Energy; iii) a pure merchant power play in NRG’s bid for Edison Mission En-ergy; and iv) Canadian utility Fortis’ proposed purchase of Arizona’s UNS Energy. In each of the two deals tar-geting a regulated utility, the buyer wanted the utility just as it was, for its solid earnings and growth poten-tial, and with no plans for financial engineering, re-strategizing or cost cutting to wring out value. The year also produced a failed deal. In De-cember, Entergy and ITC Holdings abandoned plans to divest Entergy’s transmission assets to ITC after a two-year struggle marked by resis-tance from FERC, state regulators and other stakeholders.
Mergers and Acquisitions
There were no proposed combina-tions of multi-state diversified utili-ties announced in 2013, an area of M&A that was quiet for the second year in a row as many of the head-winds from 2012 persisted, including weak power demand, uncertain U.S. economic growth, challenging state regulatory navigation and low natu-ral gas prices with associated weak stock prices of utility holding com-panies with merchant generation. The most recent large deals were First Energy’s successful bid for Allegh-eny (closed in February 2011), the Exelon/Constellation merger (closed in March 2012), the “merger of equals” involving New England utili-ties NSTAR and Northeast Utilities (completed in April 2012) and the Duke/Progress merger (completed in July 2012). However, utility M&A was alive and relatively well in 2013, emphasizing movement of merchant assets and the appeal of high-quality
0
5
10
15
20
25
30
Source: EEI Finance Department
Status of Mergers & Acquisitions 1995–2013
U.S. INVESTOR-OWNED ELECTRIC UTILITIES
2010 2011 2012 20131995 1996 1997 1998 1999 2000 2001
Completed (98 total)
Announced (122 total)
Withdrawn (27 total)
(Number of Mergers & Acquisitions)
20062002 2003 2004 2005 2007 2008 2009

BUSINESS STRATEGIES
EEI 2013 FINANCIAL REVIEW 39
in Nevada. MidAmerican agreed to purchase all outstanding shares of NV Energy’s common stock for $23.75 per share in cash, for an enter-prise value of approximately $10 bil-lion. NV Energy shares jumped 23% on the announcement from their May 29 closing price of $19.28. In the weeks preceding the announce-ment, the shares had fallen, along with many interest rate sensitive dividend-paying stocks, about 11% off their late-April high of $21.63, evidently placing their value at an at-tractive level for MidAmerican.
MidAmerican cited NV Energy’s solid commitment to the state of Nevada and its performance as a high-quality energy business as mo-tivations for the deal, along with its similar corporate values, out-standing assets and superb manage-ment team. Analysts noted that NV Energy generates positive free cash flow, which supports a growing divi-dend, is benefitting from an improved regulatory environment in the state, and sits geographically alongside MidAmerican’s presence in nearby Utah, Idaho, Oregon and northern California. Analysts also cited NV Energy’s commitment to renewable energy and its growing solar genera-tion as an attraction, with Nevada’s renewable portfolio standard as one of the most aggressive in the nation, requiring that at least 25 percent of the company’s retail energy sales be derived from renewable energy resources by 2025.
NV Energy cited as deal drivers MidAmerican’s stability, expertise in renewable generation and ability to provide low-cost capital for NV Energy’s renewable energy growth
at $60 million annually by 2015. It will also benefit from acquiring an established retail business (Ameren Energy Marketing) with significant scale that supports its merchant goal and gas plants. Dynegy noted that its existing coal generation fleet and the acquired plants are compliant with the EPA’s Mercury and Air Toxic Standards, which should leave the combined portfolio well positioned to benefit from tightening supply as noncompliant or uneconomic gener-ation retires. Dynegy also noted the financial terms ensured that little if any capital support would be needed for the acquired plants, thereby pre-serving capital allocation flexibility. The company said targeted syner-gies along with forward natural gas prices and its view on forward power and capacity prices should make
the acquisition accretive to adjusted EBITDA in 2014 and to free cash flow by 2015.
The transaction was completed on December 2, 2013. In addition, in October 2013 Ameren entered into an agreement to sell three merchant gas-fired plants, which were not part of the Dynegy transaction, to pri-vate equity buyer Rockland Capi-tal. With that sale, which closed in early February 2014, Ameren com-pleted its exit from the merchant generation business.
MidAmerican Acquires NV EnergyOn May 30, Berkshire Hathaway
subsidiary MidAmerican Energy Holdings announced it had reached an agreement to acquire NV Energy, which serves approximately 1.3 mil-lion electric and natural gas customers
Status of Announced Mergers & Acquisitions1995–2013
U.S. INVESTOR-OWNED ELECTRIC UTILITIES
Year
1995199619971998199920002001200220032004200520062007200820092010201120122013
Totals
21
139
10236511136612242
98
Completed
813111026952233746–4513
122
Announced
333–214311–212––1––
27
Withdrawn
Source: EEI Finance Department

BUSINESS STRATEGIES
40 EEI 2013 FINANCIAL REVIEW
to provide NRG with a lower cost of capital for acquisition of generation assets, benefitting from investors’ hunt for yield in a very low interest rate environment. The subsidiary owns generation assets with long-term contracts and passes through cash flow to investors in the form of steady dividends. The structure’s dividend can grow as assets are added to the NRG Yield portfolio. By year-end 2013, the NRG Yield shares had appreciated 80% from their July IPO price of $22 per share. The EME portfolio contains 2,600 net MW of fully-contracted generation; 1,600 MW are under long-term contracts with credit-worthy counterparties, with a weighted average remaining contract life of 14 years. NRG noted that the contracted portfolio is com-posed of 1,100 net MW of wind ca-pacity and a 500 MW gas-fired fa-cility which came online during the summer of 2013.
NRG also said the acquisition would enhance its core generation platform, balancing the geographic distribution and dispatch-level di-versity of its conventional generation fleet by adding 1,200 MW of con-tracted gas assets in California and 4,300 MW of coal-fired capacity in PJM West.
The companies hoped to close the transaction in early 2014, following approval by the Federal Energy Reg-ulatory Commission (FERC), the U.S. Department of Justice and the Federal Trade Commission under the Hart-Scott-Rodino Act, and the Public Utility Commission of Texas. EME will also submit notice of the acquisition to the California Public Utilities Commission.
1,700 MW of wind capacity, 1,600 MW of natural gas-fired ca-pacity, 4,300 MW of coal-fired capacity and 400 MW of oil and waste coal generation. NRG cited three primary reasons for the deal: i) it increases NRG’s generation port-folio by nearly 8,000 MW, providing fuel diversity, geographic diversity and opportunities for economies of scale; ii) it significantly expands the pipeline of assets available to drive growth at NRG Yield Co. (NYSE: NYLD), with 1,600 MW of long-term, fully-contracted wind and natural gas assets; and iii) it builds off the platform and best practices developed in association with NRG’s acquisition in 2012 of GenOn En-ergy, which created the largest com-petitive power provider in the U.S.
As an indication of the broad secular trends reshaping the electric generation business, the companies and Wall Street analysts stressed the renewable generation component of the combination. The deal would make NRG the nation’s third-largest domestic renewable energy gen-erator, with over 2,900 net MW of wind and solar capacity in operation or under construction, while broad-ening the scale and geographic diver-sity of NRG’s renewable generation portfolio with the addition of 1,700 net MW of wind capacity, including 1,150 net MW outside the compa-ny’s concentration in the Texas and southwest U.S. region.
Another key benefit cited by the company and analysts is the sup-port the acquisition can provide to NRG Yield, a majority-owned sub-sidiary which NRG partially spun off through a July 2013 initial pub-lic offering. NRG Yield was set up
strategy. NV Energy will remain a Nevada company, operate as a sepa-rate corporate subsidiary of MidAm-erican under its current name and will continue to be headquartered in Las Vegas. The merger closed on December 19, 2013, sooner than the companies’ initial early 2014 estimate, after receiving state and federal regulatory approvals or clearances from the Public Utilities Commission of Nevada (PUCN), the Federal Energy Regulatory Commission (FERC), and the U.S. Department of Justice. The compa-nies said Nevada approval came fol-lowing a multi-party agreement in the state and a one-time bill credit to customers of NV Energy totaling $20 million.
NRG Bids for Edison Mission Energy
The year’s second merchant deal occurred on October 18 when in-dependent power producers NRG Energy and Edison Mission Energy (EME) agreed that NRG would ac-quire EME for $2.6 billion (or $1.6 billion net of approximately $1 bil-lion retained cash within EME) for 12.7 million shares of NRG com-mon stock, valued at approximately $350 million, and with the balance to be paid in cash. The terms im-ply a transaction enterprise value of approximately $2.8 billion after including $1.3 billion of adjusted non-recourse debt assumed in con-nection with the purchase. Santa Anna, California-based EME, a for-mer merchant power subsidiary of Edison International, filed Chapter 11 bankruptcy in December 2012.
EME’s generation portfolio con-sists of nearly 8,000 net MW locat-ed throughout the U.S., including

BUSINESS STRATEGIES
EEI 2013 FINANCIAL REVIEW 41
UNS acquisition is expected to be accretive to earnings in the first full year after closing, excluding one-time transaction costs. Fortis cited several specific reasons for its interest in UNS, including a 10-year com-pound annual growth rate in net in-come of 7.7% and in assets of 3.1%; increased geographic and regulatory diversification; a supportive regula-tory environment in Arizona, with rate design that allows pass-through of costs related to fuel, purchased power, environmental compliance, renewable resources, energy effi-ciency and distributed generation; and a favorable local economy that can support growth. UNS previous-ly projected that capital investment will total approximately US$2.3 bil-lion over the period 2013 through 2018, creating rate base growth at approximately 7% annually through 2018. Fortis said UNS Energy will remain a standalone utility in the Fortis model; its headquarters and management team will remain in Tucson, Arizona and UNS custom-ers will not pay for costs related to the transaction.
UNS said Fortis’ financial strength will improve access to capital to fund the ongoing diversification of UNS’ generating fleet, including growth in solar generation, as well as other infrastructure investments. Upon closing, Fortis plans to invest $200 million in UNS Energy to strength-en its balance sheet and help fund the planned purchase of a natural gas-fired plant, a transaction that will reduce UNS subsidiary Tuscon Electric Power’s reliance on coal-fired generation.
Fortis cited as motivation for the deal UNS’ strong management team with proven regulatory exper-tise and high-quality regulated util-ity assets located in a region of the U.S. experiencing above-average economic growth, saying the acqui-sition is consistent with its strategy of investing in high-quality regu-lated Canadian and U.S. utilities. Fortis acquired New York’s Hudson Valley utility CH Energy in a deal announced in 2012, closing a year later in June 2013. Fortis’ 2011 bid for Central Vermont Public Service (CVPS) was terminated when CVPS accepted what it deemed a more at-tractive offer from another Canadian utility (Gaz Metro). Fortis said the
Fortis Seeks to Acquire UNS Energy
The year’s whole-company activ-ity concluded with Canadian util-ity Fortis’ December 11 offer to ac-quire Arizona regulated utility UNS Energy for $60.25 per share in cash, resulting in an aggregate value of ap-proximately $4.3 billion, including assumption of approximately $1.8 billion of debt. UNS shares closed at $45.84 the day before the announce-ment, resulting in about a 31% pre-mium to the pre-offer price. UNS Energy has approximately $1.5 bil-lion in revenue and total assets of ap-proximately $4.3 billion and serves 654,000 electricity and gas custom-ers, primarily in Arizona.
Merger Impacts 1995–2013U.S. INVESTOR-OWNED ELECTRIC UTILITIES
Number of Companies Declined by 50% since Dec.’95
Source: EEI Finance Department
Note: Based on completed mergers in the EEI Index groupof electric utilities.
Date No. of Utilities Change
12/31/95 98 N/A12/31/96 98 – 12/31/97 91 (7.14%)12/31/98 86 (5.49%)12/31/99 83 (8.79%)12/31/00 71 (14.46%)12/31/01 69 (2.82%)12/31/02 65 (5.80%)12/31/03 65 – 12/31/04 65 – 12/31/05 65 – 12/31/06 64 (1.54%)12/31/07 61 (4.69%)12/31/08 59 (3.28%)12/31/09 58 (1.69%)12/31/10 56 (3.45%)12/31/11 55 (1.79%)12/31/12 51 (7.27%)12/31/13 49 (3.92%)
Mer
gers
& A
cqui
sitio
ns A
nnou
ncem
ents
U
pdat
ed th
roug
h M
arch
31,
201
4U
.S. I
NVE
STO
R-O
WN
ED E
LEC
TRIC
UTI
LITI
ES
Ann’
cdBu
yer
Selle
r/Ac
quir
ed/M
erge
dSt
atus
New
Co
mpa
nyDa
teCo
mpl
eted
Mon
ths
to
Com
plet
eBu
s.Te
rms
Tran
s. V
al. (
$MM
)3/
3/14
UIL
Hol
ding
sP
hila
delp
hia
Gas
Wor
ksP
UIL
to a
quire
ass
ets
& lia
biliti
es o
f PG
W fr
om c
ity o
f Phi
lade
lphi
a fo
r $1.
86 B
in c
ash
1,86
0.0
12/1
2/13
Fort
is In
c.U
NS
Ener
gyP
EEFo
rtis
pays
$60
.25/
shar
e (3
1% p
rem
ium
to a
nnou
ncem
ent d
ay’s
clo
se) +
$1
.8B
in d
ebt
4,57
8.1
5/29
/13
Mid
Am
eric
an E
nerg
y H
oldi
ngs
Co.
NV
Ener
gyC
12/1
9/13
7EE
Mid
Am
eric
an p
ays
$23.
75/s
hare
+ a
ssum
e $4
.8 b
illio
n de
bt10
,494
.3
5/25
/13
TEC
O E
nerg
y, In
c.N
ew M
exic
o G
as In
term
edia
te, I
nc.
PEE
TEC
O w
ill p
ay $
950
mill
ion,
incl
udin
g as
sum
e $2
00 m
illio
n de
bt to
C
ontin
enta
l Ene
rgy
Syst
ems
LLC
950.
0
2/20
/12
Fort
is In
c.C
H E
nerg
y G
roup
PEE
Forti
s pa
ys $
65.0
0/sh
are
CH
Ene
rgy
Gro
up &
ass
umes
$68
7 m
m d
ebt
1,60
9.7
7/11
/11
Gaz
Met
ro L
PC
entr
al V
erm
ont P
ublic
Ser
vice
C
6/2
7/12
12
GE
Gaz
Mét
ro p
ays
$35.
25/C
VPS
shar
e &
ass
umes
$22
6 m
m d
ebt
704.
2
5/27
/11
Fort
is In
c.C
entr
al V
erm
ont P
ublic
Ser
vice
W
7/11
/11
EE
Fort
is p
ays
$35.
10/s
hare
cas
h &
ass
umes
$22
6.4
mm
deb
t70
1.6
4/28
/11
Exel
on C
orp.
Con
stel
latio
n En
ergy
Gro
up
C
3/12
/12
11
EEC
EG re
ceiv
es 0
.93
EXC
sha
res/
CEG
sha
re. E
XC a
ssum
es $
2.9
bill
debt
10,6
23.2
4/19
/11
AES
Cor
pora
tion
DP
L In
c.C
11
/28/
117
EEA
ES p
ays
$30.
0/sh
are
cash
& a
ssum
es a
ppro
x. $
1.1
bill
of d
ebt
4,61
3.2
1/8/
11D
uke
Ener
gyP
rogr
ess
Ener
gyC
7/
3/12
1
8EE
0.87
083
Duk
e sh
ares
(af
ter
1-3
reve
rse
split
) fo
r ea
ch P
rogr
ess
shar
e +
as
sum
e $1
2.1
billi
on n
et d
ebt
32,0
00
10/1
6/10
Nor
thea
st U
tiliti
esN
STA
RC
4/10
/12
18EE
1.31
2 N
U s
hare
s fo
r ea
ch N
STA
R s
hr, p
lus
$3.3
6 bi
ll as
sum
e de
bt
7,56
6.7
4/28
/10
PP
L C
orp.
E.O
N U
.S.
C11
/1/1
06
EE$6
.83
billi
on c
ash
+ $
764.
0 m
illio
n in
ass
umed
deb
t7,
625.
0
3/12
/10
Emer
a In
cM
aine
& M
ariti
mes
C12
/21/
109
EE$7
6 m
m c
ash
+ $
28.6
mm
deb
t + $
13.8
mm
pos
tret
irem
ent b
enefi
ts11
7.4
2/10
/10
Firs
tEne
rgy
Alle
ghen
y En
ergy
C
2/25
/11
12EE
$4.3
bill
ion
in e
quity
+ $
4.7
billi
on in
ass
umed
deb
t9,
273.
2
9/17
/08
Ber
kshi
re H
atha
way
Con
stel
latio
n En
ergy
Gro
up In
c.
W12
/17/
08
PE
$4.7
bill
cas
h +
$4.
4 bi
ll ne
t deb
t and
adj
ustm
ents
9,15
2.5
7/25
/08
Sem
pra
Ener
gyEn
ergy
Sout
h In
c.
C10
/1/0
83
EG$4
99 m
illio
n ca
sh +
283
mill
ion
debt
771.
9
7/1/
08M
DU
Res
ourc
es G
roup
, Inc
.In
term
ount
ain
Gas
Co.
C
10/1
/08
3EG
$245
mill
ion
cash
+ $
82 m
illio
n de
bt32
7.0
6/25
/08
Duk
e En
ergy
Cat
amou
nt E
nerg
y C
orp.
C
9/15
/08
3EP
$240
mill
ion
cash
+ $
80 m
illio
n as
sum
ed d
ebt
320.
0
2/15
/08
Uni
til C
orp.
N
orth
en U
tiliti
es, I
nc./
Gra
nite
St
ate
Gas
Tra
nsm
issi
on, I
nc.
C12
/1/0
810
EG$1
60 m
illio
n ca
sh16
0.0
1/12
/08
PN
M R
esou
rces
, Inc
.C
ap R
ock
Hol
ding
Cor
p.W
7/22
/08
EE
202.
5
10/2
6/07
Mac
quar
ie C
onso
rtiu
mP
uget
Ene
rgy
C2/
6/09
16EE
$3.5
bill
ion
cash
+ $
3.02
bill
ion
net d
ebt
6,52
0.2
6/25
/07
Iber
drol
a S.
A.
Ener
gy E
ast C
orp.
C9/
16/0
815
EE$4
.5 b
illio
n ca
sh +
$4.
1 bi
llion
net
deb
t 8,
600.
0
2/26
/07
KK
R &
Tex
as P
acifi
c G
roup
TXU
Cor
p.1
CEn
ergy
Fut
ure
H
oldi
ngs
Cor
p.10
/10/
078
PE
$31.
8 bi
llion
cas
h +
$12
.1 b
illio
n ne
t deb
t43
,882
.0
2/7/
07B
lack
Hill
s C
orp.
/ G
reat
Pla
ins
Ener
gy In
c.2
Aqu
ila In
c. (
CO
ele
c. u
til. +
CO
, K
S, N
E, IA
gas
util
s. )
C7/
14/0
817
EG$9
40 m
illio
n ca
sh +
wor
king
cap
ital a
nd o
ther
adj
ustm
ents
940.
0
7/8/
06M
DU
Res
ourc
es G
roup
, Inc
.C
asca
de N
atur
al G
as C
orpo
ratio
nC
7/2/
0712
EG$3
05.2
mm
in c
ash
+ (
$173
.6 in
deb
t - $
13.0
in c
ash
equi
vale
nts)
465.
8
7/8/
06W
PS
Res
ourc
es C
orpo
ratio
nP
eopl
es E
nerg
y C
orpo
ratio
nC
Inte
grys
Ene
rgy
Gro
up2/
21/0
77
EG$2
.47
billi
on2,
472.
4
7/5/
06M
acqu
arie
Con
sort
ium
Duq
uesn
e Li
ght H
oldi
ngs
C5/
31/0
710
EE$1
.59
billi
on c
ash
+ $
1.09
bill
ion
tota
l deb
t2,
674.
4
6/22
/06
Gaz
Met
ro L
PG
reen
Mou
ntai
n P
ower
Cor
p.C
4/12
/07
10EE
$187
mill
ion
in c
ash
+ (
$100
.8 d
ebt -
$9.
1mm
in c
ash
equi
vale
nts)
279.
5
5/11
/06
ITC
Hol
ding
s C
orp
Mic
higa
n El
ectr
ic T
rans
mis
sion
C
o.C
10/1
0/06
5EE
$485
.6m
m c
ash
+ $
70m
m c
omm
on s
tock
+ $
311m
m a
ssum
ed d
ebt
866.
6
4/25
/06
Bab
cock
and
Bro
wn
Infr
astr
uctu
reN
orth
Wes
tern
Cor
p.W
7/24
/07
EE$2
.2 b
illio
n ca
sh2,
200.
0
2/27
/06
Nat
iona
l Grid
Key
Span
Cor
p.C
8/24
/07
18EE
$7.4
bill
ion
cash
+ $
4.5
billi
on lo
ng-t
erm
deb
t11
,877
.5
12/1
9/05
FPL
Gro
up In
c.C
onst
ella
tion
Ener
gy In
c.W
10/2
5/06
EE$1
1.3
billi
on e
quity
+ $
4.1
billi
on n
et d
ebt a
nd p
ensi
on li
abili
ties
15,3
11.5
5/24
/05
Mid
Am
eric
an E
nerg
y H
oldi
ngs
Co.
Pac
ifico
rpC
3/21
/06
10EE
$5.1
bill
ion
cash
+ $
4.3
billi
on in
net
deb
t and
pre
ferr
ed s
tock
9,30
0.0
5/9/
05D
uke
Ener
gy C
orp.
Cin
ergy
Cor
p.C
4/3/
0611
EE$9
.1 b
illio
n eq
uity
+ $
5.5
billi
on n
et d
ebt a
nd p
ensi
on li
abili
ties
14,6
00.0
12/2
0/04
Exel
on C
orp.
Pub
lic S
ervi
ce E
nter
pris
e G
roup
W
9/14
/06
EE$1
2.3
billi
on in
equ
ity +
$13
.4 b
illio
n in
net
deb
t and
pen
sion
liab
ilitie
s25
,700
.0
7/25
/04
PN
M R
esou
rces
TNP
Ent
erpr
ises
C6/
6/05
12EE
$189
mill
ion
in s
tock
and
cas
h an
d $8
35 m
illio
n in
deb
t1,
024.
0
2/3/
04A
mer
en C
orp
Illin
ois
Pow
er3
C10
/1/0
48
EE$1
.9 b
illio
n in
deb
t, pr
ef s
tock
, & o
ther
liab
+ $
400
mill
ion
in c
ash
2,30
0.0
11/2
4/03
Sagu
aro
Util
ity G
roup
L.P
.U
niSo
urce
Ene
rgy
W12
/30/
04P
E$8
50 m
illio
n ca
sh +
$2
billi
on in
deb
t2,
850.
0
11/3
/03
Exel
on C
orp.
Illin
ois
Pow
erW
11/2
2/03
EE$2
75 m
illio
n ca
sh +
$1.
8 bi
llion
in d
ebt +
$15
0 m
illio
n pr
omis
sory
not
e
2,22
5.0
4/30
/02
Aqu
ila In
cC
ogen
trix
Ene
rgy
Inc
W8/
2/02
EIP
P$4
15 m
illio
n ca
sh +
$1.
125
billi
on in
ass
umed
deb
t1,
540.
0
4/29
/02
Am
eren
Cor
pC
ILC
OR
P4
C1/
31/0
39
EE$5
41 m
illio
n ca
sh +
$78
1 in
ass
umed
deb
t + $
41 m
illio
n in
pre
f sto
ck1,
400.
0
10/8
/01
Nor
thw
est N
atur
al G
asP
ortla
nd G
ener
alW
5/16
/02
GE
$1.5
5 bi
llion
cas
h +
$25
0mm
in s
tock
1,80
0.0
9/20
/01
Duk
e En
ergy
Wes
tcoa
st E
nerg
yC
3/14
/02
6EG
Equi
ty +
cas
h va
lued
at $
27.9
0 pe
r W
estc
oast
sha
re8,
500.
0
9/10
/01
Dom
inio
n R
esou
rces
Loui
s D
reyf
us N
atur
al G
as
C11
/1/0
12
EG$8
90m
m c
ash
+ $
900m
m s
tock
+$5
05m
m d
ebt
2,29
5.0
2/20
/01
Ener
gy E
ast
RG
S En
ergy
C6/
28/0
216
EE$1
.4 b
ill. c
ash
& e
quity
+ $
1.0
bill.
net
deb
t2,
400.
0
2/12
/01
PEP
CO
Con
ectiv
C8/
1/02
18EE
$2.2
bill
cas
h &
equ
ity +
$2.
8 bi
ll. n
et d
ebt
5,00
0.0
11/9
/00
PN
MW
este
rn R
esou
rces
5W
1/8/
02EE
Stoc
k tr
ansf
er4,
442.
0
10/2
/00
Nor
thW
este
rnM
onta
na P
ower
6C
2/15
/02
16EE
$1.1
bill
ion
in c
ash
1,10
0.0
9/5/
00N
atio
nal G
rid G
roup
N
iaga
ra M
ohaw
kC
1/31
/02
16EE
$19
per
shar
e8,
900.
0
8/8/
00Fi
rstE
nerg
yG
PU
Inc.
C11
/7/0
115
EE$3
5.60
per
sha
re12
,000
.0
7/31
/00
FPL
Gro
upEn
terg
yW
4/2/
01EE
1/1
- FP
L, 0
.585
/1 -
ETR
27,0
00.0
7/17
/00
AES
Cor
pora
tion
IPA
LCO
C3/
27/0
18
IPP
E$2
5 pe
r sh
are
3,0
40.0
6/30
/00
NS
Pow
erB
ango
r H
ydro
CEm
era
10/1
0/01
16EE
$26.
50 p
er s
hare
206.
0
5/30
/00
WP
S R
esou
rces
Wis
cons
in F
uel a
nd L
ight
C4/
2/01
11EG
1.73
sha
res
of W
PSR
55.0
2/28
/00
Pow
erG
en p
lcLG
&E
C12
/11/
0010
EE$2
4.85
per
sha
re5,
400.
0
11/1
0/99
Ener
gy E
ast
Ber
kshi
re E
nerg
y R
esou
rces
C9/
1/00
10EG
$38
per
shar
e13
6.0
11/8
/99
Sier
ra P
acifi
c R
esou
rces
Por
tland
Gen
eral
W4/
26/0
1EE
$2.1
bill
ion
3,10
0.0
11/4
/99
Key
Span
East
ern
Ente
rpris
esC
11/9
/00
12EG
$64
per
shar
e2,
500.
0
10/2
5/99
Ber
kshi
re H
atha
way
Mid
Am
eric
an E
nerg
yC
3/14
/00
5P
E$3
5.05
per
sha
re9,
000.
0
10/1
3/99
Con
solid
ated
Edi
son
Nor
thea
st U
tiliti
esW
3/15
/01
EE$2
5 pe
r sh
are
7,50
0.0
10/5
/99
DTE
Ene
rgy
MC
N E
nerg
yC
5/31
/01
19EG
$28.
50 p
er s
hare
4,60
0.0
9/23
/99
Pec
o En
ergy
Co.
Uni
com
Cor
p.C
Exel
on10
/23/
0013
EE0.
95/1
- U
CM
, 1/1
- P
E31
,800
.0
9/9/
99A
llegh
eny
Ener
gyW
est V
irgin
ia P
ower
C1/
4/00
4EE
$75
mill
ion
75.0
8/23
/99
Car
olin
a P
ower
& L
ight
Flor
ida
Pro
gres
sC
Pro
gres
s En
ergy
11
/30/
0015
EE$5
4 pe
r sh
are
8,00
0.0
6/30
/99
Ener
gy E
ast
CTG
Res
ourc
esC
9/1/
0015
EG$4
1 pe
r sh
are
575.
0
6/28
/99
Wis
cons
in E
nerg
y C
orp.
Wic
or In
c.C
4/26
/00
10EG
$31.
50 p
er s
hare
1,27
5.0
6/15
/99
Ener
gy E
ast
CM
P G
roup
, Inc
.C
9/1/
0015
EE$2
9.50
per
sha
re
1,22
8.0
6/15
/99
Nor
thea
st U
tiliti
esYa
nkee
Gas
C3/
1/00
9EG
$45
per
shar
e67
9.0
6/14
/99
Dyn
egy
Illin
ova
C2/
2/00
7IP
PE
0.69
/1 -
DYN
, 1/1
- IL
N2,
000.
0
6/14
/99
Indi
ana
Ener
gySi
gCor
pC
Vect
ren
3/31
/00
9G
E1.
33/1
- S
IG, 1
/1-
IEI
1,90
0.0
6/7/
99N
isou
rce
Inc.
Col
umbi
a En
ergy
C11
/1/0
017
EG$7
4/sh
are
6,20
0.0
5/25
/99
S.W
. Acq
uisi
tion
Cor
p.TN
P C
orpo
ratio
nC
4/7/
0011
PE
$74
per
shar
e10
0.0
5/17
/99
OG
E En
ergy
Tran
sok
LLC
C7/
1/99
2EG
$701
mill
ion
701.
0
5/11
/99
Util
icor
p U
nite
dEm
pire
Dis
tric
t Ele
ctric
W1/
3/01
EE$2
9.50
per
sha
re in
cas
h or
sto
ck76
5.0
4/23
/99
Ener
gy E
ast
Con
nect
icut
Ene
rgy
C2/
9/00
9EG
$42
per
shar
e, 5
0% c
ash
and
1.43
-1.8
2/1
- C
NE
617.
0
3/25
/99
Nor
ther
n St
ates
Pow
erN
ew C
entu
ry E
nerg
ies
CXc
el E
nerg
y8/
17/0
017
EE1.
55/1
- N
CE,
1/1
- N
SP6,
000.
0
3/5/
99U
tilic
orp
Uni
ted
St. J
osep
h P
ower
& L
ight
Co.
C12
/29/
0021
EE$2
3 pe
r sh
are
277.
0
2/22
/99
Dom
inio
n R
esou
rces
Con
solid
ated
Nat
ural
Gas
Co.
C1/
28/0
011
EG$6
6.60
per
sha
re6,
400.
0
2/17
/99
SCA
NA
Cor
pP
SC O
f Nor
th C
arol
ina
C2/
10/0
012
EG$3
3 pe
r sh
are
or 1
.02-
1.45
sha
res
of S
CG
9,00
0.0
2/1/
99N
atio
nal G
rid U
SA/N
EES
East
ern
Util
ities
Ass
ocia
tes
C4/
19/0
014
EE$3
1 pe
r sh
are
in c
ash
634.
0
2/1/
99Se
mpr
a En
ergy
KN
Ene
rgy
W6/
1/99
EG$2
5 pe
r sh
are
6.0
1 TX
U (
now
Ene
rgy
Futu
re H
oldi
ngs
Cor
p.)
was
acq
uire
d by
the
Texa
s En
ergy
Fut
ure
Hol
ding
s Li
mite
d P
artn
ersh
ip (
TEF)
on
10/1
0/20
07.
TE
F w
as fo
rmed
by
a gr
oup
of in
vest
ors
led
by K
ohlb
erg
Kra
vis
Rob
erts
and
Tex
as P
acifi
c G
roup
to fa
cilit
ate
the
mer
ger.
2 A
mer
en p
urch
ased
Illin
ois
Pow
er fr
om D
yneg
y C
orpo
ratio
n. D
yneg
y C
orp
acqu
ired
Illin
ois
Pow
er in
Feb
ruar
y 20
00.
3 A
mer
en p
urch
ased
CIL
CO
RP
from
AES
Cor
pora
tion.
AES
Cor
p ac
quire
d C
ILC
OR
P in
O
ctob
er 1
999.
4 P
NM
pur
chas
ed W
este
rn R
esou
rces
’ ele
ctric
ope
ratio
ns in
clud
ing
gene
ratio
n,
tran
smis
sion
, and
dis
trib
utio
n.
5 N
orth
Wes
tern
Cor
pora
tion
purc
hase
d M
onta
na P
ower
’s e
lect
ric a
nd n
atur
al g
as tr
ansm
issi
on
and
dist
ribut
ion
asse
ts.
NA
= A
cqui
red
com
pany
priv
atel
y he
ld o
r no
dat
a av
aila
ble
Sour
ce: E
EI F
inan
ce D
epar
tmen
t and
SN
L Fi
nanc
ial
C =
Com
plet
edW
= W
ithdr
awn
PN
= P
endi
ngE
= E
lect
ricG
= G
as
O =
Oil
IPP
= In
depe
nden
t
Pow
er P
rodu
cer
P =
Priv
atiz
ed

BUSINESS STRATEGIES
44 EEI 2013 FINANCIAL REVIEW
2013, particularly with respect to wind generation. A total of 17,163 MW of new capacity was added to the grid, 46% less than in 2012 and the lowest annual total of the last five years. Natural gas (7,370 MW) and solar (4,936 MW) accounted for the majority of the new capacity.
While additions were lower for most fuels when compared to prior years, the total for wind generation notably declined. The expiration of the federal production tax credit (PTC) at the end of 2012 sent de-velopers rushing to bring new wind online, effectively meeting the need for wind capacity in 2013 in ad-vance. As a result, wind additions fell more than 85% in 2013, declining from a record high 12,327 MW in 2012 to just 1,646 MW, a nine-year low. New coal capacity (1,618 MW) continued to decline in response to impending environmental regula-tions and low natural gas prices. Nuclear uprates also fell, to 172 MW, although the total was in line with historical annual activity.
While renewables were the domi-nant source of new capacity in 2012, natural gas regained the lead in 2013 (7,370 MW) due to the attractive economics associated with natural gas plants (comparatively low up-front capital costs, lower emissions compared to coal and low natural gas prices) as well as the drop off in wind additions.
Solar energy had a record break-ing year (4,936 MW), surpassing wind for the first time as the lead-ing source of new renewable capac-ity. The growth in solar has been driven by falling photovoltaic (PV)
Service Commission’s rejection of the deal on December 10, 2013. Since the termination was a mutual decision, there were no termination fees or penalties for either company.
While affirming its conviction the divestiture would have deliv-ered real benefits to ratepayers and all stakeholders, upon terminating the deal Entergy said its transmis-sion network will play an integral part in its growth plan, noting its service territory is primed for strong economic development with over $50 billion of capital investment announced by third parties over the past 12 to 18 months that has poten-tial to add more than 2,000 mega-watts of load. The company said its preliminary 2014-2016 capital plan includes $1.7 billion for transmis-sion investment and that it’s on track to transfer functional control of its transmission systems to the Mid-continent Independent System Op-erator, which Entergy estimates will save customers approximately $1.4 billion over the next decade. Entergy also affirmed its five to seven percent utility net income compound aver-age growth rate outlook through 2016, off 2013 base, driven by load growth, capital investment and cost-saving initiatives.
Construction
Generation
New CapacityAfter adding a record amount of
new generation capacity in 2012, the electric utility industry scaled back the pace of development in
New Capacity Online (MW) 2009-2013
p = preliminary r = revised
Note: Totals may reflect rounding. Historical data subject to revision.
Source: Ventyx, Inc., The Velocity Suite and EEI Finance Department
U.S. Investor- Owned Electric Entire2013p Utilities Industry New Plant 1,288 9,920Plant expansions 3,356 7,243Total 4,644 17,163
2012r New Plant 6,331 17,962Plant expansions 7,225 13,540Total 13,556 31,503 2011 New Plant 1,977 10,961Plant expansions 5,296 11,544Total 7,272 22,505 2010 New Plant 3,221 8,337Plant expansions 5,847 12,256Total 9,068 20,593 2009 New Plant 5,182 13,710Plant expansions 6,676 11,712Total 11,858 25,422
The companies hope to close the transaction by the end of 2014, following approval by Arizona state regulators, the Federal Energy Regu-latory Commission and satisfaction of any anti-trust concerns under the Hart-Scott-Rodino Act of 1976.
ITC and Entergy Terminate Transmission Deal
The year came to a close with news that another large proposed multi-state merger had fallen victim to dissension from regulators and stakeholders regarding division of an-ticipated benefits from the deal. But this was not a proposed combination of regulated utilities. Instead, it was the agreement announced two years earlier, on December 5, 2011, that Gulf Coast regional utility Entergy would divest its transmission assets to Michigan-based ITC Holdings, the nation’s largest independent transmission company. The deal encountered resistance throughout 2013 from state regulators, public officials and consumer groups across Louisiana, Mississippi, Arkansas and Texas, who expressed concerns the deal would diminish state regulatory jurisdiction over rates, force con-sumers to pay more for power and offer no benefits that couldn’t also be achieved by Entergy integrating its transmission assets with the MISO regional transmission organization. The companies withdrew their ap-plication in Texas in August 2013 and prepared to make a second at-tempt at gaining approval, then Arkansas regulators suspended their consideration of the deal after the Texas move. The two companies ter-minated the proposed merger three days after the Mississippi Public

BUSINESS STRATEGIES
EEI 2013 FINANCIAL REVIEW 45
panel costs, the availability of fi-nancial incentives at both the fed-eral and state level, and supportive policies such as renewable portfolio standards and net metering. Several large, utility-scale solar PV plants entered commercial operation, in-cluding NextEra’s Desert Sunlight Solar farm and MidAmerican’s Topaz Solar farm, both in Califor-nia. In addition, it was a banner year for solar thermal generation despite the competition posed by PV plants and their rapidly declining costs. A total of 802 MW of solar thermal ca-pacity entered commercial operation
Service Commission’s rejection of the deal on December 10, 2013. Since the termination was a mutual decision, there were no termination fees or penalties for either company.
While affirming its conviction the divestiture would have deliv-ered real benefits to ratepayers and all stakeholders, upon terminating the deal Entergy said its transmis-sion network will play an integral part in its growth plan, noting its service territory is primed for strong economic development with over $50 billion of capital investment announced by third parties over the past 12 to 18 months that has poten-tial to add more than 2,000 mega-watts of load. The company said its preliminary 2014-2016 capital plan includes $1.7 billion for transmis-sion investment and that it’s on track to transfer functional control of its transmission systems to the Mid-continent Independent System Op-erator, which Entergy estimates will save customers approximately $1.4 billion over the next decade. Entergy also affirmed its five to seven percent utility net income compound aver-age growth rate outlook through 2016, off 2013 base, driven by load growth, capital investment and cost-saving initiatives.
Construction
Generation
New CapacityAfter adding a record amount of
new generation capacity in 2012, the electric utility industry scaled back the pace of development in
New Capacity Online (MW) 2009-2013
p = preliminary r = revised
Note: Totals may reflect rounding. Historical data subject to revision.
Source: Ventyx, Inc., The Velocity Suite and EEI Finance Department
U.S. Investor- Owned Electric Entire2013p Utilities Industry New Plant 1,288 9,920Plant expansions 3,356 7,243Total 4,644 17,163
2012r New Plant 6,331 17,962Plant expansions 7,225 13,540Total 13,556 31,503 2011 New Plant 1,977 10,961Plant expansions 5,296 11,544Total 7,272 22,505 2010 New Plant 3,221 8,337Plant expansions 5,847 12,256Total 9,068 20,593 2009 New Plant 5,182 13,710Plant expansions 6,676 11,712Total 11,858 25,422
at the Solana Generating Station in Arizona, the Genesis Solar Energy Project and Ivanpah Solar facility in California, and Kalaeloa Solar One in Hawaii. Distributed solar gen-eration also grew rapidly as consum-ers and businesses put solar panels on rooftops.
New capacity added by investor-owned electric utilities totaled 4,644 MW, only one-third the amount in 2012 and the lowest annual total in more than 10 years. While investor-owned utilities’ share of overall in-dustry development is lower than in
recent years, it should be noted that most non-utility owned capacity is paid for through power purchase agreements (PPAs) or other arrange-ments with utility buyers.
CancelationsCapacity canceled or postponed
by investor-owned utilities totaled 15,125 MW in 2013, a slight increase over 2012’s level. The bulk (8,836 MW) are cancelled nuclear units or those whose estimated completion dates were delayed. Duke Energy canceled plans for a new reactor at the Levy County site in Florida and postponed plans for a new unit at their Harris plant in North Carolina. Energy Future Holdings postponed two units planned in Texas, and South-ern Company postponed plans for a unit in Florida. It remains difficult to obtain financing for new nuclear units given their high upfront capital costs compared to natural gas plants.
AnnouncementsInvestor-owned electric utilities
announced plans for 9,962 MW of new capacity in 2013, a 63% in-crease from 2012. Natural gas gen-eration led announcements, at 6,212 MW, a 22% increase from the prior year. The largest projects were an-nounced by Duke Energy and San Diego Gas & Electric, in both cases for natural gas capacity that offsets retiring nuclear plants. Duke is-sued an RFP to build a 1,640 MW natural gas combined cycle plant in Citrus County, Florida to replace re-tired capacity at the nearby Crystal River Nuclear Plant. San Diego Gas & Electric announced plans to build a 1,000 MW natural gas plant at Camp Pendleton in California to

BUSINESS STRATEGIES
46 EEI 2013 FINANCIAL REVIEW
Investor- Entire Investor- Entire Investor- Entire Investor- Entire Investor- Entire Owned Industry Owned Industry Owned Industry Owned Industry Owned Industry 2009 2009 2010 2010 2011 2011 2012r 2012r 2013p 2013p
(MW)
New Capacity Online by Fuel Type 2009-2013
p = preliminaryr = revised Note: Other includes diesel, fuel oil, landfill gas, pet coke, solar/PV, waste heat, water, wood, biomass, and fuel cells.Entire Industry includes all new capacity placed on the grid by investor-owned electric utilities, independent power producers, municipals,co-ops, government authorities and corporations. Data includes expansions and new plants.Prior year data revised to incorporate additional data on solar projects.
Source: Ventyx, Inc., The Velocity Suite and EEI Finance Department
0
5000
10000
15000
20000
25000
30000
U.S. Investor-Owned Elecric Utilities Entire IndustryFuel Type Online Online Online Online Online Online Online Online Online Online 2009 2010 2011 2012r 2013p 2009 2010 2011 2012r 2013p
Coal 1,998 4,848 689 2,080 673 3,566 6,692 1,909 4,823 1,618
Natural Gas 6,249 2,313 4,283 6,024 2,844 10,627 7,072 10,299 9,395 7,370
Nuclear 245 154 341 799 97 245 154 353 875 172
Wind 3,146 1,496 1,546 3,958 483 9,451 5,126 7,464 12,327 1,646
Solar 40 100 322 549 301 418 772 1,614 2,882 4,936
Other 180 157 90 146 246 1,115 777 866 1,200 1,421
Total 11,858 9,068 7,272 13,556 4,644 25,422 20,593 22,505 31,503 17,163
Coal
Natural Gas
Nuclear
Wind
Solar
Other

BUSINESS STRATEGIES
EEI 2013 FINANCIAL REVIEW 47
0
1,000
2,000
3,000
4,000
5,000
6,000
7,000
8,000
9,000
2013p2012r201120102009
Regulated
competitive
(MW)
Notes: Plant category based on designated operating companyowner. Totals may reflect rounding.p: preliminaryr: revised
Source: Ventyx, Inc., The Velocity Suite and EEI Finance Department
U.S. INVESTOR-OWNED ELECTRIC UTILITIES
New Capacity Online – Regulated vs. Competitive
2009 2010 2011 2012r 2013p
Total Competitive 4,320 3,233 1,530 4,867 1,303
Total Regulated 7,538 5,835 5,742 8,690 3,340
Total 11,858 9,068 7,272 13,556 4,644
Competitive
Regulated
New Capacity Online by Region 2009-2013
p = preliminaryr = revised Note: Data includes new plants and expansions of existing plants, including nuclear uprates. Totals may reflect rounding. ReliabilityFirst Corporation (RFC) began operations on 1/1/06 and includes ECAR, MAAC, and MAIN.
Source: Ventyx, Inc., The Velocity Suite and EEI Finance Department
U.S. INVESTOR-OWNED ELECTRIC UTILITIES
2009 2010 2011 2012r 2013p Region Online Cancelled Online Cancelled Online Cancelled Online Cancelled Online CancelledECAR — — — — — — — — — —ERCOT 2,589 3,935 1,229 — — 465 304 — 402 3,632FRCC 4,117 — 20 2,390 1,250 — 251 — 1,361 2,500HCC 5 — 113 — — — 21 — — —MAAC — — — — — — — — — —MAIN — — — — — — — — — —MRO 1,060 504 351 532 373 500 881 1,078 112 439NPCC 8 124 3 1 39 350 245 — 17 178RFC 486 1,288 741 3,175 1,458 93 2,202 1,618 904 2,703SERC 567 4,131 1,770 605 2,635 — 5,091 44 646 4,921SPP 740 630 2,347 80 431 — 1,590 150 203 751WECC 2,287 4,519 2,495 504 1,083 2,202 2,741 10,230 100 3Total 11,858 15,131 9,068 7,287 7,272 3,609 13,325 13,121 4,644 15,125

BUSINESS STRATEGIES
48 EEI 2013 FINANCIAL REVIEW
attributed to a planned expansion at an existing oil plant in Maine that only runs during peak load for reli-ability reasons. The project is expect-ed to be completed in 2017.
The only coal and nuclear an-nouncements centered on rerates of existing units, reflecting the regula-tory and economic challenges facing these fuels. Surprisingly, 609 MW of oil generation was announced,
offset lost capacity at the retiring San Onofre Nuclear Generating Station.
Wind announcements (2,752 MW) rebounded due to PTC exten-sion and revision in early 2013; the changes allowed projects under con-struction before December 31, 2013 to be eligible for the credit. Capital-izing on this revision, MidAmerican Energy Holdings announced nearly 1,500 MW of new wind capacity at seven new sites in Iowa, 1,050 MW of which is already under construc-tion across five sites. At the same time, MidAmerican placed the world’s largest onshore wind turbine order (448 turbines) with Siemens. The projects are expected to be com-pleted in 2015. Dominion, Duke, NextEra and Sempra also announced plans for new wind capacity
The pace of solar announcements declined, reflecting a shift from large utility-scale installations to small-er, distributed facilities. Solar an-nouncements in 2013 were entirely for PV facilities, with the largest at 15 MW. This shift is largely a result of state policies and incentives that encourage distributed solar.
New vs. Cancelled Capacity by Fuel Type (MW)
p = preliminaryr = revised Note: Totals may reflect rounding. Data includes new plants and expansions of existing plants, including nuclear uprates. Other = diesel, fuel oil, landfill gas, pet coke, solar/PV, waste heat, water, wood, biomass, and fuel cells.
Source: Ventyx, Inc., The Velocity Suite and EEI Finance Department
U.S. INVESTOR-OWNED ELECTRIC UTILITIES
Fuel Type Online Canceled Online Canceled Online Canceled Online Canceled Online Canceled 2009 2009 2010 2010 2011 2011 2012r 2012r 2013p 2013pCoal 1,998 3,634 4,848 1,428 689 — 2,080 500 673 —Natural Gas 6,249 4,508 2,313 3,290 4,283 1,140 6,024 1,426 2,844 2,215Nuclear 245 6,100 154 1,600 341 — 799 36 97 8,836Solar/Photovoltaics 40 — 100 46 322 250 549 8,834 301 —Wind 3,146 889 1,496 827 1,546 2,206 3,958 2,318 483 1,386Other 180 — 157 96 90 13 146 6 246 2,688Total 11,858 15,131 9,068 7,287 7,272 3,609 13,556 13,121 4,644 15,125
2013 New Capacity Announcements by Fuel Type
U.S. INVESTOR-OWNED ELECTRIC UTILITIES
Note: Other includes biomass, diesel/fuel oil, fuel cells, landfill gas, pet coke, solar/PV, waste heat, water, wood. Totals may reflect rounding.
Source: Ventyx, Inc., The Velocity Suite and EEI Finance Department
Hydro0 MW
Natural Gas6,212 MW
Other661 MW
Wind2,752 MW
Solar84 MW

BUSINESS STRATEGIES
EEI 2013 FINANCIAL REVIEW 49
Transmission
InvestmentInvestor-owned electric utilities
and stand-alone transmission com-panies invested a record $34.9 bil-lion in transmission and distribution infrastructure in 2012, according to the latest EEI Annual Property & Plant Capital Investment Survey.
The industry’s capital spending on transmission totaled $14.8 billion in 2012, a 23.9% increase over the $11.9 billion (in nominal dollars) that the industry invested in 2011. The increase represents the largest year-to-year-percentage increase in transmission investment since 2000, which saw a 39.9% jump from 1999 levels.
by impending emissions regulations as well as low natural gas prices. Investor-owned utilities are expected to retire 26,740 MW of coal capacity by the end of 2020, with the major-ity planned for 2015.
For the first time, a significant amount of nuclear capacity was also retired. This was the result of decisions to close San Onofre in California, Crystal River in Florida and Kewaunee in Wisconsin. The San Onofre and Crystal River units each required costly repairs that were deemed uneconomic. Kewaunee struggled to be economically com-petitive in a merchant environ-ment characterized by excess capac-ity and low natural gas prices that kept wholesale electricity market prices low.
Though the industry may not reach the record set in 2012, capac-ity additions over the next two years should rebound from 2013’s low level. Announcements in 2013 were the highest since 2009, and investor-owned electric utilities are expected to bring over 21,000 MW online in the 2014-2015 timeframe. While not all announcements will be built, nearly 10,000 MW (including over 5,000 MW of natural gas and 3,000 MW of wind) is either under con-struction or permitted, raising the likelihood that these projects will reach completion.
RetirementsInvestor-owned utilities retired
13,339 MW of capacity in 2013, including 5,561 MW of coal capac-ity. Coal retirements are being driven
(MW)U.S. INVESTOR-OWNED ELECTRIC UTILITIES
Actual and Projected Capacity Additions 2008-2020
Notes: Data includes new plants and expansions of existing plants, including nuclear uprates. Data does not include projects with an expected online date beyond 2020.
Other includes biomass, diesel/fuel oil, fuel cells, landfill gas, pet coke, waste heat, water, wood. Totals may reflect rounding.
2009-2013 is actual plants brought online. 2014-2020 is projected based on projects announced as of 12/31/12.
Source: Ventyx Inc., The Velocity Suite; EEI Finance Department
Actual Projected
0
2000
4000
6000
8000
10000
12000
14000
2009 2010 2011 2012 2013 2014 2015 2016 2017 2018 2019 2020
2009 2010 2011 2012 2013 2014 2015 2016 2017 2018 2019 2020
Coal 1,998 4,848 689 2,025 673 18 — — 61 — — —
Natural Gas 6,249 2,313 4,283 5,716 2,844 4,213 5,934 4,612 3,970 2,981 267 288
Nuclear 245 154 341 588 97 714 163 102 1,500 1,635 614 2,960
Wind 3,146 1,496 1,546 4,222 483 2,711 3,271 930 697 175 — 175
Solar 40 100 322 564 301 1,001 659 560 — 985 — —
Other 181 157 90 209 246 1,353 1,212 219 659 50 300 300
Total 11,858 9,068 7,272 13,325 4,644 10,010 11,239 6,422 6,887 5,826 1,181 3,723
Coal
Natural Gas
Nuclear
Wind
Solar
Other

BUSINESS STRATEGIES
50 EEI 2013 FINANCIAL REVIEW
Company Site Early Site Permit Design Expected Construction & (State) (ESP) (# of Units) Operating License SubmittalDTE Energy Co. Fermi (MI) — ESBWR (1) September 2008
Dominion Resources Inc. North Anna (VA) Approved November 2007 ESBWR (1) November 2007
Duke Energy Corp. William States Lee (SC) — AP1000 (2) December 2007
Exelon Corp. Clinton (IL) Approved March 2007 TBD TBD
Florida Power & Light Turkey Point (FL) TBD AP1000 (2) June 2009
PPL Corp. / UniStar Bell Bend (PA) — EPR (1) October 2008
PSEG Lower Alloways Creek (NJ) Submitted May 2010 TBD TBD
SCANA Corp. V.C. Summer (SC) — AP1000 (2) Approved March 2012
Southern Co. Vogtle (GA) Approved August 2009 AP1000 (2) Approved February 2012
Note: As of January 2014
Proposed New Nuclear PlantsU.S. INVESTOR-OWNED ELECTRIC UTILITIES
Source: Nuclear Energy Institute, Nuclear Regulatory Commission and EEI Finance Department
Legend: TBD: To Be Determined AP1000: Reactor designed by WestinghouseAPWR: Advanced Pressurized Water Reactor
EPR: Pressurized Water Reactor designed by FramatomeESBWR: Economic Simplified Boiling Water ReactorThose in italics represent COL applications that have been approved so far.
Stage of Projected Capacity Additions
Source: Ventyx Inc., The Velocity Suite; EEI Finance Department
Note: Other includes biomass, diesel/fuel oil, fuel cells, landfill gas, pet coke, waste heat, water, wood. Totals may reflect rounding.
U.S. INVESTOR-OWNED ELECTRIC UTILITIES
by MW Fuel Proposed Feasibility Application Pending Permitted Site Prep Under Construction Testing TotalCoal — — — 61 — 18 — 79Natural Gas 2,473 3,691 4,517 4,138 1,967 3,498 1,979 22,263Nuclear 415 — 4,836 188 — 2,250 — 7,689Wind 4,768 10 87 735 — 2,359 — 7,960Solar 491 — 68 2,193 — 319 4 3,074Other 756 3,191 50 86 — 11 — 4,093Total 8,902 6,892 9,558 7,402 1,967 8,455 1,983 45,159

BUSINESS STRATEGIES
EEI 2013 FINANCIAL REVIEW 51
Given the investments needed in coming years to upgrade and expand the transmission system, it is essential that regulation re-mains supportive, with policies that help utilities address the risks and challenges associated with develop-ing, constructing, operating and maintaining transmission.
Continued Investment is Needed to Increase Resiliency and Support New Technologies
Utilities invest in transmission infrastructure for a variety of rea-sons, including to ensure their abil-ity to provide safe, affordable and reliable electricity, and to enable new technologies and services that meet customer needs. Electric utilities must also continuously address sys-tem requirements such as reliability mandates, infrastructure modern-ization and replacement, and inte-gration of new generation. With an unprecedented number of coal plant retirements planned for the coming years, transmission upgrades will be needed to preserve reliability in areas where coal plants are shutting down. In addition, recent extreme weather events, such as Superstorm Sandy and the Derecho in 2012, have led to an increased focus on reinforc-ing and upgrading electric infra-structure so that it better withstands storms and recovers more quickly from them.
President Obama has highlight-ed the need for increased invest-ment in the transmission system, issuing a memorandum that ad-vocates strengthening the system against storms and cyber attacks and modernizing it for integration of new, clean generation technologies.
Projected transmission investment for 2013 shows continued growth, reflecting significant storm harden-ing following Superstorm Sandy. EEI’s survey results show a decrease in transmission investment after 2014, in part because several major projects have recently been modified, delayed or cancelled due to reduced fore-casts for load growth in response to weak economic growth as well as de-mand side management and energy efficiency initiatives. As planning factors change, transmission plan-ners must respond by adjusting system infrastructure needs to meet customer demand. Nevertheless, EEI expects investment by its mem-bers during 2013 to 2016 to be sig-nificantly higher than in 2011.
After adjusting for increases in constructions costs, actual transmis-sion expenditures in 2012 increased 23.5% (in 2012 dollars) compared to 2011 expenditures. Transmission investment in 2012 was 160.5% higher than in 2000, after adjust-ing for cost increases; over the same period the industry invested a cu-mulative $113.3 billion in transmis-sion. Electric utilities attribute the increased transmission investment to several key factors, including the completion of large capacity trans-mission projects around the country and interconnection of new genera-tion (including renewable resources) to the grid.
0
2
4
6
8
10
12
14
16
18
2006 2008 2009 2010
($ Billions)
2012 2013p 2014p
Planned*Actual
Actual and Planned Transmission Investment 2006-2016
2011
p = preliminary
* Planned total industry expenditures are preliminary and estimated from response to EEI’s Electric Transmission Capital Budget & Forecast Survey. Actual expenditures from EEI’s Annual Property & Plant Capital Investment Survey and from the FERC Form 1 reports.
Source: Edison Electric Institute, Business Information Group
7.0
10.2
17.7 17.8
16.616.1
9.1
7.8
9.3
2007 2015p 2016p
11.9
14.8

BUSINESS STRATEGIES
52 EEI 2013 FINANCIAL REVIEW
electric system with new technolo-gies will also improve reliability and enable customers to adopt new tech-nologies, such as rooftop solar and electric vehicles, and it will support provision of detailed information about grid conditions so that all re-sources can be used more effectively.
Fuel Sources
A stabilization of natural gas spot prices and sluggish electricity de-mand were the dominant trends that impacted fuel usage in 2013. The widespread fuel switching to natural gas from coal that characterized 2012 did not continue as natural gas prices rose slightly, holding in a range of $3 to $4 per million BTU throughout the year. The pace of wind capac-ity additions slowed to an almost non-existent level, growth in solar generation remained strong and un-certainty persisted about the future of nuclear power. Electric generation grew a mere 0.3% for the year as a whole; a colder-than-normal winter was especially influential in produc-ing the small gain since winters in 2011 and 2012 were warmer than normal. Supply/demand rebalanc-ing in the natural gas market helped coal’s share of the generation mix rise to 39.1% from 37.4% in 2012. Natural gas generation decreased to 27.4% of the total from 30.3% in 2012. The rapid growth of wind and solar continued, gaining 19% and 113% respectively; this brought non-hydro renewables’ share of gen-eration to 6.2% from 5.4% in 2012.
DistributionThe EEI survey found investment
in electric distribution infrastructure rose 4.7 percent in 2012, to $20.1 billion (in nominal dollars) from $19.2 billion (nominal) invested in 2011. The increase was largely due to storm restoration, as well as de-velopment of automated meter in-frastructure (AMI) and other smart grid activities.
Adjusting for a 3.2 percent in-crease in distribution-related con-struction costs in 2012, distribution investment increased 1.4 percent (in 2012 dollars) compared to the level in 2011. Since the beginning of 2000, the industry has invested $275 billion (in 2012 dollars) in the nation’s distri-bution system.
Distribution investment is driven by the ongoing need to replace assets that have lived out their useful life, to serve new load, preserve reliability, improve system resiliency and restora-tion capabilities, and increasingly, to accommodate increasing amounts of distributed resources. Investment in utility infrastructure tends to move in cycles, rising as large investments are made to support major development projects, leveling off as the focus shifts toward maintenance and incremental upgrades, and then rising again as ad-ditional investments are needed to support load growth and to integrate new technologies.
The industry faces significant distribution-related capital spending resulting from the normal replace-ment of old infrastructure, to harden the grid against storm damage and to expand its ability to support increased distributed generation. Updating the
In addition, the first phase of the Administration’s Quadrennial En-ergy Review is focusing on energy delivery infrastructure challenges and on policy recommendations for overcoming them.
Given the growth in distributed generation, transmission remains critical for maintaining system-wide reliability by providing access to power when intermittent local sup-ply is unavailable. At the same time, large concentrations of distributed generation increase the need to detect and react quickly to supply/demand imbalances when distributed sources go offline or when they cannot fully meet demand. As a result, supportive regulatory frameworks and equitable cost allocation policies are essential to utilities’ ability to build and man-age networks that promote customer control and choice.
Several plans for grid upgrades and expansion projects were announced in 2013. PJM approved $4.6 billion to expand and upgrade the grid, cit-ing the need to accommodate over 20,000 MW of generation expected to retire along with record amounts of new natural gas generation com-ing online. MISO approved the ad-dition of 300 projects totaling $1.4 billion to its regional transmission expansion plan for improved reliabil-ity and plant retirements. ERCOT expects to complete $3.6 billion in transmission projects over the next four years to increase capacity and support reliability. The Southeastern Regional Transmission Planning or-ganization proposed $1.8 billion in transmission upgrades to address a variety of reliability needs over the next ten years.

BUSINESS STRATEGIES
EEI 2013 FINANCIAL REVIEW 53
Fuel Sources for Electric Generation 2004–2013
U.S. ELECTRIC UTILITY AND NON-UTILITY
U.S. Electric Utility: Owns and/or operates facilities within the United States, its territories, or Puerto Rico for the generation, transmission, distribution, or sale of electric energy primarily for use by the public. This includes investor-owned utilities, public power, and cooperatives.
Non-Utility Power Producer: Non-utility power producers include qualifying cogenerators, qualifying small power producers, and other non-utility generators (including independent power producers) without a designated franchised service area.
Source: U.S. Department of Energy, Energy Information Administration (EIA)
0
10%
20%
30%
40%
50%
60%
Coal
Nuclear
Natural Gas
Oil
Conventional Hydro
Other Renewables
2012r201120102007 2013p2004 2005 2006 2008 2009
r = revisedp = preliminary
Fuel Sources for Net Electric Generation U.S. ELECTRIC UTILITY AND NON-UTILITY
Note: Totals may not equal 100.0% due to rounding.p: preliminary
U.S. Electric Utility: Owns and/or operates facilities within the United States, its territories, or Puerto Rico for the generation, transmission, distribution, or sale of electric energy primarily for use by the public. This includes investor-owned utilities, public power, and cooperatives.
Non-Utility Power Producer: Non-utility power producers include qualifying cogenerators, qualifying small power producers, and other non-utility generators (including independent power producers) without a designated franchised service area.
Source: Energy Information Administration
2013p 2012
Coal 39.1% 37.4%
Gas 27.4% 30.4%
Nuclear 19.4% 19.0%
Oil 0.7% 0.6%
Hydro 6.6% 6.8%
Renewables 6.2% 5.4%
Biomass 1.5% 1.4%
Geothermal 0.4% 0.4%
Solar 0.2% 0.1%
Wind 4.1% 3.4%
Other fuels 0.5% 0.5%
Total 100% 100%

BUSINESS STRATEGIES
54 EEI 2013 FINANCIAL REVIEW
ity generation between November 2013 and February 2014 was 5.3% higher than during the same period last year and coal generation sup-plied 59% of that increase.
Although the delivered price of coal is based on contracted prices and includes transportation costs, trends in delivered costs in 2013 mirrored those of spot prices. The average price of delivered coal from Central Appalachia fell from $93.2 per ton in 2012 to $89.5 in 2013. PRB’s delivered price edged up from $35 per ton in 2012 to $35.5 per ton in 2013. According to EIA data, the average cost of coal for electric utili-ties was lower in 2013 than in 2012.
increase in installed pollution con-trols in power plants, which make burning low-sulfur coal relatively less advantageous.
The coal market was tighter ev-erywhere as coal production de-creased slightly (by 0.4% compared to 2012), while demand increased 4%. Despite a decline in exports re-sulting from weaker European and Asian demand, along with growing production from other exporting na-tions, overall coal demand increased because of stronger demand from the power sector in response to cold fall and winter weather. As a result, coal stockpiles decreased substantial-ly. According to the Energy Informa-tion Administration (EIA), electric-
CoalCoal remained the primary fuel
used to generate electricity in the U.S. in 2013, and its share of the fuel mix, which had fallen sharply in 2012, rose slightly. However, the long-term trend continues to be a steady decline. Very low natural gas prices during part of 2012 drove coal’s share of total generation down to 37.4% for the year, from 42.3% in 2011. In 2013 however, supply/demand rebalancing in the natural gas market helped coal’s share of to-tal generation rise back to 39.1%, higher than in 2012, yet a level still consistent with the downward tra-jectory of the last ten years.
Coal prices remained relatively stable in 2013 (in the 2009-2011 period strong coal exports pushed prices higher), but basins followed different price paths throughout the year in response to location-specific market conditions. The average spot price of Central Appalachian coal was $65.13 per ton compared to $66.06 per ton in 2012, but far below 2011’s $78.84 per ton. The other major basins, Northern Ap-palachian, Powder River and Illinois, followed similar patterns, with small changes throughout the year. Be-cause of its relative cost-disadvantage versus natural gas, Central Appala-chian coal prices started declining in the second half of the year as the fuel lost market share. However, at the same time, prices in Northern Appa-lachia and Powder River Basin rose since a firming of natural gas prices made burning these types of coal more economic than was the case in 2012. Demand for coal from these basins also grew as a result of an
Average Cost of Fossil Fuels 2004-2013
(Cents/mmBTU)U.S. ELECTRIC UTILITIES
0
500
1000
1500
2000
2500
r = revisedp = preliminary
U.S. Electric Utility: Owns and/or operates facilities within the United States, its territories, or Puerto Rico for the generation, transmission, distribution, or sale of electric energy primarily for use by the public. This includes investor-owned utilities, public power, and cooperatives.
Source: U.S. Department of Energy, Energy Information Administration (EIA)
2012r 2013p2004 2005 2006 2007 2008 2009 2010 2011
OILCOAL GAS

BUSINESS STRATEGIES
EEI 2013 FINANCIAL REVIEW 55
tection Agency (EPA) regulations will increase the cost of coal generation as companies will need to invest in environmental control technologies. Some coal-fired units will likely be retired instead of retrofitted with con-trols. Although installed operating capacity has remained relatively con-stant in the last few years, at around 340 GW, this increased uncertainty has had a clear impact on new con-struction. For the first time in the industry’s history, no new coal-fired capacity was announced in 2011, 2012 or 2013. Also, the amount of coal-fired capacity scheduled for re-tirement is rising. Between 2010 and 2013, over 20,000 MW of coal-fired capacity has been retired and an ad-ditional 20,000 MW of retirements has been announced for the next two years.
Natural GasNatural gas’ share of total electric-
ity generation declined to 27.4% in 2013 from 30.3% the previous year, although it remained above 2011’s 24.7%. Production and consumption again set records in 2013. Increased demand was driven in particular by the industrial sector, which has broken its long-term trend of declining gas usage and has seen its demand grow steadily since 2010. The cold winter also drove strong demand from the residential and commercial sectors. The electric sector, however, burned about 11% less natural gas than it did in 2012 due to relatively higher prices compared with coal and a cooler summer than in 2012. Although the winter was also colder, the additional gas generation during November and December was not able to make up for the reduced demand during the rest of the year.
nation’s primary generation fuel for years to come. The EIA has estimated that natural gas may surpass coal in 2035. Several factors continue to make the future of coal generation uncertain. Since 2008, increased natural gas production and growth in proved reserves from unconven-tional sources have driven natural gas prices down to the lowest lev-els of the last decade, reducing the cost-advantage of coal generation in many regions of the country. More-over, numerous Environmental Pro-
In 2007, before coal prices began rising and before the economic crisis hit, the estimated average cost to pro-duce electricity from coal was $24.8 per MWh. The cost rose steadily beginning in 2008, reaching $32.97 per MWh in 2012. Preliminary data from 2013, however, shows a decline to $29.65 per MWh, a 10% drop from 2012’s level, mostly due to a reduction in non-fuel costs.
Despite coal’s declining relative contribution to nationwide gen-eration, it is expected to remain the
0
10
20
30
40
50
60
70
80
90
Average Cost to Produce Electricity 2008-2013
r = revisedp = preliminary
U.S. Electric Utility: Owns and/or operates facilities within the United States, its territories, or Puerto Rico for the generation, transmission, distribution, or sale of electric energy primarily for use by the public. This includes investor-owned utilities, public power, and cooperatives.
Non-Utility Power Producer: Non-utility power producers include qualifying cogenerators, qualifying small power producers, and other non-utility generators (including independent power producers) without a designated franchised service area.
* 2013 results are preliminary and based on modeled data from Ventyx, Inc., The Velocity Suite
Source: Ventyx, Inc., The Velocity Suite
Coal
Nat
ural
Gas
Nuc
lear
Hyd
roCost of Fuel Non-Fuel O&M
($/MWh)
U.S. ELECTRIC UTILITY AND NON-UTILITY
2010 2011 2012r 2013p2008 2009
Coal
Nat
ural
Gas
Nuc
lear
Hyd
ro
Coal
Nat
ural
Gas
Nuc
lear
Hyd
ro
Coal
Nat
ural
Gas
Nuc
lear
Hyd
ro
Coal
Nat
ural
Gas
Nuc
lear
Hyd
ro
Coal
Nat
ural
Gas
Nuc
lear
Hyd
ro

BUSINESS STRATEGIES
56 EEI 2013 FINANCIAL REVIEW
Over the last five years, the growth of natural gas reserves and high levels of production in the U.S. domestic natural gas market have caused some LNG developers to cancel import projects and consider options for re-exporting and/or expanding terminals to add liquefaction, storage and export facilities. Thus far, the Federal Energy Regulatory Commission (FERC) has authorized facilities in Texas, Louisiana and Maryland to re-export LNG, and the Department of Energy (DOE) has approved the application of a dozen of terminals to liquefy and export domes-tically produced gas to countries with which the U.S. has signed a free trade agreement. DOE has also authorized the Sabine Pass project (already under construction) and several other termi-nals to export to countries not covered by a trade agreement. A few other projects are still waiting for DOE ap-proval, which, as required by law, must take into consideration the cumula-tive impact of LNG exports on the U.S. economy.
NuclearThe U.S. continues to be the
world’s largest producer of nucle-ar power. With 100 electricity- generating nuclear reactors, the U.S. accounts for more than 30% of worldwide nuclear generation of electricity. In 2013, nuclear’s elec-tric output grew by 2.6%. While a small increase, this was a significant one since nuclear generation had de-clined considerably over the previous two years and its share of total U.S. electric generation rose in 2013 back to its 2011 level, at 19.4%.
$36.33/MWh in 2013 from $34.29/MWh in 2012. Yet this is still far be-low the average cost in 2008, which was $78.43/MWh.
Imports have been rapidly declining since 2008, when shale gas production began increasing. Last year, imports declined by yet another 8% and barely reached the 1995-6 level. Imports from Canada continue to account for the majority of imported natural gas (97%), but they have declined since 2008 at a rate of 5-6% per year. Lique-fied natural gas (LNG) imports have suffered an even greater reduction, cut in half in 2012 and then again in 2013. At the same time, exports of natural gas, which had been increasing significantly, decreased slightly (3%) for the first time in a decade.
Total demand for natural gas grew by almost 2%, whereas production in-creased by just over 1%. This helped reduce chronic oversupply and rebal-anced the market. As a result, the av-erage Henry Hub spot price in 2013 was $3.72 per million BTU, up from $2.76 per million BTU in 2012, but still lower than all other years since 2000. The first quarter of 2014 ex-perienced two extreme cold weather events due to a Polar Vortex, which caused natural gas prices to increase to $7-8 per million BTU briefly in Feb-ruary and again in March. The average monthly spot price climbed to $6 per million BTU in February but, despite the price spikes, fell back to $4.92 in March. The rise in natural gas prices in 2013 increased the average cost to produce electricity from natural gas to
NYMEX-Henry Hub Natural Gas Close Prices2005-2013
($/mmBTU)
0
2
4
6
8
10
12
14
16
Source: NYMEX & SNL Financial
Jan-05
May-05
Jan-06
May-06
Jan-07
May-07
Jan-08
Jan-10
Sep-08
May-10
Jan-09
May-09
Jan-12
May-12
May-11
May-13
Sep-05
Sep-06
Sep-07
May-08
Sep-10
Sep-09
Sep-12
Sep-11
Sep-13
Jan-11
Jan-13

BUSINESS STRATEGIES
EEI 2013 FINANCIAL REVIEW 57
Existing and Proposed U.S. LNG TerminalsAs of December 31, 2013
Constructed:1. Everett, MA: 1.035 Bcfd (Distrigas of Massachusetts)2. Cove Point, MD: 1.8 Bcfd (Dominion -Cove Point LNG) (a)3. Elba Island, GA: 1.6 Bcfd (El Paso -Southern LNG)4. Lake Charles, LA: 2.1 Bcfd (Southern Union -Trunkline LNG)5. Offshore Boston, MA: 0.8 Bcfd (Northeast Gateway -ExcelerateEnergy)6. Freeport, TX: 1.5 Bcfd (Freeport LNG Dev.) (a)7. Sabine Pass, LA: 4 Bcfd (Sabine Pass Cheniere LNG) (a)8. Hackberry, LA: 1.8 Bcfd (Cameron LNG -Sempra Energy) (a)9. Offshore Boston, MA: 0.4 Bcfd (Neptune LNG)10. Golden Pass, TX: 2.0 Bcfd (Golden Pass -ExxonMobil) 11. Pascagoula, MS: 1.5 Bcfd (Gulf LNG Energy LLC, TRC Companies)
Approved by FERC:12. Freeport, TX: 2.5 Bcfd (Cheniere/Freeport LNG Dev.) – Expansion
Approved by MARAD/Coast Guard13. Main Pass, LA: 1.0 Bcfd (Main Pass McMoRanExp.)14. Port Dolphin, FL: 1.2 Bcfd (Hoëgh LNG – Port Dolphin Energy)15. TORP LNG, AL: 1.4 Bcfd (Bienville Offshore Energy Terminal – TORP)
Proposed to FERC16. Astoria, OR: 1.5 Bcfd (Oregon LNG)17. Robbinston, ME: 0.5 Bcfd (Downeast LNG – Kestrel Energy)18. Corpus Christi, TX: 0.4 Bcfd (Cheniere – Corpus Christi LNG)
Export terminalsUnder Construction19. Sabine Pass, LA: 2.76 Bcfd (Sabine Pass Cheniere LNG) (b) (c)
Proposed to FERC20. Plaquemines Parish, LA: 1.07 Bcfd (CE FLNG, Cambridge Energy) 21. Golden Pass, TX: 2.0 Bcfd (Golden Pass -ExxonMobil) (b)(d)22. Freeport, TX: 1.4 Bcfd (Freeport LNG Dev./FLNG Liquefaction) (b) (c)23. Corpus Christi, TX: 2.1 Bcfd (Cheniere - Corpus Christi LNG) (b) (d)24. Coos Bay, OR: 1.2 Bcfd (Jordan Cove Energy Project) (b) (c)25. Lake Charles, LA: 2.0 Bcfd (Trunkline LNG) (b) (c)26. Lake Charles, LA: 1.07 Bcfd (Magnolia LNG) (b)27. Hackberry, LA: 1.7 Bcfd (Cameron LNG -Sempra Energy) (b) (c)28. Cove Point, MD: 1.0 Bcfd (Dominion -Cove Point LNG) (b) (c)29. Astoria, OR: 1.3 Bcfd (Oregon LNG)30. Lavaca Bay, TX: 1.38 Bcfd (Excelerate Liquefaction) (b) (d)31. Sabine Pass, LA: 1.4 Bcfd (Sabine Pass Liquefaction) (b) (d)32. Elba Island, GA: 0.5 Bcfd (Southern LNG) (b) (d)
(a) Authorized to re-export(b) Approved by DOE to export to FTA countries(c) Approved by DOE to export to non-FTA countries(d) Under DOE review for exports to non-FTA countries
Sources: U.S. Department of Energy, Office of Fossil Energy; Federal Energy Regulatory Commission; Ventyx Inc., The Velocity Suite.

BUSINESS STRATEGIES
58 EEI 2013 FINANCIAL REVIEW
investment tax credit (ITC), which provides a tax credit of up to 30% of the capital investment in a project, is set to expire at the end of 2016.
State renewable energy electric-ity standards (RES) have also been a major driver of renewable energy de-velopment. However, some states are examining their RES policies with an eye on restraining costs. Declining costs, net metering and other state policies are also supporting deploy-ment of distributed generation, solar rooftop photovoltaics in particular. Yet these policies were not designed to help the deployment of a matur-ing technology, and they will likely be revised to reduce unnecessary costs to consumers as well as unfair cost-shifts between customer types.
Low natural gas prices have pre-sented an additional difficulty for the renewable industry. With reduced costs for natural gas generation, the need for, economic appeal of, and available financing for many renew-able projects have been diminished. In 2013, for example, only slightly more than 1,000 MW of new wind capacity was added to the grid com-pared to a record 13,000 in 2012.
Despite these challenges, and helped by ever-lower technology costs, renewable energy (wind and solar in particular) continues to thrive. Solar generation more than doubled in 2012 and again in 2013, and wind generation grew an average of 30% per year for the last ten years, rising from 0.3% of the nation’s mix in 2003 to more than 4% in 2013.
Renewable EnergyRenewable fuel sources, including
hydropower, produced a near-record 12.9% of total U.S. electric genera-tion in 2013. Non-hydro generation hit another record at 6.2% of the generation mix, up from 5.4% in 2012. The increase was mainly due to a 19% jump in wind output, which accounted for 66% of total non-hydro renewable generation. Solar generation grew by 114%. Although solar generation more than doubled in just one year, it represents just 4% of non-hydro generation and 0.2% of total U.S. electric output.
Renewable energy continues to experience strong governmental sup-port, but changes to some policies in recent years have presented new tests for the industry. At the end of 2011, Congress did not extend section 1603 (Payments for Specified En-ergy Property in Lieu of Tax Cred-its) of the “Cash Grant” program, established by the 2009 American Recovery and Reinvestment Act; the program, which had been extended for one year in 2010, was allowed to expire. The federal production tax credit (PTC), which provides a tax credit of $22/MWh for the first ten years of operation, was set to expire at the end of 2012 for wind, bio-mass and geothermal resources, but was extended for an additional year. Given a change in rules, this exten-sion will be a de facto multi-year extension as projects will be able to claim the PTC as long as they start construction in 2013. Yet it has not been extended further. The federal
29 States and D.C. have Renewable Electricity Portfolio Standards (RES)
RPS
Voluntary standards or goals
Pilot or study
**
*
Updated April 2014
Abbreviations: EE - Energy Efficiency; RE - Renewable Energy
Notes: An RPS requires a percent of an electric provider’s energy sales (MWh) or installed capacity (MW) to come from renewable resources. Most specify sales (MWh). Map percents are final years’ targets. * TVA’s goal is not state policy; it calls for 50% zero- or low-carbon generation by 2020. ** Nebraska’s two largest public power districts have renewable goals.
Source: Database of State Incentives for Renewables and Efficiency, http://www.dsireusa.org
AK: 50% by 2025AZ: 15% by 2025; 4.5% DGCA: 33% by 2020CO: 30% by 2020, 3% DG and 1.5%
customer sited. (10% co-ops, munis)CT: 27% by 2020DC: 20% by 2020, 2.5% solar by 2023DE: 25% by 2026, 3.5% PV + triple creditFL: Solar Pilot 2010-2014HI: 40% by 2030IA: 105 MW; 1 GW wind goal by 2010IL: 25% by 2025; wind 75%, 1.5% PV and
0.25% DGIN: 10% by 2025KS: 20% by 2020LA: RES Pilot 350 MW by 2012-13MA: 15% new by 2020, then 1% annually;
2 GW wind and 400 MW PV
MD: 20% by 2022, 2% solar by 2020ME: 10% new by 2017; 8 GW wind goal by
2030MI: 10% MWh and 1,100 MW by 2015.
Triple credit for solarMN: 25% by 2025; 30% by 2020 – XcelMO: 15% by 2021, 0.3% solar electricMT: 15% by 2015NC: 12.5% by 2021, 0.2% solar by 2018.
(10% by 2018 co-ops, munis)ND: 10% by 2010NE: Public Power Districts: 10% by 2020**NH: 24.8% by 2025NJ: 20.38% RE by 2021 and 4.1% solar by
2028NM: 20% by 2020, 4% solar electric, 0.6%
DG. (10% - co-ops)NV: 25% by 2025, 1.5% solar by 2025NY: 29% by 2015, 0.4% customer sited
OH: 12.5% by 2024, 0.5% solarOK: 15% by 2015OR: 25% by 2025. 20 MW PV by 2020
(5-10% - smaller utilities)PA: 18% by 2021, 0.5% PVRI: 16% by end 2020SD: 10% by 2015TVA: 50% by 2020*TX: 5,880 MW by 2015, 500 MW non-wind
goal, double credit for non windUT: 20% by 2025, multiplier for solar electricVA:15% by 2025VT: 20% by 2017; from RE and CHPWA: 15% by 2020, double credit for DGWI: 10% by 2015WV: 25% by 2025, various multipliers
Following the crisis in Japan in March 2011, scrutiny of nuclear plants rose and industry critics sug-gested some be shut down. Yet, in early 2012, the Nuclear Regula-tory Commission (NRC) approved Southern Company’s two new nuclear reactors at its Vogtle plant in Georgia and two at SCANA’s Virgil C. Summer Nuclear Station in South Carolina. These were the first nuclear reactors approved in de-cades. Also, TVA’s Watts Bar 2 is ex-pected to come online in 2015 and more than 60 nuclear reactors have been granted 20-year license exten-sions in the last few years.
Despite these trends, nuclear power has not been immune to the broader developments impacting U.S. energy markets. In 2013, four nuclear reactors were retired, which reduced the total installed capacity by almost 4,000 MW. In fact, 2013 was the first year since 1998 that a nuclear reactor was retired. Weak pricing conditions in wholesale power markets and rapidly declin-ing profitability caused Dominion Power to close the Kewaunee plant in Wisconsin. Concerns about main-tenance and high repair costs drove Duke Energy to retire the Crystal River plant in Florida (out of service for repairs since 2009) and Edison International to permanently close the San Onofre Nuclear Generating Station (SONGS), which had been shut down since January 2012. Low profitability was also the reason cited for the announced retirement of En-tergy’s Vermont Yankee at the end of 2014.

BUSINESS STRATEGIES
EEI 2013 FINANCIAL REVIEW 59
Renewable EnergyRenewable fuel sources, including
hydropower, produced a near-record 12.9% of total U.S. electric genera-tion in 2013. Non-hydro generation hit another record at 6.2% of the generation mix, up from 5.4% in 2012. The increase was mainly due to a 19% jump in wind output, which accounted for 66% of total non-hydro renewable generation. Solar generation grew by 114%. Although solar generation more than doubled in just one year, it represents just 4% of non-hydro generation and 0.2% of total U.S. electric output.
Renewable energy continues to experience strong governmental sup-port, but changes to some policies in recent years have presented new tests for the industry. At the end of 2011, Congress did not extend section 1603 (Payments for Specified En-ergy Property in Lieu of Tax Cred-its) of the “Cash Grant” program, established by the 2009 American Recovery and Reinvestment Act; the program, which had been extended for one year in 2010, was allowed to expire. The federal production tax credit (PTC), which provides a tax credit of $22/MWh for the first ten years of operation, was set to expire at the end of 2012 for wind, bio-mass and geothermal resources, but was extended for an additional year. Given a change in rules, this exten-sion will be a de facto multi-year extension as projects will be able to claim the PTC as long as they start construction in 2013. Yet it has not been extended further. The federal
29 States and D.C. have Renewable Electricity Portfolio Standards (RES)
RPS
Voluntary standards or goals
Pilot or study
**
*
Updated April 2014
Abbreviations: EE - Energy Efficiency; RE - Renewable Energy
Notes: An RPS requires a percent of an electric provider’s energy sales (MWh) or installed capacity (MW) to come from renewable resources. Most specify sales (MWh). Map percents are final years’ targets. * TVA’s goal is not state policy; it calls for 50% zero- or low-carbon generation by 2020. ** Nebraska’s two largest public power districts have renewable goals.
Source: Database of State Incentives for Renewables and Efficiency, http://www.dsireusa.org
AK: 50% by 2025AZ: 15% by 2025; 4.5% DGCA: 33% by 2020CO: 30% by 2020, 3% DG and 1.5%
customer sited. (10% co-ops, munis)CT: 27% by 2020DC: 20% by 2020, 2.5% solar by 2023DE: 25% by 2026, 3.5% PV + triple creditFL: Solar Pilot 2010-2014HI: 40% by 2030IA: 105 MW; 1 GW wind goal by 2010IL: 25% by 2025; wind 75%, 1.5% PV and
0.25% DGIN: 10% by 2025KS: 20% by 2020LA: RES Pilot 350 MW by 2012-13MA: 15% new by 2020, then 1% annually;
2 GW wind and 400 MW PV
MD: 20% by 2022, 2% solar by 2020ME: 10% new by 2017; 8 GW wind goal by
2030MI: 10% MWh and 1,100 MW by 2015.
Triple credit for solarMN: 25% by 2025; 30% by 2020 – XcelMO: 15% by 2021, 0.3% solar electricMT: 15% by 2015NC: 12.5% by 2021, 0.2% solar by 2018.
(10% by 2018 co-ops, munis)ND: 10% by 2010NE: Public Power Districts: 10% by 2020**NH: 24.8% by 2025NJ: 20.38% RE by 2021 and 4.1% solar by
2028NM: 20% by 2020, 4% solar electric, 0.6%
DG. (10% - co-ops)NV: 25% by 2025, 1.5% solar by 2025NY: 29% by 2015, 0.4% customer sited
OH: 12.5% by 2024, 0.5% solarOK: 15% by 2015OR: 25% by 2025. 20 MW PV by 2020
(5-10% - smaller utilities)PA: 18% by 2021, 0.5% PVRI: 16% by end 2020SD: 10% by 2015TVA: 50% by 2020*TX: 5,880 MW by 2015, 500 MW non-wind
goal, double credit for non windUT: 20% by 2025, multiplier for solar electricVA:15% by 2025VT: 20% by 2017; from RE and CHPWA: 15% by 2020, double credit for DGWI: 10% by 2015WV: 25% by 2025, various multipliers

BUSINESS STRATEGIES
60 EEI 2013 FINANCIAL REVIEW
demand and countering decreasing demand in developed countries. The U.S. electric power sector should be shielded against oil price spikes or supply disruptions given its lim-ited use of oil as a generation fuel and its highly diversified fuel mix. The volatility of world oil prices will, nonetheless, influence broad eco-nomic conditions and will therefore indirectly impact the sector.
Yet, substantial increased domes-tic production of crude oil will help alleviate energy and national secu-rity concerns and reduce oil imports. Total domestic crude production grew by a record 15% in 2013, the largest percentage gain since 1940. This new production has come mostly from shale plays in Texas (Eagle Ford) and North Dakota (Bakken). As a result of increased pro-duction, imports decreased (-10%) for the third year in a row. Accord-ing to the EIA, at the beginning of 2013, the U.S. had the highest level of crude oil reserves since 1976. The same advances in drilling techniques that produced the “shale revolution” (horizontal drilling and fracking) in combination with sustained high oil prices have contributed to increased production of crude oil and natural gas condensates in the U.S. for the last five consecutive years. The Inter-national Energy Agency announced at the end of 2013 that, if current trends continue, the U.S. will sur-pass Russia and Saudi Arabia as the world’s top oil producer by 2015.
OilOil accounted for 0.7% of U.S.
electric generation in 2013, up from 0.6% the previous year; Hawaii generated about half of that. Since 2006, oil, which had been generating around 3% of the nation’s electricity, began playing an ever-smaller role in the U.S. electric fuel portfolio. It has been the smallest, and a decreasing, contributor to electricity generation since then.
Persistently high oil prices since 2006 have been an important fac-tor contributing to the continued decline in oil use. While crude oil prices averaged $15 to $25/barrel in the mid-1990s, the price of oil began an upward climb in the early 2000s. West Texas Intermediate crude spot prices peaked at over $145/barrel in mid-July 2008. Prices since mid-2011 have fluctuated in a range of $85-105/barrel.
As has historically been the case, crude oil prices in the U.S. will re-main subject to the dynamics of the international oil market, itself driven by changes in global demand, supply constraints in oil producing regions, the level of stocks and spare capacity in industrialized countries, geopo-litical risks, and the relative strength of the dollar versus other currencies.
Demand for oil is expected to continue to grow globally as improv-ing economic conditions lead to in-creased consumption, particularly in developing countries, driven by rap-id economic and population growth. Subsidies provided to end users in some nations help mitigate the effect of high global crude oil prices, leading to sustained and increasing
Recommended