2009 Manitoba
Transportation
Report
Prepared For: Manitoba Infrastructure and Transportation
Transport Institute, University of Manitoba
This report has been financially supported by the Manitoba Department of
Infrastructure and Transportation. The views expressed do not necessarily represent
those of the Department. The Department provides no warranties as to the validity or
accuracy of the information presented herein.

Introduction
The worldwide recession has had a profound impact on all business segments, with every
sector of the economy being affected. The impact on transportation has been significant with the
idling of hundreds of container vessels, abundant capacity in truck fleets, and a significant drop
in rail car loadings. We are only at the beginning of the turnaround with indications of a
strengthening economy appearing weekly.
Major issues being addressed in Canada’s premier conferences in 2009 include Rail Service,
Near-Sourcing, Supply on Demand, and China’s comeback. The need for detailed information
on all aspects of transportation flowing in and through the province of Manitoba has not
diminished but become ever more important for policy and decision makers in the province.
The Manitoba Transportation Report has been developed to fill this need for detailed
transportation information and trends. This report is produced for Manitoba Infrastructure and
Transportation. The target audience is the Minister of Infrastructure and Transportation,
executive officers in the department responsible for policy development and the many policy
analysts that support the department’s activities.
Data presented in this report is the latest available Statistics Canada, Manitoba Bureau of
Statistics, and industry data. This year’s report has been reformatted to better reflect the nature
of the information being presented. Due to the varying release dates of statistics, it is difficult to
present data in a consistent time-frame while still utilizing the most recent data available. In this
edition, all statistics and figures are current to at least 2007, while some further present data
collected in 2008 and 2009. A particular problem in data gathering over the past year has been
the lack of weight data reported by Statistics Canada. UMTI has developed a methodology to
estimate the weights based on historical weight to value relationships. We have been working
with Statistics Canada to reestablish the reporting of weight data in Statistics Canada reporting
systems.

Table of Contents
1. The Economic Impact of Transportation in Manitoba - $3.23 Billion in 2007 ............................ 1
2. Transportation and Warehousing and the Regional Canadian Economy ............................... 18
3. The State of the Macro Economy ................................................................................................... 40
Manitoba Economic Situation ................................................................................................... 46
Economic Indicators ................................................................................................................... 47
Monetary and Energy Indicators .............................................................................................. 59
4. Trade .................................................................................................................................................. 68
Domestic Trade & Infrastructure Utilization .......................................................................... 71
Export Routing and Usage of Transportation Infrastructure ......................................... 71
Usage of Manitoba’s Transportation Infrastructure ........................................................ 77
Manitoban Export Border Crossings ................................................................................. 95
Canadian Export Border Crossings ................................................................................... 99
Manitoban Import Border Crossings ............................................................................... 101
Canadian Import Border Crossings ................................................................................. 105
Manitoba International Trade ................................................................................................. 107
Manitoba’s International Exports ........................................................................................... 107
Manitoba’s International Imports .................................................................................... 113
NASCO Trade ............................................................................................................................ 119
Exports ........................................................................................................................................ 119
Imports ................................................................................................................................. 127
5. International Markets .................................................................................................................... 135
Advanced Markets .................................................................................................................... 135
European Union .................................................................................................................. 137
Japan ..................................................................................................................................... 145
United Kingdom ................................................................................................................. 151
United States ....................................................................................................................... 158
Emerging Markets ..................................................................................................................... 165
Brazil ..................................................................................................................................... 167
China .................................................................................................................................... 174
India ...................................................................................................................................... 180
Mexico .................................................................................................................................. 186
Russia ................................................................................................................................... 192
South Korea ......................................................................................................................... 198
Canadian International Trade ................................................................................................. 204
Exports ................................................................................................................................. 204
Imports ................................................................................................................................. 219
Glossary ................................................................................................................................................... 235
List of Figures ......................................................................................................................................... 239
List of Tables ........................................................................................................................................... 245
1
1. The Economic Impact of Transportation in Manitoba1 - $3.23 Billion in 20072
The activities of various sectors of an economy are intertwined with those of other sectors in an
economy such that the economic impact is magnified or multiplied throughout the overall
economy. Measurement of such effects is undertaken through economic impact models which
attempt to quantify the intersectoral relationships. There are numerous designs of such models,
which vary primarily in the scope of the ‚net‛ which defines the direct impacts of the sector
under investigation.
For this study of transportation in Manitoba, the definition applied is the commercial carriage of
goods and people. This definition is advantageous to producing sound measures of the impact.
It limits criticism of overstatement of the effects by limiting the sectors considered to those
directly performing commercial transportation. It excludes allied sectors such as service
industries (example hotels), repair shops, or equipment manufacturers. When included these
allied sectors open the measured economic impact to criticism since the multiplicative effects of
activities from the direct industry include the impacts on these allied sectors. Overall this more
restrictive definition of the sector minimizes the validity of any criticism of double counting.
The Manitoba Bureau of Statistics regularly updates the parameters of the Input/Output model
which proxies the activities of and interactions among the various sectors of the economy. It is
these interactions which provide the iterative process of the model. While making the model a
more accurate reflection of the economy, these revisions compromise the validity of
comparisons made to previous reports3.
The robustness of economic impact results is dependent on the quality of information acquired
about the direct (or economic impact ‚driver‛) sector, and the quality of the input output matrix
used to derive the indirect and direct effects. Manitoba is a relatively small economy with few
firms in many sectors. The consequence is general weakness of direct and input output data.
Two approaches are available to acquire data for the direct sector. Data can be acquired from
third party data providers or the sector can be directly surveyed. In both cases, estimates of the
economic drivers of the entire population are developed from the survey.
1 Annual data updates along with changes in multipliers, may yield results that are not comparable
among annual reports. 2 The dollar related information in this section is in current dollars. 3 An example of this is found when comparing the 2006 Economic Impact of Transportation between the
2008 and 2009 editions of the Manitoba Transportation Report. In the 2008 edition, this figure was
reported as $3.34 Billion.

2
This analysis uses data acquired from third party data providers, principally Statistics Canada.
This approach reduces costs, allows the creation of historical results and assures greater
consistency of that historical information. The modes included in the analysis are:
For Hire Trucking
Rail
Aviation
Couriers and Local Messengers,4 and
Urban and Interurban Bus
Based upon the ‚driver‛ data provided, the Manitoba Bureau of Statistics generates the indirect
and induced effects using multipliers created by its analysis of intersectoral relationships.
Figure 1.1 summarizes the estimated growth in total GDP for Manitoba that is derived solely
from transportation activities5. Total GDP measured on this basis rose from $2.8 billion in 2003
to $3.23 billion in 2007. Overall annual contribution to GDP has remained fairly stable since
rising to $3.2 billion in 2005.
Figure 1.1: Trend in Total GDP from Transportation in Manitoba
($ Billion)
This total includes the leverage effect of direct activity in transportation on other sectors.
4 Couriers and local messengers include the major international courier companies such as FedEx. 5 These transportation activities comprise aviation, trucking, rail, courier, and bus (urban and other) in
Manitoba.
2.802.89
3.20 3.21 3.23
$0.00
$0.50
$1.00
$1.50
$2.00
$2.50
$3.00
$3.50
2003 2004 2005 2006 2007

3
The total economic impact of transportation is defined as the sum of direct economic activity,
indirect economic activity and induced economic activity. Direct economic activity is measured
by the economic drivers of employment, employment income, and expenditures and
contribution to provincial gross domestic product for the transportation sector. Indirect
activities are those that occur in firms that supply inputs to the direct sector. Induced effects are
the trickle down affects of the expenditures by both the direct and related indirect sector as they
multiply through other sectors of the economy. These are largely driven by consumption
spending. The indirect and induced effects are a measure of the leverage derived from the
direct effect. The higher the amount of leverage, the greater the additional economic activity
spawned from the original source. The total economic impact of the sector can be measured
when the direct and the leverage effects are combined.
Figure 1.2 shows the economic impact of the total Manitoba transportation GDP as a ratio of
direct, indirect, and induced effects.
Figure 1.2: Trend in Total GDP by Leverage Component from Transportation in Manitoba
($ Billion)
$1.00 Direct GDP = $1.95 Total GDP
Leverage Factor = .95
Overall, one dollar of GDP from direct transportation activities results in an additional $0.95
generated through activities in other sectors. In basic terms, the Leverage Factor is determined
by summing the indirect and induced effects and representing that sum as a percentage of the
direct expenditure or effect.
1.43 1.47 1.64 1.64 1.65
0.64 0.660.72 0.72 0.73
0.74 0.76
0.83 0.84 0.84
$0.00
$0.50
$1.00
$1.50
$2.00
$2.50
$3.00
$3.50
2003 2004 2005 2006 2007
Direct Indirect Induced
2.80 2.89
3.20 3.21 3.23

4
Since 2003, total employment attributable to transportation in Manitoba6 increased from about
47,390 to 50,745 FTEs (Figure 1.3).
Figure 1.3: Trend in Total Transportation Employment in Manitoba
(FTEs)
The level of employment in trucking was a major influence in total FTEs associated with
transportation. As shown in Figure 1.4 and Figure 1.5, trucking represents a major and
increasing share of transportation employment in the province. Although appearing to
stabilize, the number of jobs related to trucking has topped 28,000 in 2007.
6 Statistics Canada made significant adjustments to employment to the 2003 employment data for couriers in 2005.
47,39049,105
52,19550,795 50,745
0
10,000
20,000
30,000
40,000
50,000
60,000
2003 2004 2005 2006 2007

5
Figure 1.4: Trend in Total Employment from Trucking in Manitoba7
Figure 1.5: Trend in Total Employment from Aviation, Couriers, Rail, and Bus
in Manitoba
7 As noted, 2009 figures may appear differently than those reported in previous editions of the Manitoba
Transportation Report, due to economic model updates released by the Manitoba Bureau of Statistics.
20,920
23,495
27,675 27,895 28,280
0
5,000
10,000
15,000
20,000
25,000
30,000
35,000
2003 2004 2005 2006 2007
9,0758,510
7,1606,680 6,575
4,2303,755 3,760 3,725 3,755
8,100 7,940
8,425
7,500 7,275
5,0655,405 5,175
4,995 4,860
0
1,000
2,000
3,000
4,000
5,000
6,000
7,000
8,000
9,000
10,000
2003 2004 2005 2006 2007Aviation Couriers Rail Bus

6
As shown in Figure 1.5, non-trucking sectors have generally declined in employment since 2003.
Aviation-related jobs decreased by 2,500 from 2003 to 2007, while bus related jobs declined by
205 FTEs. Rail and courier-related jobs declined by 825 and 475, respectively.
Figure 1.6 shows the total employment by year broken down between direct, indirect, and
induced effects. For each direct job in transportation an additional .93 jobs are created.
Figure 1.6: Trend in Employment by Leverage Component from Transportation
in Manitoba
Number of Employees
1 Direct Job in 2007 = 1.93 Total Jobs
Leverage Factor = .93
24,285 25,205 26,970 26,275 26,255
10,940 11,31511,930 11,640 11,645
12,16512,585
13,295 12,880 12,845
5,000
10,000
15,000
20,000
25,000
30,000
35,000
40,000
45,000
50,000
55,000
2003 2004 2005 2006 2007
Direct Indirect Induced
50,745
47,39049,105
52,195 50,795

7
Total labour income in Manitoba due to the transportation sector rose from $1.68 billion in 2003
to $1.83 billion in 2007 (Figure 1.7).
Figure 1.7: Trend in Total Labour Income from Transportation in Manitoba
($ Billion)
1.681.74
1.86 1.82 1.83
$0.00
$0.20
$0.40
$0.60
$0.80
$1.00
$1.20
$1.40
$1.60
$1.80
$2.00
2003 2004 2005 2006 2007
8
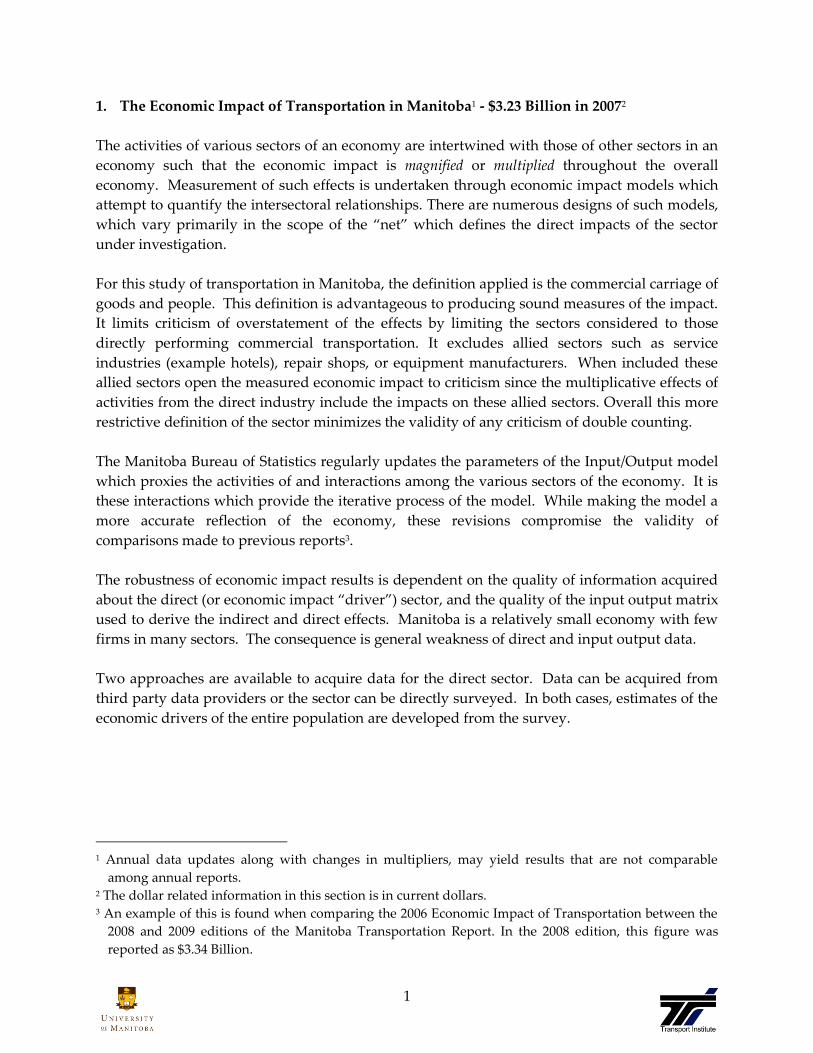
For each dollar of direct labour income in transportation, an additional $.76 in labour income is
created in the Manitoba economy. Figure 1.8 shows the components of labour income since
2003.
Figure 1.8: Trend in Labour Income by Leverage Component from Transportation
in Manitoba
($ Billion)
$1 Direct Labour Income in 2007 = $1.76 Total Labour Income
Leverage Factor = .76
0.95 0.98 1.06 1.03 1.04
0.37 0.390.41 0.4 0.41
0.360.37
0.4 0.39 0.39
$0.00
$0.20
$0.40
$0.60
$0.80
$1.00
$1.20
$1.40
$1.60
$1.80
$2.00
2003 2004 2005 2006 2007
Induced Indirect Direct
1.83
1.681.74
1.861.82

9
Amongst the modes, trucking is the largest transportation sector in Manitoba, contributing
about $1.3 billion to GDP in 2007, as shown in Figure 1.9. This is followed by rail at $0.97 billion
and aviation, which generates $0.54 billion.
Figure 1.9: Total Contribution to Manitoba GDP by Transportation Mode: 2007
($3.23 Billion)
Trucking, $1.29
Rail, $0.97
Bus, $0.20
Aviation, $0.54
Couriers, $0.22
10
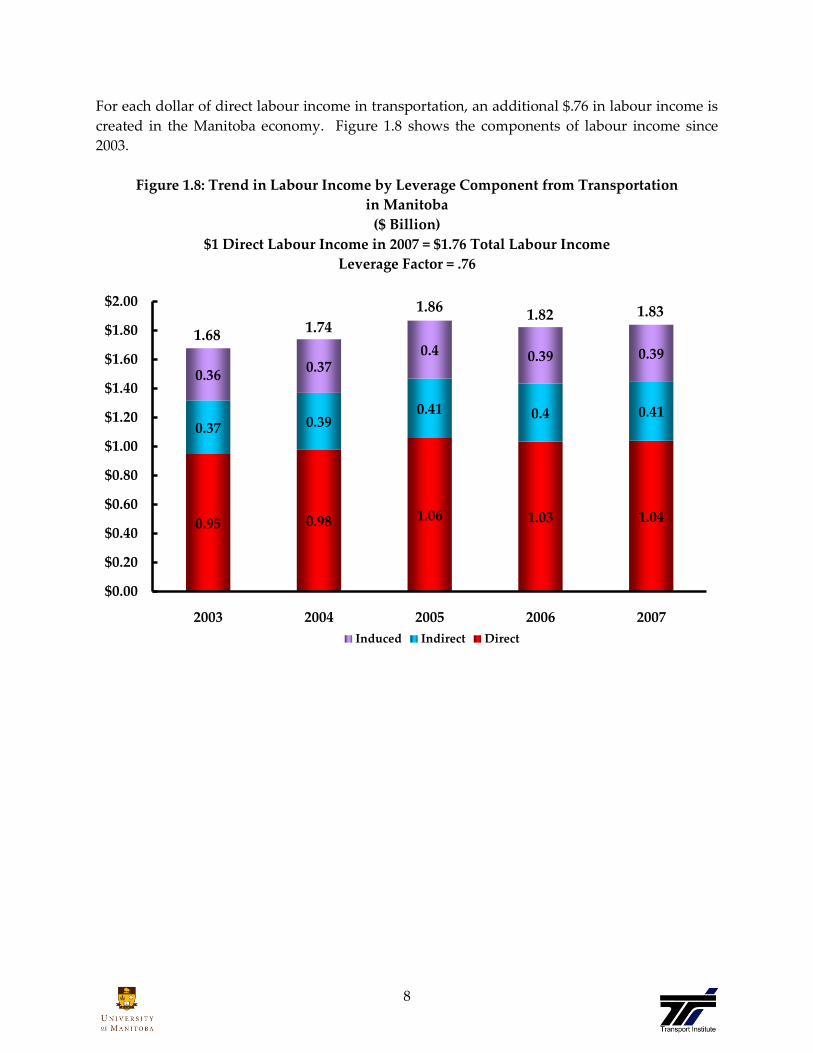
Figure 1.10 summarizes the annual contribution to GDP generated by each transportation mode
since 2003.
Figure 1.10: Contribution to Manitoba GDP by Transportation Mode
($ Billion)
Trucking has experienced steady growth over the period covered in Figure 1.10, while couriers
and bus have been fairly stable. Rail has also enjoyed modest growth, although it may have
peaked in 2005 in Manitoba. Aviation’s contribution was fairly stable from 2003 to 2005 but
appears to have dropped to a lower level in 2006 and 2007.
$0.6
1
$0.2
0
$0.9
5
$0.8
7
$0.1
8
$0.6
1
$0.2
1
$1.0
0
$0.8
9
$0.1
8
$0.6
2
$0.2
1
$1.1
3
$1.0
5
$0.1
9
$0.5
4
$0.2
2
$1.2
5
$1.0
0
$0.2
0
$0.5
4
$0.2
2
$1.2
9
$0.9
7
$0.2
0
$0.00$0.10$0.20$0.30$0.40$0.50$0.60$0.70$0.80$0.90$1.00$1.10$1.20$1.30$1.40$1.50$1.60$1.70
Aviation Couriers Trucking Rail Bus
2003 2004 2005 2006 2007

11
Figure 1.11 shows the comparative leverage of each of the modes in terms of contribution to
GDP. Per dollar of GDP generated directly, bus generates the highest level of leverage
throughout the economy at 1.69, followed by aviation at 1.52. Couriers and trucking had lower
leverage effects, at 1.09 and 1.04, respectively. Rail’s leverage for GDP was the lowest of the 5
modes, at 0.56.
Figure 1.11: Leverage Ratios for Manitoba Total GDP by Transportation Mode
1.69
1.52
1.091.04
0.56
0.00
0.20
0.40
0.60
0.80
1.00
1.20
1.40
1.60
1.80
Bus Aviation Couriers Trucking Rail

12
As presented in Figure 1.12 total employment created by the trucking sector is greater than that
created by all the other sectors combined.
Figure 1.12: Contribution to Manitoba Total Employment by Transportation Mode: 2007
Total: 50,745 FTEs
Trucking, 28,280
Rail, 7,275
Bus, 4,860
Aviation, 6,575
Couriers, 3,755

13
Total employment generated by each of the modes from 2003 to 2007 are presented in Figure
1.13. Employment related to trucking had increased from 20,920 to 28,280, an increase of 7,360
FTEs. Aviation-generated employment declined from 9,075 to 6,575, or a loss of 2,500 FTEs.
Rail declined from 8,100 to 7,275. Employment associated with the Bus sector rose slightly from
its 2003 level to a recent high of 5,405, after which it fell to 4,860 FTEs by 2007. Courier sector-
related employment decreased from 4,230 in 2003 to 3,755 in 2004 and has remained fairly stable
since 2004-2007.
Figure 1.13: Total Employment by Transportation Mode
(FTEs)
9,07
5
4,23
0
20,9
20
8,10
0
5,06
58,51
0
3,75
5
23,4
95
7,94
0
5,40
5
7,16
0
3,76
0
27,6
75
8,42
5
5,17
5
6,68
0
3,72
5
27,8
95
7,50
0
4,99
5
6,57
5
3,75
5
28,2
80
7,27
5
4,86
0
0
5,000
10,000
15,000
20,000
25,000
30,000
Aviation Couriers Trucking Rail Bus
2003 2004 2005 2006 2007

14
With respect to leverage in creating jobs throughout the economy, each aviation direct job
generates an additional 1.5 jobs (Figure 1.14). This is followed by trucking at 0.92 FTEs, rail at
.86, bus at .81, and finally courier at .62 FTEs generated for each direct FTE.
Figure 1.14: Leverage Ratios for Manitoba Employment by Transportation Mode
1.49
0.920.86
0.81
0.62
0.00
0.20
0.40
0.60
0.80
1.00
1.20
1.40
1.60
Aviation Trucking Rail Bus Couriers

15
Considering labour income, trucking is also the largest modal contributor to the economy. As
shown in Figure 1.15, the trucking industry overall produced $.86 billion in labour income in
2007. This was followed by rail at $.45 billion, aviation at $.26 billion, bus at $151 million and
couriers at $112 million.
Figure 1.15: Contribution to Manitoba Total Labour Income by Transportation Mode: 2007
$1.83 Billion
Trucking, $0.86
Rail, $0.45
Bus, $0.15
Aviation, $0.26
Couriers, $0.11

16
Labour income generated by each of the transportation sectors from 2003 to 2007 is presented in
Figure 1.16. Labour income generated from trucking increased from $.58 billion to $.86 billion.
Aviation decreased from $.41 billion to $.26 billion. Rail started at $.46 billion, peaked in 2005,
and dropped back to $.45 billion in 2007. Labour income associated with couriers was
essentially stable, while employment associated with the bus sector rose fractionally.
Figure 1.16: Total Labour Income by Transportation Mode
($ Billion)
$0.4
1
$0.1
0
$0.5
8
$0.4
6
$0.1
3
$0.3
7
$0.1
1
$0.6
7
$0.4
5
$0.1
4
$0.3
0
$0.1
1
$0.7
9
$0.5
2
$0.1
4
$0.2
6
$0.1
1
$0.8
4
$0.4
7
$0.1
5
$0.2
6
$0.1
1
$0.8
6
$0.4
5
$0.1
5
$0.00
$0.10
$0.20
$0.30
$0.40
$0.50
$0.60
$0.70
$0.80
$0.90
$1.00
Aviation Couriers Trucking Rail Bus
2003 2004 2005 2006 2007
17
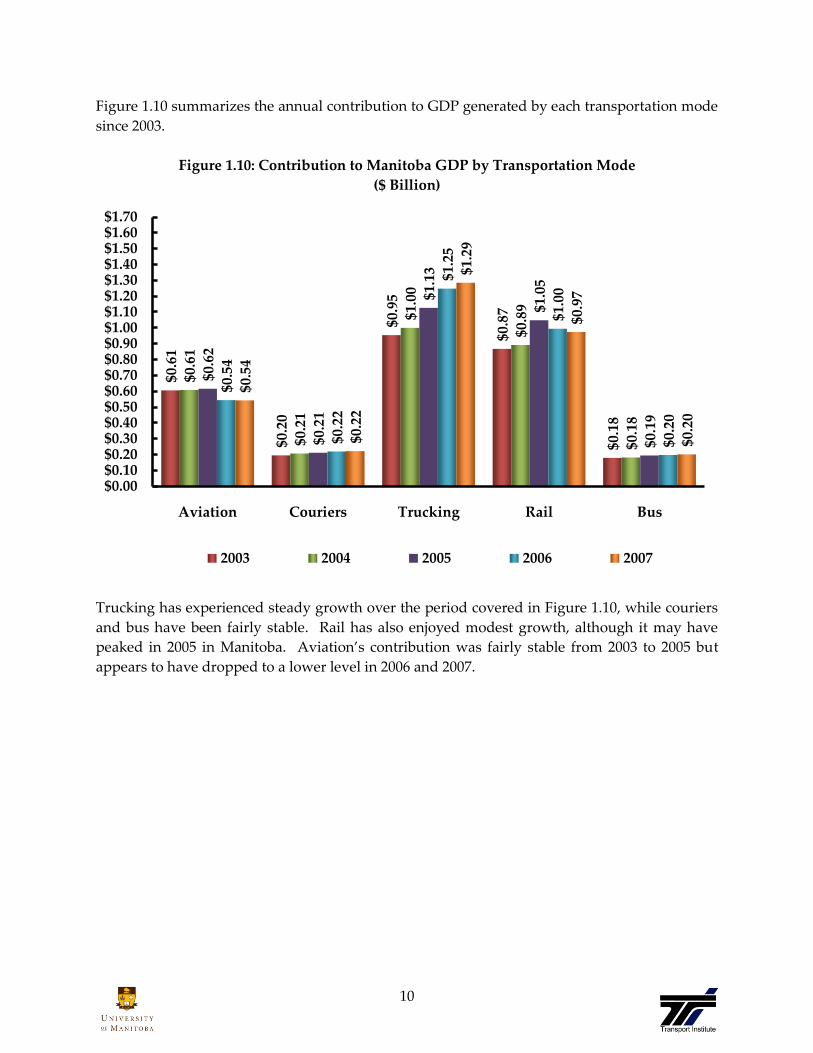
Figure 1.17 provides the leverage ratios for labour income by mode. Aviation provides the
greatest leverage with $1.06 of additional labour income through the economy for every dollar
of direct labour income in aviation. This is followed by trucking ($0.90), couriers ($0.69), rail
($0.56), and finally the bus sector, with $0.45 leveraged from each $1 of labour income spent
directly in the sector.
Figure 1.17: Leverage Ratios for Manitoba Labour Income by Transportation Mode
1.06
0.90
0.69
0.56
0.45
0.00
0.20
0.40
0.60
0.80
1.00
1.20
Aviation Trucking Couriers Rail Bus

18
2. Transportation and Warehousing and the Regional Canadian Economy
Canada comprises the second largest national land mass on the globe, with likely the lowest
population density among industrialized nations. This, coupled with our dependence on
international trade, incorporates a significant spatial element to virtually all aspects of our
economy.
Figure 2.1 shows per capita gross domestic product8 from Transportation and Warehousing in
western Canada versus eastern Canada. GDP related to transportation has increased steadily
from 2003 to 2007 in both eastern and western Canada. Transportation and Warehousing on a
per capita basis is much higher in western Canada however, maintaining a value of $2,444 in
2007 compared to $1,391 in eastern Canada.
Figure 2.1: Per Capita Direct GDP from Transportation and Warehousing by Region9
Figure 2.2 displays the importance of transportation and warehousing in western Canada
relative to eastern Canada. The ratio of gross domestic product per capita from Transportation
8 Gross domestic product (GDP) figures are in 2002 dollars. Previous versions of the MTR used 1997
dollars for determining GDP figures, however these tables from Statistics Canada are no longer in
circulation, as such, some figures in this section may not be comparable to previous versions of the MTR
report. 9 Western Canada includes Manitoba, Saskatchewan, Alberta, British Columbia, Yukon Territory,
Northwest Territories and Nunavut.
$1,584$1,628
$1,674 $1,704 $1,715
$2,162$2,219
$2,327$2,411 $2,444
$1,334 $1,372 $1,389 $1,393 $1,391
$1,000
$1,400
$1,800
$2,200
$2,600
2003 2004 2005 2006 2007
Canada Western Canada Eastern Canada

19
and Warehousing grew steadily from 2003 to 2007. From 2006 to 2007, only a minimal increase
in the ratio of GDP was experienced. The ratio of GDP per capita from Transportation and
Warehousing has grown by 8% from 2003 to 2007. This rate of increase is an indicator that
Transportation and Warehousing is ever increasingly important in western Canada relative to
eastern Canada.
Figure 2.2: Ratio of Per Capita Contribution from Transportation and Warehousing to Direct
GDP: Western Canada Compared to Eastern Canada
162.1% 161.7%
167.6%
173.1%
175.7%
150%
155%
160%
165%
170%
175%
180%
2003 2004 2005 2006 2007
20
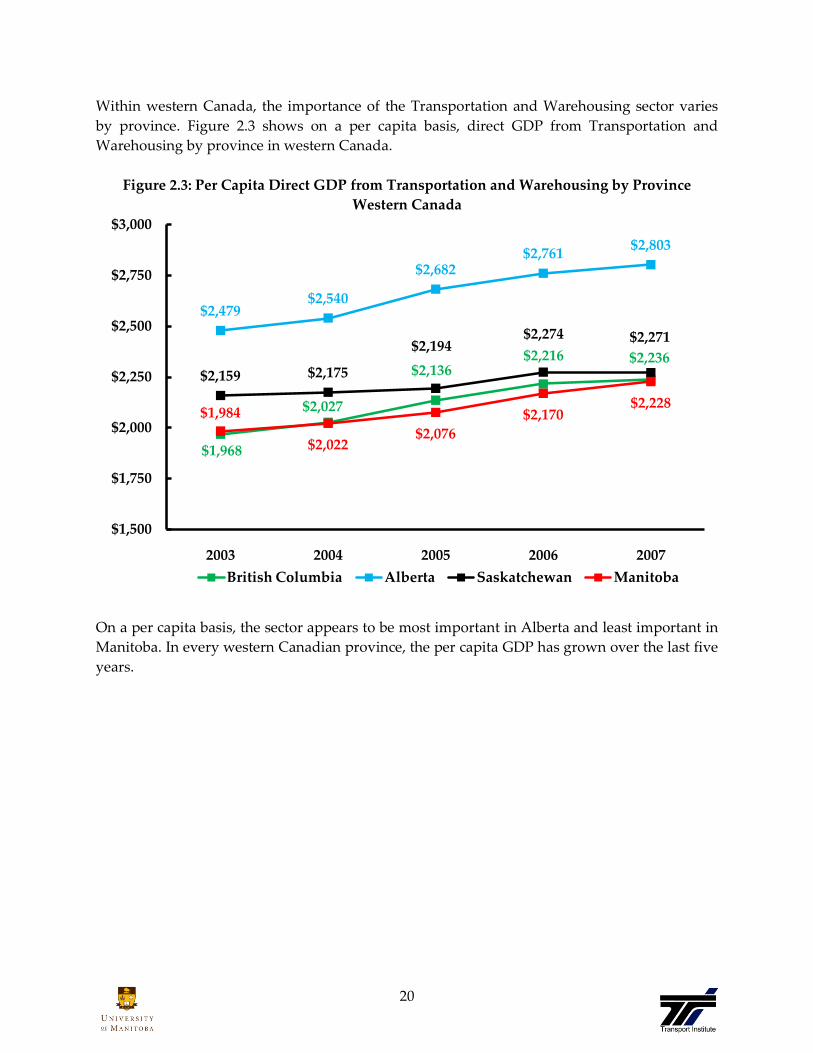
Within western Canada, the importance of the Transportation and Warehousing sector varies
by province. Figure 2.3 shows on a per capita basis, direct GDP from Transportation and
Warehousing by province in western Canada.
Figure 2.3: Per Capita Direct GDP from Transportation and Warehousing by Province
Western Canada
On a per capita basis, the sector appears to be most important in Alberta and least important in
Manitoba. In every western Canadian province, the per capita GDP has grown over the last five
years.
$1,968
$2,027
$2,136$2,216 $2,236
$2,479$2,540
$2,682$2,761
$2,803
$2,159 $2,175
$2,194$2,274 $2,271
$1,984
$2,022$2,076
$2,170$2,228
$1,500
$1,750
$2,000
$2,250
$2,500
$2,750
$3,000
2003 2004 2005 2006 2007
British Columbia Alberta Saskatchewan Manitoba
21
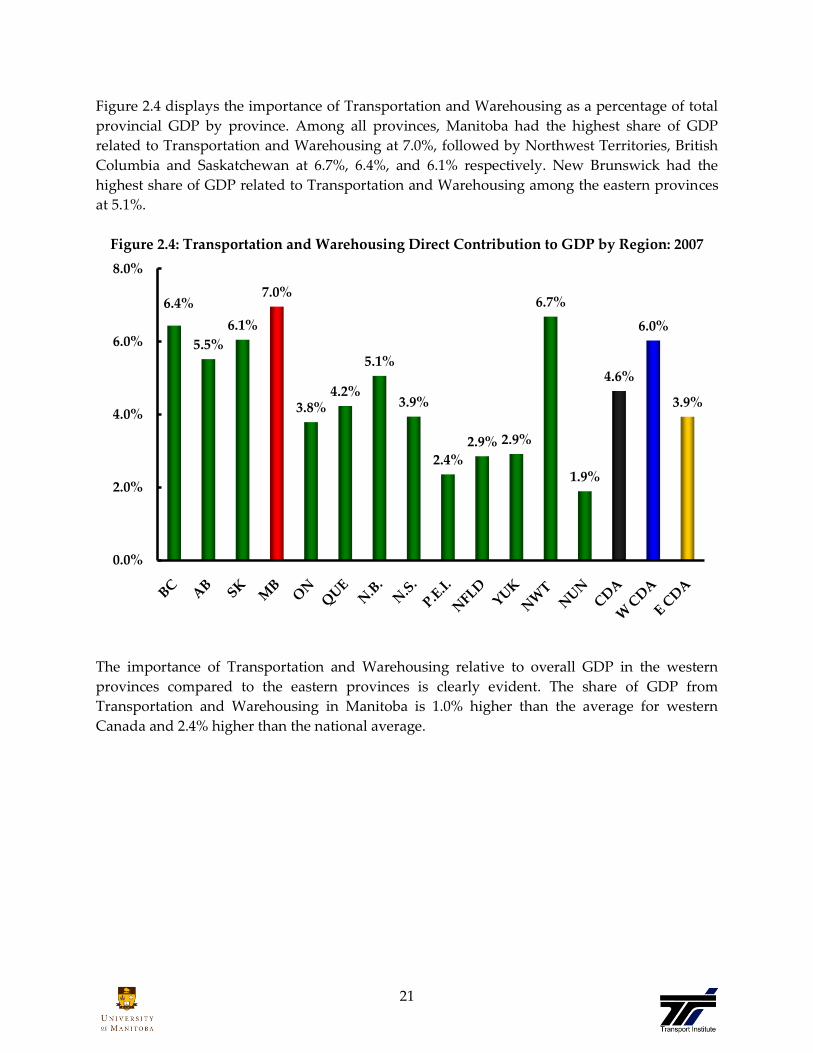
Figure 2.4 displays the importance of Transportation and Warehousing as a percentage of total
provincial GDP by province. Among all provinces, Manitoba had the highest share of GDP
related to Transportation and Warehousing at 7.0%, followed by Northwest Territories, British
Columbia and Saskatchewan at 6.7%, 6.4%, and 6.1% respectively. New Brunswick had the
highest share of GDP related to Transportation and Warehousing among the eastern provinces
at 5.1%.
Figure 2.4: Transportation and Warehousing Direct Contribution to GDP by Region: 2007
The importance of Transportation and Warehousing relative to overall GDP in the western
provinces compared to the eastern provinces is clearly evident. The share of GDP from
Transportation and Warehousing in Manitoba is 1.0% higher than the average for western
Canada and 2.4% higher than the national average.
6.4%
5.5%
6.1%
7.0%
3.8%4.2%
5.1%
3.9%
2.4%
2.9% 2.9%
6.7%
1.9%
4.6%
6.0%
3.9%
0.0%
2.0%
4.0%
6.0%
8.0%
22
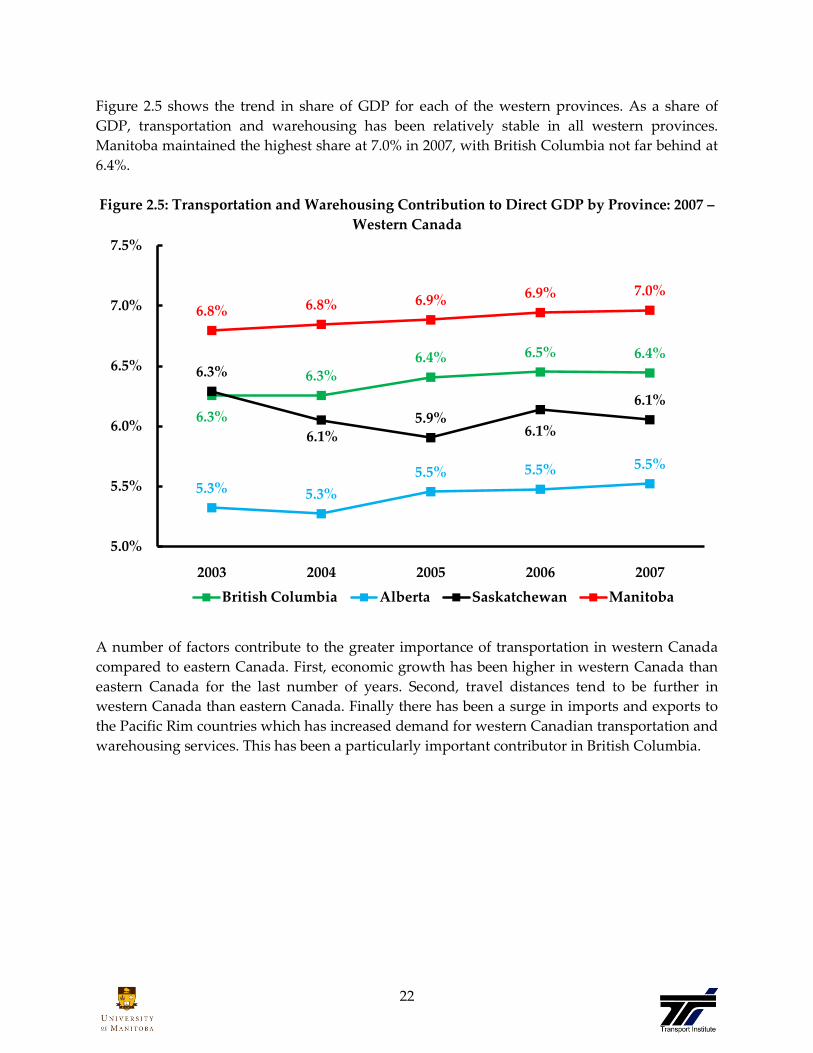
Figure 2.5 shows the trend in share of GDP for each of the western provinces. As a share of
GDP, transportation and warehousing has been relatively stable in all western provinces.
Manitoba maintained the highest share at 7.0% in 2007, with British Columbia not far behind at
6.4%.
Figure 2.5: Transportation and Warehousing Contribution to Direct GDP by Province: 2007 –
Western Canada
A number of factors contribute to the greater importance of transportation in western Canada
compared to eastern Canada. First, economic growth has been higher in western Canada than
eastern Canada for the last number of years. Second, travel distances tend to be further in
western Canada than eastern Canada. Finally there has been a surge in imports and exports to
the Pacific Rim countries which has increased demand for western Canadian transportation and
warehousing services. This has been a particularly important contributor in British Columbia.
6.3%
6.3%6.4% 6.5% 6.4%
5.3% 5.3%
5.5% 5.5% 5.5%
6.3%
6.1%5.9%
6.1%
6.1%
6.8% 6.8% 6.9% 6.9% 7.0%
5.0%
5.5%
6.0%
6.5%
7.0%
7.5%
2003 2004 2005 2006 2007
British Columbia Alberta Saskatchewan Manitoba

23
Figure 2.6 displays employment in Transportation and Warehousing per thousand population.
Figure 2.6: Direct Employment in Transportation and Warehousing per 1,000 Population by
Region
In western Canada, employment in Transportation and Warehousing has consistently been 22
employees per 1000 persons from 2003 to 2007. In eastern Canada, employment has also been
consistent, averaging 18 employees per 1000 persons from 2003-2007.
19.3 19.4 19.5 19.6 19.8
22.5 22.4 22.322.7 22.9
18.0 18.1 18.2 18.3 18.4
15
17
19
21
23
25
2003 2004 2005 2006 2007
Canada Western Canada Eastern Canada

24
Figure 2.7 shows the ratio of per capita Transportation and Warehousing employment for
western Canada compared to eastern Canada. The ratio of Transportation and Warehousing
employment per capita has remained relatively stable from 2003 to 2007, declining slightly, then
increasing back to previous levels. The ratio of 124.4% in 2007 is only 0.4% lower than the 2003
ratio of 124.8%.
Figure 2.7: Ratio of Per Capita Direct Transportation and Warehousing Employment: Western
Canada Compared to Eastern Canada
124.8%124.0%
122.8%
124.2% 124.4%
110%
115%
120%
125%
130%
2003 2004 2005 2006 2007

25
Figure 2.8 displays direct employment in Transportation and Warehousing per thousand
persons in western Canada.
Transportation and Warehousing employment per thousand persons is highest in Manitoba at
24.3, closely followed by Alberta at 24.2. Manitoba’s Transportation and Warehousing
employment experienced a small drop from 2003 to 2005, and has since recovered slightly,
however this has allowed Alberta to close the gap. British Columbia’s Transportation and
Warehousing employment per thousand persons averaged 21.5 from 2003 to 2007, while
Saskatchewan averaged 19.8.
Figure 2.8: Direct Employment in Transportation and Warehousing per 1,000 Population by
Province: Western Canada
21.5 21.4 21.321.8 21.7
23.0 23.2 23.6 23.724.2
20.1 19.919.4 19.7 19.9
25.525.1
23.8 24.2 24.3
15
20
25
30
2003 2004 2005 2006 2007
British Columbia Alberta Saskatchewan Manitoba

26
Figure 2.9 shows the share of total employment from Transportation and Warehousing for each
region. Among all provinces, the share of jobs related to Transportation and Warehousing was
most important in Manitoba10 at 5.5% followed by New Brunswick at 5.4%. The share of jobs
related to Transportation and Warehousing was more important in western Canada which had
a value of 5.1% compared to 4.4% for eastern Canada and 4.6% nationally.
Figure 2.9: Transportation and Warehousing Contribution to Direct Employment by
Region: 2007
10 While the ratio is higher in both the Northwest Territories and the Yukon, the size of the population
and number of jobs are small.
5.1%
5.0%
4.8% 5.
5%
4.3% 4.5%
5.4%
4.5%
3.3%
4.8%
5.8%
10.5
%
5.2%
4.6% 5.
1%
4.4%
0.0%
2.0%
4.0%
6.0%
8.0%
10.0%
12.0%
27
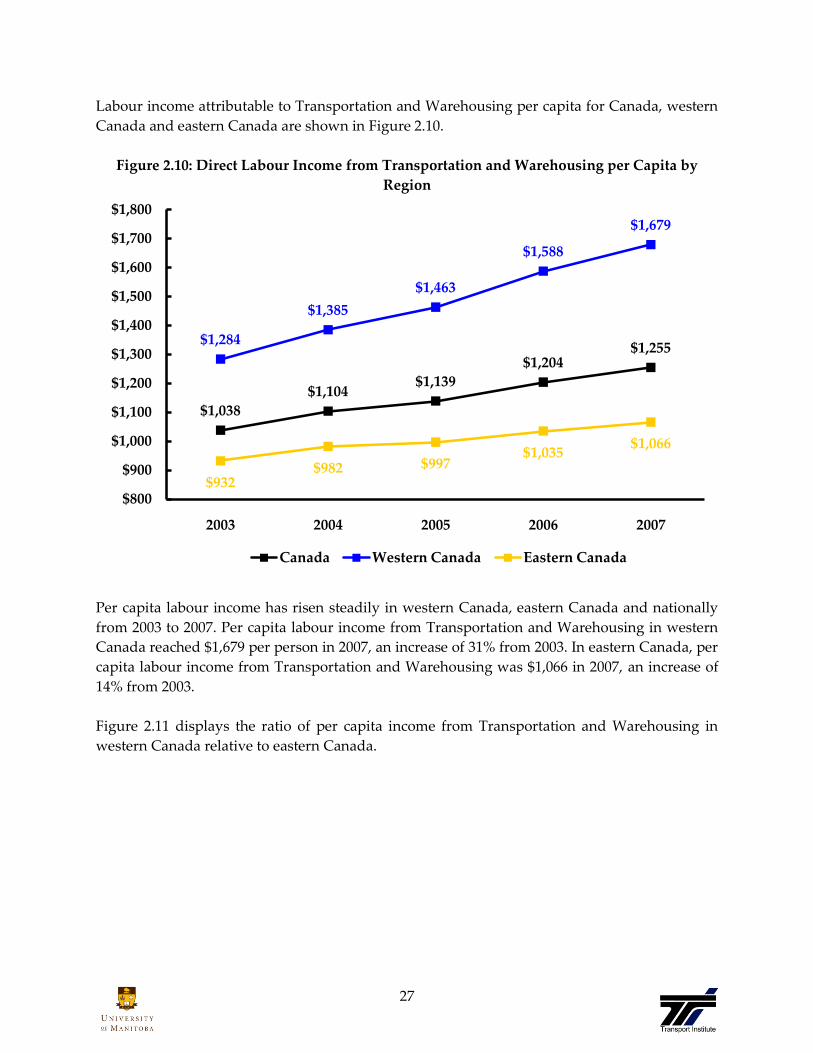
Labour income attributable to Transportation and Warehousing per capita for Canada, western
Canada and eastern Canada are shown in Figure 2.10.
Figure 2.10: Direct Labour Income from Transportation and Warehousing per Capita by
Region
Per capita labour income has risen steadily in western Canada, eastern Canada and nationally
from 2003 to 2007. Per capita labour income from Transportation and Warehousing in western
Canada reached $1,679 per person in 2007, an increase of 31% from 2003. In eastern Canada, per
capita labour income from Transportation and Warehousing was $1,066 in 2007, an increase of
14% from 2003.
Figure 2.11 displays the ratio of per capita income from Transportation and Warehousing in
western Canada relative to eastern Canada.
$1,038
$1,104$1,139
$1,204$1,255
$1,284
$1,385
$1,463
$1,588
$1,679
$932$982 $997
$1,035$1,066
$800
$900
$1,000
$1,100
$1,200
$1,300
$1,400
$1,500
$1,600
$1,700
$1,800
2003 2004 2005 2006 2007
Canada Western Canada Eastern Canada

28
Figure 2.11: Ratio of Direct Per Capita Income Contribution from Transportation and
Warehousing to GDP: Western Canada Compared to Eastern Canada
The ratio has risen steadily from 2003 to 2007 averaging annual growth of approximately 4.9%.
From 2003 to 2007, the ratio has increased by almost 20%. This indicates that in relative terms,
the Transportation and Warehousing industry is becoming an increasingly more important
sector in western Canada than eastern Canada.
137.8%
141.1%
146.8%
153.4%
157.5%
125%
130%
135%
140%
145%
150%
155%
160%
2003 2004 2005 2006 2007

29
Labour income per capita has grown in all western provinces over the past five years as shown
in Figure 2.12. During the previous five years (2003-2007), the per capita direct labour incomes
of each of the western Canadian provinces experienced annual increases. In 2007, Alberta
experienced the highest growth levels among western provinces as labour income per capita
from Transportation and Warehousing reached $2,053 in 2007, an increase of 51% from 2003.
Figure 2.12: Direct Labour Income from Transportation and Warehousing per Capita by
Province: Western Canada
$1,294
$1,364$1,388
$1,484$1,549
$1,361
$1,542
$1,712
$1,908
$2,053
$991 $1,018$1,080
$1,125$1,192$1,258
$1,308 $1,330$1,393
$1,436
$800
$1,000
$1,200
$1,400
$1,600
$1,800
$2,000
$2,200
2003 2004 2005 2006 2007
British Columbia Alberta Saskatchewan Manitoba

30
Figure 2.13 displays the share of labour income generated by Transportation and Warehousing
for each province and territory.
Figure 2.13: Transportation and Warehousing Direct Contribution to Labour Income by
Region: 2007
At 7.1%, Transportation and Warehousing’s share of labour income was highest in Manitoba
and Northwest Territories, followed by British Columbia at 6.7%. Nationally, 5.3% of labour
income was the result of Transportation and Warehousing. In western Canada the share was
6.4%, while in eastern Canada it was 4.7%.
6.7%
6.1% 5.9%
7.1%
4.5%
5.1% 5.3%
4.7%
2.9%
5.0%
4.4%
7.1%
3.5%
5.3%
6.4%
4.7%
0.0%
1.0%
2.0%
3.0%
4.0%
5.0%
6.0%
7.0%
8.0%

31
In 2007, Transportation and Warehousing was the fourth most important sector of the Manitoba
economy, contributing $2.7 billion to the provincial GDP11(worth approximately $38.3 billion).
Transportation and Warehousing only trailed the finance and insurance, manufacturing, and
health care and social assistance sectors in terms of direct GDP contribution to the Manitoba
economy. Transportation and Warehousing moved ahead of Public Administration into fourth
place in terms of contribution to GDP, a move up from its fifth place ranking in 2006.
Transportation is a derived demand and as such has a direct relationship with key sectors
(shown by the blue bars in Figure 2.14) such as manufacturing, retail trade, and construction.
When these sectors are included with Transportation and Warehousing, the GDP totals almost
$18 billion.
Figure 2.14: Direct GDP of Sectors of the Manitoba Economy: 2007
11 The GDP measured by Statistics Canada in this section is the direct contribution of Transportation and
Warehousing and directly related sectors. It excludes indirect and induced effects discussed in Section
1.
$7.0
$5.0
$3.1 $2.7 $2.6 $2.6$2.3 $2.0 $1.9 $1.7 $1.6
$1.2 $1.1 $1.0 $0.8 $0.7 $0.7 $0.4
$0.0
$1.0
$2.0
$3.0
$4.0
$5.0
$6.0
$7.0
$8.0
$ B
illi
on
s
32
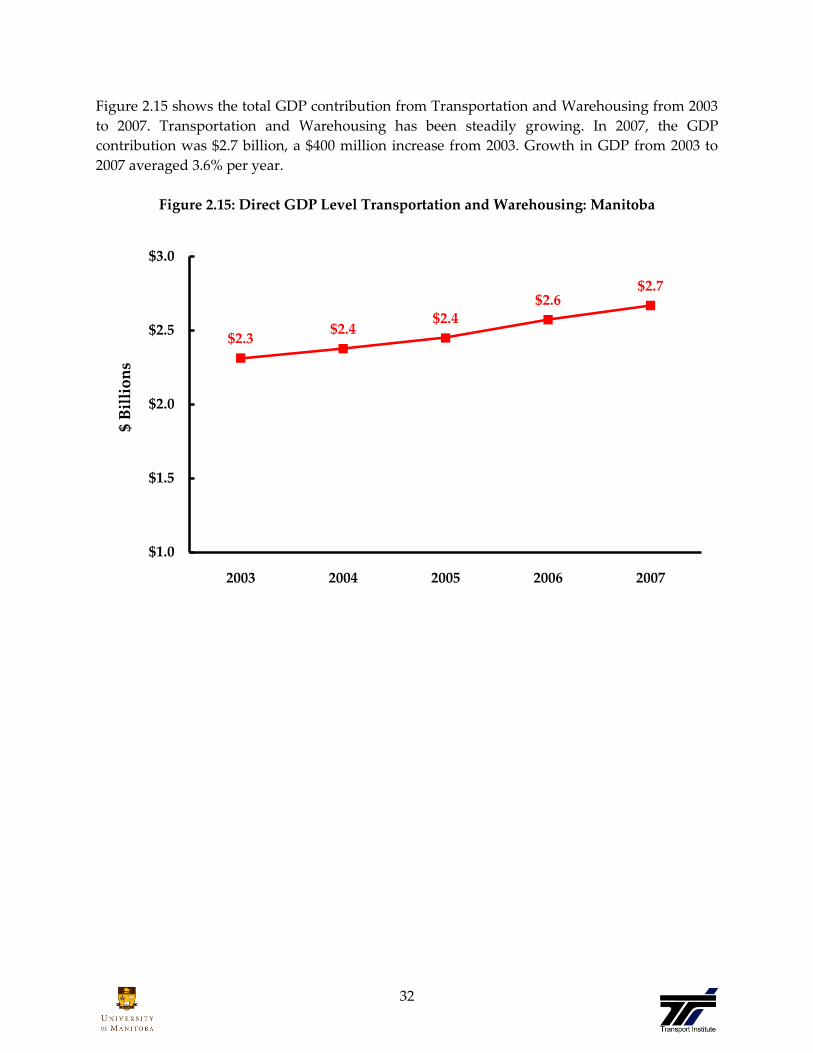
Figure 2.15 shows the total GDP contribution from Transportation and Warehousing from 2003
to 2007. Transportation and Warehousing has been steadily growing. In 2007, the GDP
contribution was $2.7 billion, a $400 million increase from 2003. Growth in GDP from 2003 to
2007 averaged 3.6% per year.
Figure 2.15: Direct GDP Level Transportation and Warehousing: Manitoba
$2.3$2.4
$2.4$2.6
$2.7
$1.0
$1.5
$2.0
$2.5
$3.0
2003 2004 2005 2006 2007
$ B
illi
on
s
33
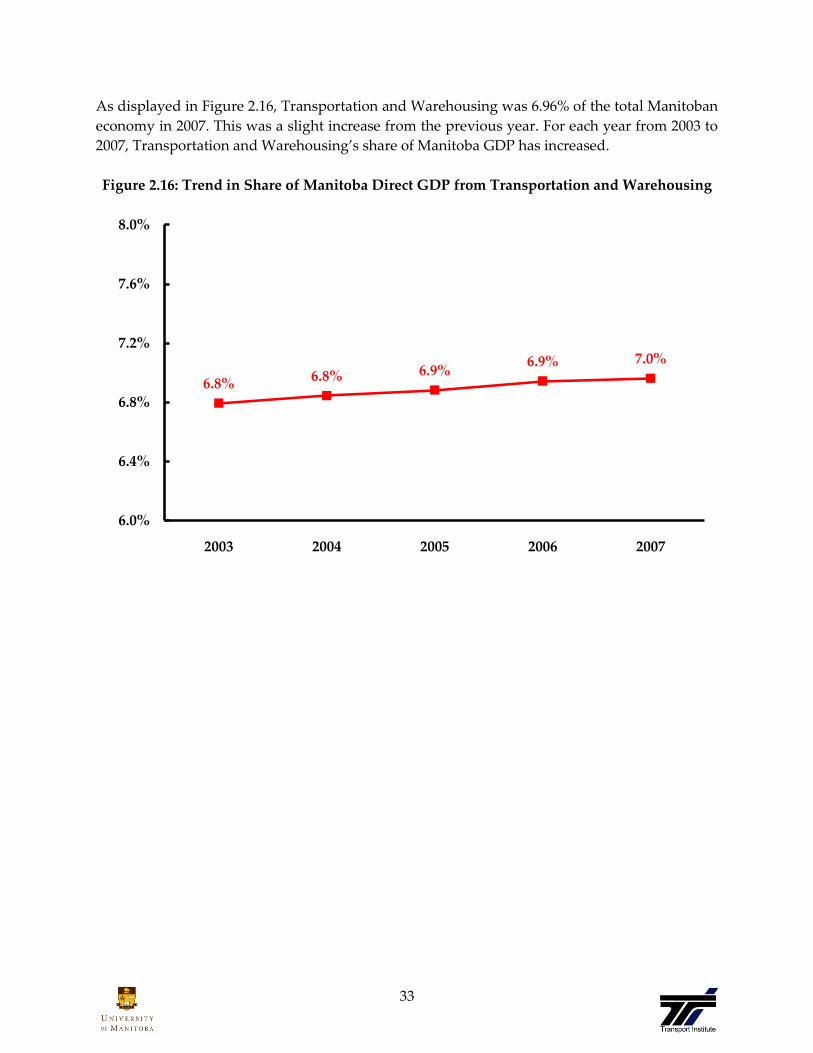
As displayed in Figure 2.16, Transportation and Warehousing was 6.96% of the total Manitoban
economy in 2007. This was a slight increase from the previous year. For each year from 2003 to
2007, Transportation and Warehousing’s share of Manitoba GDP has increased.
Figure 2.16: Trend in Share of Manitoba Direct GDP from Transportation and Warehousing
6.8%6.8% 6.9%
6.9% 7.0%
6.0%
6.4%
6.8%
7.2%
7.6%
8.0%
2003 2004 2005 2006 2007
34
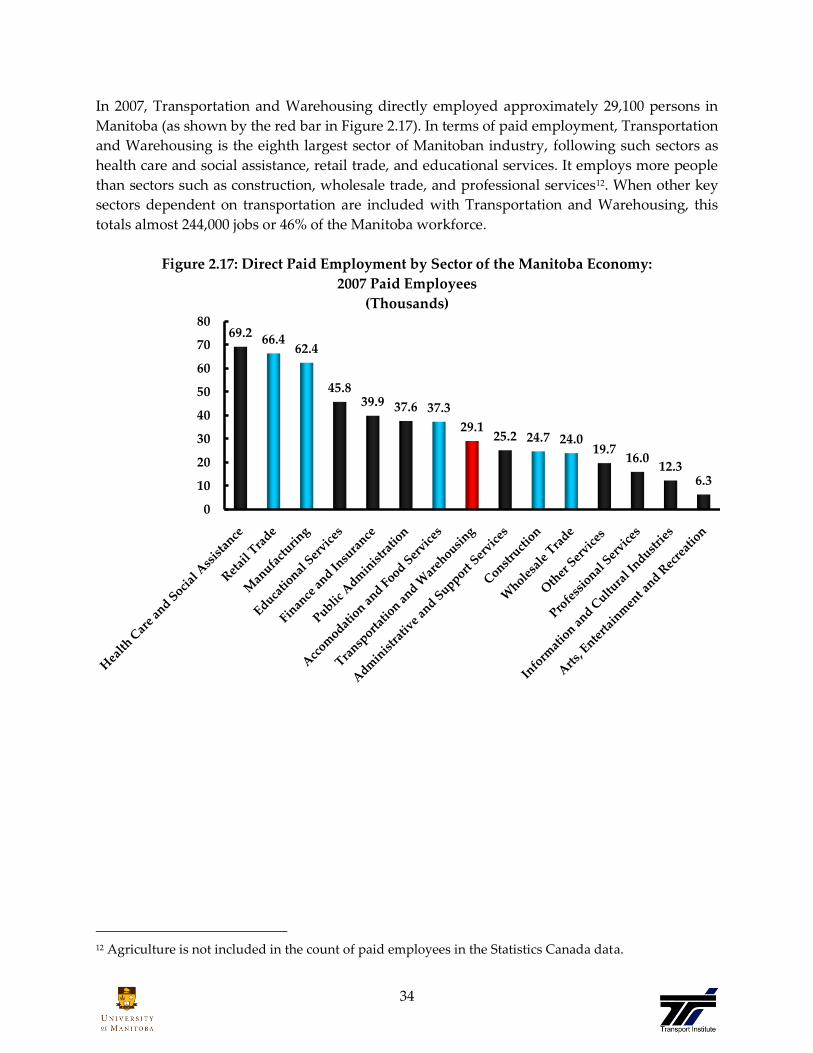
In 2007, Transportation and Warehousing directly employed approximately 29,100 persons in
Manitoba (as shown by the red bar in Figure 2.17). In terms of paid employment, Transportation
and Warehousing is the eighth largest sector of Manitoban industry, following such sectors as
health care and social assistance, retail trade, and educational services. It employs more people
than sectors such as construction, wholesale trade, and professional services12. When other key
sectors dependent on transportation are included with Transportation and Warehousing, this
totals almost 244,000 jobs or 46% of the Manitoba workforce.
Figure 2.17: Direct Paid Employment by Sector of the Manitoba Economy:
2007 Paid Employees
(Thousands)
12 Agriculture is not included in the count of paid employees in the Statistics Canada data.
69.2 66.462.4
45.839.9 37.6 37.3
29.125.2 24.7 24.0
19.716.0
12.36.3
0
10
20
30
40
50
60
70
80

35
Figure 2.18 displays the annual paid employment of Transportation and Warehousing workers
in Manitoba.
Figure 2.18: Trend in Transportation and Warehousing’s Direct Total Employment
Paid Employees
(Thousands)
Employment in the Transportation and Warehousing sector experienced a sizeable decrease
from 2003 to 2005 of approximately 1,800 paid employees. This figure has slightly recovered in
recent years, with employment reaching 29,100 in 2007.
29.8
29.5
28.0
28.6
29.1
27
27.5
28
28.5
29
29.5
30
30.5
31
2003 2004 2005 2006 2007
000
Pai
d E
mp
loy
ees
36
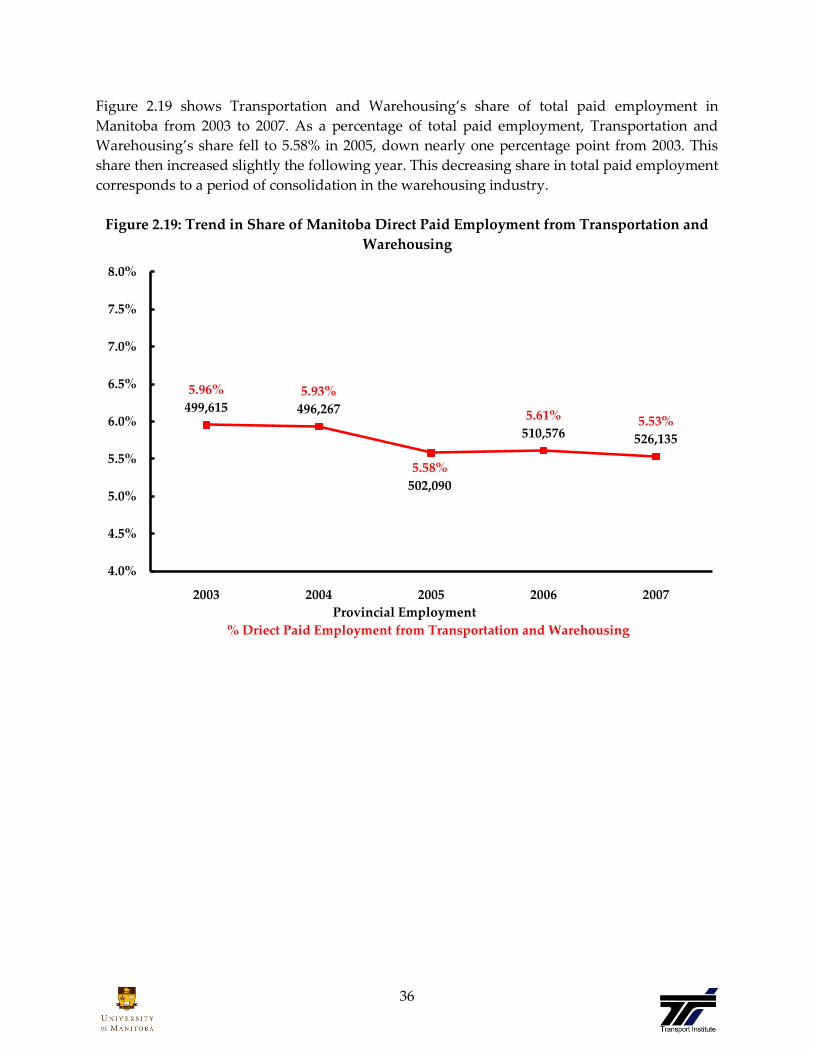
Figure 2.19 shows Transportation and Warehousing’s share of total paid employment in
Manitoba from 2003 to 2007. As a percentage of total paid employment, Transportation and
Warehousing’s share fell to 5.58% in 2005, down nearly one percentage point from 2003. This
share then increased slightly the following year. This decreasing share in total paid employment
corresponds to a period of consolidation in the warehousing industry.
Figure 2.19: Trend in Share of Manitoba Direct Paid Employment from Transportation and
Warehousing
5.96%
499,6155.93%
496,267
5.58%
502,090
5.61%
510,5765.53%
526,135
4.0%
4.5%
5.0%
5.5%
6.0%
6.5%
7.0%
7.5%
8.0%
2003 2004 2005 2006 2007
Provincial Employment
% Driect Paid Employment from Transportation and Warehousing
37
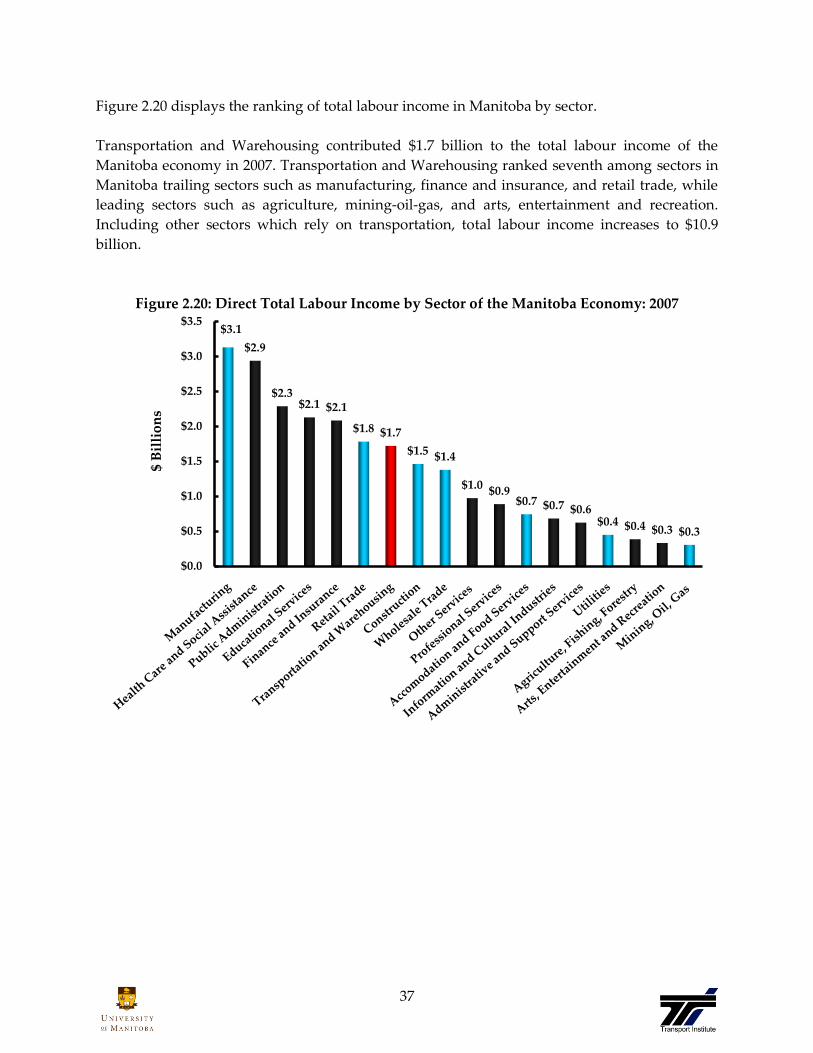
Figure 2.20 displays the ranking of total labour income in Manitoba by sector.
Transportation and Warehousing contributed $1.7 billion to the total labour income of the
Manitoba economy in 2007. Transportation and Warehousing ranked seventh among sectors in
Manitoba trailing sectors such as manufacturing, finance and insurance, and retail trade, while
leading sectors such as agriculture, mining-oil-gas, and arts, entertainment and recreation.
Including other sectors which rely on transportation, total labour income increases to $10.9
billion.
Figure 2.20: Direct Total Labour Income by Sector of the Manitoba Economy: 2007
$3.1
$2.9
$2.3$2.1 $2.1
$1.8 $1.7
$1.5 $1.4
$1.0 $0.9$0.7 $0.7 $0.6
$0.4 $0.4 $0.3 $0.3
$0.0
$0.5
$1.0
$1.5
$2.0
$2.5
$3.0
$3.5
$ B
illi
on
s
38
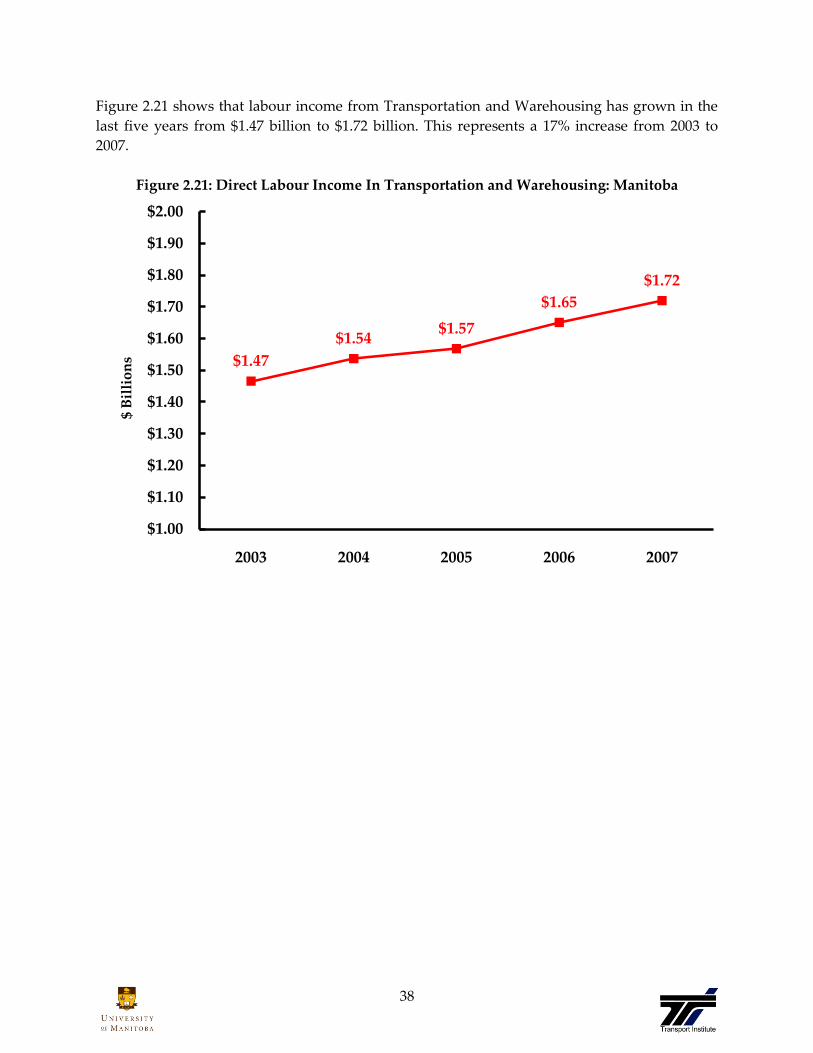
Figure 2.21 shows that labour income from Transportation and Warehousing has grown in the
last five years from $1.47 billion to $1.72 billion. This represents a 17% increase from 2003 to
2007.
Figure 2.21: Direct Labour Income In Transportation and Warehousing: Manitoba
$1.47
$1.54$1.57
$1.65
$1.72
$1.00
$1.10
$1.20
$1.30
$1.40
$1.50
$1.60
$1.70
$1.80
$1.90
$2.00
2003 2004 2005 2006 2007
$ B
illi
on
s

39
In spite of the growth shown in Figure 2.21, as a share of total labour income in Manitoba,
Transportation and Warehousing has declined from 7.55% in 2003 to 7.09% in 2007 as shown in
Figure 2.22.
Figure 2.22: Trend in Share of Manitoba Labour Income from Transportation and
Warehousing
This decline reflects the fact that although wages have increased for the Transportation and
Warehousing sector, wages from all other industries have collectively increased by a larger
amount.
7.55% 7.50%7.34% 7.30%
7.09%
5.0%
6.0%
7.0%
8.0%
9.0%
10.0%
2003 2004 2005 2006 2007

40
3. The State of the Macro Economy
The macroeconomic perspective presents the performance, structure and behavior of the
national or the regional economies as a whole. This review of the macro economy will cover the
global, the Canadian and the Manitoba economies.
Most of the recent data and reports indicate that the global economy is in a severe global
economic downturn. In January of 2009, the World Economic Situation and Prospects 2009
prepared by the United Nations suggested that ‚the world economy is mired in the worst
financial crisis since the Great Depression. What first appeared as a sub-prime mortgage crack
in the United States housing market during the summer of 2007 began widening during 2008
into deeper fissures across the global financial landscape and ended with the collapse of major
banking institutions, precipitous falls on stock markets across the world and a credit freeze.‛13
It most likely began with the developed economies and then spread to the developing
economies which as mentioned in the UN report, ‚developing economies would be hurt more
through a deeper recession in the developed economies, a steeper fall in commodity prices and
a sharper reversal of capital inflows.‛14
The Global Growth Slowdown
For the past four years the average annual global real GDP growth was greater than 4.5 percent,
but recent data has shown that global growth has slowed in the major industrial countries with
the United States economy in an outright ‚recession‛. The slowdown in global growth kicked
in by the summer of 2007 and continued through the second half of 2008. Any recovery during
2009 will only be gradual.15 According to the United Nations baseline forecast, World Gross
Product (WGP) is expected to slow to 1.0 per cent rate of growth in 2009, a sharp deceleration
from the 2.5 per cent growth estimated for 2008 and well below the more robust growth of
previous years. The baseline forecast assumes that it will take six to nine months for financial
markets in developed countries to return to normalcy, assuming central banks in the United
States, Europe, and Japan provide further monetary stimulus from the end of 2008 and on into
2009.16
13 United Nations. World Economic Situation and Prospects 2009 - Global Outlook 2009. New York:
United Nations, 2009. 14 Ibid 15 Peterson Institute for International Economics. Global Economic Prospects 2008/2009: Hoping for a
Global Slowdown and a US Rescission, (April 2008). 16 United Nations. World Economic Situation and Prospects 2009 - Global Outlook 2009. New York:
United Nations, 2009.

41
Is the United States in Recession?
Based on the definition of recession, the United States is not in a ‚classical recession‛. A
recession has been traditionally defined as two consecutive quarters of economic contraction.
However, the definition by U.S National Bureau of Economic Research (NBER) is broader. It
defines a recession as ‚a significant decline in economic activity spread across the economy,
lasting more than a few months, normally visible in real GDP, real income, employment,
industrial production and wholesale-retail sales.‛ Many economists believe that the United
States is in recession, and the definition should be redefined. However, whether the United
States is in recession or not, the consequences for the global economy have begun. ‚Various
overseas economies are struggling in the global recession, largely due to less demand for their
products in the U.S. and other western nations. Reuters has reported that factory production in
China, Russia, and India has fallen dramatically in recent months. Factories in India are also
said to be cutting jobs, while Russia’s manufacturing drop is worse than it experienced during
the 1998 financial crisis. Also, South Korea is expecting its weakest growth since the beginning
of the decade, while Singapore’s economy could shrink up to two percent in 2009‛.17
‚Yet with the official announcement on December 1st 2008 that America had entered recession
last December, the traditional explanation for recessions is wearing awfully thin. Though it may
end up as one of the longest recessions, if not the longest, of the post-war era, the current
episode still seems to have more in common with the mild downturns of 1990-91 and 2001 than
the more wrenching affairs that came before. Although the recession has not yet been much
deeper than its predecessors, it almost certainly will be by the time it is over. Many economists
expect the recession to continue until mid-2009, which would be longer than those of 1973-75
and 1981-82. Moreover, employment is likely to keep falling after the official end of the
recession.‛18
According to the UN report, World Economic Situation and Prospects 2009, the ‚most developed
economies entered into recession during the second half of 2008, and the economic slowdown
has spread to developing countries and the economies in transition. In a more pessimistic
scenario, both the fire sale of financial assets and the credit crunch would last longer, while
monetary stimulus would prove ineffective in the short run and fiscal stimulus would turn out
to be too little, too late. This would then lead to worldwide recession in 2009, with global output
falling by 0.4 per cent, and postpone recovery to, at best, the following year. In a more
optimistic scenario, a large-scale fiscal stimulus coordinated among major economies would
stave off the worst of the crisis, yet, for the reasons indicated, it would not prevent a significant
slowdown of the global economy in 2009.‛19
17 U.S. recession impacting global economy. <http://www.nasdaq.com/newscontent/20090102/U.S.-
recession-impacting-global-economy.aspx?storyid=18953475> 18 The Economist. A thoroughly modern recession. The current recession fits the pattern of recent ones –
but is likely to last longer. Washington, DC (Dec. 4th 2008).
<http://www.theelectroniceconomist.com/world/unitedstates/displaystory.cfm?story_id=12725124> 19 United Nations. World Economic Situation and Prospects 2009 - Global Outlook 2009. New York:
United Nations, 2009.

42
What Has Caused the Recession?
‚This is another staunchly debated topic, but the general consensus is that it was primarily
caused by the actions taken to control the money supply in the economy. The Federal Reserve
is responsible for maintaining an ideal balance between money supply, interest rates, and
inflation. When the Fed loses balance in this equation, the economy can spiral out of control,
forcing it to correct itself. This is precisely what we have seen in 2007, where the Fed’s
monetary policy of injecting tremendous amounts of money supply into the money market has
kept interest rates lower while inflation continues to rise. This coupled with relaxed policies in
lending practices making it easy to borrow money; the economic activity became unsustainable
resulting in the economy coming to a near halt. It is also said that recession can be caused by
factors that stunt short term growth in the economy, such as spiking oil prices or war.‛20
The Credit Crunch
‚The main message is not to think of the credit problems over the past year as a one-time event,
that once resolved will immediately place the economy back into high growth mode. Relatively
short-lived shocks can have longer lasting effects. The credit problems of today can act as a
financial accelerator whereby a shock is amplified or becomes long lasting by restricting firms
through swings in their balance sheets and spending intentions.‛21
‚The steps to 2007/08 credit crunch:
U.S. mortgage lenders sell many inappropriate mortgages to customers with low income
and poor credit.
There was an incentive to sell mortgages even though they were too expensive and
highly likely to default.
To sell more profitable subprime mortgages, mortgage companies borrowed to be able
to lend mortgages.
These mortgage debts were bought by financial intermediaries. The idea was to spread
the risk, but it actually just spread the problem.
The rating agencies gave these risky subprime mortgages a low risk rating. Therefore,
the financial system denied the extent of risk in their balance sheets.
Many of these mortgages had an introductory period of 1-2 years of very low interest
rates. At the end of this period, interest rates increased.
In 2007, the United States had to increase interest rates because of inflation. This made
mortgage payments, more expensive. Furthermore, many home owners who had taken
out mortgages two years earlier now faced ballooning mortgage payments as their
introductory period ended.
This caused a rise in mortgage defaults, as many new homeowners could not afford
mortgage payments. These defaults also signaled the end of the United States housing
boom.
20 <http://recession.org/definition> 21 TD Economics. TD Quarterly Economic Forecast 2008
43
The number of defaults caused many medium sized United States mortgage companies
to go bankrupt.
The result was that worldwide, it became very difficult to raise funds and borrow
money as the markets ‚dried up‛.
This affected many firms who had been exposed to the subprime lending. It also affected
a wide variety of firms who now have difficulty borrowing money.
The slowdown in borrowing has contributed to a slowing economy with the recession in
the United States.‛22
Decline of the American Dollar
‚The decline in the value of the dollar appears to have had a positive impact. Real imports have
declined and real export growth had accelerated. Moreover, the current account deficit has
begun to improve.‛23 A contrasting option stated that although ‚many think that a declining
currency will fix America’s export problem, they are wrong. The weak currency will not face
the fact that America is consuming far more than Americans produce. It actually could make
the economy much worse. A declining dollar decreases the net-worth of every citizen who
holds it and threatens America’s status as the world’s reserve currency. Once the status as
reserve currency is gone, America will no longer be able to afford the outstanding national and
current account deficits. America’s trade imbalance solution is not a declining dollar.‛24
Fuel Prices
‚The immediate cause of rising oil prices is the weak dollar. Oil-producing countries are
requiring more dollars to purchase the same barrel of oil because the dollar is worth less today
than it was years ago. Rapidly rising oil prices have a number of direct and indirect negative
influences on the U.S. economy. In direct terms, consumers will spend $90 million more on
discretionary spending.‛25
The high oil prices did not just stress American consumers, as reported in North American
Economic Outlook (prepared by MFC Global Investment Management in fall 2008) ‚In contrast,
Canada is a net energy exporter, making the rise in energy prices a boon for a large sector in
Canada’s economy.‛26
22 Credit Crunch Explained <http://www.mortgageguideuk.co.uk/blog/debt/credit-crunch-explained/> 23 Deloitte Research. Global Economic Outlook 2008 24 Economy In Crisis. Low Dollar: Not The Solution to Trade Deficit. 2007
< http://www.economyincrisis.org/articles/show/1159> 25Martin Frost. 2008 <http://www.politico.com/news/stories/0608/10940.html> 26 North American Economic Outlook Fall 2008 MFC Global Investment Management

44
Oil has witnessed a significant fall since July 2008 (almost $150 per/barrel). In early
December’08, oil was trading around $40 US a barrel. By the end of the month the price has
declined to $35 US a barrel.27 ‚On Dec.9, 2008, the U.S. Energy Information Administration
predicted that global demand for oil would fall through 2009, marking the longest contraction
in demand since the oil crisis of the 1970s.‛28 ‚International research firm CapGemini issued a
report on Nov. 24 2008, warning that low oil prices could mean trouble. The report suggested:
Low oil prices will render expensive projects no longer financially viable. This includes
the development of the Alberta oil sands
Cheap oil makes the development of renewable energy sources too expensive to be
worth the investment‛29
In its most recent world energy outlook, the International Energy Agency predicted that global
demand for energy would increase annually by 1.6 per cent until 2030, (about a 45 per cent total
increase from today’s demand). The agency notes that while there’s enough oil underground to
meet the demand, the supply in existing oil fields is declining too quickly to support the
demand. That means a lot more money will have to be devoted to oil exploration and
extraction. Merrill Lynch recently predicted that oil could fall as low as $25 per barrel, if the
recession is as deep or as long as some forecasters fear. That will spell trouble for oil-producing
provinces like Alberta and Newfoundland and Labrador. ‚If oil prices continue at below $60
US per barrel, we could be facing a deficit of several hundred million dollars next year and
could potentially be facing deficits in the years to come.‛ 30
Global Economics Imbalance
A July 2008 report produced by the Global Economic Research Division of the Scotiabank
Group suggested that ‚there is a significant risk that prolonged weak and unbalanced global
growth will heighten friction over trade and foreign direct investment, the principal sources of
global locomotion over the past two decades.‛31 A Deloitte Research study has examined how
the economic imbalance between the United States and China contributed to the housing bubble
in the North America. The bursting of the housing bubble is having important consequences for
the global economy. Among other things it was due to the imbalance that the global economy is
headed towards a recession in 2009.
27The Wall Street Journal. Oil Prices Slide Near Four-Year Low, 2008 28 Cheaper crude: who wins, who doesn’t
<http://www.cbc.ca/consumer/story/2008/12/09/f-oildecline.html> 29 Ibid 30 Ibid 31 Scotiabank. Global Economic Research Scotiabank Group, (July 2008)
45
Inflation
‚Inflation is one of the manifestations of the global crisis, and arises from changes in the
relationship between the volume of commodities and of money in the economy.‛32 Inflation is
driven by record high oil and food prices. Additional factors putting pressure on inflation
included excess capacity utilization and higher wages. In addition, many countries faced the
dilemma of choosing between controlling inflation or stimulating the economy through looser
monetary and fiscal policies. In the baseline outlook for 2009, inflation is expected to slow as
aggregate demand will continue to weak.33
Canada/America Economic Relationship
The Canadian economy’s competitiveness is directly linked to the strength of the relationship
with its closest and largest trading partner, the United States. Weaker American growth and
tighter credit limits have resulted in Canada’s economy falling into a recession. Economic
forecasts have projected zero growth during 2009. Even the most optimistic economic forecasts
predict that in general, Canadians will became poorer in 2009, and as many as 200,000 workers
will lose their jobs as the economic recession deepens.
Strong Domestic Demand and the Weaker Export Market
Canada is a developed nation that is highly dependent on international trade. The U.S.
economic downturn and slowdown has slowed the global economy and has reduced both the
demand and prices of Canadian commodities. The largest drag to real economic growth is a
continued weakness in the Canadian export sector, which accounts for approximately 40% of
the real economy.
Employment Growth
The sharp American slowdown constitutes further economic risks for Canada. The number of
Canadians who lost their jobs in December 2008 was more severe than analysts has expected.
As the recession deepens the Canadian unemployment rate is likely to increase.
32 Vasily Koltashov. 2008. Institute of Globalization and Social Movement. The Crisis of the global
economy. Moscow <http://www.metamute.org/en/the_crisis_of_the_global_economy> 33 United Nations. World Economic Situation and Prospects 2008 - Global Outlook 2008. New York:
United Nations, 2008.

46
Manitoba Economic Situation
Manitoba’s major industries include manufacturing, transportation, agriculture, hydro-
electricity, minerals, finance, and trade. It has recorded the most stable provincial economy in
Canada over the last decade. The Government of Manitoba’s most recent speech from the
throne outlined the provincial response to the growing global financial crisis by committing to
balance this year’s budget, while continuing to reduce personal, corporate, and small business
taxes. Initiatives to boost skills training and an investment of $4.7 billion in provincial
infrastructure over four years have been implemented in an effort to strengthen and grow the
economy and better position the province once stability returns to the world economy.
Although provincial growth is forecasted to slow across Canada, Manitoba’s economy is
forecasted to grow in 2009. Indicators suggest that Manitoba is well positioned to weather the
impacts of a global economic slowdown.
According to Statistics Canada, Manitoba is one of only three provinces that have generated 15
consecutive years of positive employment growth. Among these, Manitoba’s employment
growth has been the most consistent. Manitoba is also unique among provinces with 18
consecutive years of private investment growth. Manitoba’s geographic location has been an
important element in developing a diverse economy. Its economic stability is also rooted in its
relatively large service sector. The service sector tends to be more stable through the business
cycle relative to the goods-producing sector. In the last four years, no service industry in
Manitoba has posted any real decline.34
34 Manitoba Finance: Budget Paper A. The Economy (2008)
47
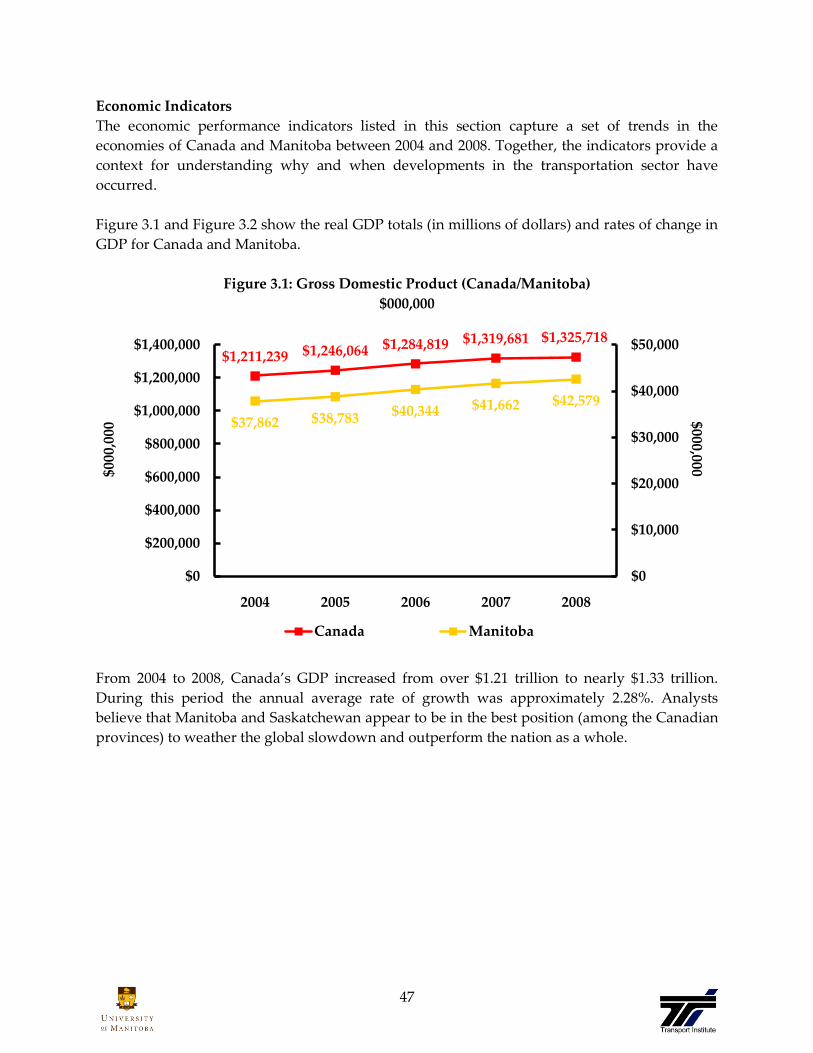
Economic Indicators
The economic performance indicators listed in this section capture a set of trends in the
economies of Canada and Manitoba between 2004 and 2008. Together, the indicators provide a
context for understanding why and when developments in the transportation sector have
occurred.
Figure 3.1 and Figure 3.2 show the real GDP totals (in millions of dollars) and rates of change in
GDP for Canada and Manitoba.
Figure 3.1: Gross Domestic Product (Canada/Manitoba)
$000,000
From 2004 to 2008, Canada’s GDP increased from over $1.21 trillion to nearly $1.33 trillion.
During this period the annual average rate of growth was approximately 2.28%. Analysts
believe that Manitoba and Saskatchewan appear to be in the best position (among the Canadian
provinces) to weather the global slowdown and outperform the nation as a whole.
$1,211,239 $1,246,064 $1,284,819 $1,319,681 $1,325,718
$37,862 $38,783 $40,344 $41,662 $42,579
$0
$10,000
$20,000
$30,000
$40,000
$50,000
$0
$200,000
$400,000
$600,000
$800,000
$1,000,000
$1,200,000
$1,400,000
2004 2005 2006 2007 2008
$000,000$0
00,0
00
Canada Manitoba

48
Figure 3.2 displays annual changes in the GDP growth rate. During the years of 2004 to 2007
national level of growth has fluctuated while the provincial growth has maintained a steady
overall increase, and in 2008 the rate of growth has dropped.
Figure 3.2: Change in GDP (Canada/Manitoba)
Economic indicators released in early 2008 confirm that the U.S. economy is indeed slowing.
Serious economic weakness in the U.S. has a negative impact on the Canadian economy as a
weaker export sector has spilled over into the non-export components of the Canadian
economy.35 Canadian GDP growth has seen a significant decline from 2007 to 2008, from 2.7% to
0.5%. Meanwhile Manitoba’s economic performance in the last three years has been
exceptionally strong. The GDP growth of Manitoba for the years of 2006 to 2008 has
outperformed the national average. Manitoba real GDP grew by 3.3% in 2007 above the
Canadian growth of 2.7%, and grew 2.2% in 2008 above Canadian growth 0.5%. In 2009,
Manitoba’s economy is expected to grow by 1.9%, above the Canadian growth of 0.8%.36
35 Manitoba Finance: Budget Paper A. The Economy (2008) 36 Manitoba Economic Highlights, 2008
3.1%2.9%
3.1%
2.7%
0.5%
2.2%2.4%
4.0%
3.3%
2.2%
0.0%
0.5%
1.0%
1.5%
2.0%
2.5%
3.0%
3.5%
4.0%
4.5%
2004 2005 2006 2007 2008
% C
han
ge
Canada Manitoba
49
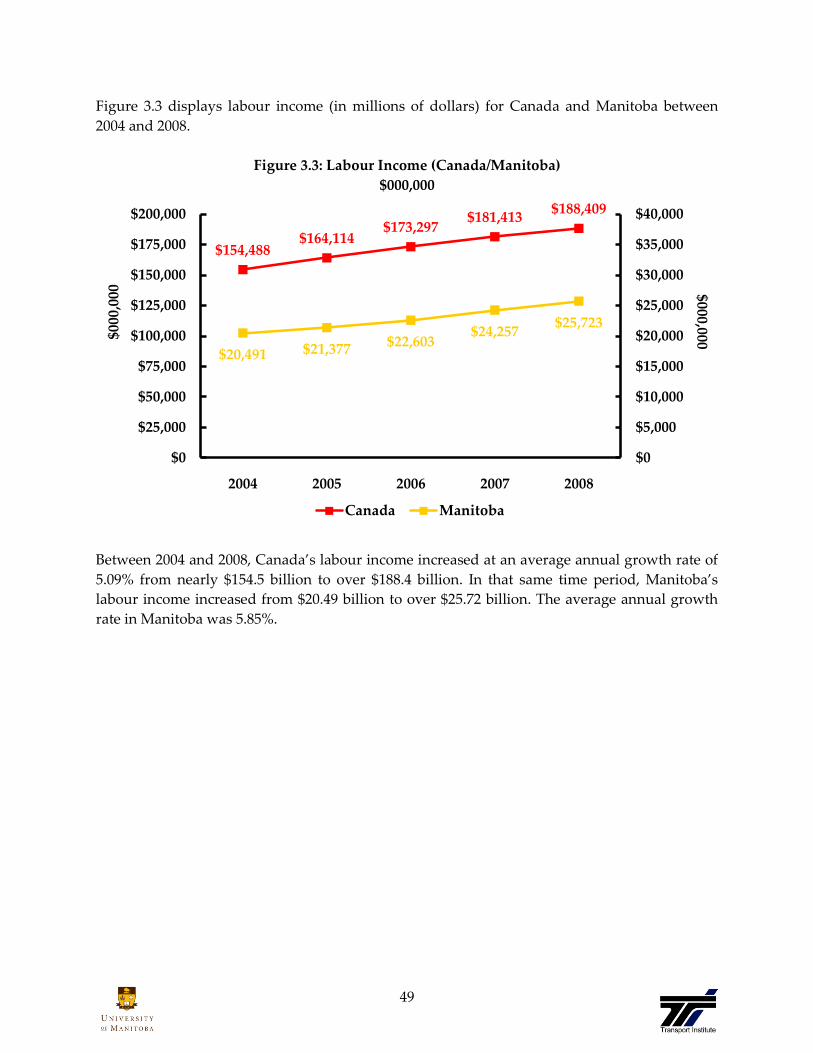
Figure 3.3 displays labour income (in millions of dollars) for Canada and Manitoba between
2004 and 2008.
Figure 3.3: Labour Income (Canada/Manitoba)
$000,000
Between 2004 and 2008, Canada’s labour income increased at an average annual growth rate of
5.09% from nearly $154.5 billion to over $188.4 billion. In that same time period, Manitoba’s
labour income increased from $20.49 billion to over $25.72 billion. The average annual growth
rate in Manitoba was 5.85%.
$154,488$164,114
$173,297$181,413
$188,409
$20,491 $21,377$22,603
$24,257$25,723
$0
$5,000
$10,000
$15,000
$20,000
$25,000
$30,000
$35,000
$40,000
$0
$25,000
$50,000
$75,000
$100,000
$125,000
$150,000
$175,000
$200,000
2004 2005 2006 2007 2008
$000,000$000
,000
Canada Manitoba
50
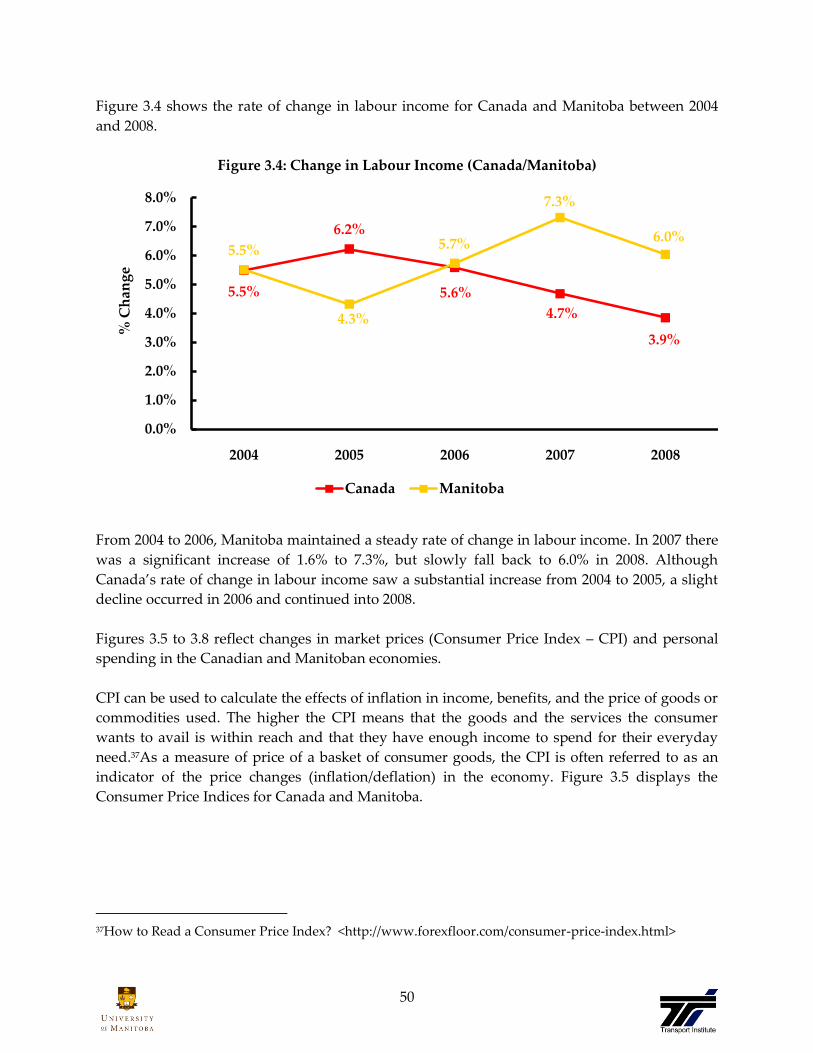
Figure 3.4 shows the rate of change in labour income for Canada and Manitoba between 2004
and 2008.
Figure 3.4: Change in Labour Income (Canada/Manitoba)
From 2004 to 2006, Manitoba maintained a steady rate of change in labour income. In 2007 there
was a significant increase of 1.6% to 7.3%, but slowly fall back to 6.0% in 2008. Although
Canada’s rate of change in labour income saw a substantial increase from 2004 to 2005, a slight
decline occurred in 2006 and continued into 2008.
Figures 3.5 to 3.8 reflect changes in market prices (Consumer Price Index – CPI) and personal
spending in the Canadian and Manitoban economies.
CPI can be used to calculate the effects of inflation in income, benefits, and the price of goods or
commodities used. The higher the CPI means that the goods and the services the consumer
wants to avail is within reach and that they have enough income to spend for their everyday
need.37As a measure of price of a basket of consumer goods, the CPI is often referred to as an
indicator of the price changes (inflation/deflation) in the economy. Figure 3.5 displays the
Consumer Price Indices for Canada and Manitoba.
37How to Read a Consumer Price Index? <http://www.forexfloor.com/consumer-price-index.html>
5.5%
6.2%
5.6%
4.7%
3.9%
5.5%
4.3%
5.7%
7.3%
6.0%
0.0%
1.0%
2.0%
3.0%
4.0%
5.0%
6.0%
7.0%
8.0%
2004 2005 2006 2007 2008
% C
han
ge
Canada Manitoba

51
Figure 3.5: Consumer Price Index (Canada/Manitoba)
Between 2004 and 2008, the CPI for the Canadian economy increased from 124.6 to 135.8.
During this period the average annual growth rate was 2.18%. The CPI for Manitoba also
increased in the same time period from 127.8 to 139.6, with the average annual rate 2.23% per
year.
124.6127.3
129.9132.7
135.8127.8
131.2133.7
136.5139.6
100
110
120
130
140
2004 2005 2006 2007 2008
Ind
ex P
oin
ts
Canada Manitoba
52
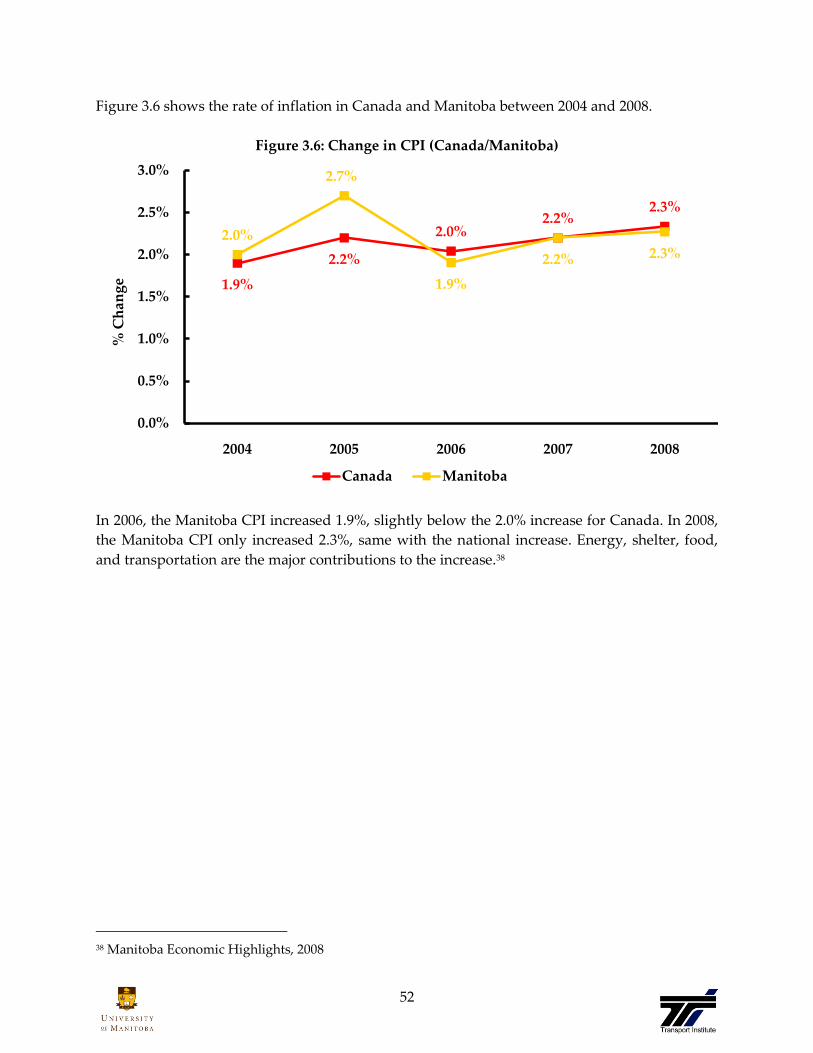
Figure 3.6 shows the rate of inflation in Canada and Manitoba between 2004 and 2008.
Figure 3.6: Change in CPI (Canada/Manitoba)
In 2006, the Manitoba CPI increased 1.9%, slightly below the 2.0% increase for Canada. In 2008,
the Manitoba CPI only increased 2.3%, same with the national increase. Energy, shelter, food,
and transportation are the major contributions to the increase.38
38 Manitoba Economic Highlights, 2008
1.9%
2.2%
2.0%2.2%
2.3%
2.0%
2.7%
1.9%
2.2% 2.3%
0.0%
0.5%
1.0%
1.5%
2.0%
2.5%
3.0%
2004 2005 2006 2007 2008
% C
han
ge
Canada Manitoba

53
Figure 3.7 displays the changing value of personal expenditures in the Canadian and Manitoba
economies. Personal expenditures represent the portion of GDP that is contributed by the
consumption of consumer goods and services. These goods and services are meant to reflect
household expenditures.
Figure 3.7: Personal Expenditures (Canada/Manitoba)
$000,000
Canada’s personal expenditures increased to over $811 billion in 2008, an increase of over $23
billion from 2007. Between the years of 2004 to 2008 the average annual growth rate was 3.86%.
Manitoba’s personal expenditures increased to nearly $27.4 billion in 2008 from $23.6 billion in
2004 representing an annual average growth rate of 3.85%. Consumer spending will remain
firm as long as commodity prices don’t ‚fall through the floor‛.39
39 MFC Global Investment Management. North American Economic Outlook. (Fall 2008)
$697,566$723,181
$754,179$788,224 $811,690
$23,571$24,273
$25,063$26,311
$27,419
$10,000
$15,000
$20,000
$25,000
$30,000
$0
$100,000
$200,000
$300,000
$400,000
$500,000
$600,000
$700,000
$800,000
$900,000
2004 2005 2006 2007 2008
$000,000$0
00,0
00
Canada Manitoba

54
Figure 3.8 shows the trends in personal expenditures for Canada and Manitoba between 2004
and 2008.
Figure 3.8: Change in Personal Expenditures (Canada/Manitoba)
Canada’s rate of change in personal expenditures has slightly increased from 3.3% to 3.0% from
year of 2004 to 2008. During this same period Manitoba’s rate of change in personal
expenditures increased to 4.2% in 2008 from 3.1% in 2004. Robust income growth and a
booming labour market created a backdrop for strong domestic demand in Canada over the
past four years. It was largely expected that this wouldn’t last and that consumer spending
would slow from an unsustainable pace of 4-5%. Due to a national decrease in job creation,
income growth is expected to slow from 5.09% in 2008 to 2.5% in 2009, which will act as a
headwind to consumer spending.40
40TD Economics. TD Quarterly Economic Forecast. (2008)
3.3%3.7%
4.3%
4.5%
3.0%3.1% 3.0%3.3%
5.0%
4.2%
0.0%
1.0%
2.0%
3.0%
4.0%
5.0%
6.0%
2004 2005 2006 2007 2008
% C
han
ge
Canada Manitoba

55
Figure 3.9 presents the number of housing starts in Canada and Manitoba between 2004 and
2008. The housing sector leads the Canadian and Manitoban economies.
Figure 3.9: Housing Starts (Canada/Manitoba)
000’s
In 2008 the number of Canadian housing starts declined to 845.300 from 911,000 in 2007 (a
change of approximately -0.7%). Despite fluctuations in the level of national housing starts
between the year of 2004 to 2008, Canada has a negative average annual growth rate of -2.38%.
The Manitoba housing market strengthened further in 2007 as housing starts achieved a two-
decade high and resale activity accelerated. Housing starts for Manitoba increased from 17,500
to 22,300 during the period of 2004 and 2008, resulting in an average annual growth rate of
6.25%.
930.7896.3 916.5
911.0845.3
17.518.8
20.2
23.0 22.3
0
5
10
15
20
25
0
200
400
600
800
1000
2004 2005 2006 2007 2008
000's000'
s
Canada Manitoba

56
Figure 3.10 shows the rate of change in housing starts in Canada and Manitoba between 2004
and 2008.
Figure 3.10: Change in Housing Starts (Canada/Manitoba)
Growth in Canada’s housing starts diminished with a negative growth rates of -3.7% in 2005,
the Canadian market recovered slightly with an of 2.3% in 2006, but recovered another negative
growth rate of -0.6% in 2007, in 2008 it dropped to -7.2% . Compared to Canadian housing
starts, Manitoban housing starts appear to be stable. From 2004 to 2007 the Manitoban level of
growth has increased annually from 5.4% to 13.9%. In 2008 the growth rate of housing starts in
Manitoba has declined to -3.0%.
6.0%
-3.7%
2.3%
-0.6%-7.2%
5.4%
7.4% 7.4%
13.9%
-3.0%
-10.0%
0.0%
10.0%
20.0%
2004 2005 2006 2007 2008
% C
han
ge
Canada Manitoba

57
Figure 3.11 displays the unemployment rate in Canada and Manitoba between 2004 and 2008.
Figure 3.11: Unemployment Rate (Canada/Manitoba)
Between year of 2004 to 2008, the national unemployment rate declined from 7.2% (2004) to 6.1
% (2008), an average annual rate of growth was -4.03%. In 2007 the Manitoba unemployment
rate experienced a 0.1% increase from 2006 4.4% prior to this, the province had experienced an
annual 2 year decline of approximately 0.5%. Overall, between 2004 and 2008 the
unemployment rate in Manitoba has fallen from 5.3% to 4.2%.
7.2%6.8%
6.3% 6.0% 6.1%
5.3%4.8%
4.3% 4.4% 4.2%
0.00%
2.00%
4.00%
6.00%
8.00%
10.00%
2004 2005 2006 2007 2008
% o
f L
abo
ur
Fo
rce
Canada Manitoba

58
Figure 3.12 displays the change in the unemployment rate in Canada and Manitoba between
2004 and 2008. A negative number indicates a decrease in the unemployment rate, resulting
from an increase in employment.
Figure 3.12: Change in Unemployment Rate (Canada/Manitoba)
Canada has experienced a declining unemployment rate since 2004, decreasing by -0.4% in 2004
and further reducing to -0.5% in 2006. This was followed in 2007 with another decrease of -0.3%,
increased to 0.01% in year of 2008. According to a Statistics Canada report the unemployment
rate is at its lowest level in 33 years, with over 400,000 new jobs created since the end of 2006.
The Manitoban unemployment rate has fluctuated both positively and negatively between
years of 2004 to 2008.
-0.4%
-0.5% -0.5%
-0.3%
-0.02%
0.3%
-0.4% -0.5%
0.1%0.1%
-1.00%
-0.50%
0.00%
0.50%
1.00%
2004 2005 2006 2007 2008
% o
f L
abo
ur
Fo
rce
Canada Manitoba
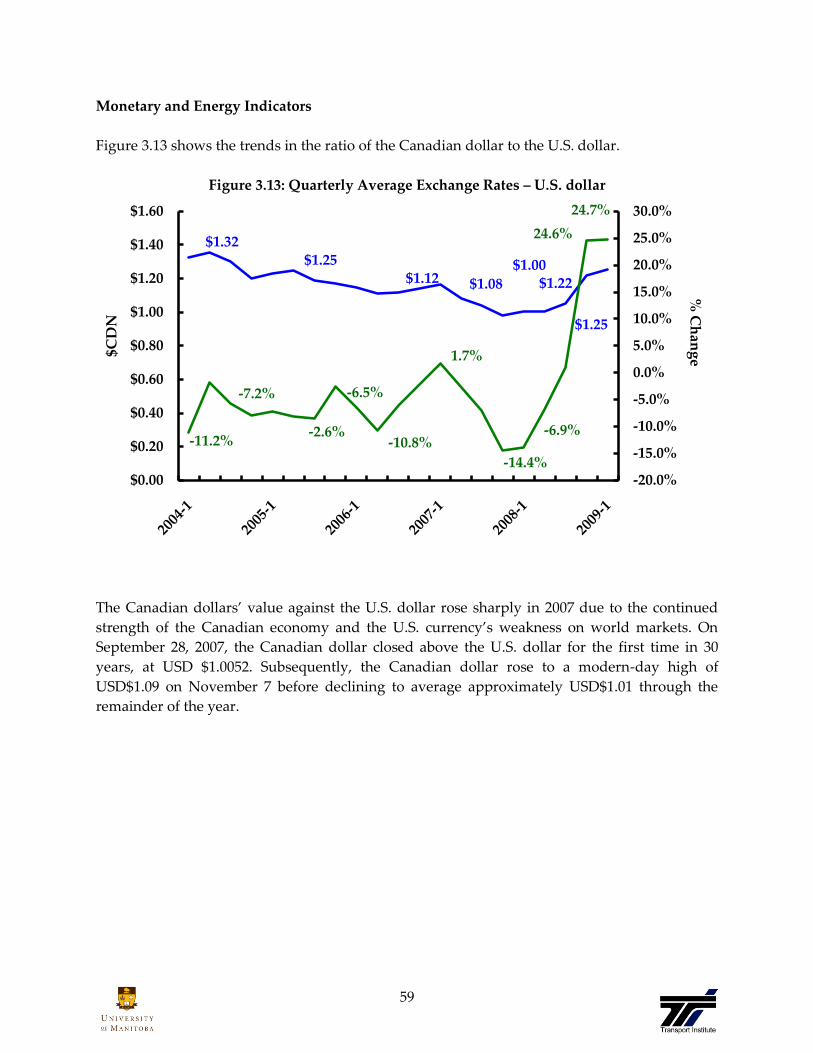
59
Monetary and Energy Indicators
Figure 3.13 shows the trends in the ratio of the Canadian dollar to the U.S. dollar.
Figure 3.13: Quarterly Average Exchange Rates – U.S. dollar
The Canadian dollars’ value against the U.S. dollar rose sharply in 2007 due to the continued
strength of the Canadian economy and the U.S. currency’s weakness on world markets. On
September 28, 2007, the Canadian dollar closed above the U.S. dollar for the first time in 30
years, at USD $1.0052. Subsequently, the Canadian dollar rose to a modern-day high of
USD$1.09 on November 7 before declining to average approximately USD$1.01 through the
remainder of the year.
$1.32$1.25
$1.12 $1.08
$1.00$1.22
$1.25
-11.2%
-7.2%
-2.6%
-6.5%
-10.8%
1.7%
-14.4%
-6.9%
24.6%
24.7%
-20.0%
-15.0%
-10.0%
-5.0%
0.0%
5.0%
10.0%
15.0%
20.0%
25.0%
30.0%
$0.00
$0.20
$0.40
$0.60
$0.80
$1.00
$1.20
$1.40
$1.60
% C
han
ge$C
DN

60
Figure 3.14 displays the year to year trends in quarterly average Bank of Canada interest rates.
Figure 3.14: Quarterly Average Interest Rates (Bank of Canada Rate)
Between the first quarter of 2004 and the first quarter of 2009, interest rates stayed between the
2.67% to 1.08% range. Since the middle of 2007, the central bank has adjusted interest rates from
4.5% to 1.0% making the Canadian dollar the fourth lowest yielding G10 currency. The Bank of
Canada cut interest rates to 1.00%, the lowest level ever for the 75 year old central bank, and
signaled that they could reduce interest rates to American levels. The historic move was
motivated by the sharp downturn in the United States economy and the continual slide in oil
prices.
2.67%2.75%
4.42%4.50%
4.08%
3.25%
2.25%
1.08%
-13.5%
-26.3%
3.1%
21.4% 60.6%
35.0%
1.9% -9.3%
-27.8%
-51.8%
-73.5%
-100.0%
-80.0%
-60.0%
-40.0%
-20.0%
0.0%
20.0%
40.0%
60.0%
80.0%
0.00%
1.00%
2.00%
3.00%
4.00%
5.00%
% C
han
ge
Inte
rest
Rat
e %

61
The S&P/TSX Composite Index is an index of stock prices for the largest companies on the
Toronto Stock Exchange as measured by market capitalization. The S&P/TSX Composite Index
accounts for approximately 70% of market capitalization for all Canadian based companies
listed on the TSX. The size and extensive economic sector coverage of the S&P/TSX Index has
made it the foremost indicator of market activity for Canadian equity markets.
Transportation changes in the S&P/TSX Composite Index reflect the market view of economic
prospects. Consequently, it is a leading indicator for the economy and the transportation sector.
Figure 3.15 shows the quarterly average S&P/TSX Composite Index between 2004 and 2008.
Figure 3.15: Quarterly Average S&P/TSX Composite Index
The S&P/TSX Composite Index declined 18.2% in terms of total return for the quarter, and the
index’s 12-month return of – 14.4% at quarter end (September 2008). Small cap stocks fared
poorly and, for the same 3 and 12-month periods, the S&P/TSX Small Cap Total Return Index
fell 25.2% and 29.2%, respectively. Resource stocks contributed the most to the Composite’s
decline, as the materials and energy sectors fell 33.6% and 26.9%, respectively, in response to
declining commodity prices. Only one of the ten S&P/TSX Global Industry Classification
Standard sectors recorded a gain. Oddly enough, it was Financials that advanced, rising 2.6%
on a 5.6% increase by Canadian banks.41
41 MFC Global Investment Management. Global Intelligence (2008)
8631.94
9049.22
11914.86
13081.5513362.64
9340.36
8512.77
33.0%
10.0%
25.9%
25.5%
9.8%
10.9%
2.1%
-6.0%
-33.5%
-36.3%-40.0%
-30.0%
-20.0%
-10.0%
0.0%
10.0%
20.0%
30.0%
40.0%
0.00
2000.00
4000.00
6000.00
8000.00
10000.00
12000.00
14000.00
16000.00
% C
han
ge
Ind
ex P
oin
ts
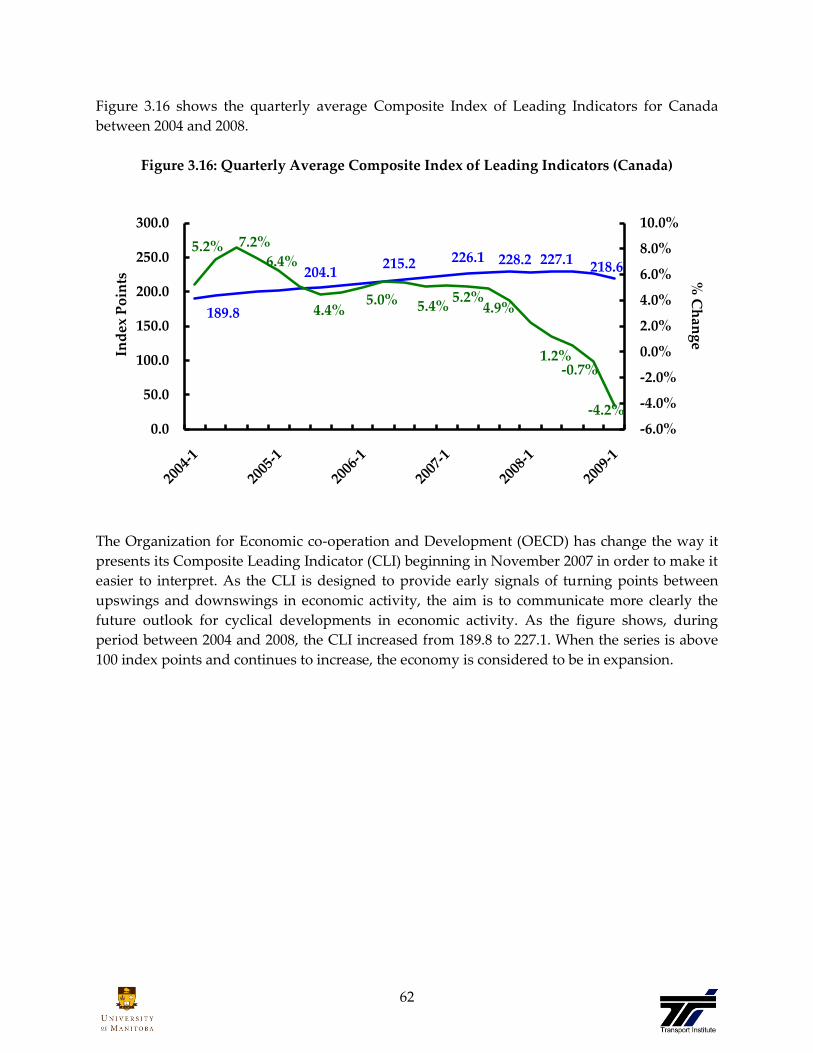
62
Figure 3.16 shows the quarterly average Composite Index of Leading Indicators for Canada
between 2004 and 2008.
Figure 3.16: Quarterly Average Composite Index of Leading Indicators (Canada)
The Organization for Economic co-operation and Development (OECD) has change the way it
presents its Composite Leading Indicator (CLI) beginning in November 2007 in order to make it
easier to interpret. As the CLI is designed to provide early signals of turning points between
upswings and downswings in economic activity, the aim is to communicate more clearly the
future outlook for cyclical developments in economic activity. As the figure shows, during
period between 2004 and 2008, the CLI increased from 189.8 to 227.1. When the series is above
100 index points and continues to increase, the economy is considered to be in expansion.
189.8
204.1215.2 226.1 228.2 227.1
218.6
5.2% 7.2%
6.4%
4.4%5.0% 5.4%
5.2%4.9%
1.2%-0.7%
-4.2%
-6.0%
-4.0%
-2.0%
0.0%
2.0%
4.0%
6.0%
8.0%
10.0%
0.0
50.0
100.0
150.0
200.0
250.0
300.0
% C
han
ge
Ind
ex P
oin
ts

63
Figure 3.17 displays the average annual composite leading indicator between 2004 and 2008 for
Canada, Germany, Japan, the United States., and the United Kingdom. All five of these OECD
member countries experienced gradual gains in their composite leading indicator. Japan
declined between 2006 & 2007 and overall since 2003.
Figure 3.17: Average Annual Composite Leading Indicator – Canada to Traditional
‚Developed‛ Economies
Canada has the lowest growth rate between the years of 2004 to 2007 among the developed
countries listed. Canada’s leading indicator became to the lowest since 2004. Between 2004 and
2008, Canada’s average annual composite leading indicator decreased from 100.7 to 98.5, while
the United States increased from 101.2 to 97.9.
100.7
98.5
101.2
97.9
100.8
98.9
101.8
98.7
100.9
99.5
95
100
105
2004 2005 2006 2007 2008
Ind
ex P
oin
ts
Canada United States Germany Japan United Kingdom
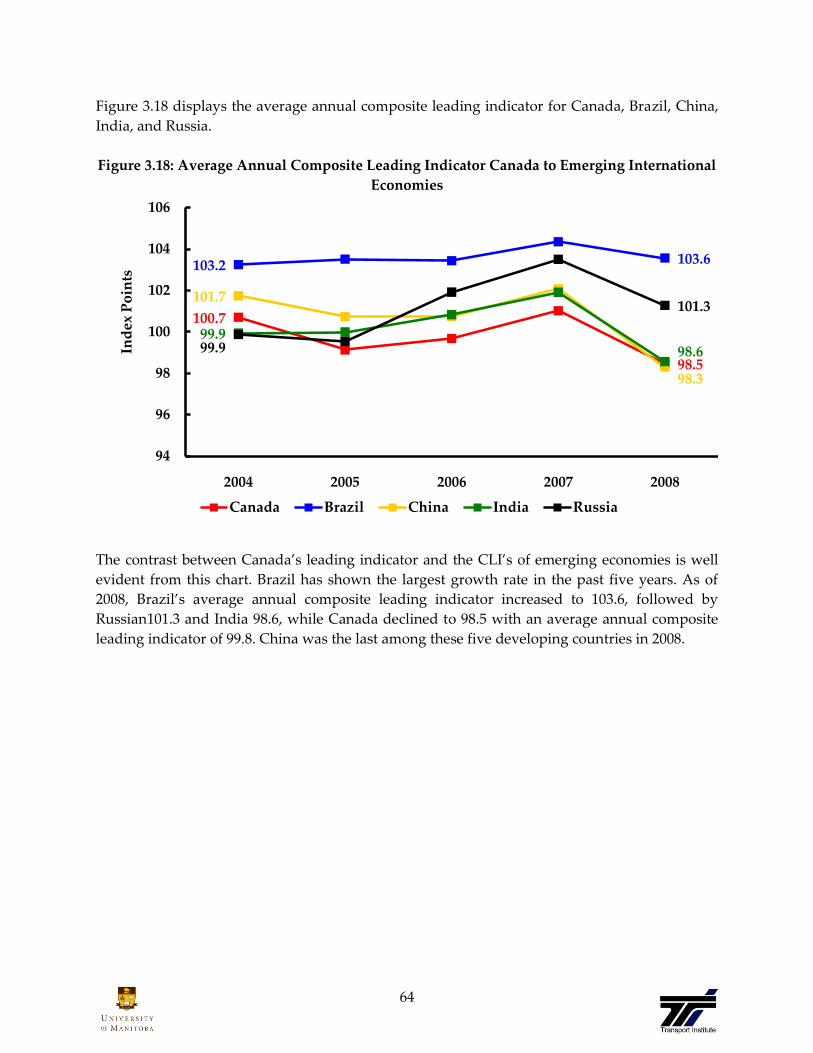
64
Figure 3.18 displays the average annual composite leading indicator for Canada, Brazil, China,
India, and Russia.
Figure 3.18: Average Annual Composite Leading Indicator Canada to Emerging International
Economies
The contrast between Canada’s leading indicator and the CLI’s of emerging economies is well
evident from this chart. Brazil has shown the largest growth rate in the past five years. As of
2008, Brazil’s average annual composite leading indicator increased to 103.6, followed by
Russian101.3 and India 98.6, while Canada declined to 98.5 with an average annual composite
leading indicator of 99.8. China was the last among these five developing countries in 2008.
100.7
98.5
103.2 103.6
101.7
98.3
99.998.699.9
101.3
94
96
98
100
102
104
106
2004 2005 2006 2007 2008
Ind
ex P
oin
ts
Canada Brazil China India Russia
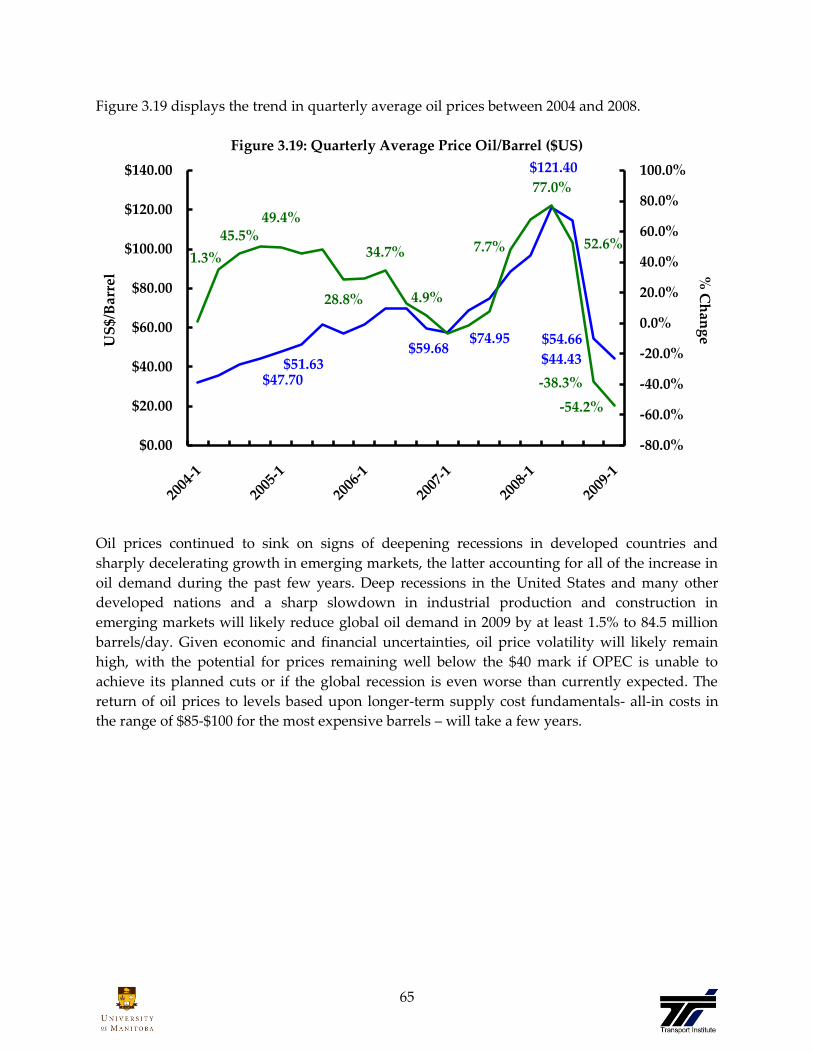
65
Figure 3.19 displays the trend in quarterly average oil prices between 2004 and 2008.
Figure 3.19: Quarterly Average Price Oil/Barrel ($US)
Oil prices continued to sink on signs of deepening recessions in developed countries and
sharply decelerating growth in emerging markets, the latter accounting for all of the increase in
oil demand during the past few years. Deep recessions in the United States and many other
developed nations and a sharp slowdown in industrial production and construction in
emerging markets will likely reduce global oil demand in 2009 by at least 1.5% to 84.5 million
barrels/day. Given economic and financial uncertainties, oil price volatility will likely remain
high, with the potential for prices remaining well below the $40 mark if OPEC is unable to
achieve its planned cuts or if the global recession is even worse than currently expected. The
return of oil prices to levels based upon longer-term supply cost fundamentals- all-in costs in
the range of $85-$100 for the most expensive barrels – will take a few years.
$47.70 $51.63
$59.68 $74.95
$121.40
$54.66
$44.43
1.3%
45.5%49.4%
28.8%
34.7%
4.9%
7.7%
77.0%
52.6%
-38.3%
-54.2%
-80.0%
-60.0%
-40.0%
-20.0%
0.0%
20.0%
40.0%
60.0%
80.0%
100.0%
$0.00
$20.00
$40.00
$60.00
$80.00
$100.00
$120.00
$140.00
% C
han
ge
US
$/B
arre
l

66
Figure 3.20: Quarterly Average Unleaded Fuel Prices (Winnipeg Region)
At the unleaded fuel prices in the Winnipeg region declined to an immediate low of $(CDN)
0.70/litre. The price of the first quarter of 2009 was $(CDN) 0.85/ litre.
At the beginning of the first quarter of 2008, fuel prices had declined to $(CDN) 1.08/litre from
$(CDN) 1.01/litre posted during the fourth quarter of 2007. The price of fuel recovered at the
second quarter of 2008 by selling $1.26/litre. This price decreased through the remainder of the
year, finishing at $(CDN) 0.98/liter at the end of 2008.
$0.70
$1.00
$1.06 $1.08
$1.34
$0.98
$0.85
-5.1%
14.2%
16.1%25.5%
9.1%
17.7%
5.7%
-5.6%
3.0%
16.7%
-3.8%
-21.6%
-30.0%
-20.0%
-10.0%
0.0%
10.0%
20.0%
30.0%
40.0%
$0.00
$0.20
$0.40
$0.60
$0.80
$1.00
$1.20
$1.40
$1.60%
Ch
ang
e$C
DN
/lit
re

67
Figure 3.21: Quarterly Average Diesel Fuel Prices (Winnipeg Region)
Diesel fuel prices in the Winnipeg region have largely followed the same trends as unleaded
fuel prices. In the first quarter of 2005, the average quarterly diesel fuel prices increased 26.6%,
and by the first quarter of 2007 the price has dropped by 19.2%. The price of diesel fuel was
listed as $(CDN) 0.84/litre at the first quarter of 2009.
$0.65
$1.01
$0.81
$0.97 $1.02
$1.35
$1.11
$0.84
-4.6%
20.9%
26.6%11.6%
5.9%
1.0%
25.2%
19.7%
43.5%
8.7%
-24.3%
-30.0%
-20.0%
-10.0%
0.0%
10.0%
20.0%
30.0%
40.0%
50.0%
$0.00
$0.20
$0.40
$0.60
$0.80
$1.00
$1.20
$1.40
$1.60
% C
han
ge
$CD
N/l
itre

68
4. Trade
Methodology
The major intent of the Manitoba Transportation Report is to convey Manitoba’s relative
position in Canada’s total international trade. Achieving this purpose requires a reliable source
of information relating to Canadian international trade. All trade information presented in
sections 4.0, 5.0, and 6.0 have been provided by Statistics Canada’s International Trade Division
(ITD), which collects annual international trade data for each Canadian province and territory.
Information provided by the ITD is primarily extracted from customs data. The dataset is
extensive and includes identifiers such as commodities traded, origins, destinations, value,
weight, and modal information. As extensive as this database is, there are inherent limitations
to this trade information requiring caveats. These will be discussed below.
Customs Based vs. Balance of Trade Statistics
All trade data presented in this section are Canada Revenue Agency based. This differs from the
second method of trade presentation; the Balance of Payment (BOP) method. The main
difference between the two models is that the data based on Customs involves the physical
movement of goods as is recorded on Customs documents. The BOP method tracks the flow of
money between Canada’s business and government agencies and the rest of the world.
Import vs. Export Data
Import statistics as collected by Customs are based on the Province of Clearance, meaning that
goods are recorded at the province in which they were cleared by Customs. This may not
coincide with the province in which these commodities were ultimately consumed. For
example, imported goods from Asia but cleared through British Columbia can possibly be
consumed in Manitoba. Customs documentation does not track the final provincial
destinations. Export statistics are recorded by Customs by Province of Departure from Canada
(the Export analogue to Imports’ Province of Clearance). Additionally, Province of Origin (the
province where that the goods were grown, extracted, or manufactured) are available for export
data. Province of Origin does not necessarily match Province of Departure. For example,
commodities that originated in Alberta could have exited through Manitoba or vice versa. The
availability of both the origin and departure data offers analysis of Export Data another level of
scrutiny not available to the analysis of Import Data. Any review of trade routing and
provinces’ use of their own and other provinces’ transportation infrastructure is
understandably limited to analysis of Export Data.
Trade by Sector
With the purpose of attempting to quantify sector based trade, the International Trade Division
has created an internal commodity-sector concordance list which allows a basic approximation
of sector trade. Caution must be taken as this is a rather simple measurement in an attempt to
quantify the relative importance of sector-based trade in Manitoba and Canada.
69
Modal Information
When using Customs-based trade statistics, there are caveats on the mode of transport for both
imports and exports.
For imports, information on the transportation mode of a commodity usually refers to the final
mode by which commodities were transported to the Canadian port of clearance and
documented by Customs. This may not always be the mode by which goods arrived at the
Canadian port of entry in the case of inland clearance.
For exports, the mode of transportation recorded represents the final mode used to carry goods
across international borders. This transportation mode may not necessarily be the same mode
used to deliver cargo within Canada, that is, trans-shipment effects are not recorded and are not
readily available. For example, some grain movements to China may not be recorded as
‚Marine‛, but rather as ‚Rail‛ or ‚Other‛.
With various data sources, each with their own limitations, sections 4.0, 5.0, 6.0, and 7.0 will
follow two main paths of analysis:
The first will focus on the content of trade, emphasizing commodity-specific
information, but also source or destination country information.
The second will focus on the movement mechanism of that trade, emphasizing modes of
movement and, logically, routing used (proxied by export data flows).
Weight Approximations
In the first paragraph of this section, weight is included in the list of identifiers in the ITD
dataset. In fact, weight was deleted as a reporting field in the customs forms (a main source of
data for the ITD analysis) in the mid 1990s. Since that time, ITD ‚splinted‛ the weight data
based upon known weight/value relationships from previous years’ data for specific HS
(Harmonized System) commodity codes. However, over time, ITD’s ‚comfort level‛ associated
with the derived weight data declined. The reasons for this shift were twofold:
New HS coded commodities entered into the dataset which lacked any historical data to
support value/weight conversions.
As some commodities’ traits evolved, the established value/weight ratios appeared less
appropriate for supporting conversions.

70
Faced with these limitations, ITD dropped commodity weight as an indicator for the 2007 data
year. To obtain the weights for 2007 there were four layers of calculation, listed in the order of
preference.
The first was the straight forward use of any weight-based unit of measure. In other
words, if the quantity was 100 and the unit was kg, it could be assumed that the weight
is 100 kg.
The second layer was the average weights per quantity of each HS06 code item derived
from the records of 2000 to 2006. This method provided how much one unit of a
particular code could be expected to weigh, which we then multiplied by the quantity of
that item.
The third layer of calculations, and the most complex one, was to find the average value
per quantity of an HS06 code item. This would provide how much one unit of an item
would cost. The 2007 value was then divided by this number and the answer multiplied
by the weight per quantity of that code item (see the second layer above).
The fourth and last layer of calculations was the average value per weight of each HS06
code item. This final method ascertained how much one dollar of a particular item was
expected to weigh which was then multiplied by the value of that item.
71
Domestic Trade & Infrastructure Utilization
Trade flows are not always connected to other nations. There is a considerable amount of
domestic trade that also occurs. This sub-section will deal with rail and road traffic flows
through Manitoba and other provinces. The statistics are from 2001 to 2006 for both modes. This
sub-section assumes that all traffic flows linearly in an East-West West-East fashion.
Export Routing and Usage of Transportation Infrastructure
Canada’s transportation infrastructure is configured to facilitate interprovincial movement as
part of the import and export process. The extreme simplification of this is found in the system
which facilitates movement of bulk goods by rail to seaports where the use of highly cost-
efficient water movement can be maximized. The St. Lawrence Seaway/Great Lakes system
allows water movement to reach to the heart of the continent. On another scale, provinces can
shift commodities through adjacent provinces in order to minimize transport through the more
challenging elements of Canada’s geography. The net effect is that there is a great divergence in
the degree to which provinces can use their own transportation infrastructure to facilitate trade
with other countries (even when the largest trading partner shares our southern border).
The series of bar charts in this subsection (Figures 4.1 through 4.7) summarize the degree to
which provinces ship their exports essentially using their own transportation infrastructure. It
should be noted that the hydroelectric and petrochemical sectors tend to use dedicated
infrastructures. Therefore, for the purposes of discussions about load on infrastructure, those
sectors (the ‚Powerline and Pipeline‛ sector) are excluded from this discussion. In essence,
these charts follow a template by which the percentage of a jurisdiction’s exports (quantified by
value or tonnage and listed beside the jurisdiction’s name in the chart label) departs Canada
from that jurisdiction’s ports. For example, 87.4% of Ontario’s $201 billion in exports leaves
Canada from Ontario’s ports (Figure 4.1). Over 3 quarters (83.9%) of New Brunswick’s $11.1
billion in exports leave Canada from New Brunswick ports, while 82.2% of British Columbia’s
$28.9 billion in exports leaves from British Columbia’s ports.
At the other end of the spectrum, less than 13% of exports from Prince Edward Island, Yukon,
or Nunavut leave Canada directly from those jurisdictions.
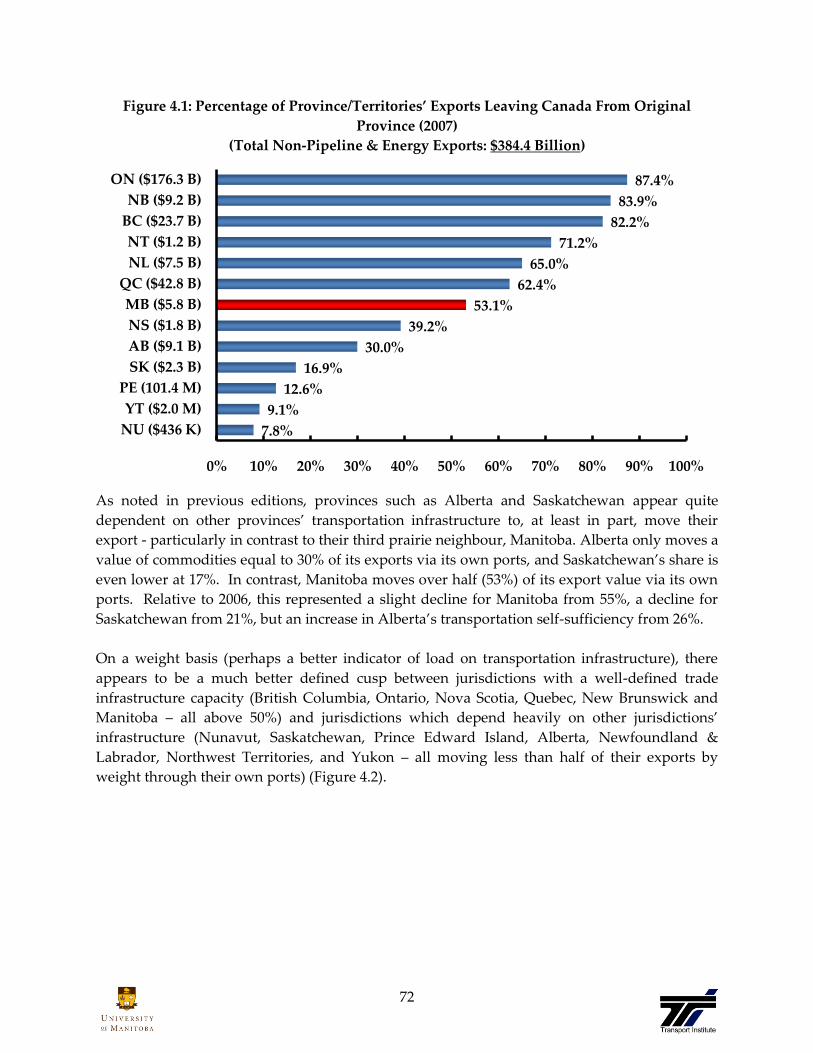
72
Figure 4.1: Percentage of Province/Territories’ Exports Leaving Canada From Original
Province (2007)
(Total Non-Pipeline & Energy Exports: $384.4 Billion)
As noted in previous editions, provinces such as Alberta and Saskatchewan appear quite
dependent on other provinces’ transportation infrastructure to, at least in part, move their
export - particularly in contrast to their third prairie neighbour, Manitoba. Alberta only moves a
value of commodities equal to 30% of its exports via its own ports, and Saskatchewan’s share is
even lower at 17%. In contrast, Manitoba moves over half (53%) of its export value via its own
ports. Relative to 2006, this represented a slight decline for Manitoba from 55%, a decline for
Saskatchewan from 21%, but an increase in Alberta’s transportation self-sufficiency from 26%.
On a weight basis (perhaps a better indicator of load on transportation infrastructure), there
appears to be a much better defined cusp between jurisdictions with a well-defined trade
infrastructure capacity (British Columbia, Ontario, Nova Scotia, Quebec, New Brunswick and
Manitoba – all above 50%) and jurisdictions which depend heavily on other jurisdictions’
infrastructure (Nunavut, Saskatchewan, Prince Edward Island, Alberta, Newfoundland &
Labrador, Northwest Territories, and Yukon – all moving less than half of their exports by
weight through their own ports) (Figure 4.2).
7.8%
9.1%
12.6%
16.9%
30.0%
39.2%
53.1%
62.4%
65.0%
71.2%
82.2%
83.9%
87.4%
0% 10% 20% 30% 40% 50% 60% 70% 80% 90% 100%
NU ($436 K)
YT ($2.0 M)
PE (101.4 M)
SK ($2.3 B)
AB ($9.1 B)
NS ($1.8 B)
MB ($5.8 B)
QC ($42.8 B)
NL ($7.5 B)
NT ($1.2 B)
BC ($23.7 B)
NB ($9.2 B)
ON ($176.3 B)
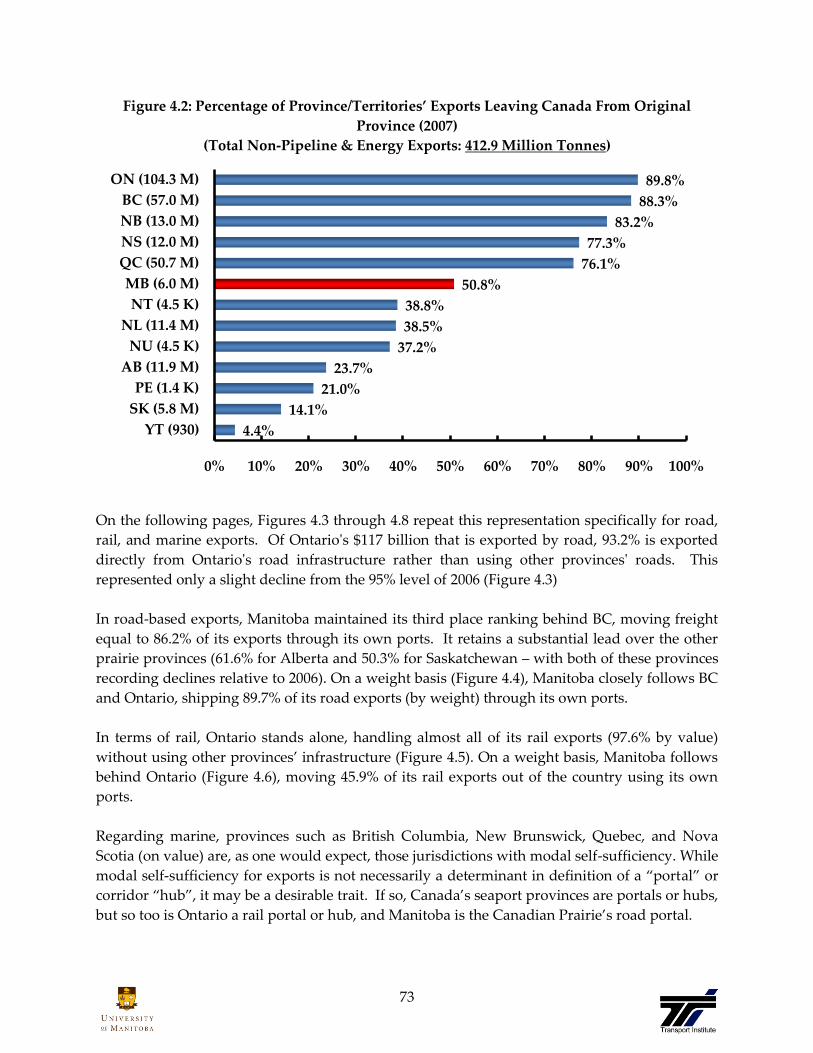
73
Figure 4.2: Percentage of Province/Territories’ Exports Leaving Canada From Original
Province (2007)
(Total Non-Pipeline & Energy Exports: 412.9 Million Tonnes)
On the following pages, Figures 4.3 through 4.8 repeat this representation specifically for road,
rail, and marine exports. Of Ontario's $117 billion that is exported by road, 93.2% is exported
directly from Ontario's road infrastructure rather than using other provinces' roads. This
represented only a slight decline from the 95% level of 2006 (Figure 4.3)
In road-based exports, Manitoba maintained its third place ranking behind BC, moving freight
equal to 86.2% of its exports through its own ports. It retains a substantial lead over the other
prairie provinces (61.6% for Alberta and 50.3% for Saskatchewan – with both of these provinces
recording declines relative to 2006). On a weight basis (Figure 4.4), Manitoba closely follows BC
and Ontario, shipping 89.7% of its road exports (by weight) through its own ports.
In terms of rail, Ontario stands alone, handling almost all of its rail exports (97.6% by value)
without using other provinces’ infrastructure (Figure 4.5). On a weight basis, Manitoba follows
behind Ontario (Figure 4.6), moving 45.9% of its rail exports out of the country using its own
ports.
Regarding marine, provinces such as British Columbia, New Brunswick, Quebec, and Nova
Scotia (on value) are, as one would expect, those jurisdictions with modal self-sufficiency. While
modal self-sufficiency for exports is not necessarily a determinant in definition of a ‚portal‛ or
corridor ‚hub‛, it may be a desirable trait. If so, Canada’s seaport provinces are portals or hubs,
but so too is Ontario a rail portal or hub, and Manitoba is the Canadian Prairie’s road portal.
4.4%
14.1%
21.0%
23.7%
37.2%
38.5%
38.8%
50.8%
76.1%
77.3%
83.2%
88.3%
89.8%
0% 10% 20% 30% 40% 50% 60% 70% 80% 90% 100%
YT (930)
SK (5.8 M)
PE (1.4 K)
AB (11.9 M)
NU (4.5 K)
NL (11.4 M)
NT (4.5 K)
MB (6.0 M)
QC (50.7 M)
NS (12.0 M)
NB (13.0 M)
BC (57.0 M)
ON (104.3 M)
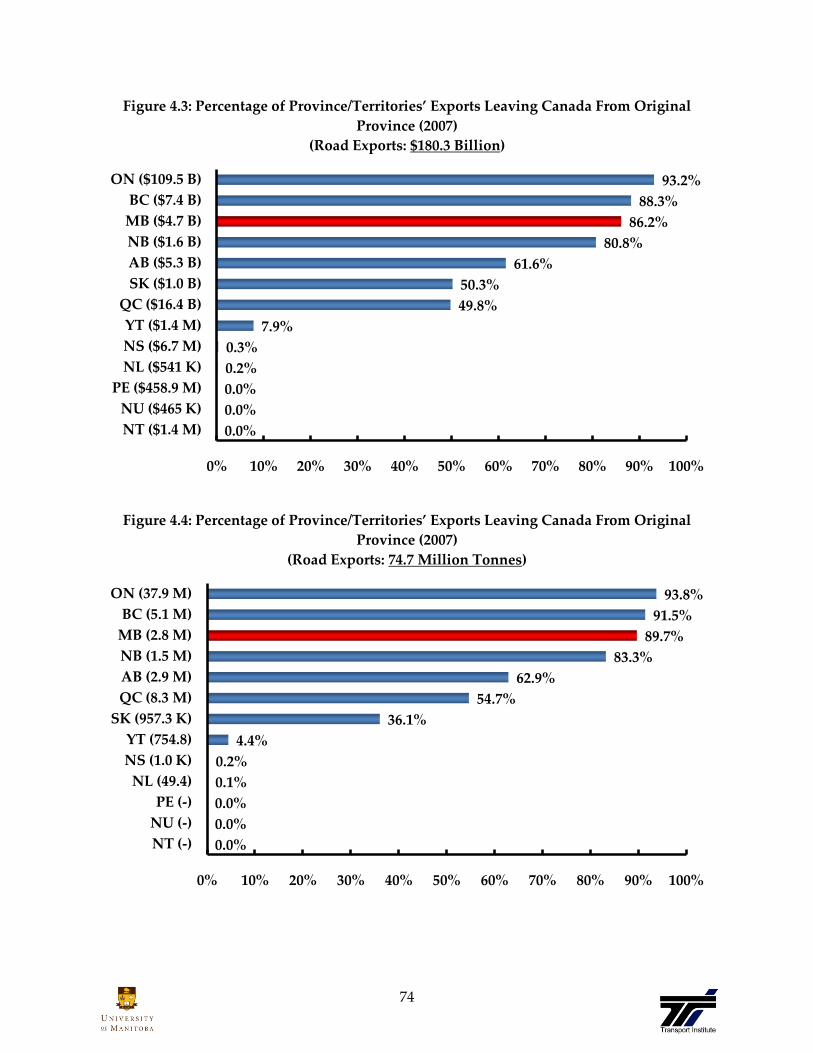
74
Figure 4.3: Percentage of Province/Territories’ Exports Leaving Canada From Original
Province (2007)
(Road Exports: $180.3 Billion)
Figure 4.4: Percentage of Province/Territories’ Exports Leaving Canada From Original
Province (2007)
(Road Exports: 74.7 Million Tonnes)
0.0%
0.0%
0.0%
0.2%
0.3%
7.9%
49.8%
50.3%
61.6%
80.8%
86.2%
88.3%
93.2%
0% 10% 20% 30% 40% 50% 60% 70% 80% 90% 100%
NT ($1.4 M)
NU ($465 K)
PE ($458.9 M)
NL ($541 K)
NS ($6.7 M)
YT ($1.4 M)
QC ($16.4 B)
SK ($1.0 B)
AB ($5.3 B)
NB ($1.6 B)
MB ($4.7 B)
BC ($7.4 B)
ON ($109.5 B)
0.0%
0.0%
0.0%
0.1%
0.2%
4.4%
36.1%
54.7%
62.9%
83.3%
89.7%
91.5%
93.8%
0% 10% 20% 30% 40% 50% 60% 70% 80% 90% 100%
NT (-)
NU (-)
PE (-)
NL (49.4)
NS (1.0 K)
YT (754.8)
SK (957.3 K)
QC (8.3 M)
AB (2.9 M)
NB (1.5 M)
MB (2.8 M)
BC (5.1 M)
ON (37.9 M)
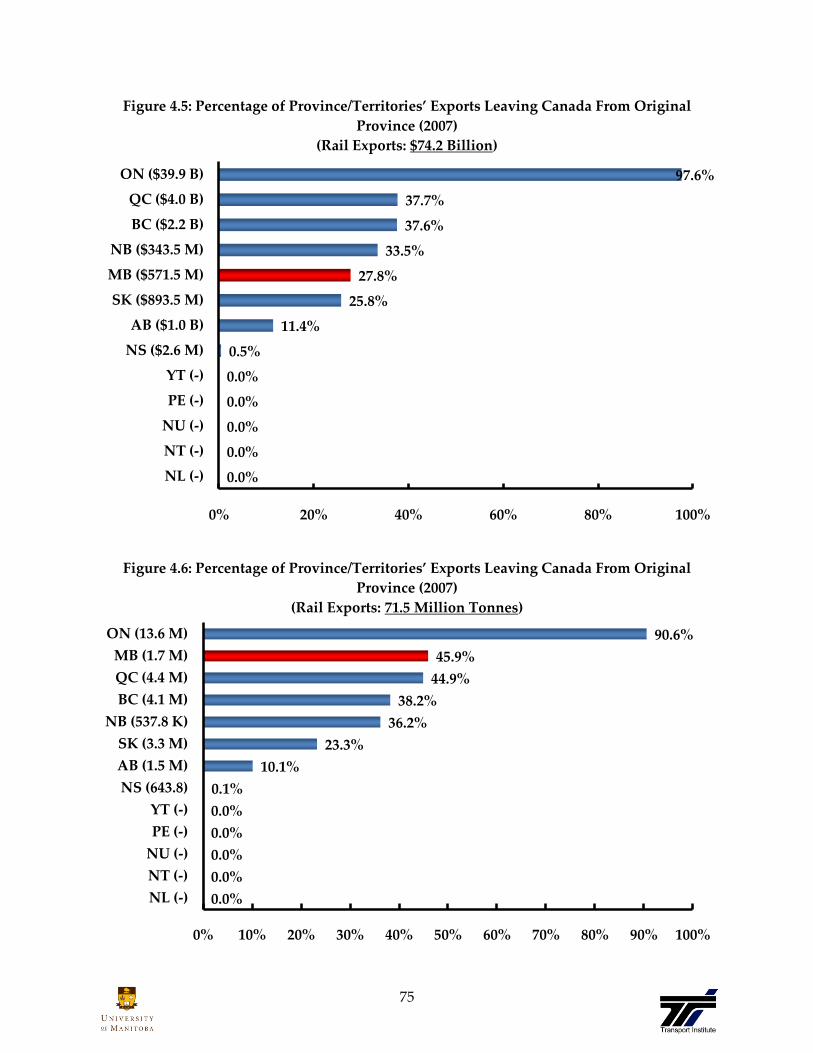
75
Figure 4.5: Percentage of Province/Territories’ Exports Leaving Canada From Original
Province (2007)
(Rail Exports: $74.2 Billion)
Figure 4.6: Percentage of Province/Territories’ Exports Leaving Canada From Original
Province (2007)
(Rail Exports: 71.5 Million Tonnes)
0.0%
0.0%
0.0%
0.0%
0.0%
0.5%
11.4%
25.8%
27.8%
33.5%
37.6%
37.7%
97.6%
0% 20% 40% 60% 80% 100%
NL (-)
NT (-)
NU (-)
PE (-)
YT (-)
NS ($2.6 M)
AB ($1.0 B)
SK ($893.5 M)
MB ($571.5 M)
NB ($343.5 M)
BC ($2.2 B)
QC ($4.0 B)
ON ($39.9 B)
0.0%
0.0%
0.0%
0.0%
0.0%
0.1%
10.1%
23.3%
36.2%
38.2%
44.9%
45.9%
90.6%
0% 10% 20% 30% 40% 50% 60% 70% 80% 90% 100%
NL (-)
NT (-)
NU (-)
PE (-)
YT (-)
NS (643.8)
AB (1.5 M)
SK (3.3 M)
NB (537.8 K)
BC (4.1 M)
QC (4.4 M)
MB (1.7 M)
ON (13.6 M)

76
Figure 4.7: Percentage of Province/Territories’ Exports Leaving Canada From Original
Province (2007)
(Water Exports: $81.5 Billion)
Figure 4.8: Percentage of Province/Territories’ Exports Leaving Canada From Original
Province (2007)
(Water Exports: 191.1 Million Tonnes)
0.0%
0.0%
0.0%
0.0%
0.0%
0.6%
8.2%
15.1%
66.2%
81.6%
90.3%
90.9%
97.1%
0% 10% 20% 30% 40% 50% 60% 70% 80% 90% 100%
AB (-)
NT (-)
NU (-)
SK (-)
YT (-)
MB ($17.8 M)
PE ($10.3 M)
ON ($2.7 B)
NL ($7.2 B)
QC ($9.0 B)
NS ($1.4 B)
NB ($6.9 B)
BC ($11.7 B)
0.0%
0.0%
0.0%
0.0%
0.0%
1.8%
19.6%
36.7%
57.3%
84.1%
87.3%
88.2%
99.3%
0% 20% 40% 60% 80% 100%
AB (-)
NT (-)
NU (-)
SK (-)
YT (-)
MB (63.5 K)
PE (30.8 K)
NL (10.5 M)
ON (10.2 M)
NS (10.9 M)
NB (9.4 M)
QC (25.3 M)
BC (42.3M)

77
Usage of Manitoba’s Transportation Infrastructure
Manitoba’s infrastructure appears to be well utilized in facilitating the province’s export
obligations. However, the previous section indicates that some of our neighbours are less
successful in meeting their own export requirements under the confines of their own
infrastructure. In 2007, about $17 Billion in exports passed out of Canada with Manitoba as the
point of exit (Figure 4.9). Of this amount, nearly 40% originated in Alberta, with Manitoba
responsible for about another 40%.
Figure 4.9: 2007 Provincial Exports Leaving Via Manitoba (By Value)
($16.5 Billion)
In the context of transportation infrastructure, discussions should exclude the powerline and
pipeline sectors. These modes function separately from the more traditional road, rail, air and
water modes, and their inclusion would only serve to ‚muddy the waters‛ – particularly in the
context of Alberta’s substantial oil and gas exports.
After removing these sectors, the situation in the context of transportation infrastructure
becomes clearer (Figure 4.10). Over half (58%) of exports (by value) leaving via Manitoba
originated in Manitoba in 2007 (the same level as in 2006, and up from 56% in 2005). Alberta
and Saskatchewan sourced commodities represented the next largest segments (each 12.9%),
followed by Ontario (11.9%). This represented a slight reduction from 2006’s 14% from Alberta
and a slight recovery from 11% from Saskatchewan. Overall, the value of exports leaving via
Manitoba dropped about 3% from 2006, after an increase from 2005 to 2006 of about 8%.
BC
2.5%
AB
39.2%
SK
10.9%
MB
39.6%ON
7.3%
Other
0.4%

78
Figure 4.10: 2007 Provincial Exports Leaving Via Manitoba,
Excluding Powerline and Pipeline Sectors (By Value)
($10.1 Billion)
Figure 4.11: 2007 Mode of Exports Leaving Via Manitoba,
Excluding Powerline and Pipeline Sectors (By Value)
($10.1 Billion)
Of the exports leaving via Manitoba, 71.6% (by value) departed by road in 2007 (Figure 4.11),
followed by rail, which contributed 20.5% of exports by value.
BC
4.1%
AB
12.9%
SK
12.9%
MB
57.6%
ON
11.9%
Other
0.7%
Air
4.4%
Other
1.8%
Rail
20.5%
Road
71.6%
Water
1.7%

79
On a tonnage basis (Figure 4.12), Manitoba is the dominant source of exports leaving via
Manitoba (46.1%), followed by Saskatchewan (32.7%). In 2006, those two provinces each
contributed slightly above one-third of exports leaving via Manitoba (by weight). Alberta’s
contribution has dropped from 17% in 2006 to 12% in 2007.
Figure 4.12: 2007 Provincial Exports Leaving Via Manitoba, Excluding Powerline and
Pipeline Sectors (By Weight)
(13.1 Million Tonnes)
Figure 4.13: 2007 Mode of Exports Leaving Via Manitoba,
Excluding Powerline and Pipeline Sectors (By Weight)
13.1 Million Tonnes)
BC
3.2%
AB
11.9%
SK
32.7%
MB
46.1%
ON
5.6% Other
0.5%
Air
0.7%
Other
11.3%
Rail
50.1%
Road
33.2%
Water
4.6%

80
Considering a tonnage basis, rail carries half (50.1%) of the exports leaving via Manitoba,
remaining unchanged from 2006, and ahead of the 33.2% by road. This may be due to a
disproportionate focus on rail for moving Saskatchewan’s exports through Manitoba to US
markets.
With Manitoba’s self-sufficiency in road export movement, an apparent lack of such self-
sufficiency for Saskatchewan and Alberta, and a significant usage of Manitoba as the portal for
prairie exports (Figures 4.10 and 4.12), a ‚Trucking Weight Surplus/Deficit‛ construct was
developed (Figure 4.14).
This value is created by netting out a province’s road-based exports with the road-based exports
exiting Canada via that province. For example, 1.2 million more tonnes left via Manitoba’s
ports than could be accounted by Manitoba’s road-based exports. In contrast, nearly 1.1 million
tonnes of Alberta’s road-based exports were not able to leave directly through Alberta’s road
infrastructure, rather requiring the use of other provinces’ roads. A similar deficit of 1.02
million tonnes was calculated for Saskatchewan. It is likely this value would have been much
higher had it not been for the propensity to use rail rather than road for Saskatchewan exports.
Figure 4.14: 2007 Prairie Provinces’ Road Export Weight Surplus/Deficit
(Exported by Road From Prairies 10.6 Million Tonnes)
Figure 4.14 presents a ‚net‛ view of the use of road infrastructure of the Prairie provinces. The
following table presents the provincial/territorial relationships in more detail.
-1.093
-1.020
1.210
-1.25 -1.00 -0.75 -0.50 -0.25 0.00 0.25 0.50 0.75 1.00 1.25
Alberta
Saskatchewan
Manitoba

81
Table 4.1: 2007 Provincial/Territorial Usage of Jurisdictions’ Road Infrastructure
(‘000 Tonnes)
Province of Departure from Canada Weight of Prov's
Road Exports
(‘000 Tonnes) BC AB SK MB ON Other
Ori
gin
atin
g P
rov
ince
British
Columbia
5,138 42 84 141 127 87 5,617
91.5% 0.7% 1.5% 2.5% 2.3% 1.5% 100%
Alberta 514 2,979 462 390 259 130 4,734
10.9% 62.9% 9.8% 8.2% 5.5% 2.7% 100%
Saskatchewan 60 474 957 724 203 236 2,655
2.2% 17.9% 36.1% 27.3% 7.7% 8.9% 100%
Manitoba 44 27 73 2,847 135 47 3,173
1.4% 0.8% 2.3% 89.7% 4.2% 1.5% 100%
Ontario 315 113 56 269 37,910 1,752 40,415
0.8% 0.3% 0.1% 0.7% 93.8% 4.3% 100%
Other
Prov/Terr
42 6 2 12 7,106 11,034 18,202
0.2% 0.0% 0.0% 0.1% 39.0% 60.6% 100%
Total Weight of
Exports Leaving via
Prov. (‘000 Tonnes)
6,112 3,641 1,635 4,384 45,739 13,287 74,797
Percent of Weight
of Prov's Road
Exports Leaving via
Own Prov
Infrastructure
108.8% 76.9% 61.6% 138.1% 113.2% 73.0%
Province's Surplus
or Deficit (‘000
Tonnes)
495 -1,093 -1,020 1,210 5,324 -4,915
Main Beneficiaries
of Port Province's
Infrastructure
BC
AB
ON
AB
SK
SK
AB
MB
SK
AB
ON
QC42
"Other"
‚Other‛
ON
Since Saskatchewan’s road deficit is quite small, Figure 4.14 may give the impression that the
large Manitoba surplus is as a result of a large amount of exports being trucked from Alberta to
Manitoba and then being exported via Manitoba. However, Table 4.1 reveals a more complex
relationship, and more of an ‚ice cube tray‛ effect. Alberta only ships 390,000 tonnes of road
exports through Manitoba, but ships 462,000 tonnes via Saskatchewan. Saskatchewan, in turn,
ships 724,000 tonnes via Manitoba. As the ‚ice cube tray‛ tilts to the east, ‚water‛
(commodities) pours out of Alberta into Saskatchewan, which is itself in the process of pouring
into Manitoba in order to facilitate truck trade southward.
Table 4.1 also illustrates that in 2007, Manitoba maintained the largest road freight surplus (by
weight) among the Western provinces. One could argue that, on balance, other western
42 Included in ‚Other‛

82
provinces benefit from the presence of Manitoba’s road infrastructure to a greater extent than
Manitoba benefits from the other western provinces’ road infrastructure (at least in terms of
facilitating international road-based exports).
The view presented for road in Figure 4.14 is repeated for Rail in Figure 4.15. It is also a ‚net
effect‛ presentation, showing Manitoba’s net positive rail surplus. As with trucking, it is a
complex net effect, with Alberta moving 4.5 million tonnes through Saskatchewan to the United
States while Saskatchewan moves 3.2 million tonnes through the rail bed in Manitoba. Alberta
also uses rail in Manitoba to a level of 890,000 tonnes. Conversely, only 86,000 tonnes of
Manitoba’s rail exports leave Canada via Alberta, and 171,000 tonnes of Manitoba rail exports
leave via Saskatchewan.
Overall, in 2007, the ‚ice cube tray‛ analogy still holds for road and rail, although
Saskatchewan’s load in Manitoba’s infrastructure was somewhat more direct than it had been in
2006, with the central prairie province contributing a greater percentage directly to Manitoba
than had been the case in 2006.
Figure 4.15: 2007 Prairie Provinces’ Rail Export Weight Surplus/Deficit
(Exported by Rail From Prairies 33.2 Million Tonnes)
When all provinces’ exports by rail are viewed, only Manitoba and Ontario have net rail
surpluses (by weight), such that rail departing from Ontario and Manitoba exceeds the weight
of those provinces’ own exports leaving by rail. Manitoba (and Canada in general) is a trade-
based economy and gains significantly from markets outside its borders. However, it would
appear that other provinces may gain significantly, and disproportionately, from access to
markets through Manitoba’s transportation infrastructure.
-12.750
-5.032
2.883
-14.0 -12.0 -10.0 -8.0 -6.0 -4.0 -2.0 0.0 2.0 4.0
Alberta
Saskatchewan
Manitoba
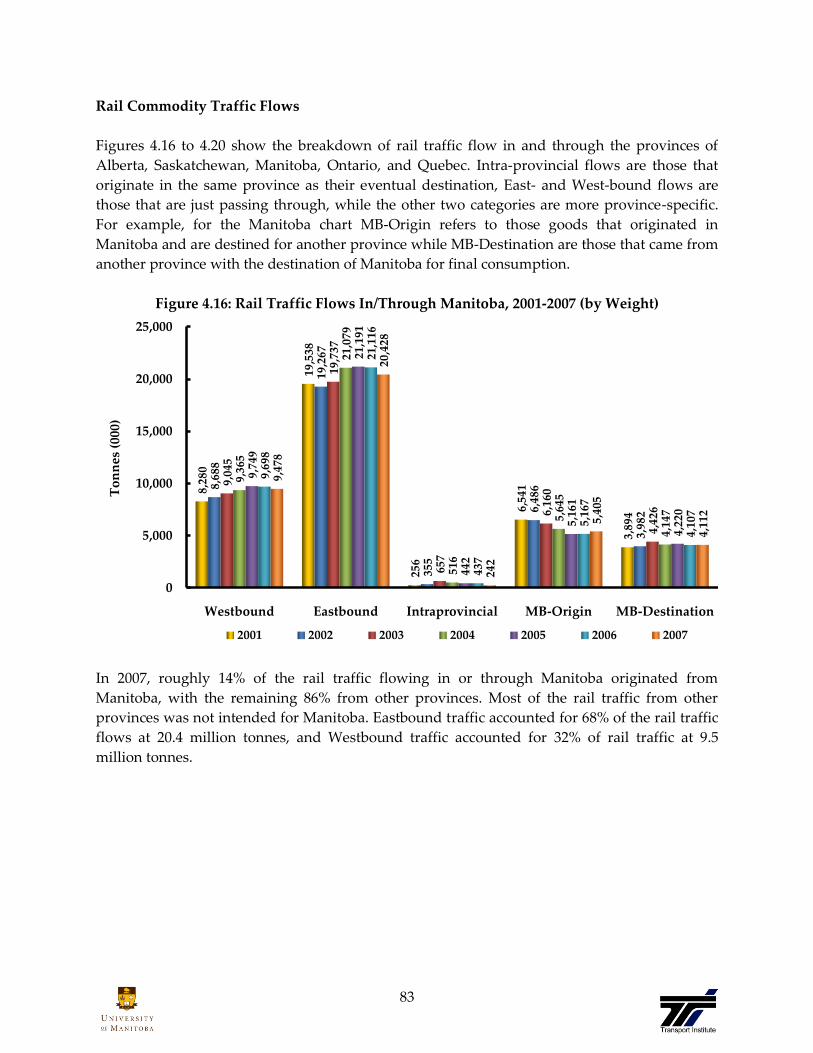
83
Rail Commodity Traffic Flows
Figures 4.16 to 4.20 show the breakdown of rail traffic flow in and through the provinces of
Alberta, Saskatchewan, Manitoba, Ontario, and Quebec. Intra-provincial flows are those that
originate in the same province as their eventual destination, East- and West-bound flows are
those that are just passing through, while the other two categories are more province-specific.
For example, for the Manitoba chart MB-Origin refers to those goods that originated in
Manitoba and are destined for another province while MB-Destination are those that came from
another province with the destination of Manitoba for final consumption.
Figure 4.16: Rail Traffic Flows In/Through Manitoba, 2001-2007 (by Weight)
In 2007, roughly 14% of the rail traffic flowing in or through Manitoba originated from
Manitoba, with the remaining 86% from other provinces. Most of the rail traffic from other
provinces was not intended for Manitoba. Eastbound traffic accounted for 68% of the rail traffic
flows at 20.4 million tonnes, and Westbound traffic accounted for 32% of rail traffic at 9.5
million tonnes.
8,28
0
19,5
38
256
6,54
1
3,89
4
8,68
8
19,2
67
355
6,48
6
3,98
2
9,04
5
19,7
37
657
6,16
0
4,42
6
9,36
5
21,0
79
516
5,64
5
4,14
7
9,74
9
21,1
91
442
5,16
1
4,22
0
9,69
8
21,1
16
437
5,16
7
4,10
7
9,47
8
20,4
28
242
5,40
5
4,11
2
0
5,000
10,000
15,000
20,000
25,000
Westbound Eastbound Intraprovincial MB-Origin MB-Destination
To
nn
es (
000)
2001 2002 2003 2004 2005 2006 2007

84
Figures 4.17 to 4.20 show the breakdown of rail traffic through Alberta, Saskatchewan, Ontario,
and Quebec from 2001-2007.
Figure 4.17: Rail Traffic Flows In/Through Alberta, 2001-2007 (by Weight)
Figure 4.18: Rail Traffic Flows In/Through Saskatchewan, 2001-2007 (by Weight)
16,8
33
5,81
4
3,12
0
30,4
56
6,82
8
13,6
64
6,97
3
3,19
6
26,5
15
6,94
8
14,9
94
7,58
3
2,73
9
25,8
82
7,00
9
17,7
05
8,29
4
3,01
2
29,1
40
7,00
6
19,8
88
8,71
5
3,27
7
29,9
99
7,34
8
19,6
96
8,51
3
3,28
1
36,6
06
7,94
7
21,2
97
9,21
8
3,18
0
37,8
12
8,23
5
0
5,000
10,000
15,000
20,000
25,000
30,000
35,000
40,000
Westbound Eastbound Intraprovincial AB-Origin AB-Destination
To
nn
es (
000)
2001 2002 2003 2004 2005 2006 2007
9,89
2
10,6
19
152
24,3
00
1,97
7
10,2
37 12,2
34
242
18,9
68
1,94
0
9,93
1 12,7
98
217
20,9
51
2,01
6
9,79
9
13,6
57
197
24,0
36
1,78
6
10,1
12
13,9
17
185
25,8
24
1,77
8
10,3
80 12,9
63
165
25,9
07
1,79
5
10,3
12 13,2
81
192
26,5
04
1,83
6
0
5,000
10,000
15,000
20,000
25,000
30,000
Westbound Eastbound Intraprovincial SK-Origin SK-Destination
To
nn
es (
000)
2001 2002 2003 2004 2005 2006 2007

85
Figure 4.19: Rail Traffic Flows In/Through Ontario, 2001-2007 (by Weight)
Figure 4.20: Rail Traffic Flows In/Through Quebec, 2001-2007 (by Weight)
A considerable amount of Canadian rail tonnage traveled west to east; resulting in Manitoba
being used as a route for rail through-traffic. Overall, approximately 75.4% of all rail traffic in
Manitoba was flow-through. In comparison, flow-through traffic in Saskatchewan and Alberta
accounted for 45.3% and 38.3% of each provinces total rail tonnage, while Ontario and Quebec
flow-through traffic was considerably lower (17.6% and 6.3%, respectively).
2,69
42,
782 5,
316 7,
872
14,2
83
24,7
10
2,93
5 5,7
12
7,42
0
14,9
58
25
,77
9
3,14
3 6,35
4
8,0
37
14,7
75
26,3
45
3,14
8
6,43
2
7,82
1
14,6
99
25,8
91
3,32
1 6,40
1
5,75
3
14,6
12
25,3
86
3,36
7 6,23
5
5,71
7
14,6
46
24,7
11
0
5,000
10,000
15,000
20,000
25,000
30,000
Westbound Eastbound Intraprovincial ON-Origin ON-Destination
To
nn
es (
000)
2001 2002 2003 2004 2005 2006 2007
1,40
6
2,40
2
6,62
3 9,41
1
28,2
30
1,45
3
2,26
7
6,38
4 10,1
78
28,6
14
1,67
2
2,32
5
6,45
6
10,9
80
31,4
36
1,61
0
2,33
3 5,86
2
10,9
15
27,8
72
1,52
6
2,11
2 5,21
0
11,1
03
32,9
39
1,48
2
1,94
9 4,93
8
11,1
60
32,9
59
1,26
5
1,86
0 4,96
7
10,8
41
30,9
54
0
5,000
10,000
15,000
20,000
25,000
30,000
35,000
Westbound Eastbound Intraprovincial QC-Origin QC-Destination
To
nn
es (
000)
2001 2002 2003 2004 2005 2006 2007

86
Table 4.2 displays the Westbound and Eastbound traffic flows for Alberta, Saskatchewan,
Manitoba, Ontario and Quebec. West and East bound traffic shows the flow through traffic
only, which is traffic that originates in one province, and goes through the represented province
to arrive at the destination province on the other side.
Alberta supported 30.5 million tonnes and Saskatchewan supported 23.6 million tonnes.
Manitoba was the second most affected by flow through traffic with 29.9 million tonnes flowing
through the province, 68% of which was Eastbound, while the remaining 31% was Westbound.
Ontario and Quebec fared better with only 9.6 million and 3.1 million tonnes respectivly.
Table 4.2: Rail Traffic Flows Through Selected Canadian Provinces, 2007
Tonnes (000)
Province AB SK MB ON QC
Westbound 21,297 10,312 9,478 3,367 1,265
Eastbound 9,218 13,281 20,428 6,235 1,860
Total Flow-Through 30,514 23,593 29,906 9,601 3,126
% Westbound 71% 34% 31% 11% 4%
% Eastbound 31% 44% 68% 21% 6%
Total Traffic 79,742 52,124 39,665 54,676 49,888
Figure 4.21 shows the rail traffic flows in and through Manitoba by province of origin for 2007.
Figure 4.21: Rail Traffic Flows In/Through Manitoba, by Originating Province, 2007
(by Weight)
(39.6 Million Tonnes)
28.9%
10.5%
28.3%
17.9%21.6%
9.1%
0.7%
1.2%
3.4%
4.6%
0.8%
3.1%
1.2%
0.1%
0.0%
5.0%
10.0%
15.0%
20.0%
25.0%
30.0%
35.0%
BC AB SK MB ON QC ATL
Per
cen
tag
e o
f T
ota
l M
anit
ob
a T
raff
ic
Flow Through Manitoba Destined for MB
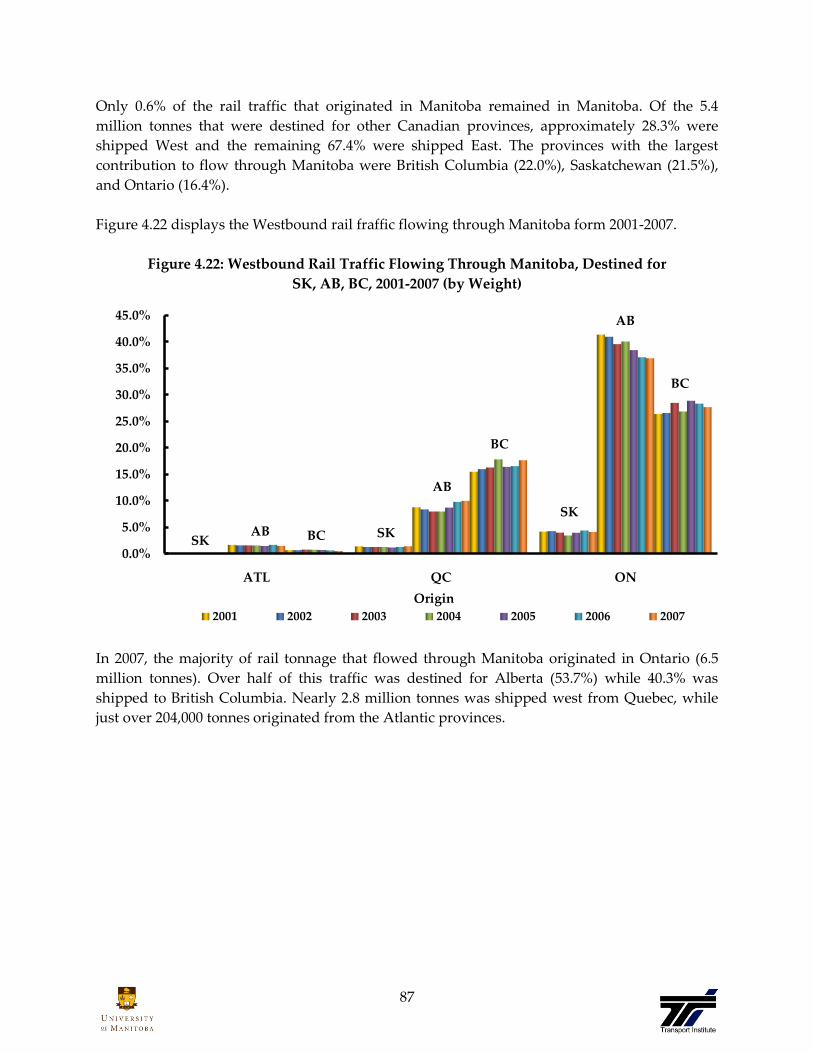
87
Only 0.6% of the rail traffic that originated in Manitoba remained in Manitoba. Of the 5.4
million tonnes that were destined for other Canadian provinces, approximately 28.3% were
shipped West and the remaining 67.4% were shipped East. The provinces with the largest
contribution to flow through Manitoba were British Columbia (22.0%), Saskatchewan (21.5%),
and Ontario (16.4%).
Figure 4.22 displays the Westbound rail fraffic flowing through Manitoba form 2001-2007.
Figure 4.22: Westbound Rail Traffic Flowing Through Manitoba, Destined for
SK, AB, BC, 2001-2007 (by Weight)
In 2007, the majority of rail tonnage that flowed through Manitoba originated in Ontario (6.5
million tonnes). Over half of this traffic was destined for Alberta (53.7%) while 40.3% was
shipped to British Columbia. Nearly 2.8 million tonnes was shipped west from Quebec, while
just over 204,000 tonnes originated from the Atlantic provinces.
SKSK
SK
AB
AB
AB
BC
BC
BC
0.0%
5.0%
10.0%
15.0%
20.0%
25.0%
30.0%
35.0%
40.0%
45.0%
ATL QC ON
Origin
2001 2002 2003 2004 2005 2006 2007

88
Figure 4.23 displays the Eastbound traffic flows from 2001-2007.
Figure 4.23: Eastbound Rail Traffic Flowing Through Manitoba, Destined for
ATL, QC, ON, 2001-2007 (by Weight)
Of the 20.4 million tonnes of rail traffic flowing east through Manitoba, the majority was
destined for Ontario (72.8%); nearly half of which originated from Saskatchewan (48.5%).
Overall, traffic from British Columbia and Saskatchewan represented the majority of east bound
rail tonnage flowing through Manitoba (42.7% and 41.8% respectively).
ATL ATL ATL
QC QC
QC
ON
ON
ON
0.0%
5.0%
10.0%
15.0%
20.0%
25.0%
30.0%
35.0%
40.0%
45.0%
50.0%
SK AB BC
Origin
2001 2002 2003 2004 2005 2006 2007

89
Truck Commodity Traffic Flows
Figures 4.24 to 4.28 show the breakdown of truck traffic flow in and through the provinces of
Alberta, Saskatchewan, Manitoba, Ontario, and Quebec. Intra-provincial flows are those that
originate in the same province as their eventual destination, East and West bound flows are
those that are flowing through, while the other two categories are more province-specific. For
example, for the Manitoba chart MB-Origin refers to that goods that originated in Manitoba and
are destined for another province while MB-Destination are those that came from another
province with the destination of Manitoba for final consumption.
The data for truck traffic flows only goes back to 2004 because between 2003 and 2004 there was
an alteration made to the statistical collection method that would make comparison of the data
virtually meaningless.
Figure 4.24: Truck Traffic Flows In/Through Manitoba, 2004-2007 (by Weight)
In 2007, roughly 42% of the truck traffic flowing in or through Manitoba originated in Manitoba,
with the remaining 58% oringinated from other provinces. Most of the truck traffic from other
provinces was not intended for Manitoba. Eastbound traffic accounted for 12% of the truck
traffic flows (3.0 million tonnes), while Westbound traffic accounted for 17% of truck traffic (4.0
million tonnes).
3,47
3
2,32
8
8,29
2
2,94
2
5,38
9
4,63
3
1,95
7
9,77
3
2,99
7
4,31
4
4,63
2
2,26
1
9,54
7
3,01
8
3,57
1
4,04
8
3,01
2
10,2
63
2,85
7 4,00
1
0
2,000
4,000
6,000
8,000
10,000
12,000
Westbound Eastbound Intraprovincial MB-Origin MB-Destination
To
nn
es (
000)
2004 2005 2006 2007
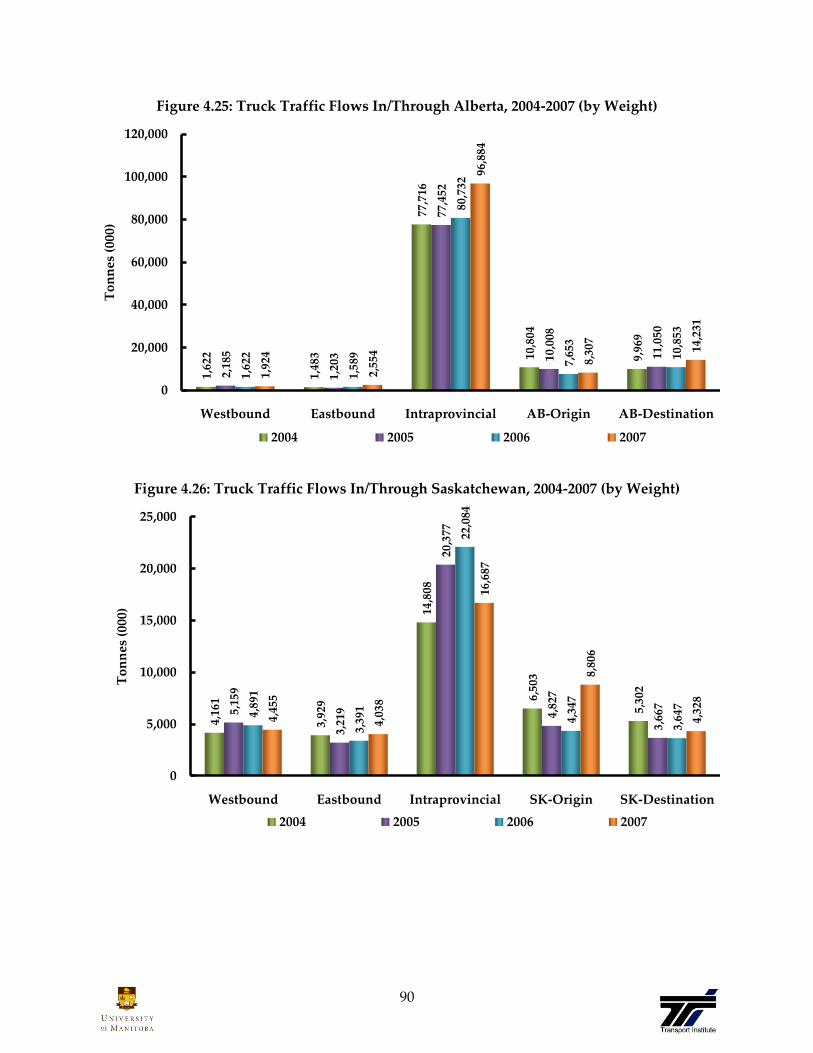
90
Figure 4.25: Truck Traffic Flows In/Through Alberta, 2004-2007 (by Weight)
Figure 4.26: Truck Traffic Flows In/Through Saskatchewan, 2004-2007 (by Weight)
1,62
2
1,48
3
77,7
16
10,8
04
9,96
9
2,18
5
1,20
3
77,4
52
10,0
08
11,0
50
1,62
2
1,58
9
80,7
32
7,65
3
10,8
53
1,92
4
2,55
4
96,8
84
8,30
7
14,2
31
0
20,000
40,000
60,000
80,000
100,000
120,000
Westbound Eastbound Intraprovincial AB-Origin AB-Destination
To
nn
es (
000)
2004 2005 2006 2007
4,16
1
3,92
9
14,8
08
6,50
3
5,30
2
5,15
9
3,21
9
20,3
77
4,82
7
3,66
7
4,89
1
3,39
1
22,0
84
4,34
7
3,64
7
4,45
5
4,03
8
16,6
87
8,80
6
4,32
8
0
5,000
10,000
15,000
20,000
25,000
Westbound Eastbound Intraprovincial SK-Origin SK-Destination
To
nn
es (
000)
2004 2005 2006 2007

91
Figure 4.27: Truck Traffic Flows In/Through Ontario, 2004-2007 (by Weight)
Figure 4.28: Truck Traffic Flows In/Through Quebec, 2004-2007 (by Weight)
Most truck traffic is intraprovincial, due primarily to the fact that truck traffic is most efficient
for short haul transport. Flow through traffic accounts for only 4% of Alberta’s traffic , 22% of
Saskatchewan’s traffic, 1% of Ontario’s traffic and 4% of Quebec’s truck traffic. This is in
comparison to Manitoba’s 29% flow through traffic.
850
805
144,
880
16
,95
1
18,0
04
1,06
3
843
154,
644
20,7
84
19,8
28
1,25
7
867
171,
071
20,0
59
17,4
63
1,27
0
724
167,
259
17,7
37
15,4
20
0
20,000
40,000
60,000
80,000
100,000
120,000
140,000
160,000
180,000
Westbound Eastbound Intraprovincial ON-Origin ON-Destination
To
nn
es (
000)
2004 2005 2006 2007
1,58
9
2,55
8
72,9
14
17,4
61
14,2
90
1,47
5
2,28
5
83,8
61
19,5
19
16,3
21
1,39
4
2,73
0
90,0
57
17,3
40
15,4
35
1,61
1
3,36
5
81,4
68
14,6
07
13,1
27
0
10,000
20,000
30,000
40,000
50,000
60,000
70,000
80,000
90,000
100,000
Westbound Eastbound Intraprovincial QC-Origin QC-Destination
To
nn
es (
000)
2004 2005 2006 2007
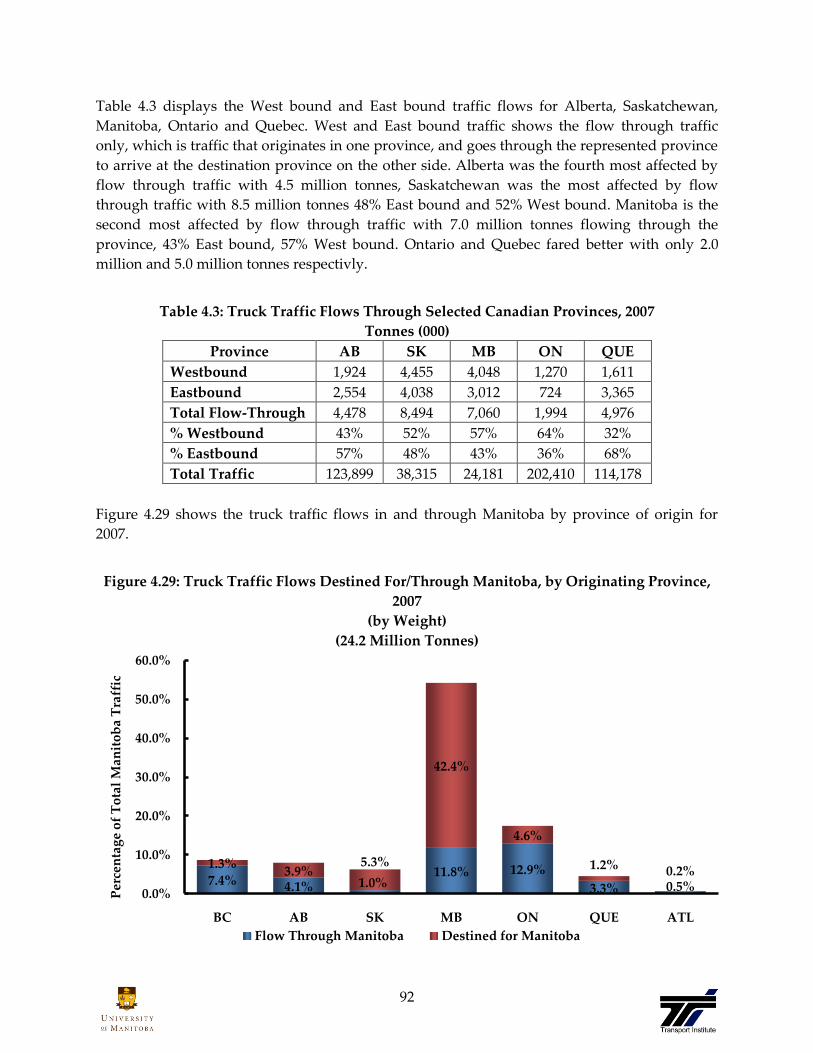
92
Table 4.3 displays the West bound and East bound traffic flows for Alberta, Saskatchewan,
Manitoba, Ontario and Quebec. West and East bound traffic shows the flow through traffic
only, which is traffic that originates in one province, and goes through the represented province
to arrive at the destination province on the other side. Alberta was the fourth most affected by
flow through traffic with 4.5 million tonnes, Saskatchewan was the most affected by flow
through traffic with 8.5 million tonnes 48% East bound and 52% West bound. Manitoba is the
second most affected by flow through traffic with 7.0 million tonnes flowing through the
province, 43% East bound, 57% West bound. Ontario and Quebec fared better with only 2.0
million and 5.0 million tonnes respectivly.
Table 4.3: Truck Traffic Flows Through Selected Canadian Provinces, 2007
Tonnes (000)
Province AB SK MB ON QUE
Westbound 1,924 4,455 4,048 1,270 1,611
Eastbound 2,554 4,038 3,012 724 3,365
Total Flow-Through 4,478 8,494 7,060 1,994 4,976
% Westbound 43% 52% 57% 64% 32%
% Eastbound 57% 48% 43% 36% 68%
Total Traffic 123,899 38,315 24,181 202,410 114,178
Figure 4.29 shows the truck traffic flows in and through Manitoba by province of origin for
2007.
Figure 4.29: Truck Traffic Flows Destined For/Through Manitoba, by Originating Province,
2007
(by Weight)
(24.2 Million Tonnes)
7.4% 4.1% 1.0%11.8% 12.9%
3.3% 0.5%
1.3%3.9%
5.3%
42.4%
4.6%
1.2% 0.2%
0.0%
10.0%
20.0%
30.0%
40.0%
50.0%
60.0%
BC AB SK MB ON QUE ATL
Per
cen
tag
e o
f T
ota
l M
anit
ob
a T
raff
ic
Flow Through Manitoba Destined for Manitoba

93
Over 42% of the truck traffic that originated in Manitoba was destined for Manitoba. The
provinces with the largest contribution to flow through were British Columbia (7%), Alberta
(4%), Ontario (13%), and Quebec (3%).
Figure 4.30 displays the Westbound truck traffic flowing through Manitoba from 2001-2007.
Figure 4.30: Westbound Truck Traffic Flowing Through Manitoba, Destined for
SK, AB, BC 2004-2007 (by Weight)
In 2007 the majority of the traffic originated in Ontario (3.1 million tonnes). Ontario to Britsh
Columbia ranked second as the largest portion at 27%. Ontario to Alberta was the largest
portion of through traffic at 43%, while Quebec to Alberta traffic accounted for third place with
11%, at 465,000 tonnes.
SKSK
SK
AB
AB
AB
BC
BC
BC
0.0%
5.0%
10.0%
15.0%
20.0%
25.0%
30.0%
35.0%
40.0%
45.0%
50.0%
ATL QC ON
Origin
2004 2005 2006 2007
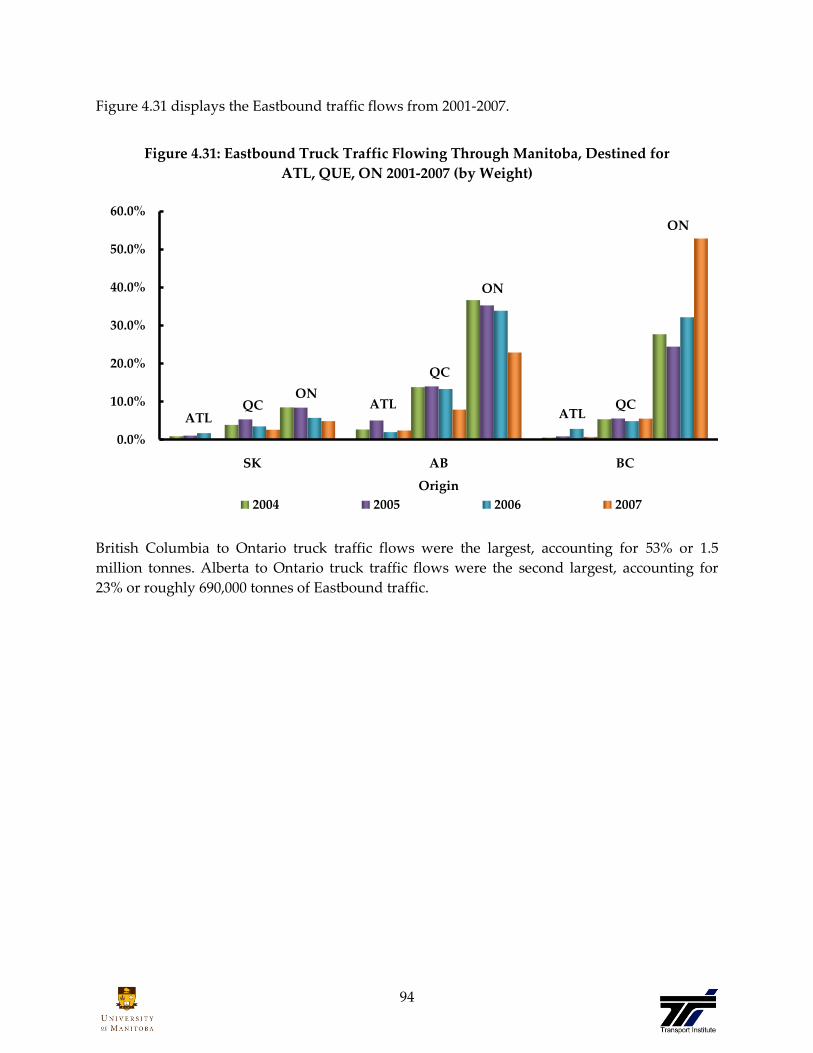
94
Figure 4.31 displays the Eastbound traffic flows from 2001-2007.
Figure 4.31: Eastbound Truck Traffic Flowing Through Manitoba, Destined for
ATL, QUE, ON 2001-2007 (by Weight)
British Columbia to Ontario truck traffic flows were the largest, accounting for 53% or 1.5
million tonnes. Alberta to Ontario truck traffic flows were the second largest, accounting for
23% or roughly 690,000 tonnes of Eastbound traffic.
ATLATL
ATLQC
QC
QCON
ON
ON
0.0%
10.0%
20.0%
30.0%
40.0%
50.0%
60.0%
SK AB BC
Origin
2004 2005 2006 2007
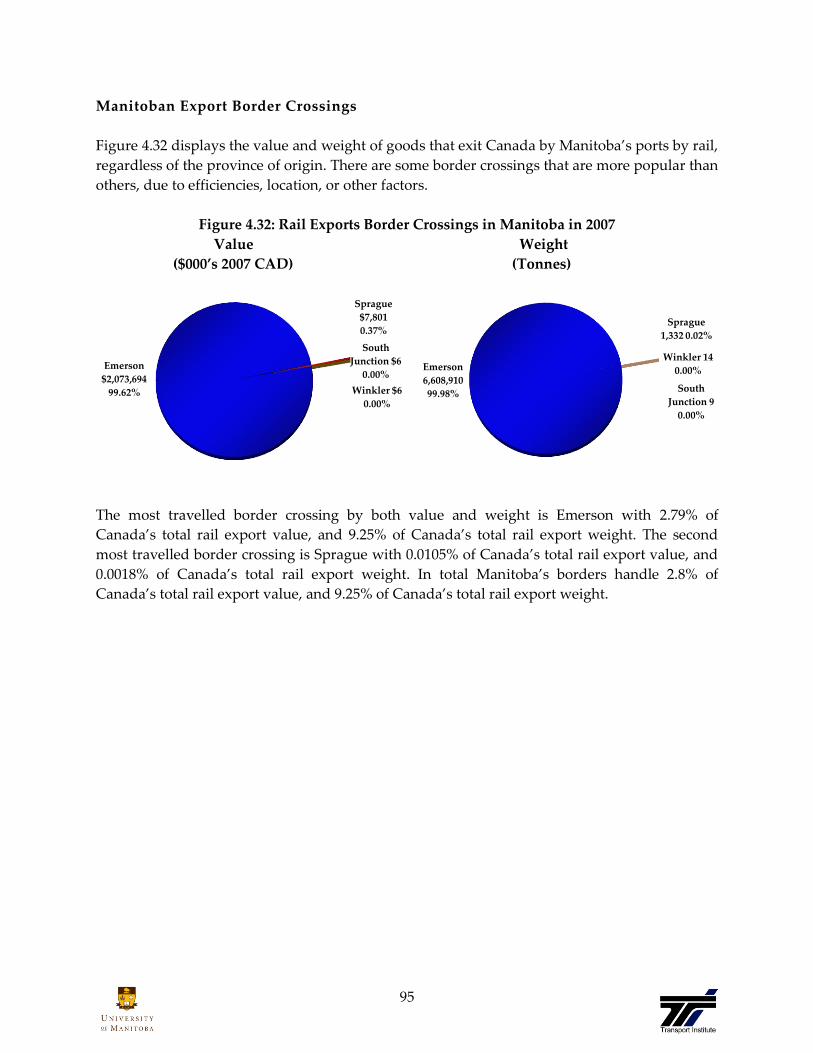
95
Manitoban Export Border Crossings
Figure 4.32 displays the value and weight of goods that exit Canada by Manitoba’s ports by rail,
regardless of the province of origin. There are some border crossings that are more popular than
others, due to efficiencies, location, or other factors.
Figure 4.32: Rail Exports Border Crossings in Manitoba in 2007
Value Weight
($000’s 2007 CAD) (Tonnes)
The most travelled border crossing by both value and weight is Emerson with 2.79% of
Canada’s total rail export value, and 9.25% of Canada’s total rail export weight. The second
most travelled border crossing is Sprague with 0.0105% of Canada’s total rail export value, and
0.0018% of Canada’s total rail export weight. In total Manitoba’s borders handle 2.8% of
Canada’s total rail export value, and 9.25% of Canada’s total rail export weight.
Emerson
$2,073,694
99.62%
Sprague
$7,801
0.37%
South
Junction $6
0.00%
Winkler $6
0.00%
Emerson
6,608,910
99.98%
Sprague
1,332 0.02%
Winkler 14
0.00%
South
Junction 9
0.00%
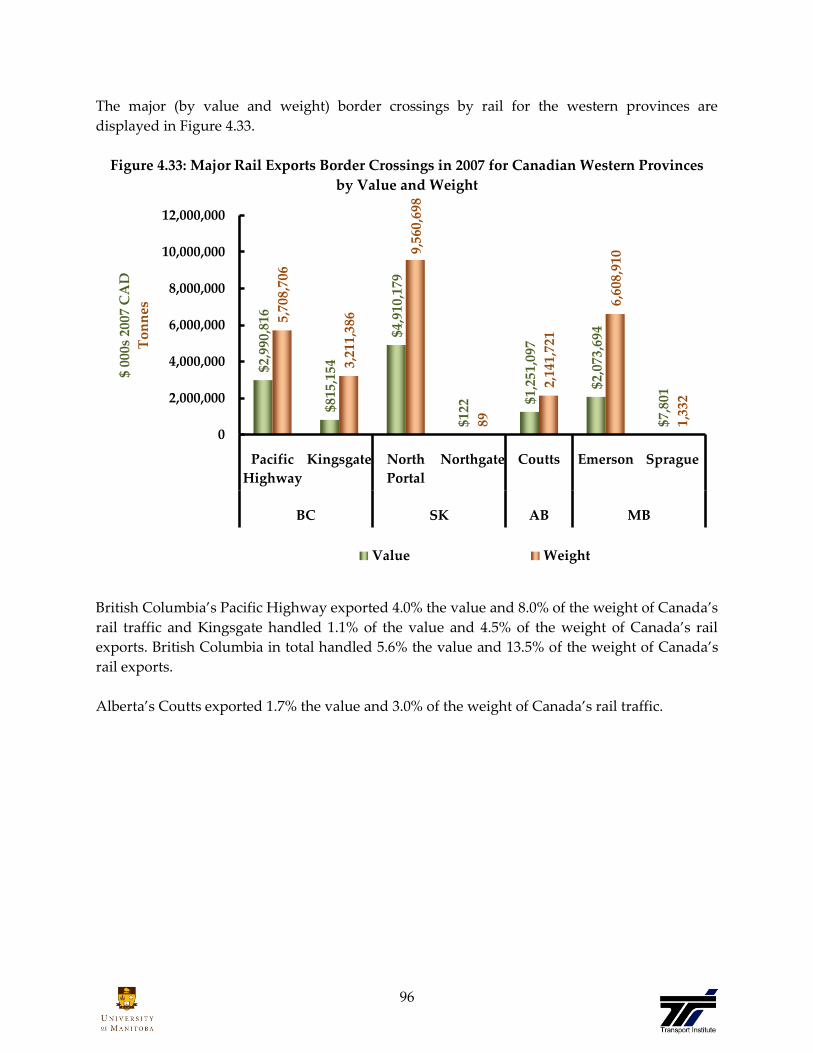
96
The major (by value and weight) border crossings by rail for the western provinces are
displayed in Figure 4.33.
Figure 4.33: Major Rail Exports Border Crossings in 2007 for Canadian Western Provinces
by Value and Weight
British Columbia’s Pacific Highway exported 4.0% the value and 8.0% of the weight of Canada’s
rail traffic and Kingsgate handled 1.1% of the value and 4.5% of the weight of Canada’s rail
exports. British Columbia in total handled 5.6% the value and 13.5% of the weight of Canada’s
rail exports.
Alberta’s Coutts exported 1.7% the value and 3.0% of the weight of Canada’s rail traffic.
$2,9
90,8
16
$815
,154
$4,9
10,1
79
$122
$1,2
51,0
97
$2,0
73,6
94
$7,8
01
5,70
8,70
6
3,21
1,38
6
9,56
0,69
8
89
2,14
1,72
1
6,60
8,91
0
1,33
2
0
2,000,000
4,000,000
6,000,000
8,000,000
10,000,000
12,000,000
Pacific
Highway
Kingsgate North
Portal
Northgate Coutts Emerson Sprague
BC SK AB MB
$ 00
0s 2
007
CA
D
To
nn
es
Value Weight
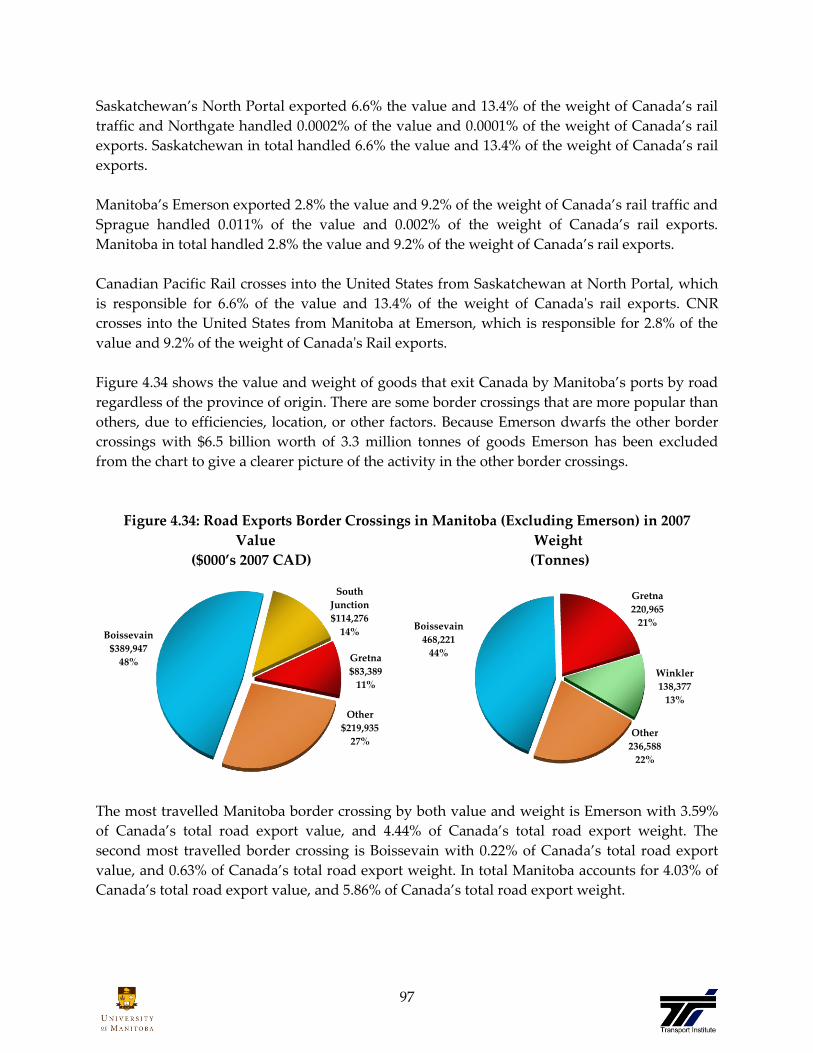
97
Saskatchewan’s North Portal exported 6.6% the value and 13.4% of the weight of Canada’s rail
traffic and Northgate handled 0.0002% of the value and 0.0001% of the weight of Canada’s rail
exports. Saskatchewan in total handled 6.6% the value and 13.4% of the weight of Canada’s rail
exports.
Manitoba’s Emerson exported 2.8% the value and 9.2% of the weight of Canada’s rail traffic and
Sprague handled 0.011% of the value and 0.002% of the weight of Canada’s rail exports.
Manitoba in total handled 2.8% the value and 9.2% of the weight of Canada’s rail exports.
Canadian Pacific Rail crosses into the United States from Saskatchewan at North Portal, which
is responsible for 6.6% of the value and 13.4% of the weight of Canada's rail exports. CNR
crosses into the United States from Manitoba at Emerson, which is responsible for 2.8% of the
value and 9.2% of the weight of Canada's Rail exports.
Figure 4.34 shows the value and weight of goods that exit Canada by Manitoba’s ports by road
regardless of the province of origin. There are some border crossings that are more popular than
others, due to efficiencies, location, or other factors. Because Emerson dwarfs the other border
crossings with $6.5 billion worth of 3.3 million tonnes of goods Emerson has been excluded
from the chart to give a clearer picture of the activity in the other border crossings.
Figure 4.34: Road Exports Border Crossings in Manitoba (Excluding Emerson) in 2007
Value Weight
($000’s 2007 CAD) (Tonnes)
The most travelled Manitoba border crossing by both value and weight is Emerson with 3.59%
of Canada’s total road export value, and 4.44% of Canada’s total road export weight. The
second most travelled border crossing is Boissevain with 0.22% of Canada’s total road export
value, and 0.63% of Canada’s total road export weight. In total Manitoba accounts for 4.03% of
Canada’s total road export value, and 5.86% of Canada’s total road export weight.
Boissevain
$389,947
48%
South
Junction
$114,276
14%
Gretna
$83,389
11%
Other
$219,935
27%
Boissevain
468,221
44%
Gretna
220,965
21%
Winkler
138,377
13%
Other
236,588
22%

98
The major (by value and weight) border crossings by road for the western provinces are
displayed in Figure 4.35.
Figure 4.35: Major Road Exports Border Crossings in 2007 for Canadian Western Provinces
by Value and Weight
British Columbia’s Pacific Highway exported 4.6% the value and 4.0% of the weight of Canada’s
road traffic and Huntington handled 1.1% of the value and 2.2% of the weight of Canada’s road
exports. British Columbia in total handled 5.6% the value and 8.2% of the weight of Canada’s
road exports.
Alberta’s Coutts exported 4.2% the value and 4.8% of the weight of Canada’s road traffic and
Edmonton43 (ranking 2nd in value and 3rd in weight) handled 0.03% of the value and 0.01% of the
weight of Canada’s road exports. Carway (ranking 3rd in value and 2nd in weight) handled 0.01%
of the value and 0.04% of the weight of Canada’s road exports. Alberta in total handled 3.6% the
value and 4.9% of the weight of Canada’s road exports.
Saskatchewan’s North Portal exported 1.2% the value and 1.4% of the weight of Canada’s road
traffic and Regway handled 0.2% of the value and 0.6% of the weight of Canada’s road exports.
Saskatchewan in total handled 1.3% the value and 2.2% of the weight of Canada’s road exports.
43 Despite not being a physical border crossing, Edmonton will be listed on some Customs records as the
point of departure/entry, representing the point at which the good left/entered Canada .
$6,9
43,1
09
$1,7
41,6
71
$6,4
61,8
39
$48,
955
$22,
648 $1
,898
,060
$358
,372
$6,4
69,4
22
$389
,9472,
994,
563
1,63
6,27
7
3,58
9,57
6
10,5
58
28,6
39
1,01
8,69
5
414,
383
3,31
9,56
3
468,
221
01,000,0002,000,0003,000,0004,000,0005,000,0006,000,0007,000,0008,000,000
Pac
ific
Hig
hw
ay
Hu
nti
ng
ton
Co
utt
s
Ed
mo
nto
n
Car
way
No
rth
Po
rtal
Reg
way
Em
erso
n
Bo
isse
vai
n
BC AB SK MB
$ 00
0s 2
007
CA
D
To
nn
es
Value Weight

99
Manitoba’s Emerson exported 4.2% the value and 4.4% of the weight of Canada’s road traffic
and Boissevain handled 0.3% of the value and 0.6% of the weight of Canada’s road exports.
Manitoba in total handled 4.0% the value and 5.9% of the weight of Canada’s road exports.
Canadian Export Border Crossings
There are some border crossings that are more popular than others, due to efficiencies, location,
or other factors.
Table 4.4 shows the top 15 ports of exit, ranked by value, for 2007.
Table 4.4: Top 15 Canadian Exports Border Crossings in 2007 by Value
Top 15 Ports of Exit Province
Value
($ Millions
2007 CAD)
% of
Canada
Total
Windsor - Ambassador Bridge Ontario $78,888 17.6%
Sarnia Ontario $51,149 11.4%
Fort Erie Ontario $43,480 9.7%
Vancouver Marine Operations British Columbia $26,214 5.8%
Toronto - Pearson Int. Airport Ontario $19,941 4.4%
Carway Alberta $19,151 4.3%
Lacolle Quebec $18,099 4.0%
Montréal - Main Long Room Quebec $14,602 3.3%
Emerson Manitoba $12,473 2.8%
Coutts Alberta $10,922 2.4%
Pacific Highway British Columbia $10,365 2.3%
Fort Frances Ontario $8,365 1.9%
North Portal Saskatchewan $8,169 1.8%
Lansdowne Ontario $7,805 1.7%
Montréal - Mirabel Int. Airport Quebec $7,505 1.7%
Total of the Top 15 Ports $337,127 75.2%
The most utilized border crossing by value is the Windsor-Ambassador Bridge in Ontario,
exporting 17.6% of Canada’s goods. The next most utilized border crossing by value is Sarnia in
Ontario, exporting 11.4% of Canada’s goods. The third most utilized border crossing by value is
For Erie in Ontario, exporting 9.7% of Canada’s goods.

100
Table 4.5 shows the top 15 ports of exit, ranked by weight, for 2007.
Table 4.5: Top 15 Canadian Exports Border Crossings in 2007 by Weight
Top 15 Ports of Exit Province
Weight
(000s
Tonnes)
% of
Canada
Total
Vancouver Marine Operations British Columbia 74,169 14.1%
Windsor - Ambassador Bridge Ontario 59,082 11.2%
Carway Alberta 33,989 6.5%
Sarnia Ontario 31,708 6.0%
Sept-Îles Quebec 28,858 5.5%
Lacolle Quebec 19,399 3.7%
Emerson Manitoba 17,896 3.4%
Coutts Alberta 17,201 3.3%
Fort Erie Ontario 16,726 3.2%
Fort Frances Ontario 15,945 3.0%
North Portal Saskatchewan 14,140 2.7%
Pacific Highway British Columbia 13,815 2.6%
Kingsgate British Columbia 13,528 2.6%
Halifax Nova Scotia 10,722 2.0%
Monchy Saskatchewan 10,259 1.9%
Total of the Top 15 Ports 377,438 71.7%
The most travelled border crossing by weight is Vancouver Marine Operations in British
Columbia, exporting 14.1% of Canada’s goods. The next most travelled border crossing by
weight is the Windsor-Ambassador Bridge in Ontario, exporting 11.2% of Canada’s goods. The
third most used border crossing by weight is Carway, Alberta, exporting 6.5% of Canada’s
goods.

101
Manitoban Import Border Crossings
The most travelled border crossing by both value and weight is Winnipeg44 with 1.7% of
Canada’s total rail import value, and 7.1% of Canada’s total rail import weight. The second
most travelled border crossing is Emerson with 0.24% of Canada’s total rail import value, and
0.57% of Canada’s total rail import weight. In total, Manitoba accounts for 1.89% of Canada’s
total rail import value, and 7.68% of Canada’s total rail import weight.
Figure 4.36 displays the value and weight of goods that enter Canada by Manitoba’s ports by
rail, regardless of the province of final destination.
Figure 4.36: Rail Imports Border Crossings in Manitoba in 2007
Value Weight
($000’s 2007 CAD) (Tonnes)
44 It is important to note that Winnipeg is a Customs Clearance Point. While technically a border crossing,
it is considered one for the purposes of Customs Canada and Statistics Canada records.
Winnipeg
$517,040
87.41%
Emerson
$74,399
12.58%
Boissevain
$34
0.00%
Winnipeg -
Int. Airport
$12
0.00%
Winnipeg
2,101,812
92.52%
Emerson
169,750
7.47%
Boissevain
78
0.00%
Winnipeg -
Int. Airport
0.3
0.00%

102
The major (by value and weight) border crossings by rail among the western provinces are
displayed in Figure 4.37.
Figure 4.37: Major Rail Imports Border Crossings in 2007 for Canadian Western Provinces
by Value and Weight
British Columbia’s Vancouver – Main Long Room (Van. – MLR) imported 4.2% the value and
6.6% of the weight of Canada’s rail traffic and Kamloops (ranking 2nd in value and 3rd in weight)
handled 0.3% of the value and 0.6% of the weight of Canada’s rail imports. Paterson (ranking 3rd
in value and 2nd in weight) handled 0.2% of the value and 0.6% of the weight of Canada’s rail
imports. British Columbia in total handled 2.5% the value and 4.2% of the weight of Canada’s
rail imports.
Alberta’s Edmonton imported 6.7% the value and 8.0% of the weight of Canada’s rail traffic and
Calgary handled 5.7% of the value and 7.8% of the weight of Canada’s rail imports. Alberta in
total handled 6.4% the value and 8.9% of the weight of Canada’s rail imports.
Saskatchewan’s Regina imported 1.6% the value and 2.9% of the weight of Canada’s rail traffic
and Saskatoon (ranking 2nd in value and 3rd in weight) handled 0.7% of the value and 1.4% of
the weight of Canada’s rail imports. North Portal (ranking 3rd in value and 2nd in weight)
handled 0.1% of the value and 1.5% of the weight of Canada’s rail imports. Saskatchewan in
total handled 1.2% the value and 2.8% of the weight of Canada’s rail imports.
Manitoba’s Winnipeg imported 1.7% the value and 7.1% of the weight of Canada’s rail traffic
and Emerson handled 0.2% of the value and 0.6% of the weight of Canada’s rail imports.
Manitoba in total handled 0.9% the value and 3.8% of the weight of Canada’s rail imports.
$1,3
20,5
11
$90,
251
$46,
955
$2,1
01,3
38
$1,7
81,7
59
$502
,591
$204
,313
$42,
366
$517
,040
$74,
399
1,96
3,00
0
177,
360
181,
220
2,36
6,40
0
2,29
7,10
0
847,
220
399,
440
431,
390
2,10
1,80
0
169,
750
0
500,000
1,000,000
1,500,000
2,000,000
2,500,000V
an. -
ML
R
Kam
loo
ps
Pat
erso
n
Ed
mo
nto
n
Cal
gar
y
Reg
ina
Sas
kat
oo
n
No
rth
Po
rtal
Win
nip
eg
Em
erso
n
BC AB SK MB
$ 00
0s 2
007
CA
D
To
nn
es
Value Weight

103
Figure 4.38 shows the value and weight of imports by the various border crossing points in
Manitoba for 2007. Because Emerson dwarfs the other border crossings with $9.9 billion worth
of 4.0 million tonnes of goods Emerson has been excluded from the chart to give a clearer
picture of the activity in the other border crossings.
Figure 4.38: Rail Imports Border Crossings in Manitoba (Excluding Emerson) in 2007
Value Weight
($000’s 2007 CAD) (Tonnes)
The most travelled border crossing by both value and weight is Emerson with 4.42% of
Canada’s total road import value, and 3.32% of Canada’s total road import weight. The second
most travelled border crossing is Winnipeg with 0.28% of Canada’s total road import value, and
0.29% of Canada’s total road import weight. In total Manitoba accounts for 4.91% of Canada’s
total road import value, and 4.03% of Canada’s total road import weight.
Winnipeg
$619,023
57.22%
Boissevain
$177,329
16.39%
South
Junction
$126,161
11.66%
Other
$159,276
14.72%
Winnipeg
354,469
41.24%
Boissevain
266,273
30.98%
Gretna
140,608
16.36%
Other
98,227
11.43%

104
The major (by value and weight) border crossings by road for the western provinces are
displayed in Figure 4.39.
Figure 4.39: Major Road Imports Border Crossings in 2007 for the Canadian Western
Provinces
by Value and Weight
British Columbia’s Pacific Highway imported 4.7% the value and 5.2% of the weight of
Canada’s road traffic and Vancouver – Main Long Room (Van. – MLR) (ranking 2nd in value and
3rd in weight) handled 1.2% of the value and 0.7% of the weight of Canada’s road imports.
Huntington (ranking 3rd in value and 2nd in weight) handled 0.5% of the value and 0.9% of the
weight of Canada’s road imports. British Columbia in total handled 8.0% the value and 9.7% of
the weight of Canada’s road imports.
Alberta’s Coutts imported 2.9% the value and 2.1% of the weight of Canada’s road traffic and
Edmonton handled 0.3% of the value and 0.2% of the weight of Canada’s road imports. Alberta
in total handled 3.5% the value and 2.5% of the weight of Canada’s road imports.
Saskatchewan’s North Portal imported 2.5% the value and 1.7% of the weight of Canada’s road
traffic and Regina (ranking 2nd in value and 3rd in weight) handled 0.04% of the value and 0.19%
of the weight of Canada’s road imports. Regway (ranking 3rd in value and 2nd in weight)
handled 0.1% of the value and 0.1% of the weight of Canada’s road imports. Saskatchewan in
total handled 2.6% the value and 2.0% of the weight of Canada’s road imports.
$10,
529,
348
$2,7
56,9
36
$1,1
78,3
55
$6,6
07,9
59
$748
,202
$5,5
99,0
39
$95,
003
$142
,740
$9,9
34,9
09
$619
,023
6,30
1,30
0
802,
120
1,07
9,60
0
2,58
9,40
0
215,
620
2,11
2,70
0
227,
080
90,4
23
4,04
5,80
0
354,
470
0
2,000,000
4,000,000
6,000,000
8,000,000
10,000,000
12,000,000
Pac
ific
Hig
hw
ay
Van
. -M
LR
Hu
nti
ng
ton
Co
utt
s
Ed
mo
nto
n
No
rth
Po
rtal
Reg
ina
Reg
way
Em
erso
n
Win
nip
eg
BC AB SK MB
$ 00
0s 2
007
CA
D
To
nn
es
Value Weight

105
Manitoba’s Emerson imported 4.4% the value and 3.3% of the weight of Canada’s road traffic
and Winnipeg handled 0.3% of the value and 0.3% of the weight of Canada’s road imports.
Manitoba in total handled 4.9% the value and 4.1% of the weight of Canada’s road imports.
Canadian Import Border Crossings
There are some border crossings that are more popular than others, due to efficiencies, location,
or other factors.
Table 4.6 shows the top 15 ports of clearance, ranked by value, for 2007.
Table 4.6: Top 15 Canadian Imports Border Crossings in 2007 by Value
Top 15 Ports of Exit Province
Value
($ Millions
2007 CAD)
% of
Canada
Total
Windsor - Ambassador Bridge Ontario $69,315 17.1%
Sarnia Ontario $37,806 9.3%
Toronto - Pearson Int. Airport Ontario $35,245 8.7%
Montréal - Main Long Room Quebec $31,734 7.8%
Toronto - Main Long Room Ontario $27,014 6.6%
Fort Erie Ontario $20,386 5.0%
Vancouver - Main Long Room British Columbia $18,562 4.6%
Niagara Falls Ontario $13,011 3.2%
Montreal-Pierre Elliott
Trudeau-International Airport Quebec $11,970 2.9%
Pacific Highway British Columbia $10,660 2.6%
Windsor - Main Long Room Ontario $10,605 2.6%
Emerson Manitoba $10,095 2.5%
Hamilton Ontario $8,607 2.1%
Lacolle Quebec $8,303 2.0%
Québec Quebec $7,676 1.9%
Total of the Top 15 Ports $320,988 79.0%
The most travelled border crossing by value is the Windsor-Ambassador Bridge in Ontario,
importing 17.1% of Canada’s goods. The next most travelled border crossing by value is Sarnia
in Ontario, importing 9.3% of Canada’s goods. The third most used border crossing by value is
Toronto-Pearson Airport in Ontario, importing 8.7% of Canada’s goods.

106
Table 4.7 shows the top 15 ports of clearance, ranked by weight, for 2007.
Table 4.7: Top 15 Canadian Imports Border Crossings in 2007 by Weight
Top 15 Ports of Exit Province
Weight
(000s
Tonnes)
% of
Canada
Total
Montréal - Main Long Room Quebec 31,547 10.2%
Windsor - Ambassador Bridge Ontario 30,618 9.9%
Sarnia Ontario 25,846 8.4%
Niagara Falls Ontario 21,120 6.8%
Hamilton Ontario 20,781 6.7%
Sault Ste. Marie Ontario 18,699 6.1%
Halifax Nova Scotia 17,024 5.5%
Québec Quebec 13,568 4.4%
Toronto - Main Long Room Ontario 11,812 3.8%
Vancouver - Main Long Room British Columbia 10,321 3.3%
Fort Erie Ontario 8,739 2.8%
Saint John New Brunswick 7,730 2.5%
Pacific Highway British Columbia 6,377 2.1%
Toronto - Pearson Int. Airport Ontario 6,067 2.0%
Ontario Ontario 5,034 1.6%
Total of the Top 15 Ports 235,283 76.2%
The most travelled border crossing by weight is Montréal Main Long Room in Quebec,
importing 10.2% of Canada’s goods. The next most travelled border crossing by weight is
Windsor - Ambassador Bridge Ontario, importing 9.9% of Canada’s goods. The third most used
border crossing by weight is Sarnia Ontario, importing 8.4% of Canada’s goods.
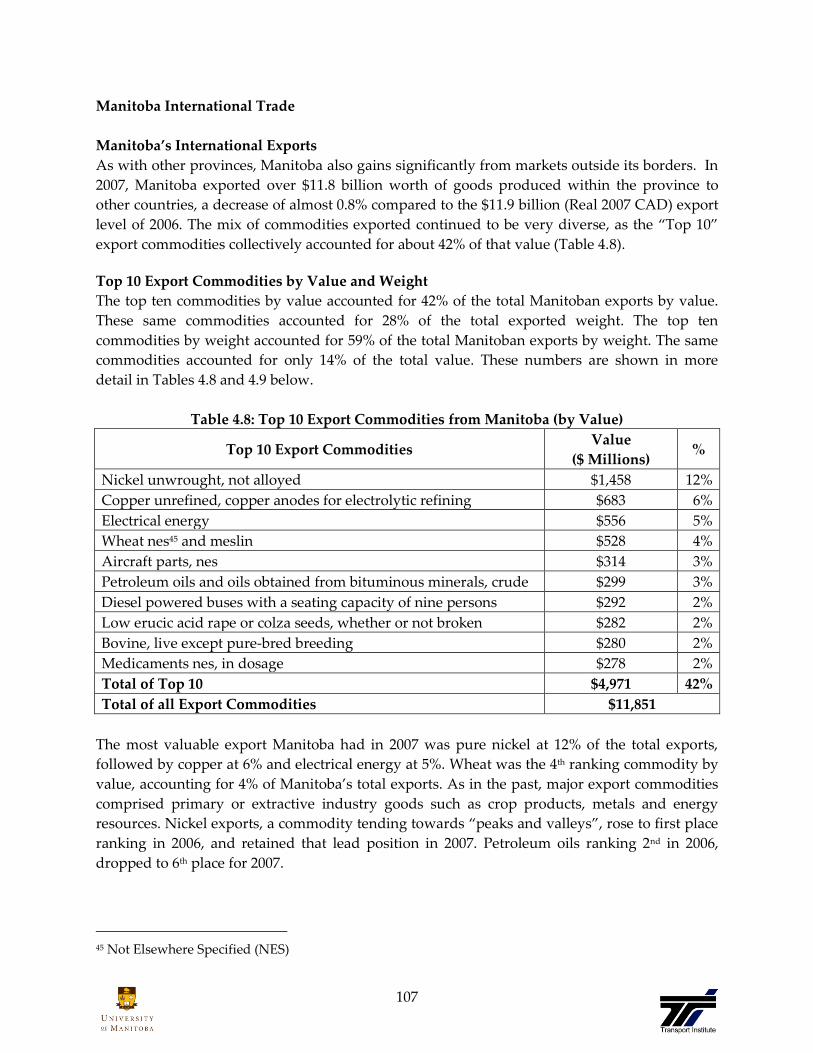
107
Manitoba International Trade
Manitoba’s International Exports
As with other provinces, Manitoba also gains significantly from markets outside its borders. In
2007, Manitoba exported over $11.8 billion worth of goods produced within the province to
other countries, a decrease of almost 0.8% compared to the $11.9 billion (Real 2007 CAD) export
level of 2006. The mix of commodities exported continued to be very diverse, as the ‚Top 10‛
export commodities collectively accounted for about 42% of that value (Table 4.8).
Top 10 Export Commodities by Value and Weight
The top ten commodities by value accounted for 42% of the total Manitoban exports by value.
These same commodities accounted for 28% of the total exported weight. The top ten
commodities by weight accounted for 59% of the total Manitoban exports by weight. The same
commodities accounted for only 14% of the total value. These numbers are shown in more
detail in Tables 4.8 and 4.9 below.
Table 4.8: Top 10 Export Commodities from Manitoba (by Value)
Top 10 Export Commodities Value
($ Millions) %
Nickel unwrought, not alloyed $1,458 12%
Copper unrefined, copper anodes for electrolytic refining $683 6%
Electrical energy $556 5%
Wheat nes45 and meslin $528 4%
Aircraft parts, nes $314 3%
Petroleum oils and oils obtained from bituminous minerals, crude $299 3%
Diesel powered buses with a seating capacity of nine persons $292 2%
Low erucic acid rape or colza seeds, whether or not broken $282 2%
Bovine, live except pure-bred breeding $280 2%
Medicaments nes, in dosage $278 2%
Total of Top 10 $4,971 42%
Total of all Export Commodities $11,851
The most valuable export Manitoba had in 2007 was pure nickel at 12% of the total exports,
followed by copper at 6% and electrical energy at 5%. Wheat was the 4th ranking commodity by
value, accounting for 4% of Manitoba’s total exports. As in the past, major export commodities
comprised primary or extractive industry goods such as crop products, metals and energy
resources. Nickel exports, a commodity tending towards ‚peaks and valleys‛, rose to first place
ranking in 2006, and retained that lead position in 2007. Petroleum oils ranking 2nd in 2006,
dropped to 6th place for 2007.
45 Not Elsewhere Specified (NES)

108
Table 4.9 shows the top 10 export commodities leaving Manitoba by weight.
Table 4.9: Top 10 Export Commodities from Manitoba (by Weight)
Top 10 Export Commodities Weight
(Tonnes) %
Wheat nes and meslin 2,002,378 16%
Low value transactions and confidential commodities 1,405,425 11%
Axles and wheels and parts 1,020,608 8%
Low erucic acid rape or colza seeds, whether or not broken 667,819 5%
Petroleum oils and oils obtained from bituminous minerals, crude 560,268 4%
Oats 439,154 4%
Rape/colza seed oil-cake of low erucic acid & o solid
residue,w/n ground/pellet 370,692 3%
Potatoes prepared or preserved other than by vinegar or acetic
acid, frozen 332,774 3%
Urea/ammonium nitrate mx in aqueous or ammoniacal sol in pack
of > 10 kg 314,069 3%
Low erucic acid rape (canola) or colza oil and its fractions, refined 233,309 2%
Total of Top 10 7,346,498 59%
Total of all Export Commodities 12,493,201
In 2007, Manitoba’s largest export (in terms of tonnage) was wheat. This accounted for
approximately 16% of the total tonnage of all exports leaving Manitoba. This was followed by
exports of ‚low value transactions and confidential commodities (approximately 11% of the
total Manitoba export tonnage), automobile parts (approximately 8%) and canola seeds
(approximately 5%). Overall, Manitoba exported approximately 12.4 million tonnes in 2007.
Oats exports while holding 4th place in 2006, dropped to 6th place in 2007. Low erucic acid rape
of colza seeds (also called canola) held 3rd place in 2006 and dropped to 4th place in 2007.
Petroleum oils ranking 2nd in 2006, dropped to 5th place for 2007.
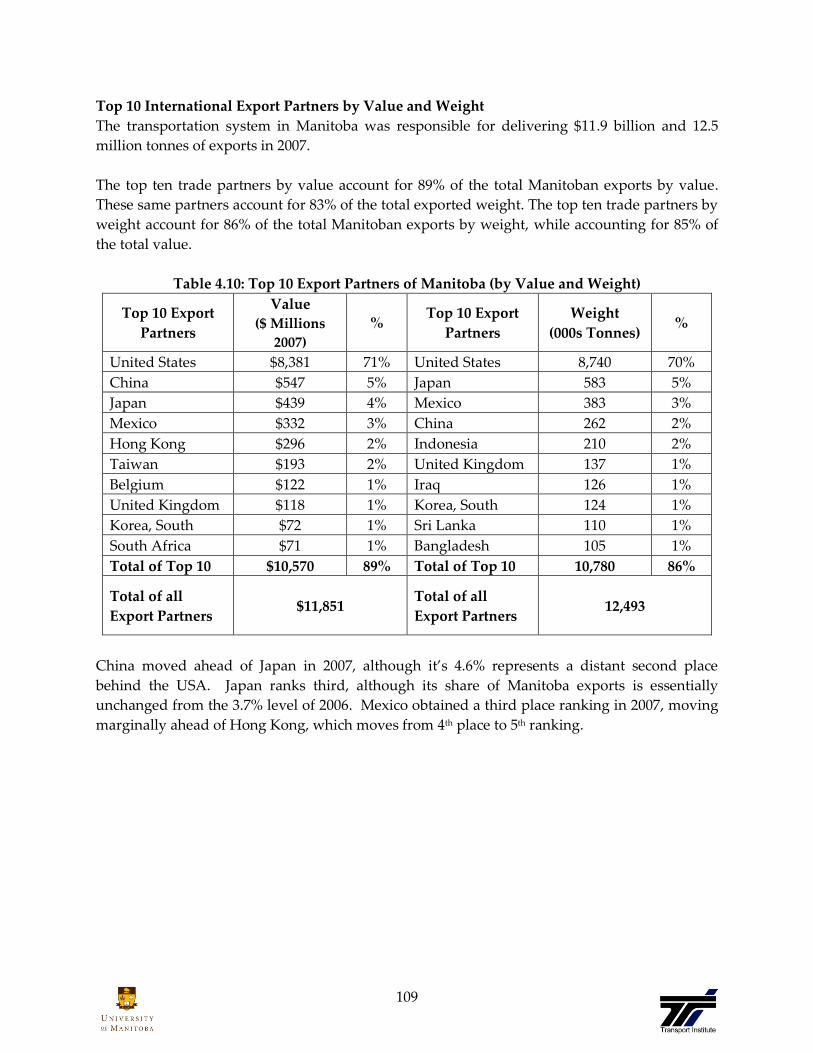
109
Top 10 International Export Partners by Value and Weight
The transportation system in Manitoba was responsible for delivering $11.9 billion and 12.5
million tonnes of exports in 2007.
The top ten trade partners by value account for 89% of the total Manitoban exports by value.
These same partners account for 83% of the total exported weight. The top ten trade partners by
weight account for 86% of the total Manitoban exports by weight, while accounting for 85% of
the total value.
Table 4.10: Top 10 Export Partners of Manitoba (by Value and Weight)
Top 10 Export
Partners
Value
($ Millions
2007)
% Top 10 Export
Partners
Weight
(000s Tonnes) %
United States $8,381 71% United States 8,740 70%
China $547 5% Japan 583 5%
Japan $439 4% Mexico 383 3%
Mexico $332 3% China 262 2%
Hong Kong $296 2% Indonesia 210 2%
Taiwan $193 2% United Kingdom 137 1%
Belgium $122 1% Iraq 126 1%
United Kingdom $118 1% Korea, South 124 1%
Korea, South $72 1% Sri Lanka 110 1%
South Africa $71 1% Bangladesh 105 1%
Total of Top 10 $10,570 89% Total of Top 10 10,780 86%
Total of all
Export Partners $11,851
Total of all
Export Partners 12,493
China moved ahead of Japan in 2007, although it’s 4.6% represents a distant second place
behind the USA. Japan ranks third, although its share of Manitoba exports is essentially
unchanged from the 3.7% level of 2006. Mexico obtained a third place ranking in 2007, moving
marginally ahead of Hong Kong, which moves from 4th place to 5th ranking.
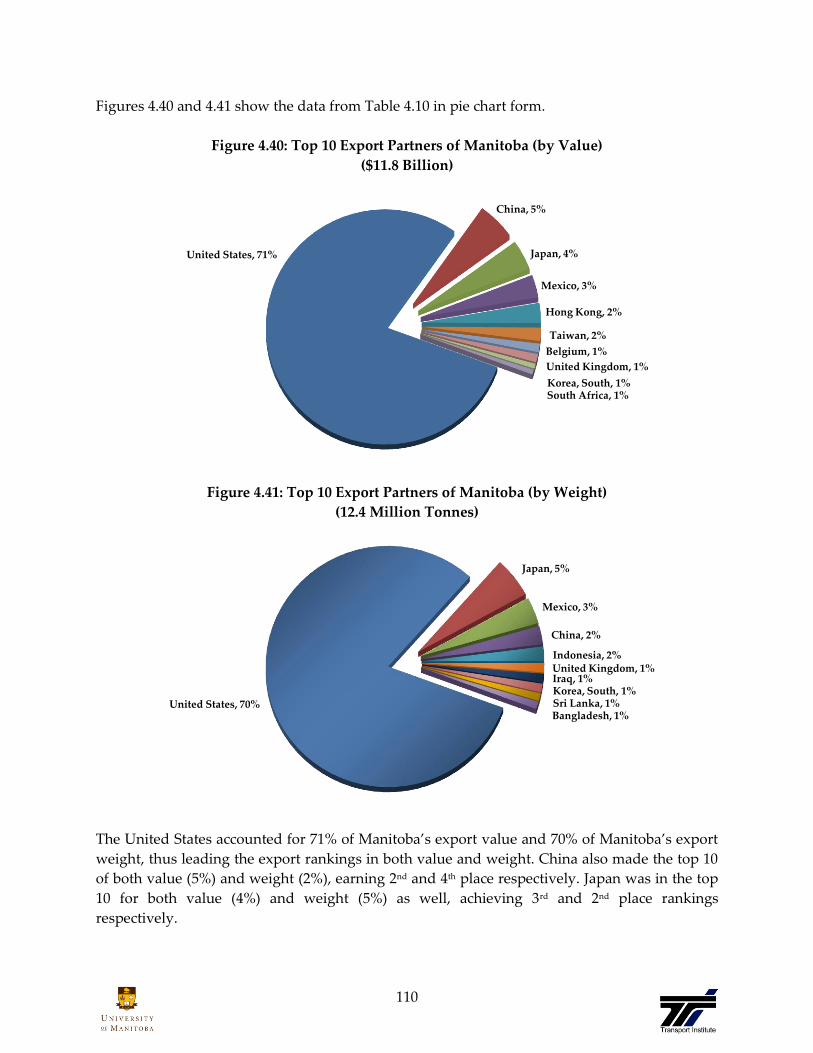
110
Figures 4.40 and 4.41 show the data from Table 4.10 in pie chart form.
Figure 4.40: Top 10 Export Partners of Manitoba (by Value)
($11.8 Billion)
Figure 4.41: Top 10 Export Partners of Manitoba (by Weight)
(12.4 Million Tonnes)
The United States accounted for 71% of Manitoba’s export value and 70% of Manitoba’s export
weight, thus leading the export rankings in both value and weight. China also made the top 10
of both value (5%) and weight (2%), earning 2nd and 4th place respectively. Japan was in the top
10 for both value (4%) and weight (5%) as well, achieving 3rd and 2nd place rankings
respectively.
United States, 71%
China, 5%
Japan, 4%
Mexico, 3%
Hong Kong, 2%
Taiwan, 2%
Belgium, 1%
United Kingdom, 1%
Korea, South, 1%South Africa, 1%
United States, 70%
Japan, 5%
Mexico, 3%
China, 2%
Indonesia, 2%United Kingdom, 1%Iraq, 1%Korea, South, 1%Sri Lanka, 1%Bangladesh, 1%

111
China’s share of Manitoba’s exports by weight falls well short of China’s share of Manitoba’s
exports by value, suggesting that, on average, China is the recipient of higher value (per weight)
products.
Mode of International Exports for Manitoba in 2007
The mode by which an item gets to its location can be as important as the location itself. In the
case of 2007, the primary mode of transportation out of Manitoba by value was road, capturing
47% of the total value and 25% of the total weight. This indicates that the commodities are
travelling a relatively short distance and are heavy enough to exclude air transportation, but
valuable enough to warrant a truck rather than the bulk-haul rail system. Rail accounted for
roughly 17% of the value and 29% of the weight of exports of 2007. Water transportation from
Manitoba was used for 24% of the value and 29% of the weight. Air transportation was the least
utilized mode of transportation, capturing only 4% of the value and 1% of the weight. Pipeline
& Energy transmission accounted for 7% of the value. The ‚other‛ category was used for the
remaining 1% of the value and 11% of the weight.
Figure 4.42: Manitoba’s Mode of Exports (by Value and Weight)
Value Weight
($11.8 Billion) (12.4 Million Tonnes)
Between 2006 and 2007 very little changed in respect to the modal breakdown by value. The
modes of road and rail each increased by 2%, while the modes of air, water, and power and
pipeline declined by 1%, 2%, and 3% respecitively. The level of transports classified as ‚other‛
did not change.
In terms of weight, the proportion of tonnage shipped by air (1%) has not changed from 2006.
Water and rail seem to have traded places between 2006 and 2007; in 2006 water accounted for
43% of exports by weight and rail accounted for 25%; in 2007 those numbers were exactly
reversed. Road inceased by 4% from 21% and pipeline (power and pipeline) dropped by 4%.
Air, 4%
Other, 1%
Pipeline &
Energy, 7%
Rail, 17%
Road, 47%
Water, 24%Air, 1%
Other, 11%
Pipeline &
Energy, 4%
Rail, 30%
Road, 25%
Water, 29%

112
Mode of Exports for Manitoba Historic Comparison
The modal shift in Manitoba has been a slow process over many years. This chart shows that the
relative importance of the different modes has not changed much in terms of value in the past 5
years. Figure 4.43 displays the relative value of the modes of export from 2000 to 2007.
Figure 4.43: Manitoba’s Modes of Exports Historical (by Value)
The two modes to decrease in exports value were road and other, while all other modes enjoyed
slight increases. Figure 4.44 displays the relative weight of the modes of export from 2000 to
2007
Figure 4.44: Manitoba’s Modes of Exports Historical (by Weight)
$0
$1,000
$2,000
$3,000
$4,000
$5,000
$6,000
$7,000
$8,000
2000 2001 2002 2003 2004 2005 2006 2007
$ M
illi
on
s (2
007)
CA
D
Air Other Rail Road Water
-
1,000
2,000
3,000
4,000
5,000
6,000
7,000
2000 2001 2002 2003 2004 2005 2006 2007
000s
To
nn
es
Air Other Rail Road Water

113
The variation by mode in terms of weight is much more pronounced than by value. The ‚other‛
mode has been decreasing the weight shipped since 2002, with a slight upturn in 2005 and 2006.
The weight shipped by water went up between 2002 and 2004, dropped slightly in 2005 and
again in 2007. The rail mode has enjoyed continual growth with 2007 being a year of dramatic
increase.
Manitoba’s International Imports
Due to the difficulty of tracking a single item past the port of clearance it is important to note
that these imports are merely imports to Canada that use Manitoba as a port of clearance.
Top 10 Import Commodities by Value and Weight
Tables 4.11and 4.12 display the top 10 commodities imported through Manitoba based on value
and weight, respectively.
Table 4.11: Top 10 Import Commodities to Manitoba (by Value)
Top 10 Import Commodities Value
($ Millions 2007) %
Dump trucks designed for off-highway use $281 2%
Wheeled tractors nes $218 2%
Newspapers, journals and periodicals, nes $217 2%
Parts of turbo-jets or turbo-propellers $173 1%
Snowmobiles, golf cars and similar vehicles $162 1%
Automobiles with reciprocating piston engine displacing not more
than 1000 cc $149 1%
Front end shovel loaders $147 1%
Herbicide, anti-sprouting & plant-growth regs, forms/pack f
retail sale or prep/art $142 1%
Machinery, plant or laboratory equip for treat of mat by a change
of temp nes $137 1%
Parts of cranes, work-trucks, shovels, and other construction
machinery $137 1%
Total of Top 10 $1,763 13%
Total of all Import Commodities $13,143
The most valuable import Manitoba had in 2007 were dump trucks at 2% of the total value of
imports, followed by wheeled tractors (2%), newspapers and journals (2%), parts of turbo-jets
(1%) and snowmobiles (1%). In 2007, the value of Manitoba’s imports exceeded the value of
Manitoba exports by about 9%. The single largest group of imports into Manitoba, ‚dump
trucks designed for off-highway use‛ account for about 2.1% of Manitoba’s imports by value
(up fractionally from 1.7% in 2006). Wheeled tractors held at 1.7% of the total imports, while
rising in the ranks from 3rd place in 2006 to 2nd place in 2007. Parts for turbo props and turbo jets
rose from 8th place in 2006 at 1.2% of the total imports to 4th place and 1.3% of the total imports.
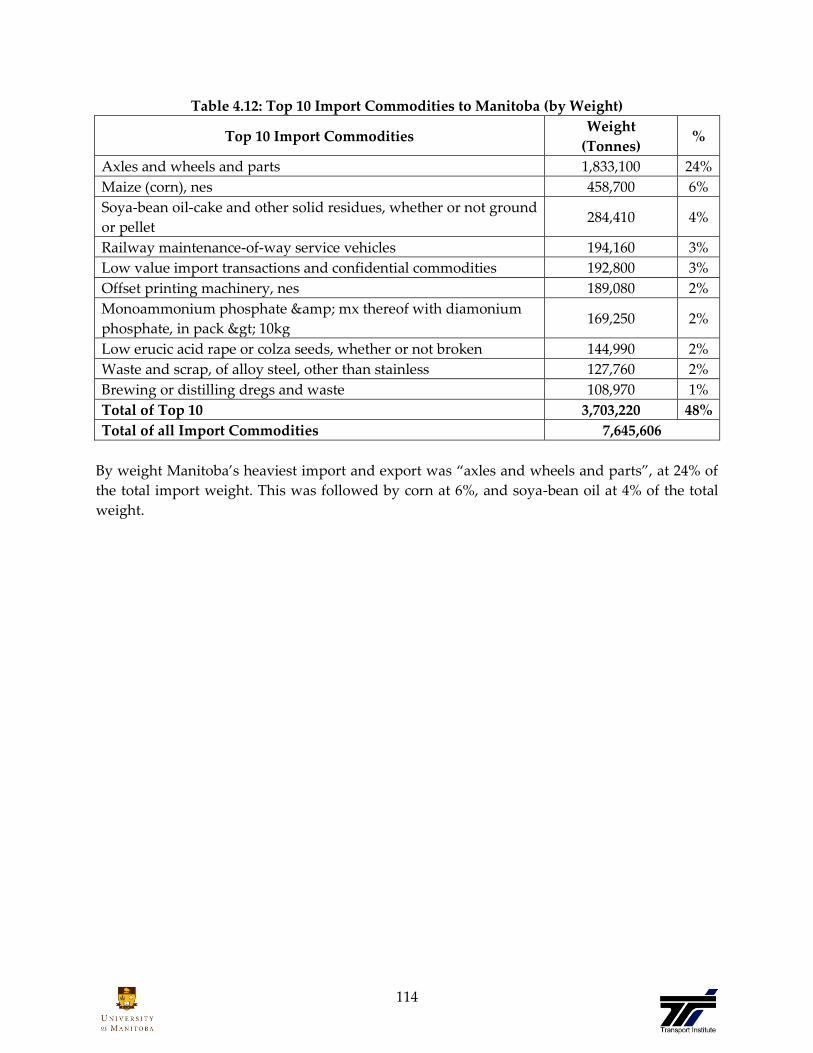
114
Table 4.12: Top 10 Import Commodities to Manitoba (by Weight)
Top 10 Import Commodities Weight
(Tonnes) %
Axles and wheels and parts 1,833,100 24%
Maize (corn), nes 458,700 6%
Soya-bean oil-cake and other solid residues, whether or not ground
or pellet 284,410 4%
Railway maintenance-of-way service vehicles 194,160 3%
Low value import transactions and confidential commodities 192,800 3%
Offset printing machinery, nes 189,080 2%
Monoammonium phosphate & mx thereof with diamonium
phosphate, in pack > 10kg 169,250 2%
Low erucic acid rape or colza seeds, whether or not broken 144,990 2%
Waste and scrap, of alloy steel, other than stainless 127,760 2%
Brewing or distilling dregs and waste 108,970 1%
Total of Top 10 3,703,220 48%
Total of all Import Commodities 7,645,606
By weight Manitoba’s heaviest import and export was ‚axles and wheels and parts‛, at 24% of
the total import weight. This was followed by corn at 6%, and soya-bean oil at 4% of the total
weight.
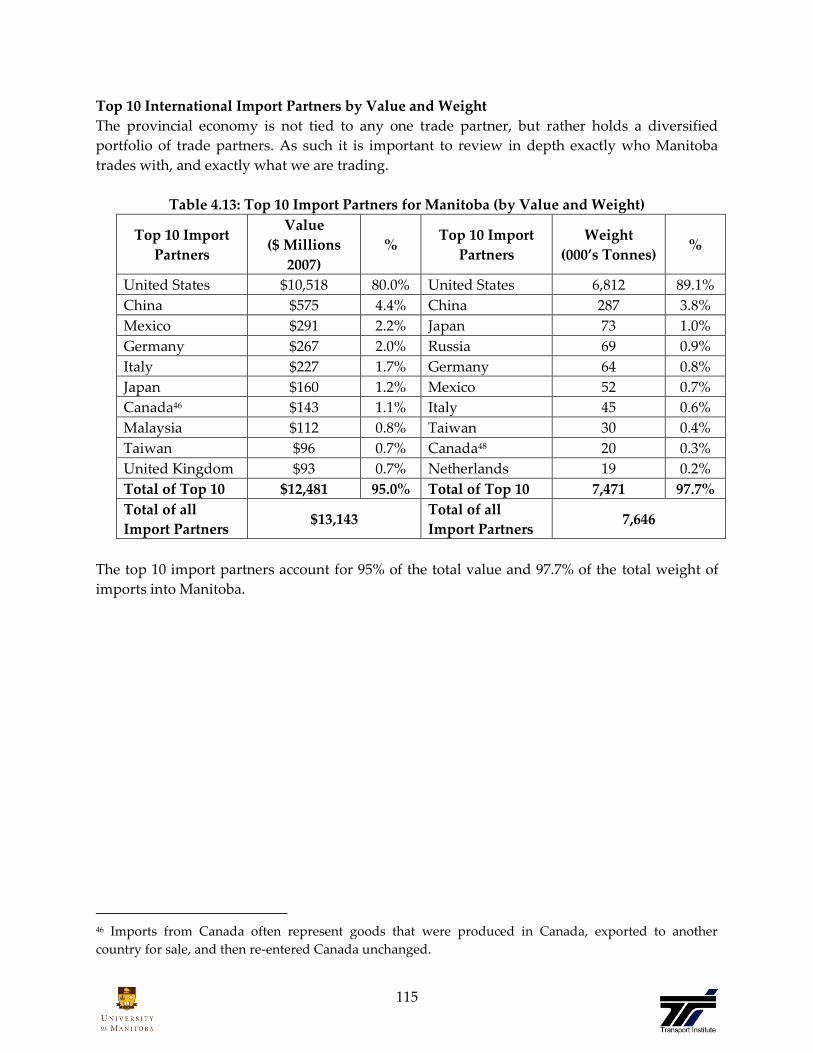
115
Top 10 International Import Partners by Value and Weight
The provincial economy is not tied to any one trade partner, but rather holds a diversified
portfolio of trade partners. As such it is important to review in depth exactly who Manitoba
trades with, and exactly what we are trading.
Table 4.13: Top 10 Import Partners for Manitoba (by Value and Weight)
Top 10 Import
Partners
Value
($ Millions
2007)
% Top 10 Import
Partners
Weight
(000’s Tonnes) %
United States $10,518 80.0% United States 6,812 89.1%
China $575 4.4% China 287 3.8%
Mexico $291 2.2% Japan 73 1.0%
Germany $267 2.0% Russia 69 0.9%
Italy $227 1.7% Germany 64 0.8%
Japan $160 1.2% Mexico 52 0.7%
Canada46 $143 1.1% Italy 45 0.6%
Malaysia $112 0.8% Taiwan 30 0.4%
Taiwan $96 0.7% Canada48 20 0.3%
United Kingdom $93 0.7% Netherlands 19 0.2%
Total of Top 10 $12,481 95.0% Total of Top 10 7,471 97.7%
Total of all
Import Partners $13,143
Total of all
Import Partners 7,646
The top 10 import partners account for 95% of the total value and 97.7% of the total weight of
imports into Manitoba.
46 Imports from Canada often represent goods that were produced in Canada, exported to another
country for sale, and then re-entered Canada unchanged.

116
Figures 4.45 and 4.46 show the Top 10 Import Partners for Manitoba by value and weight
respectively.
Figure 4.45: Top 10 Import Partners of Manitoba (by Value)
($13.1 Billion)
Figure 4.46: Top 10 Import Partners of Manitoba (by Weight)
(7.6 Million Tonnes)
The United States accounted for 80% of Manitoba’s import value and 89% of Manitoba’s import
weight, thus leading the import rankings in both value and weight. China reached the list of the
top 10 with 4% of the total value and 4% of the total weight of Manitoba’s imports ranking 2nd
overall. Japan achieved 6th and 3rd place ranking for value and weight respectively with 1% and
1%.
United States, 80%
China, 4%
Mexico, 2%
Germany, 2%
Italy, 2%Japan, 1%Canada, 1%Malaysia, 1%Taiwan, 1%
United Kingdom, 1%
United States, 89%
China, 4%
Japan, 1%Russia, 1%Germany, 1%Mexico, 1%Italy, 1%Taiwan, 0.4%Canada, 0.3%Netherlands, 0.2%

117
Mode of International Imports for Manitoba in 2007
The mode by which an item gets to its location can be as important as the location itself. In the
case of 2007 the primary mode of transportation into Manitoba was Road, capturing 84% of the
total value and 65% of the total weight. Rail accounted for roughly 5% of the value and 30% of
the weight of imports in 2007. Water transportation to Manitoba, was responsible for 3% of the
value and 3% of the weight. Air transportation was utilized for 7% of the value and 1% of the
weight. Pipeline & Energy transmission was responsible for less than 1% of the value of the
total imports. The ‚Other‛ category captured the remaining 1% of the value and 1% of the
weight.
Figure 4.47: Manitobas Modes of Imports (by Value and Weight)
Value Weight
($13.1 Billion) (7.6 Million Tonnes)
Between 2006 and 2007 very little changed in respect to the modal breakdown by value. The
value of road imports decreased by 1%, and the air mode has increased by 1%, no other mode
had much change. The mode of road increased weight traffic by 2%, pipeline decreased by less
than 1%, the other mode has decreased by 2%, and water, rail and air modes did not change.
Air, 7%
Other, 1%
Pipeline &
Energy, 0.4%
Rail, 5%
Road, 84%Water, 3%
Air, 1%Other, 1%
Pipeline &
Energy, 0.6%
Rail, 30%
Road, 65%
Water, 3%
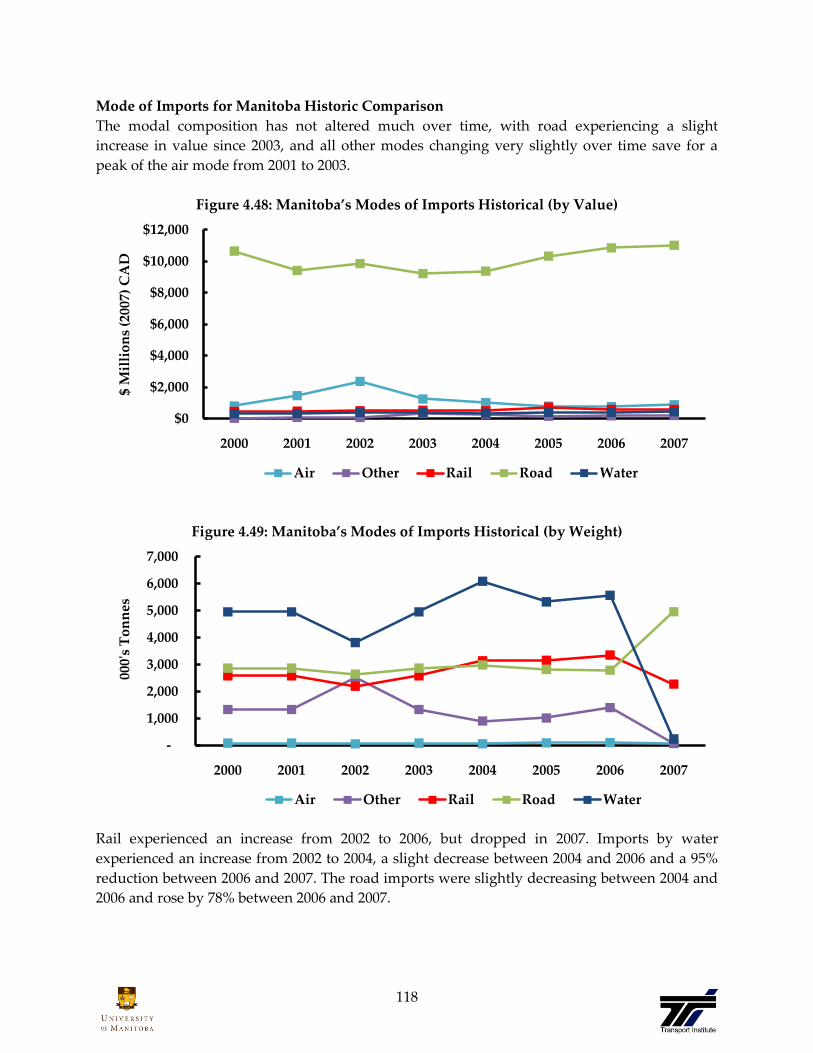
118
Mode of Imports for Manitoba Historic Comparison
The modal composition has not altered much over time, with road experiencing a slight
increase in value since 2003, and all other modes changing very slightly over time save for a
peak of the air mode from 2001 to 2003.
Figure 4.48: Manitoba’s Modes of Imports Historical (by Value)
Figure 4.49: Manitoba’s Modes of Imports Historical (by Weight)
Rail experienced an increase from 2002 to 2006, but dropped in 2007. Imports by water
experienced an increase from 2002 to 2004, a slight decrease between 2004 and 2006 and a 95%
reduction between 2006 and 2007. The road imports were slightly decreasing between 2004 and
2006 and rose by 78% between 2006 and 2007.
$0
$2,000
$4,000
$6,000
$8,000
$10,000
$12,000
2000 2001 2002 2003 2004 2005 2006 2007
$ M
illi
on
s (2
007)
CA
D
Air Other Rail Road Water
-
1,000
2,000
3,000
4,000
5,000
6,000
7,000
2000 2001 2002 2003 2004 2005 2006 2007
000'
s T
on
nes
Air Other Rail Road Water

119
NASCO Trade
This section is dedicated to the North American Super Corridor Coalition (NASCO), analyzing
the most common cross-border trade partners and what commodities and modes are most
common in these trades.
The NASCO corridor connects a wide array of rail services. In Canada, this includes both the
Canadian National and Canadian Pacific railways. In the United States, the Union Pacific,
Kansas City Southern, Burlington Northern Santa Fe, and Canadian National railways. In
Mexico, the Kansas City Southern and Ferromex rails. The main highways of the NASCO are
Highway 1 and Manitoba Highway 75 in Canada, the I-35, I-94 and I-29 in the United States and
in Mexico the 80, 86, 40, 57, and the 70. Not to mention connecting numerous cities, ports, and
inland ports (6 of the 9 inland ports in the United States are part of the corridor). The American
states in the corridor are Illinois, Indiana, Iowa, Kansas, Michigan, Minnesota, Missouri,
Nebraska, North and South Dakota, Oklahoma, Texas, and Wisconsin. In Canada the NASCO
connection is Manitoba, making Manitoba perfectly situated for cross-border trade with both
the United States and Mexico.
Exports47
Figure 4.50 displays the value of Manitoba exports by road to the NASCO member states.
Figure 4.50: Manitoba Exports to NASCO Partners, by Road
($ Millions 2007 CAD)
47 Exports refer to goods which depart through Manitoba borders. Some of these goods originate from
other Canadian provinces.
$5,943
$5,009 $5,063
$4,732
$4,452 $4,480
66.7%
63.5% 63.7%
62.2%
58.6%
62.3%
54.0%
56.0%
58.0%
60.0%
62.0%
64.0%
66.0%
68.0%
$4,000
$4,500
$5,000
$5,500
$6,000
$6,500
2002 2003 2004 2005 2006 2007
$ M
illi
on
s (2
007)
CA
D
Total Road Exports to NASCO % of Total Road Exports to United States

120
In 2007, road exports to the NASCO members were valued at over $4.4 billion. Of these,
approximately 98.0% were destined to the United States. Over the previous five years, the
export value of NASCO road traffic has been decreasing, declining by 24.6% since 2002.
Exports by road to the NASCO states have annually averaged 62.8% of the total road exports to
the United States through Manitoba borders (between 2002 and 2007). Figure 4.51 displays the
distribution of NASCO exports by road in millions of 2007 CAD.
Figure 4.51: Distribution of NASCO Exports from Manitoba, by Road
($ Millions 2007 CAD)
In 2007 the majority of Manitoba’s NASCO exports were to Minnesota, North Dakota, Illinois,
Nebraska, Iowa and Texas. Together, these 6 states made up over 45% of the road export traffic
to the NASCO states in 2007. Between 2006 and 2007, the (value) growth of goods cleared
through Manitoba (to NASCO members), ranged from -19.3% (Illinois) to 33.0% (Nebraska).
Overall, the total value of goods exported to the NASCO partners through Manitoba increased
by approximately 0.63%.
Between 2002 and 2007, (road) exports to Minnesota have experienced a decline of
approximately 40.3%. This appears to be primarily due to a decrease in exports of buses and
motor coaches. The largest commodity (based on value) exported to Minnesota was classified as
‚bodies for tractors, buses, trucks and special purpose vehicles‛ (approximately 14.2% of total
export value to Minnesota in 2007). Overall, exports of this commodity have declined by 17.4%
over the past five years. In addition, the export of engines (class 250cc-1000cc) have declined by
80.2% since 2002.
$-
$200
$400
$600
$800
$1,000
$1,200
$1,400
$1,600
$ M
illi
on
s (2
007)
CA
D
2002 2003 2004 2005 2006 2007
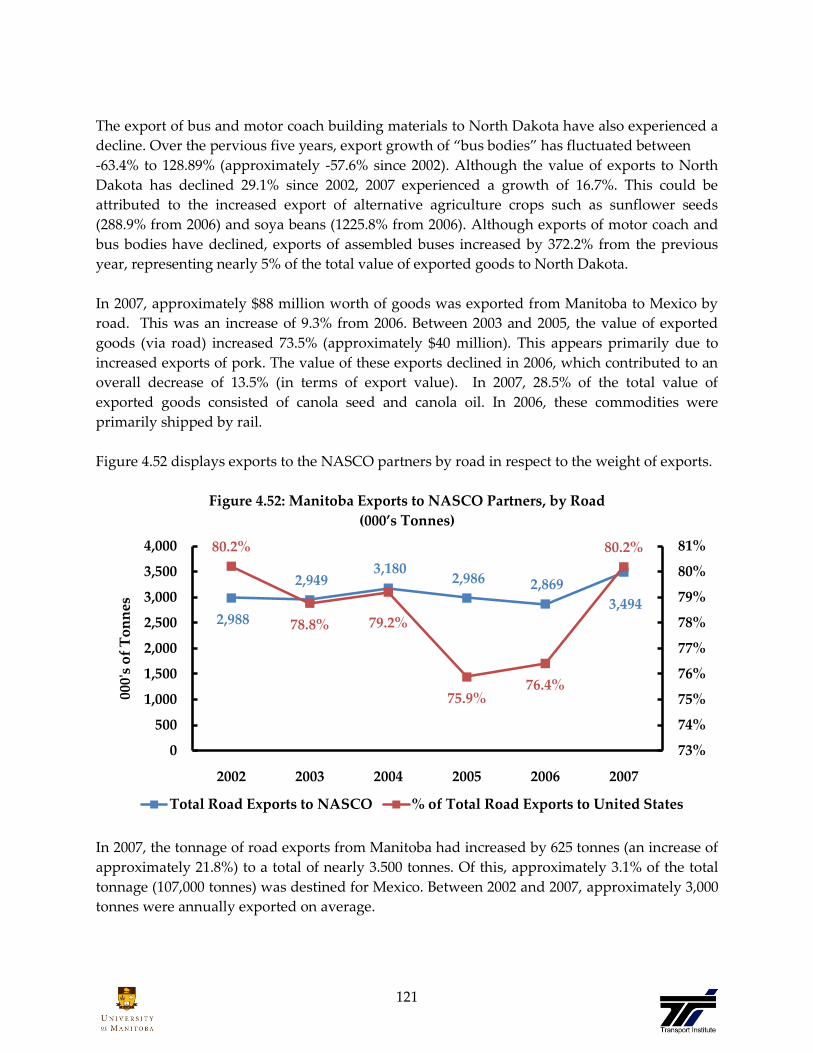
121
The export of bus and motor coach building materials to North Dakota have also experienced a
decline. Over the pervious five years, export growth of ‚bus bodies‛ has fluctuated between
-63.4% to 128.89% (approximately -57.6% since 2002). Although the value of exports to North
Dakota has declined 29.1% since 2002, 2007 experienced a growth of 16.7%. This could be
attributed to the increased export of alternative agriculture crops such as sunflower seeds
(288.9% from 2006) and soya beans (1225.8% from 2006). Although exports of motor coach and
bus bodies have declined, exports of assembled buses increased by 372.2% from the previous
year, representing nearly 5% of the total value of exported goods to North Dakota.
In 2007, approximately $88 million worth of goods was exported from Manitoba to Mexico by
road. This was an increase of 9.3% from 2006. Between 2003 and 2005, the value of exported
goods (via road) increased 73.5% (approximately $40 million). This appears primarily due to
increased exports of pork. The value of these exports declined in 2006, which contributed to an
overall decrease of 13.5% (in terms of export value). In 2007, 28.5% of the total value of
exported goods consisted of canola seed and canola oil. In 2006, these commodities were
primarily shipped by rail.
Figure 4.52 displays exports to the NASCO partners by road in respect to the weight of exports.
Figure 4.52: Manitoba Exports to NASCO Partners, by Road
(000’s Tonnes)
In 2007, the tonnage of road exports from Manitoba had increased by 625 tonnes (an increase of
approximately 21.8%) to a total of nearly 3.500 tonnes. Of this, approximately 3.1% of the total
tonnage (107,000 tonnes) was destined for Mexico. Between 2002 and 2007, approximately 3,000
tonnes were annually exported on average.
2,988
2,949 3,180
2,986 2,869
3,494
80.2%
78.8% 79.2%
75.9%76.4%
80.2%
73%
74%
75%
76%
77%
78%
79%
80%
81%
0
500
1,000
1,500
2,000
2,500
3,000
3,500
4,000
2002 2003 2004 2005 2006 2007
000'
s o
f T
on
nes
Total Road Exports to NASCO % of Total Road Exports to United States

122
The tonnage of road exports leaving from Manitoba to the NASCO states represented
approximately 80.2% of the total tonnage destined for the United States in 2007. Over the last
five years, the annual exported tonnage to the NASCO states has represented between 76-80%
of the total weight of United States destined exports, cleared through Manitoba.
Figure 4.53 displays the distribution of the NASCO exports by road through Manitoba to each
of the NASCO partners.
Figure 4.53: Distribution of NASCO Exports from Manitoba, by Road
(000’s Tonnes)
In 2007, the tonnage of road exports to North Dakota, Minnesota, Illinois, and South Dakota
represented approximately 63.7% of NASCO road export tonnage and 52.8% of total road
export tonnage from Manitoba to the United States. Overall, the tonnage of NASCO road
exports increased by 21.8% from 2006. Each of the NASCO members experienced positive
growth levels ranging from 7.4% (Texas) to 58.4% (Mexico).
Export tonnage to Mexico increased by 58.4% in 2007. This is largely attributed to the increased
export of canola seed and canola oil.
Overall, major commdoities (in terms of tonnage) exported by road from Manitoba included
livestock (e.g. swine, bovine, etc.), agriculture products (e.g. soya beans, sunflower seeds,
potatoes, canola, etc.), petroleum and fossil fuels, and timber and forestry products.
0
100
200
300
400
500
600
700
800
900
1,000
000'
s o
f T
on
nes
2002 2003 2004 2005 2006 2007
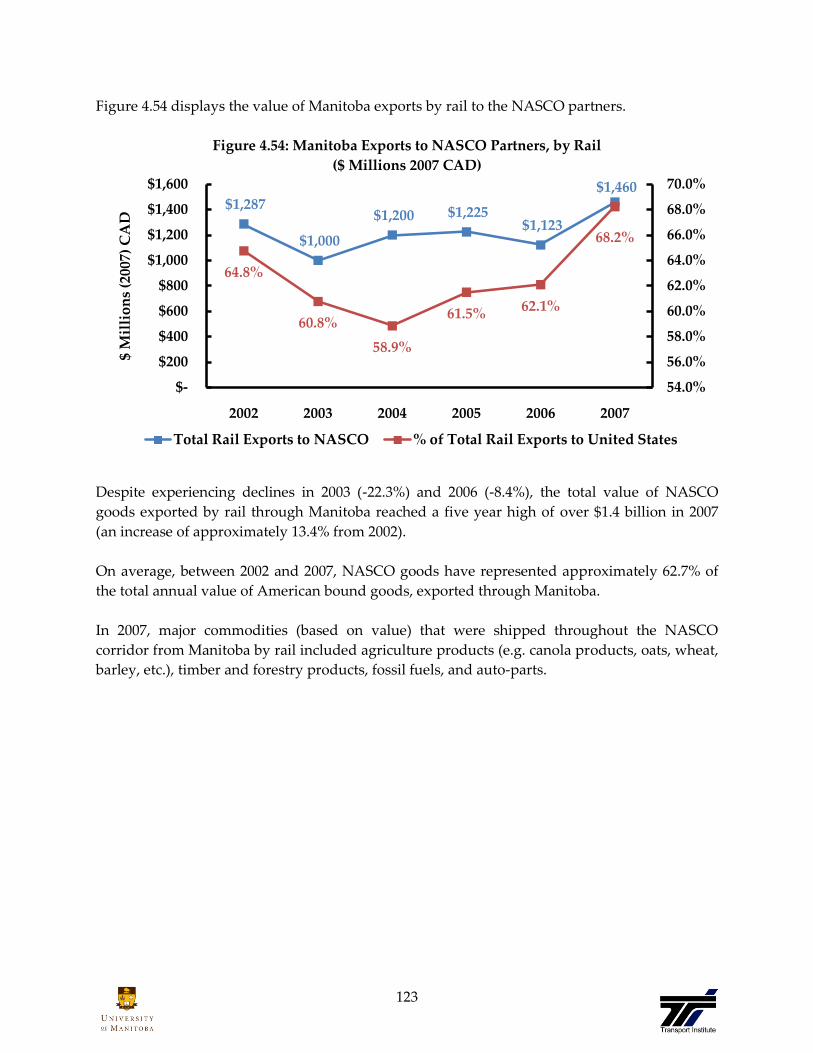
123
Figure 4.54 displays the value of Manitoba exports by rail to the NASCO partners.
Figure 4.54: Manitoba Exports to NASCO Partners, by Rail
($ Millions 2007 CAD)
Despite experiencing declines in 2003 (-22.3%) and 2006 (-8.4%), the total value of NASCO
goods exported by rail through Manitoba reached a five year high of over $1.4 billion in 2007
(an increase of approximately 13.4% from 2002).
On average, between 2002 and 2007, NASCO goods have represented approximately 62.7% of
the total annual value of American bound goods, exported through Manitoba.
In 2007, major commodities (based on value) that were shipped throughout the NASCO
corridor from Manitoba by rail included agriculture products (e.g. canola products, oats, wheat,
barley, etc.), timber and forestry products, fossil fuels, and auto-parts.
$1,287
$1,000
$1,200 $1,225 $1,123
$1,460
64.8%
60.8%
58.9%
61.5%62.1%
68.2%
54.0%
56.0%
58.0%
60.0%
62.0%
64.0%
66.0%
68.0%
70.0%
$-
$200
$400
$600
$800
$1,000
$1,200
$1,400
$1,600
2002 2003 2004 2005 2006 2007
$ M
illi
on
s (2
007)
CA
D
Total Rail Exports to NASCO % of Total Rail Exports to United States

124
Figure 4.55 displays the distribution of NASCO exports by rail in millions of 2007 CAD.
Figure 4.55: Distribution of NASCO Exports from Manitoba, by Rail
($ Millions 2007 CAD)
The majority of the value of Manitoba’s NASCO exports are to Illinois, Iowa, Minnesota, North
Dakota, Wisconsin and Texas. In 2007, these 6 states represented over 75% of the total rail
export traffic to the NASCO states and approximately 52.4% of total Manitoban cleared rail
exports to the United States. Between 2006 and 2007, the rate of growth in the value of goods
exported by rail to NASCO states ranged from -23.8% (Missouri) to 242.0% (Oklahoma). On
avereage, the value of goods exported to these states increased by 59.2%.
In 2007, exports to Minnesota increased by 17.4% from 2006 (approximately $48 million).
Although no single commodity appears to be responsible for this increase, exports of cereal
crops (e.g. oats, wheat, barley, rye) experienced large growths in export (in terms value).
The value of exports to North Dakoata also increased in 2007 (approximately 83.1%). Similar to
Minnesota, it appears that this increase occurred due to increased exports of cereal crops such
as canola (seed) (increased 111.1% from 2006), barley (increased 175.5%) and linseed (increased
270.8%).
Iowa experienced an increase in export value of 131.0% (approximately $59.8 million) from
2006. This appears to be primarily due to the increased export of oats (increased 84.7%), canola
oil (1951.2%), and potassium chloride (241.5%). Overall, exports to Iowa in 2007 were worth
approximately $105.5 million.
$-
$50
$100
$150
$200
$250
$300
$350
$ M
illi
on
s (2
007)
CA
D
2002 2003 2004 2005 2006 2007
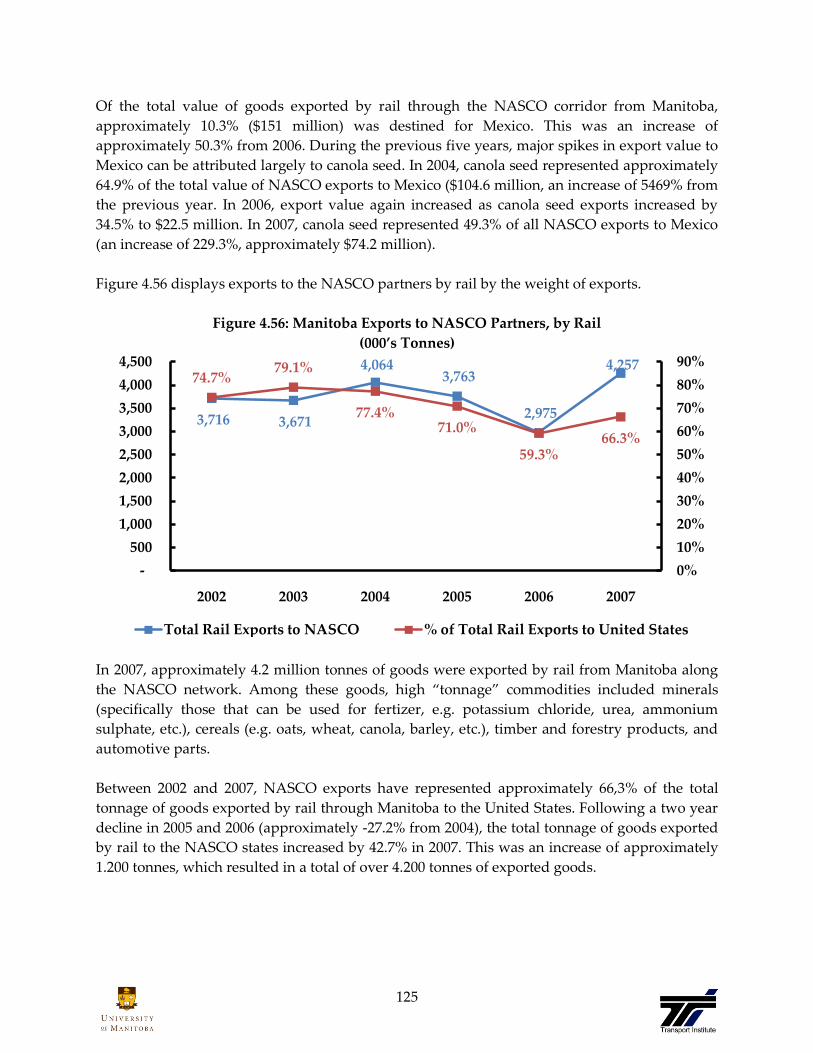
125
Of the total value of goods exported by rail through the NASCO corridor from Manitoba,
approximately 10.3% ($151 million) was destined for Mexico. This was an increase of
approximately 50.3% from 2006. During the previous five years, major spikes in export value to
Mexico can be attributed largely to canola seed. In 2004, canola seed represented approximately
64.9% of the total value of NASCO exports to Mexico ($104.6 million, an increase of 5469% from
the previous year. In 2006, export value again increased as canola seed exports increased by
34.5% to $22.5 million. In 2007, canola seed represented 49.3% of all NASCO exports to Mexico
(an increase of 229.3%, approximately $74.2 million).
Figure 4.56 displays exports to the NASCO partners by rail by the weight of exports.
Figure 4.56: Manitoba Exports to NASCO Partners, by Rail
(000’s Tonnes)
In 2007, approximately 4.2 million tonnes of goods were exported by rail from Manitoba along
the NASCO network. Among these goods, high ‚tonnage‛ commodities included minerals
(specifically those that can be used for fertizer, e.g. potassium chloride, urea, ammonium
sulphate, etc.), cereals (e.g. oats, wheat, canola, barley, etc.), timber and forestry products, and
automotive parts.
Between 2002 and 2007, NASCO exports have represented approximately 66,3% of the total
tonnage of goods exported by rail through Manitoba to the United States. Following a two year
decline in 2005 and 2006 (approximately -27.2% from 2004), the total tonnage of goods exported
by rail to the NASCO states increased by 42.7% in 2007. This was an increase of approximately
1.200 tonnes, which resulted in a total of over 4.200 tonnes of exported goods.
3,716 3,671
4,064 3,763
2,975
4,257 74.7%
79.1%
77.4%71.0%
59.3%66.3%
0%
10%
20%
30%
40%
50%
60%
70%
80%
90%
-
500
1,000
1,500
2,000
2,500
3,000
3,500
4,000
4,500
2002 2003 2004 2005 2006 2007
Total Rail Exports to NASCO % of Total Rail Exports to United States

126
Figure 4.57 displays the distribution of the NASCO exports by rail from Manitoba to each of the
NASCO partners.
Figure 4.57: Distribution of NASCO Exports from Manitoba, by Rail
(000’s Tonnes)
In 2007, the top NASCO destinations (by tonnage) of goods exported by rail were Illinois, North
Dakota, and Minnesota. Together, these three states represented approximately 66.0% of the
tonnage of NASCO exports (by rail) and 43.8% of the total tonnage of American rail exports
cleared through Manitoba.
Export tonnage to Illinois has fluctuated during the previous five years. This appears to be due
to decreasing exports of potassium chloride (decreasing 68.6% between 2004 and 2007) and
increasing exports of automotive parts (e.g. axles and wheels) (becoming the leading export
item to Illinois from Manitoba in 2007).
The level of export tonnage to North Dakota increased by 26.4% in 2007. This was primarily due
to an increase in export of canola seeds (increased 70.6%), and fertilizer components urea
(25.1%) and potassium chloride (50.0%). Decreased export of these commodities also appears to
be the primary cause of the 25.0% tonnage decline between 2004 and 2005.
Approximately 2.5% of the total tonnage exported through NASCO in 2007 was destined for
Mexico. Of this, approximately 51.3% of the total tonnage consisted of canola seeds.
-
200
400
600
800
1,000
1,200
000'
s o
f T
on
nes
2002 2003 2004 2005 2006 2007

127
Imports48
Figure 4.58 displays the value of Manitoba imports by road from NASCO partners.
Figure 4.58: Manitoba Imports from NASCO Partners, by Road
($ Millions 2007 CAD)
In 2007, road imports from NASCO into Manitoba were worth approximately $5.9 billion. This
was an increase of approximately 1.2% from the previous year. Following a 7.4% decline in
imports between 2002 and 2004 ($400 million), the value of imports has since increased by
17.4%.
Major commodities imported (from NASCO members) through Manitoba by road in 2007
included industrial vehicles (e.g. dump trucks, tractors, front end loaders), recreation vehicles
(e.g. snowmobiles, golf carts, trailers for camping), automobiles, and media publications.
Imports by road from the American NASCO states have averaged 61.4% of the total value of
road imports from the United States to Manitoba.
48 Imports refer to goods that are cleared through Manitoba borders. Some of these goods may be
destined for other provinces.
$5,478
$5,085
$5,075 $5,670
$5,883 $5,956
61.4%
61.4%
60.7%
61.8%
61.2%
61.7%
60.0%
60.5%
61.0%
61.5%
62.0%
$4,000
$4,200
$4,400
$4,600
$4,800
$5,000
$5,200
$5,400
$5,600
$5,800
$6,000
2002 2003 2004 2005 2006 2007
$ M
illi
on
s (2
007)
CA
D
Total Road Imports from NASCO % of Total Road Imports from United States
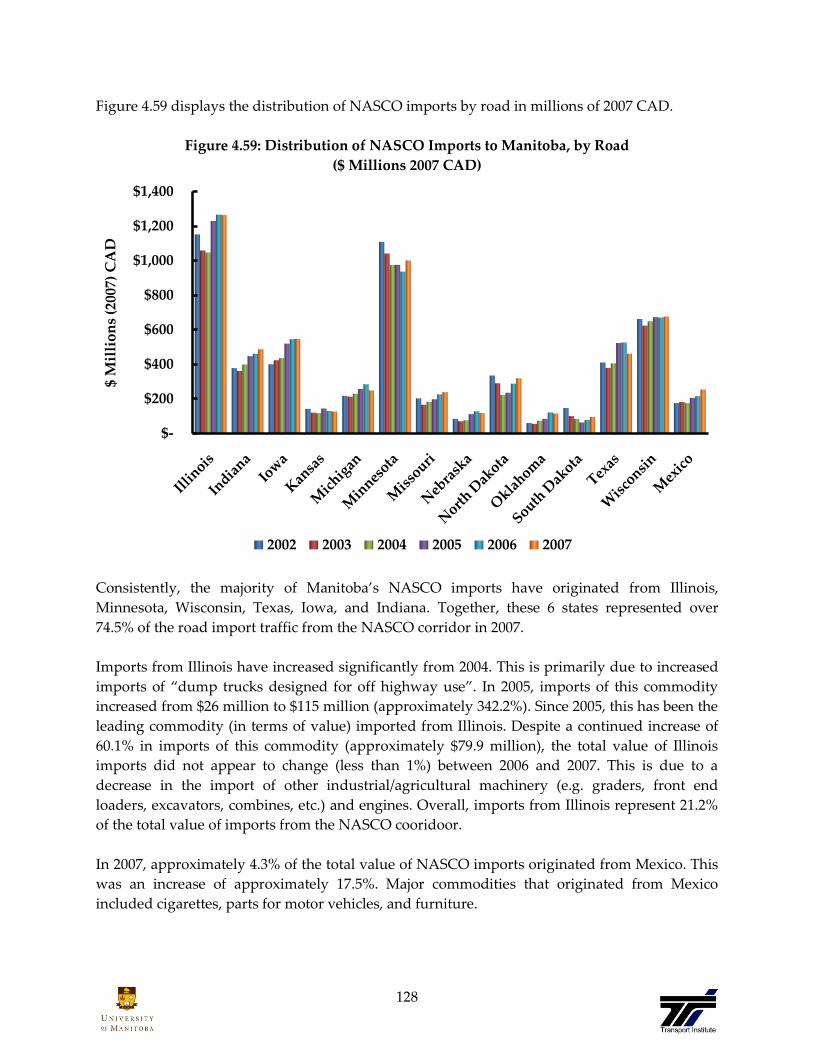
128
Figure 4.59 displays the distribution of NASCO imports by road in millions of 2007 CAD.
Figure 4.59: Distribution of NASCO Imports to Manitoba, by Road
($ Millions 2007 CAD)
Consistently, the majority of Manitoba’s NASCO imports have originated from Illinois,
Minnesota, Wisconsin, Texas, Iowa, and Indiana. Together, these 6 states represented over
74.5% of the road import traffic from the NASCO corridor in 2007.
Imports from Illinois have increased significantly from 2004. This is primarily due to increased
imports of ‚dump trucks designed for off highway use‛. In 2005, imports of this commodity
increased from $26 million to $115 million (approximately 342.2%). Since 2005, this has been the
leading commodity (in terms of value) imported from Illinois. Despite a continued increase of
60.1% in imports of this commodity (approximately $79.9 million), the total value of Illinois
imports did not appear to change (less than 1%) between 2006 and 2007. This is due to a
decrease in the import of other industrial/agricultural machinery (e.g. graders, front end
loaders, excavators, combines, etc.) and engines. Overall, imports from Illinois represent 21.2%
of the total value of imports from the NASCO cooridoor.
In 2007, approximately 4.3% of the total value of NASCO imports originated from Mexico. This
was an increase of approximately 17.5%. Major commodities that originated from Mexico
included cigarettes, parts for motor vehicles, and furniture.
$-
$200
$400
$600
$800
$1,000
$1,200
$1,400
$ M
illi
on
s (2
007)
CA
D
2002 2003 2004 2005 2006 2007

129
Figure 4.60 displays imports from the NASCO partners by road in respect to the weight of
imports.
Figure 4.60: Manitoba Imports from NASCO Partners, by Road
(000’s Tonnes)
In 2007, the total tonnage of imported goods crossing the Manitoba border (by road) from
NASCO was approximately 3.300 tonnes. This was a decline of approximately 16% or 639,000
tonnes from 2006. Prior to 2007, the tonnage of goods imported from the NASCO states had
been increasing annually between 2004 and 2006 (growing approximately 54.5% from 2003).
In 2007, the tonnage of goods originating from the NASCO states represented approximately
66.2% of all American road exports cleared through Manitoba. This was a decline of
approximately 22.3% from 2006. Over the past five years (2002-2007), approximately 74.4% of all
road imports from the United States entering Canada via Manitoba originiated from the
NASCO states.
Nearly 50,000 tonnes arrived from Mexico in 2007. This represented approximately 1.5% of the
total tonnage arriving from NASCO by road into Manitoba. Major commodities among these
imports included automotive parts (e.g. tires, seats, etc.), cigarettes, and produce (e.g.
watermelons, tomatoes, cucumbers, etc.).
2,743 2,5782,764
3,074
3,9823,343
75.7% 75.4% 72.1% 69.7%
88.5%
66.2%
0.0%
20.0%
40.0%
60.0%
80.0%
100.0%
0
1,000
2,000
3,000
4,000
5,000
2002 2003 2004 2005 2006 2007
Total Road Imports from NASCO % of Total Road Imports from United States

130
Figure 4.61 displays the distribution of the NASCO imports by road to Manitoba from each of
the NASCO partners.
Figure 4.61: Distribution of NASCO Imports to Manitoba, by Road
(000’s Tonnes)
In 2007, the major origins of road imports among the NASCO states were Illinois, Minnesota,
and North Dakota. Together, these three states represented approximately 62.0% of the total
tonnage of NASCO (road) imports into Manitoba and 41.0% of the total import tonnage from
the United States into Manitoba.
Overall, the total tonnage of imports from the NASCO states decreased by -16.1% from the
previous year. This was largely due to a 44.0% decrease in import tonnage from Minnesota. This
large decrease in imports from Minnesota appears to be primarily due to a large movement
(approximately 853,000 tonnes) of ‚Silica Sands and Quartz Sands‛ in 2006, which accounted
for approximately 54.3% of the total state import tonnage. In 2007, approximately 18,805 tonnes
of this commodity was imported from Minnesota (a decrease of -8.3% from 2005). If no change
were recorded in the tonnage of Minnesota imports, total NASCO tonnage would have
increased by 1.5% between 2006 and 2007.
0
200
400
600
800
1,000
1,200
1,400
1,600
1,800
000'
s o
f T
on
nes
2002 2003 2004 2005 2006 2007
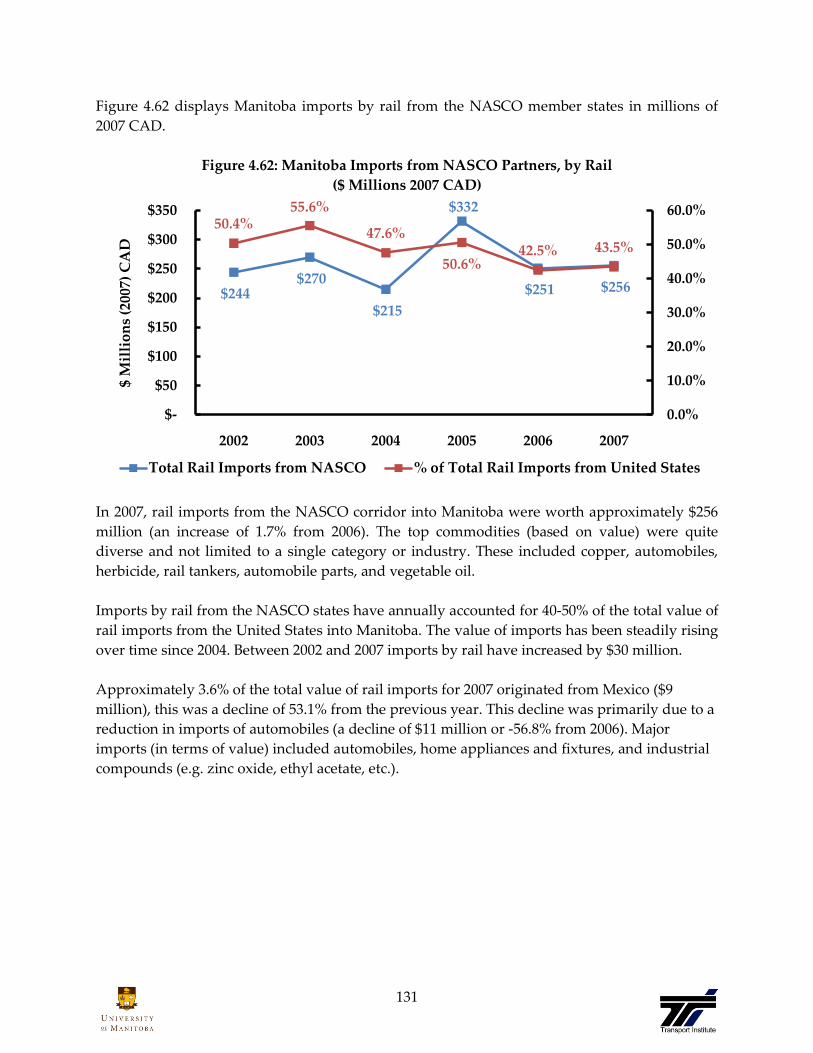
131
Figure 4.62 displays Manitoba imports by rail from the NASCO member states in millions of
2007 CAD.
Figure 4.62: Manitoba Imports from NASCO Partners, by Rail
($ Millions 2007 CAD)
In 2007, rail imports from the NASCO corridor into Manitoba were worth approximately $256
million (an increase of 1.7% from 2006). The top commodities (based on value) were quite
diverse and not limited to a single category or industry. These included copper, automobiles,
herbicide, rail tankers, automobile parts, and vegetable oil.
Imports by rail from the NASCO states have annually accounted for 40-50% of the total value of
rail imports from the United States into Manitoba. The value of imports has been steadily rising
over time since 2004. Between 2002 and 2007 imports by rail have increased by $30 million.
Approximately 3.6% of the total value of rail imports for 2007 originated from Mexico ($9
million), this was a decline of 53.1% from the previous year. This decline was primarily due to a
reduction in imports of automobiles (a decline of $11 million or -56.8% from 2006). Major
imports (in terms of value) included automobiles, home appliances and fixtures, and industrial
compounds (e.g. zinc oxide, ethyl acetate, etc.).
$244 $270
$215
$332
$251 $256
50.4%55.6%
47.6%
50.6%42.5% 43.5%
0.0%
10.0%
20.0%
30.0%
40.0%
50.0%
60.0%
$-
$50
$100
$150
$200
$250
$300
$350
2002 2003 2004 2005 2006 2007
$ M
illi
on
s (2
007)
CA
D
Total Rail Imports from NASCO % of Total Rail Imports from United States
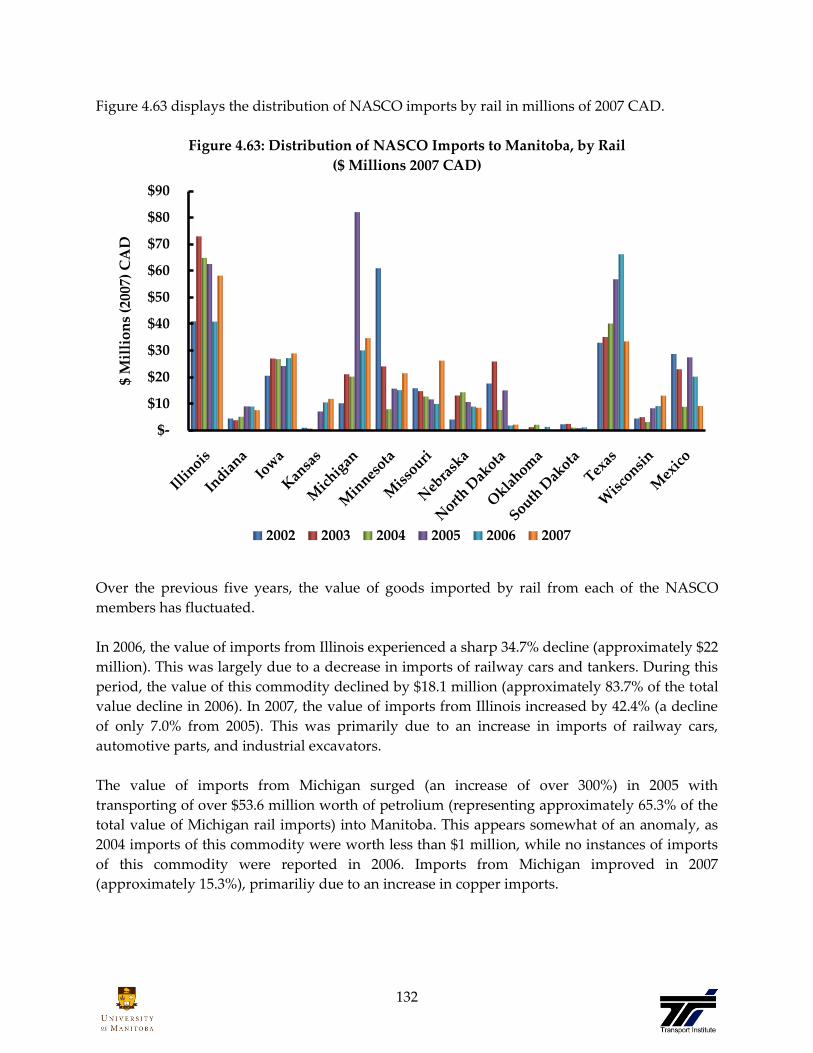
132
Figure 4.63 displays the distribution of NASCO imports by rail in millions of 2007 CAD.
Figure 4.63: Distribution of NASCO Imports to Manitoba, by Rail
($ Millions 2007 CAD)
Over the previous five years, the value of goods imported by rail from each of the NASCO
members has fluctuated.
In 2006, the value of imports from Illinois experienced a sharp 34.7% decline (approximately $22
million). This was largely due to a decrease in imports of railway cars and tankers. During this
period, the value of this commodity declined by $18.1 million (approximately 83.7% of the total
value decline in 2006). In 2007, the value of imports from Illinois increased by 42.4% (a decline
of only 7.0% from 2005). This was primarily due to an increase in imports of railway cars,
automotive parts, and industrial excavators.
The value of imports from Michigan surged (an increase of over 300%) in 2005 with
transporting of over $53.6 million worth of petrolium (representing approximately 65.3% of the
total value of Michigan rail imports) into Manitoba. This appears somewhat of an anomaly, as
2004 imports of this commodity were worth less than $1 million, while no instances of imports
of this commodity were reported in 2006. Imports from Michigan improved in 2007
(approximately 15.3%), primariliy due to an increase in copper imports.
$-
$10
$20
$30
$40
$50
$60
$70
$80
$90
$ M
illi
on
s (2
007)
CA
D
2002 2003 2004 2005 2006 2007

133
In 2007, the value of rail imports from Texas decreased by nearly half (49.5%). This was due to a
84.2% reduction in the import of petrolium and no importing of liquified fossil fuel gases. The
value of imports from Texas rose sharply in 2005 and 2006 (approximately 41.4% and 16.6%
respectively) due to increased levels of imports of these two commodities.
Figure 4.64 displays imports from the NASCO partners by rail in respect to the weight of
imports.
Figure 4.64: Manitoba Imports from NASCO Partners, by Rail
(000s Tonnes)
In 2007, the total tonnage of goods imported from NASCO states by rail decreased by 37.0% to
1.1 million tonnes. During the previous five years, the tonnage of imports through the NASCO
corridor has fluctuaed, experiencing a period of decline between 2002 and 2004 (approximately
-21.2%) and a recent period of growth between 2005 and 2006 (approximately 155.7%).
During the past five years (2002-2007), rail imports from the NASCO states into Manitoba have
accounted for approximately 64.0% of the total tonnage imported into the province by rail. In
2007, tonnage from the NASCO states represented nearly half (49.4%) of all Manitoban rail
imports.
In 2007, just over 1,000 tonnes of goods were imported from Mexico by rail. This accounted for
less than 0.1% of all imported NASCO tonnage. Among those commodities that were imported
included automobiles, home appliances and fixtures, and industrial compounds (e.g. zinc oxide,
ethyl acetate, etc.). Over the past five years, only 0.27% of the total import tonnage that passed
through the NASCO corridor originated from Mexico.
869 806685
1,489
1,751
1,101
83.0%74.6%
54.9%
75.4%
60.8%
49.4%
0.0%
20.0%
40.0%
60.0%
80.0%
100.0%
0
500
1,000
1,500
2,000
2002 2003 2004 2005 2006 2007
000'
s o
f T
on
nes
Total Rail Imports from NASCO % of Total Rail Imports from United States

134
Figure 4.65 displays the distribution of the NASCO imports by rail to Manitoba from each of the
NASCO partners.
Figure 4.65: Distribution of NASCO Imports to Manitoba, by Rail
(000s Tonnes)
In 2007, rail imports from Illinois, Kansas, and Minnesota contributed approximately 78.7% of
the tonnage from NASCO states and 38.9% of the tonnage of rail imports from the United
States. Between 2006 and 2007, the tonnage of imports originating from the NASCO states
declined by 37.1%. During this period, growth levels (in terms of tonnage) ranged from -98.7%
(Oklahoma) to 507.1% (Missouri). A large proportion of this difference is due to a decline in the
import of ‚Axles and Wheels and Parts‛. This commodity represents the leading rail import (by
tonnage) to Manitoba from Iowa, Kansas, and Minnesota. Between 2005 and 2006, there was
tremendous growth in the level of tonnage (of this commodity) exported to Manitoba, with
Kansas and Minnesota increasing at rates of 25.1% and 50.2% respectively, while Iowa increased
by over 3000%. The following year (2007), imports of this commodity decreased substantially,
approximately -28.2% (Minnesota), -55.1% (Kansas), -95.0% (Iowa). Between 2005 and 2007, this
commodity annually represented approximately 73.6% of rail import tonnage from Minnesota,
Kansas, and Iowa, and between 36.8%-58.4% of all NASCO rail import tonnage.
-
100
200
300
400
500
600
700
800
000'
s o
f T
on
nes
2002 2003 2004 2005 2006 2007

135
5. International Markets
This section will look at Canada’s trade with many of the leading world economies. The value,
weight, major commodities, and modes of transport will be analyzed.
Advanced Markets
In the globalized marketplace the actions of any one nation can have an effect on one or all of
the other nations worldwide. The larger the national economy; the larger the ripples in the
global economy will be. The world markets now revolve around the US Dollar, the British
Pound, the Japanese Yen, and the European Union Euro.
Figure 5.1 compares the GDP in real 2007 CAD for some of the world’s leading ‚advanced‛49
economies, with the nations that were using the Euro as of 2007 counting as one economic
entity, the European Union 13 (EU13 for short).
Figure 5.1: Canada and Advanced International Economies GDP
($ Billions of 2007 CAD)
49 Advanced economies as listed by the IMF, Aug, 2008
<http://www.imf.org/external/datamapper/index.php>
$11,
256
$8,4
16
$2,7
38
$18,
224
$1,3
72
$11,
458
$8,6
45
$2,8
28
$18,
888
$1,4
14
$11,
633
$8,8
07
$2,8
82
$19,
466
$1,4
53
$11,
939
$9,0
02
$2,9
62
$20,
026
$1,4
93
$12,
191
$9,2
02
$3,0
43
$20,
427
$1,5
30
$0
$5,000
$10,000
$15,000
$20,000
$25,000
European
Union 13
Japan United
Kingdom
United States Canada
$ B
illi
on
s (2
007)
CA
D
2003 2004 2005 2006 2007

136
Figure 5.2 compares the GDP in terms of rate of change for some of the world’s leading
‚advanced‛ economies, including Canada.
Figure 5.2: Advanced Economies Rate of Change 2003-2007
For the years 2003 to 2007 each of the displayed advanced economies posted positive rates of
change to their economies.
Canada does not seem to be unduly influenced by any one nation’s GDP fluctuations, but rather
has a rate of change consistent with the global economy as a whole. For example, note how the
general economy grew at increasing rates from 2003 to 2004, and all but Canada slowed their
growth while Canada’s growth grew at a faster rate than the rest. While the majority of
Canadian trade is with the United States, even this large local economy does not exert a great
deal of influence over the Canadian GDP rate of change in either a direct or delayed fashion.
Canada is considered an advanced economy and displayed the 7th largest GDP of the 31
‚Advanced Economies‛ as listed by the IMF50 in 2007, when counting all the EU13 nations as
independent economies. Canada has a positive rate of change and a real GDP of $1,530 billion in
2007 as compared to the United States at $20,427 billion, the European Union 13 at $12,191
billion, the United Kingdom at $3,043 billion, and Japan at $9,202 billion.
The United States, Japan, United Kingdom, and the European Union (see trade analysis later in
this section) are world leaders in research and production through a variety of industries. As a
result these are major trading partners for Canadian products. To get a better understanding of
Canada’s trade relationship with each of these advanced economies, detailed outlines have been
included.
50 Advanced economies as listed by the IMF, Aug, 2008
<http://www.imf.org/external/datamapper/index.php>
0.0%
1.0%
2.0%
3.0%
4.0%
2003 2004 2005 2006 2007
Rat
e o
f C
han
ge
European Union 13 Japan United Kingdom United States Canada

137
European Union
Imports
2007
2007
Rank
2006
Rank Growth
Exports
2007
2007
Rank
2006
Rank Growth
Value
($ Millions
2007 CAD)
$32,436 3 3 -2% $19,814 2 2 13%
Weight
(000s Tonnes) 16,681 3 3 36% 26,778 2 2 -68%
The first profile will not be of a specific nation, but rather of a collection of nations that form a
political and economic bloc; the European Union. In 2007 the EU13 (the thirteen nations that use
the euro as their currency as of 2007) was comprised of Austria, Belgium, Finland, France,
Germany, Greece, Ireland, Italy, Luxembourg, Netherlands, Portugal, Slovenia, and Spain.
Although the EU is not a single national trading partner, it is far more than a free-trade
association and it has many nation-like attributes: its own flag, anthem, founding date,
currency, and foreign and security policy in its dealings with other nations.
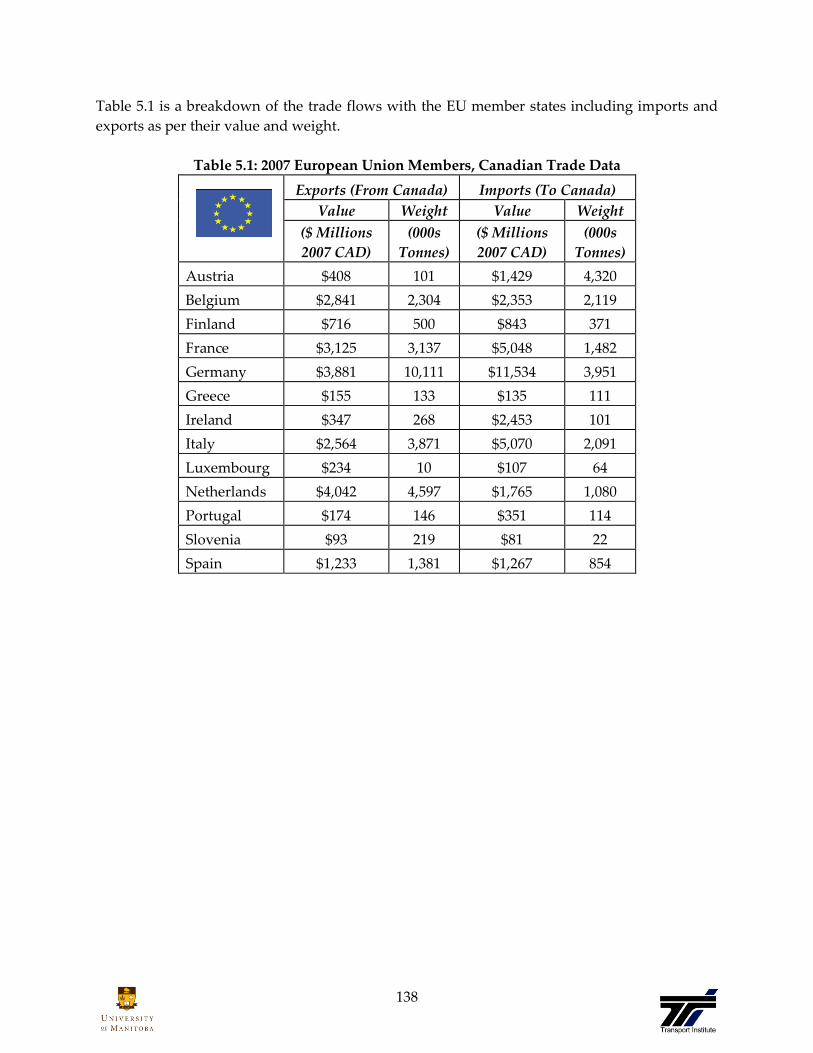
138
Table 5.1 is a breakdown of the trade flows with the EU member states including imports and
exports as per their value and weight.
Table 5.1: 2007 European Union Members, Canadian Trade Data
Exports (From Canada) Imports (To Canada)
Value Weight Value Weight
($ Millions
2007 CAD)
(000s
Tonnes)
($ Millions
2007 CAD)
(000s
Tonnes)
Austria $408 101 $1,429 4,320
Belgium $2,841 2,304 $2,353 2,119
Finland $716 500 $843 371
France $3,125 3,137 $5,048 1,482
Germany $3,881 10,111 $11,534 3,951
Greece $155 133 $135 111
Ireland $347 268 $2,453 101
Italy $2,564 3,871 $5,070 2,091
Luxembourg $234 10 $107 64
Netherlands $4,042 4,597 $1,765 1,080
Portugal $174 146 $351 114
Slovenia $93 219 $81 22
Spain $1,233 1,381 $1,267 854
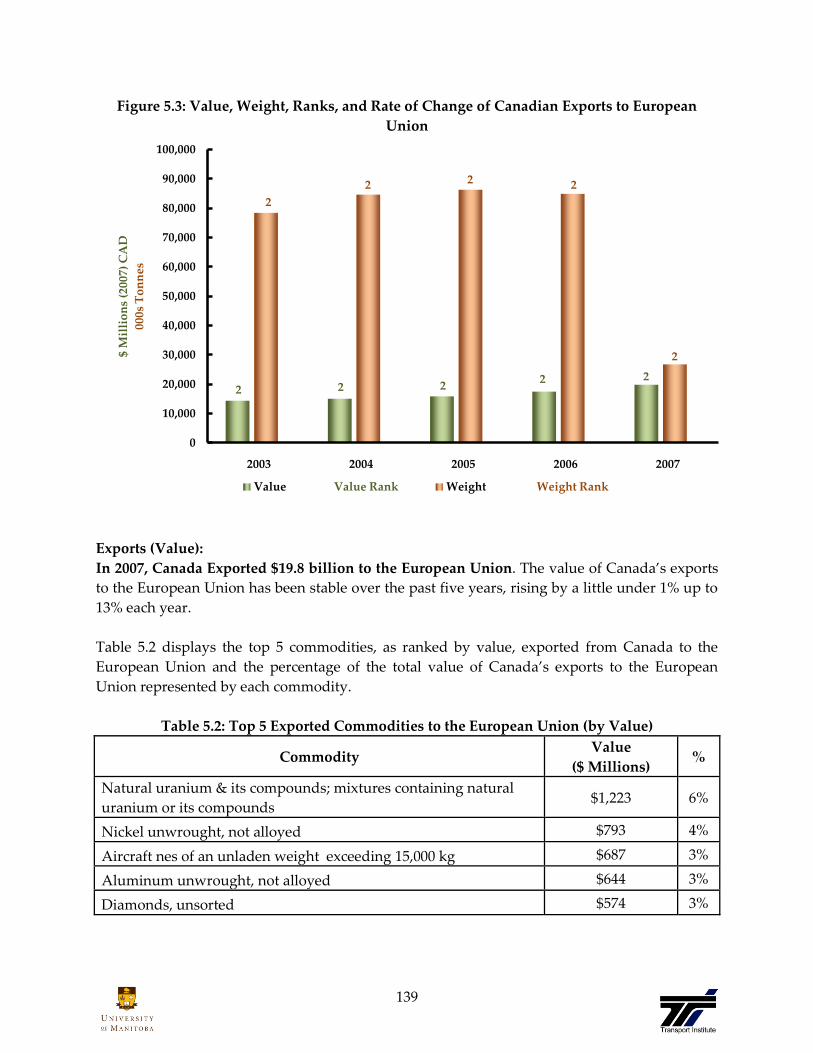
139
Figure 5.3: Value, Weight, Ranks, and Rate of Change of Canadian Exports to European
Union
Exports (Value):
In 2007, Canada Exported $19.8 billion to the European Union. The value of Canada’s exports
to the European Union has been stable over the past five years, rising by a little under 1% up to
13% each year.
Table 5.2 displays the top 5 commodities, as ranked by value, exported from Canada to the
European Union and the percentage of the total value of Canada’s exports to the European
Union represented by each commodity.
Table 5.2: Top 5 Exported Commodities to the European Union (by Value)
Commodity Value
($ Millions) %
Natural uranium & its compounds; mixtures containing natural
uranium or its compounds $1,223 6%
Nickel unwrought, not alloyed $793 4%
Aircraft nes of an unladen weight exceeding 15,000 kg $687 3%
Aluminum unwrought, not alloyed $644 3%
Diamonds, unsorted $574 3%
2 2 22 2
2
2 2 2
2
0
10,000
20,000
30,000
40,000
50,000
60,000
70,000
80,000
90,000
100,000
2003 2004 2005 2006 2007
$ M
illi
on
s (2
007)
CA
D
000s
To
nn
es
Value Value Rank Weight Weight Rank

140
Exports (Weight):
In 2007, Canada Exported 26.8 million tonnes of commodities and goods to the European
Union. The weight of Canada’s exports to the European Union growing slowly from 2002 to
2005, taking a slight down turn in 2006 at -2%. In 2007 the rate of change of the weight of
exports to the European Union was -68%; of the 58.1 million tonnes of difference between 2006
and 2007 57.2 million tonnes was due to the drop of weight in goods classified as ‚Low Value
Export Transactions and Confidential Commodities‛.
Table 5.3 displays the top 5 commodities, exported from Canada to the European Union (by
weight).
Table 5.3: Top 5 Exported Commodities to the European Union (by Weight)
Commodity Weight
(000s Tonnes) %
Bituminous coal, whether or not pulverized but not agglomerated 5,068 19%
Iron ores and concentrates, other than roasted iron pyrites,
agglomerated 4,641 17%
Iron ores and concentrates, other than roasted iron pyrites, non-
agglomerated 4,522 17%
Low value export transactions and confidential commodities 4,301 16%
Durum wheat 853 3%
The Canadian exports to the European Union are displayed in terms of value and weight by
province of origin in Figure 5.4.
Figure 5.4: Province of Origin, Canadian Exports to European Union
Value ($ Millions) and Weight (000s Tonnes)
$1,8
78
$1,4
04
$887
$313
$5,6
78 $6,8
48
$325
$6
4
$311 $1
,073
$0
$1,0
31
$1,3
28
6,21
5
763 1,
668
253
1,82
1
10,5
28
221
18 40
4
4,88
1
0 1 5
0
2,000
4,000
6,000
8,000
10,000
12,000
BC AB SK MB ON QC NB PE NS NF YT NT NU
$ M
illi
on
s (2
007)
CA
D
000s
To
nn
es
Value Weight
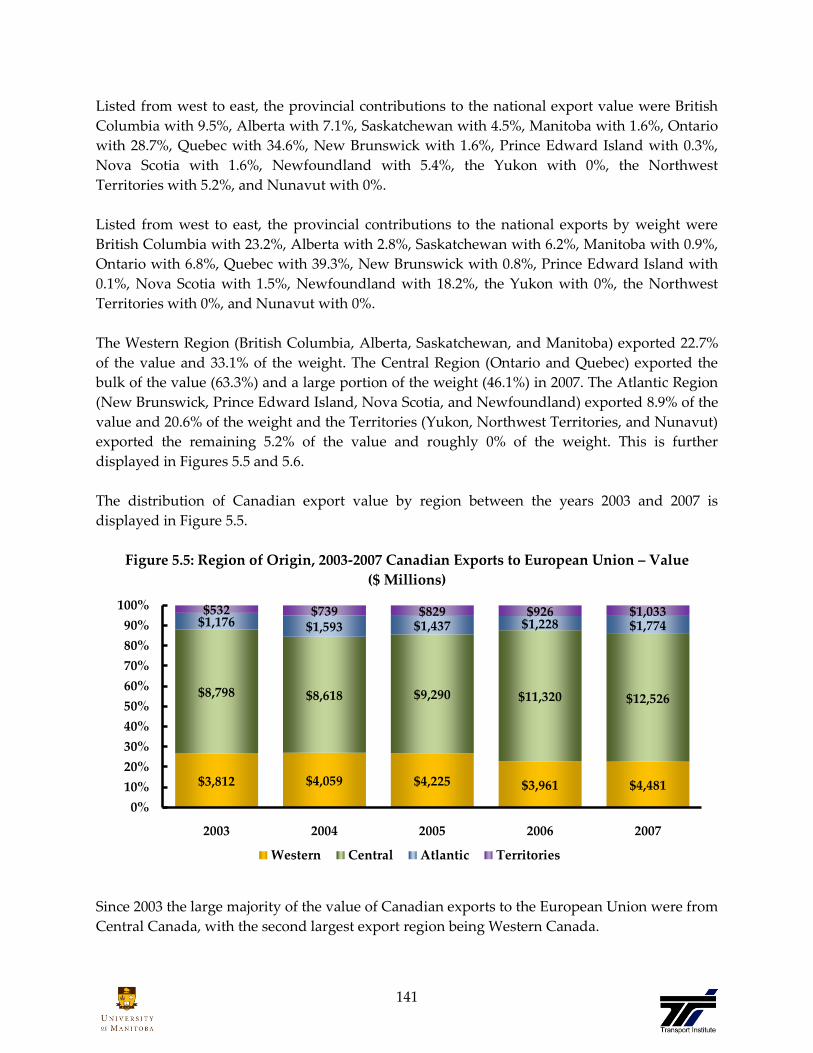
141
Listed from west to east, the provincial contributions to the national export value were British
Columbia with 9.5%, Alberta with 7.1%, Saskatchewan with 4.5%, Manitoba with 1.6%, Ontario
with 28.7%, Quebec with 34.6%, New Brunswick with 1.6%, Prince Edward Island with 0.3%,
Nova Scotia with 1.6%, Newfoundland with 5.4%, the Yukon with 0%, the Northwest
Territories with 5.2%, and Nunavut with 0%.
Listed from west to east, the provincial contributions to the national exports by weight were
British Columbia with 23.2%, Alberta with 2.8%, Saskatchewan with 6.2%, Manitoba with 0.9%,
Ontario with 6.8%, Quebec with 39.3%, New Brunswick with 0.8%, Prince Edward Island with
0.1%, Nova Scotia with 1.5%, Newfoundland with 18.2%, the Yukon with 0%, the Northwest
Territories with 0%, and Nunavut with 0%.
The Western Region (British Columbia, Alberta, Saskatchewan, and Manitoba) exported 22.7%
of the value and 33.1% of the weight. The Central Region (Ontario and Quebec) exported the
bulk of the value (63.3%) and a large portion of the weight (46.1%) in 2007. The Atlantic Region
(New Brunswick, Prince Edward Island, Nova Scotia, and Newfoundland) exported 8.9% of the
value and 20.6% of the weight and the Territories (Yukon, Northwest Territories, and Nunavut)
exported the remaining 5.2% of the value and roughly 0% of the weight. This is further
displayed in Figures 5.5 and 5.6.
The distribution of Canadian export value by region between the years 2003 and 2007 is
displayed in Figure 5.5.
Figure 5.5: Region of Origin, 2003-2007 Canadian Exports to European Union – Value
($ Millions)
Since 2003 the large majority of the value of Canadian exports to the European Union were from
Central Canada, with the second largest export region being Western Canada.
$3,812 $4,059 $4,225 $3,961 $4,481
$8,798 $8,618 $9,290 $11,320 $12,526
$1,176 $1,593 $1,437 $1,228 $1,774$532 $739 $829 $926 $1,033
0%
10%
20%
30%
40%
50%
60%
70%
80%
90%
100%
2003 2004 2005 2006 2007
Western Central Atlantic Territories

142
In 2007 the value of exports from the Central region rose by $1,206 million; the value from the
Western region increased $520 million; the Atlantic region increased exports by $546 million,
and the Territories increased their exports by $107 million.
The distribution of Canadian exports by weight by region since the year 2003 is displayed in
Figure 5.6.
Figure 5.6: Region of Origin, 2003-2007 Canadian Exports to European Union - Weight
(000s Tonnes)
Between 2003 and 2006 the large majority of the weight of Canadian exports to the European
Union were from Central Canada, with the second largest export region being Western Canada.
This changed in 2007 when the Western region exported the largest portion.
In 2007 exports from the Western region experienced a decrease of 1,.2 million tonnes, the
Central region experienced a sharp decrease of 50,5 million tonnes, the Atlantic region
experienced a decrease of 372,000 tonnes and the Territories experienced a decrease of 5,000
tonnes.
9,873 10,770 10,680 10,113
8,898
61,400 66,713 67,623 68,84412,349
7,115 7,121 7,974 5,8965,524
6 7 10 11 6
0%
10%
20%
30%
40%
50%
60%
70%
80%
90%
100%
2003 2004 2005 2006 2007
Western Central Atlantic Territories
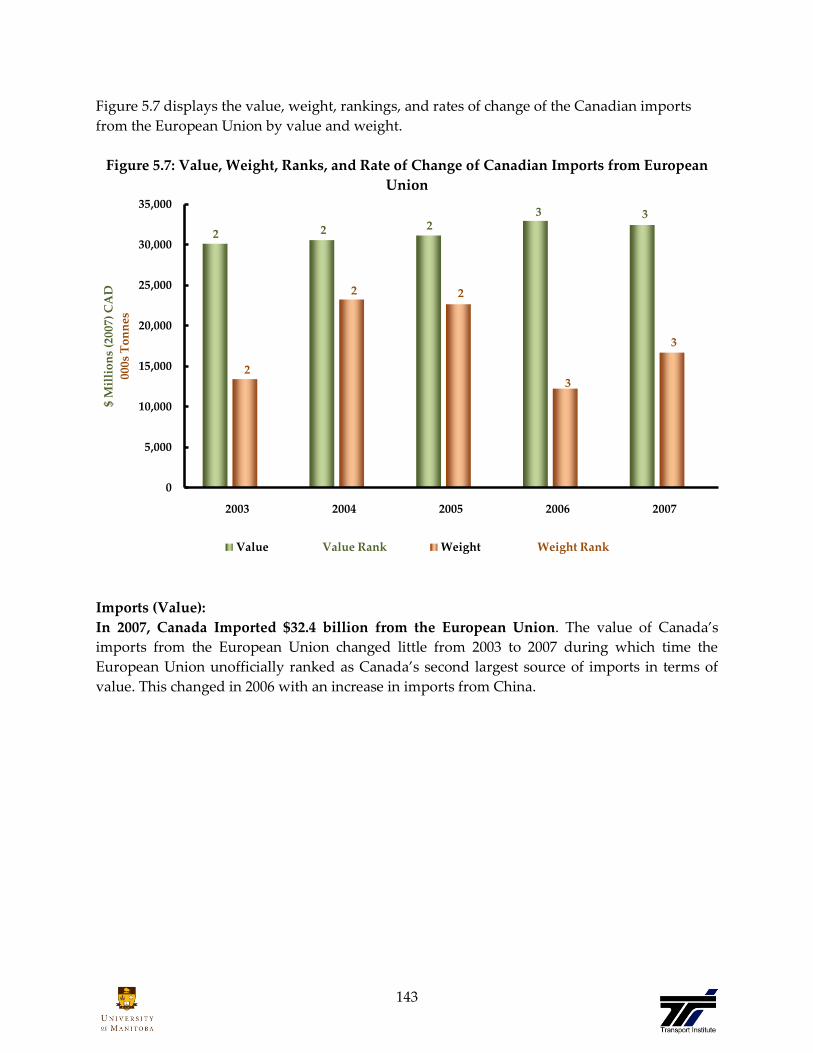
143
Figure 5.7 displays the value, weight, rankings, and rates of change of the Canadian imports
from the European Union by value and weight.
Figure 5.7: Value, Weight, Ranks, and Rate of Change of Canadian Imports from European
Union
Imports (Value):
In 2007, Canada Imported $32.4 billion from the European Union. The value of Canada’s
imports from the European Union changed little from 2003 to 2007 during which time the
European Union unofficially ranked as Canada’s second largest source of imports in terms of
value. This changed in 2006 with an increase in imports from China.
2 2 23 3
2
2 2
3
3
0
5,000
10,000
15,000
20,000
25,000
30,000
35,000
2003 2004 2005 2006 2007
$ M
illi
on
s (2
007)
CA
D
000s
To
nn
es
Value Value Rank Weight Weight Rank
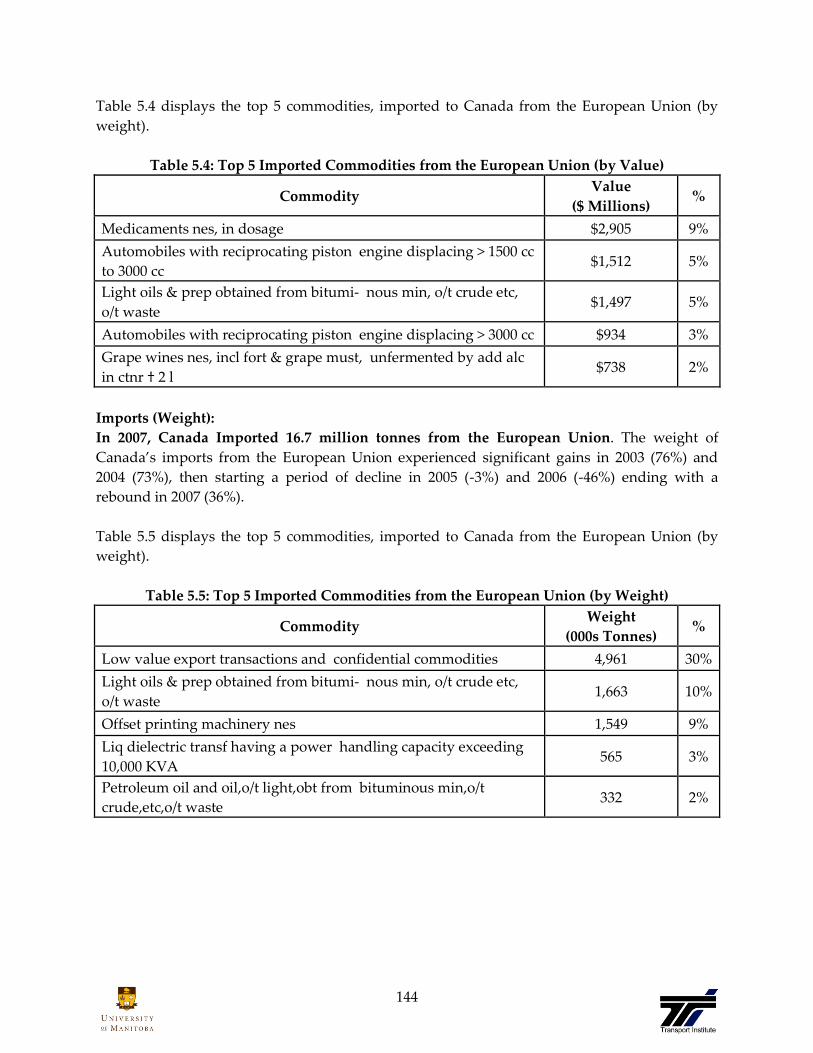
144
Table 5.4 displays the top 5 commodities, imported to Canada from the European Union (by
weight).
Table 5.4: Top 5 Imported Commodities from the European Union (by Value)
Commodity Value
($ Millions) %
Medicaments nes, in dosage $2,905 9%
Automobiles with reciprocating piston engine displacing > 1500 cc
to 3000 cc $1,512 5%
Light oils & prep obtained from bitumi- nous min, o/t crude etc,
o/t waste $1,497 5%
Automobiles with reciprocating piston engine displacing > 3000 cc $934 3%
Grape wines nes, incl fort & grape must, unfermented by add alc
in ctnr † 2 l $738 2%
Imports (Weight):
In 2007, Canada Imported 16.7 million tonnes from the European Union. The weight of
Canada’s imports from the European Union experienced significant gains in 2003 (76%) and
2004 (73%), then starting a period of decline in 2005 (-3%) and 2006 (-46%) ending with a
rebound in 2007 (36%).
Table 5.5 displays the top 5 commodities, imported to Canada from the European Union (by
weight).
Table 5.5: Top 5 Imported Commodities from the European Union (by Weight)
Commodity Weight
(000s Tonnes) %
Low value export transactions and confidential commodities 4,961 30%
Light oils & prep obtained from bitumi- nous min, o/t crude etc,
o/t waste 1,663 10%
Offset printing machinery nes 1,549 9%
Liq dielectric transf having a power handling capacity exceeding
10,000 KVA 565 3%
Petroleum oil and oil,o/t light,obt from bituminous min,o/t
crude,etc,o/t waste 332 2%

145
Japan
Imports
2007
2007
Rank
2006
Rank Growth
Exports
2007
2007
Rank
2006
Rank Growth
Value
($ Millions
2007 CAD)
$15,446 4 4 -2% $9,155 4 3 -6%
Weight
(000s Tonnes) 4,880 11 8 14% 21,537 2 5 8%
After its defeat in World War II Japan recovered to become an economic power and ally of the
United States. The economy experienced a major slowdown starting in the 1990s following
three decades of unprecedented growth, but Japan still remains a major economic power, both
in Asia and globally. Japan has become a world leader in manufacturing and technology and
imports most of its raw materials and energy resources.
Figure 5.8: Value, Weight, Ranks, and Rate of Change, Canadian Exports to Japan
2 2 2 3 4
4 55
5
2
0
5,000
10,000
15,000
20,000
25,000
2003 2004 2005 2006 2007
$ M
illi
on
s (2
007)
CA
D
000s
To
nn
es
Value Value Rank Weight Weight Rank
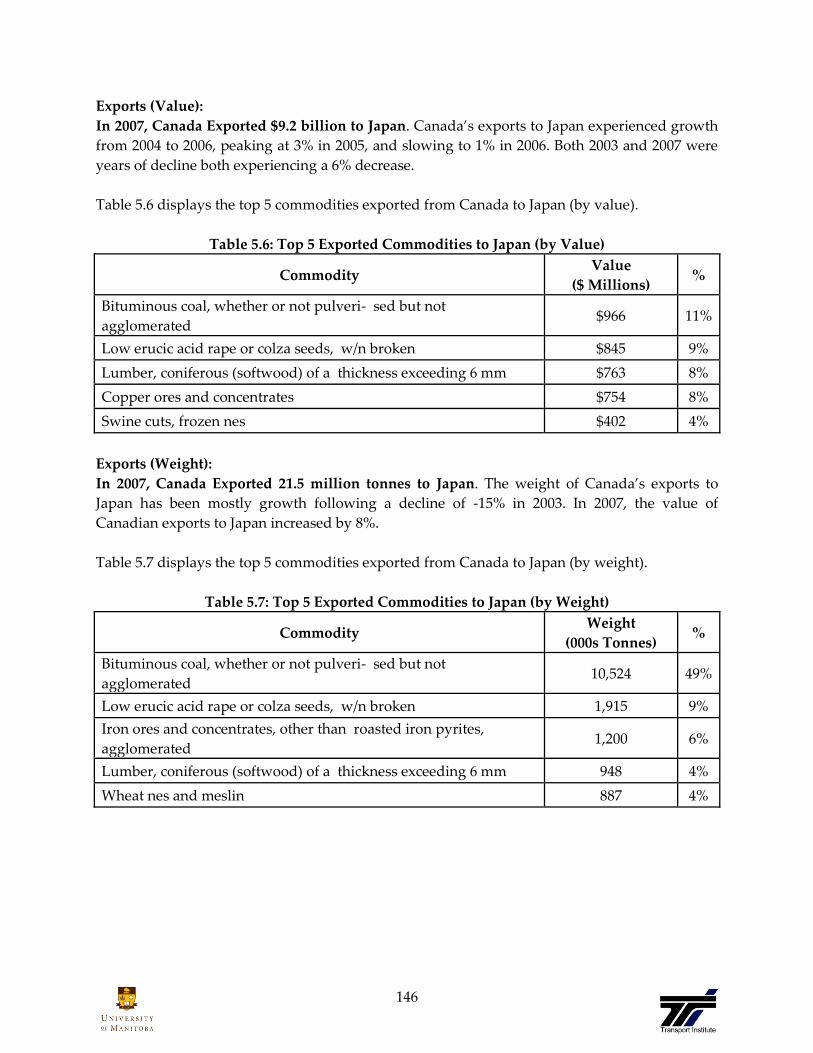
146
Exports (Value):
In 2007, Canada Exported $9.2 billion to Japan. Canada’s exports to Japan experienced growth
from 2004 to 2006, peaking at 3% in 2005, and slowing to 1% in 2006. Both 2003 and 2007 were
years of decline both experiencing a 6% decrease.
Table 5.6 displays the top 5 commodities exported from Canada to Japan (by value).
Table 5.6: Top 5 Exported Commodities to Japan (by Value)
Commodity Value
($ Millions) %
Bituminous coal, whether or not pulveri- sed but not
agglomerated $966 11%
Low erucic acid rape or colza seeds, w/n broken $845 9%
Lumber, coniferous (softwood) of a thickness exceeding 6 mm $763 8%
Copper ores and concentrates $754 8%
Swine cuts, frozen nes $402 4%
Exports (Weight):
In 2007, Canada Exported 21.5 million tonnes to Japan. The weight of Canada’s exports to
Japan has been mostly growth following a decline of -15% in 2003. In 2007, the value of
Canadian exports to Japan increased by 8%.
Table 5.7 displays the top 5 commodities exported from Canada to Japan (by weight).
Table 5.7: Top 5 Exported Commodities to Japan (by Weight)
Commodity Weight
(000s Tonnes) %
Bituminous coal, whether or not pulveri- sed but not
agglomerated 10,524 49%
Low erucic acid rape or colza seeds, w/n broken 1,915 9%
Iron ores and concentrates, other than roasted iron pyrites,
agglomerated 1,200 6%
Lumber, coniferous (softwood) of a thickness exceeding 6 mm 948 4%
Wheat nes and meslin 887 4%

147
The Canadian exports to Japan are displayed in terms of value and weight by province of origin
in Figure 5.9.
Figure 5.9: Province of Origin, Canadian Exports to Japan
Value ($ Millions) and Weight (000s Tonnes)
Listed from west to east the provincial contributions to the national export value were British
Columbia with 45.1%, Alberta with 16.0%, Saskatchewan with 7.4%, Manitoba with 4.8%,
Ontario with 14.6%, Quebec with 8.4%, New Brunswick with 0.7%, Prince Edward Island with
0.2%, Nova Scotia with 0.9%, Newfoundland with 1.8%, the Yukon with 0%, the Northwest
Territories with 0%, and Nunavut with 0%.
Listed from west to east the provincial contributions to the national exports by weight were
British Columbia with 51.2%, Alberta with 21.9%, Saskatchewan with 8.8%, Manitoba with
2.7%, Ontario with 2.5%, Quebec with 3.7%, New Brunswick with 0.3%, Prince Edward Island
with 0%, Nova Scotia with 0.6%, Newfoundland with 8.4%, the Yukon with 0%, the Northwest
Territories with 0%, and Nunavut with 0%.
The Western Region exported 73.3% of the value and 84.6% of the weight. The Central Region
exported 23.1% of the value and 6.1% of the weight. The Atlantic Region exported 3.6% of the
value and 9.3% of the weight while the Territories exported less than 1% of both the value and
weight.
$4,1
32
$1,4
66
$674
$439 $1
,338
$773
$69
$18
$84
$160
$0 $0
$711
11
,02
4
4,72
2
1,88
9
583
528
787
59
7 134
1,80
3
0 0 0
0
2,000
4,000
6,000
8,000
10,000
12,000
BC AB SK MB ON QC NB PE NS NF YT NT NU
$ M
illi
on
s (2
007)
CA
D
000s
To
nn
es
Value Weight
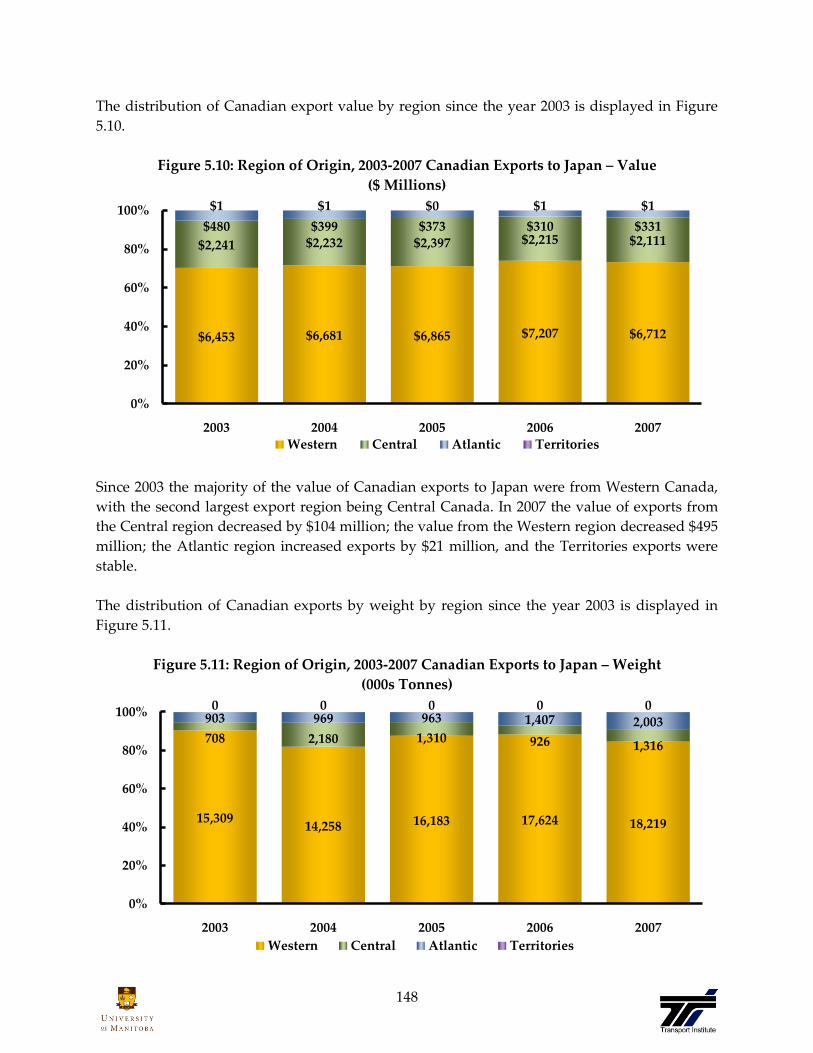
148
The distribution of Canadian export value by region since the year 2003 is displayed in Figure
5.10.
Figure 5.10: Region of Origin, 2003-2007 Canadian Exports to Japan – Value
($ Millions)
Since 2003 the majority of the value of Canadian exports to Japan were from Western Canada,
with the second largest export region being Central Canada. In 2007 the value of exports from
the Central region decreased by $104 million; the value from the Western region decreased $495
million; the Atlantic region increased exports by $21 million, and the Territories exports were
stable.
The distribution of Canadian exports by weight by region since the year 2003 is displayed in
Figure 5.11.
Figure 5.11: Region of Origin, 2003-2007 Canadian Exports to Japan – Weight
(000s Tonnes)
$6,453 $6,681 $6,865 $7,207 $6,712
$2,241 $2,232 $2,397 $2,215 $2,111$480 $399 $373 $310 $331
$1 $1 $0 $1 $1
0%
20%
40%
60%
80%
100%
2003 2004 2005 2006 2007
Western Central Atlantic Territories
15,30914,258 16,183 17,624 18,219
708 2,180 1,310 926 1,316
903 969 963 1,407 2,0030 0 0 0 0
0%
20%
40%
60%
80%
100%
2003 2004 2005 2006 2007
Western Central Atlantic Territories
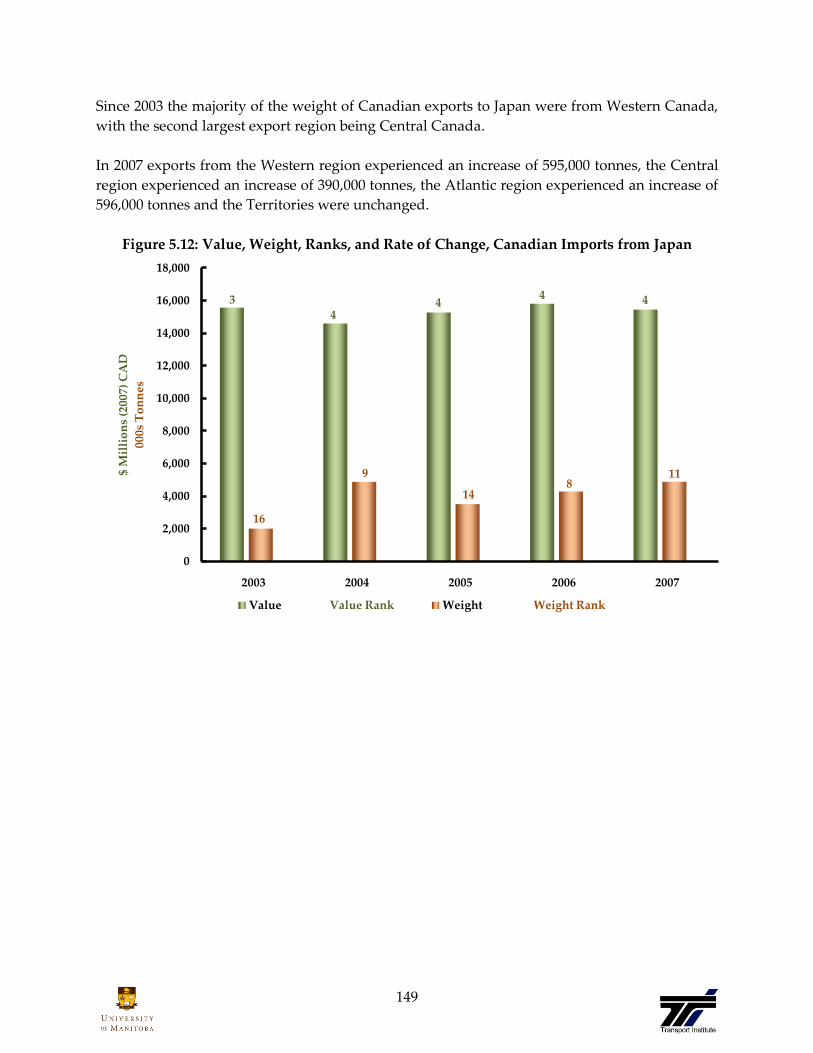
149
Since 2003 the majority of the weight of Canadian exports to Japan were from Western Canada,
with the second largest export region being Central Canada.
In 2007 exports from the Western region experienced an increase of 595,000 tonnes, the Central
region experienced an increase of 390,000 tonnes, the Atlantic region experienced an increase of
596,000 tonnes and the Territories were unchanged.
Figure 5.12: Value, Weight, Ranks, and Rate of Change, Canadian Imports from Japan
3
44
4 4
16
9
148
11
0
2,000
4,000
6,000
8,000
10,000
12,000
14,000
16,000
18,000
2003 2004 2005 2006 2007
$ M
illi
on
s (2
007)
CA
D
000s
To
nn
es
Value Value Rank Weight Weight Rank

150
Imports (Value):
In 2007, Canada Imported $15.4 billion from Japan. The value of Canada’s imports from Japan
has experienced slight growth from 2005 to 2006, experiencing a drop in 2007 of -2% and has
ranked 4th among Canadian import partners since 2004.
Table 5.8 displays the top 5 commodities imported to Canada from Japan (by value).
Table 5.8: Top 5 Imported Commodities from Japan (by Value)
Commodity Value
($ Millions) %
Automobiles with reciprocating piston engine displacing >
1500 cc to 3000 cc $2,857 18%
Automobiles with reciprocating piston engine displacing > 3000 cc $966 6%
Automobiles with reciprocating piston engine displacing >
1000 cc to 1500 cc $881 6%
Shovels and excavators with a 360 revolving superstructure $449 3%
Aircraft parts nes $430 3%
Imports (Weight):
In 2007, Canada Imported 4.9 million tonnes from Japan. The weight of Canada’s imports
from Japan has experienced some recent erratic shifts, going from 142% growth in 2004, to 22%
growth in 2006, and experiencing decline of -12%, and -28% in 2003 and 2005 respectively. In
2007 the growth rate was 14%.
Table 5.9 displays the top 5 commodities imported to Canada from Japan (by weight).
Table 5.9: Top 5 Imported Commodities from Japan (by Weight)
Commodity Weight
(000s Tonnes) %
Offset printing machinery nes 922 19%
Condensers for steam or vapour power units 591 12%
Axles and wheels and parts 446 9%
Petroleum oil and oil,o/t light,obt from bituminous min,o/t
crude,etc,o/t waste 185 4%
Video games of a kind used with a television receiver 182 4%

151
United Kingdom
Imports
2007
2007
Rank
2006
Rank Growth
Exports
2007
2007
Rank
2006
Rank Growth
Value
($ Millions
2007 CAD)
$11,406 6 6 2% $12,983 2 2 25%
Weight
(000s Tonnes) 10,359 5 6 17% 6,958 6 9 -12%
The United Kingdom of Great Britain and Ireland was the dominant industrial and maritime
power of the 19th century and at its peak spanned over one-fourth of the earth's surface. The
20th century saw the UK's strength depleted by war and nation states withdrawal from the
union. The UK rebuilt itself into a modern and prosperous European nation. It is one of five
permanent members of the UN Security Council, a founding member of NATO, and of the
Commonwealth. A member of the EU, it chose to maintain its own currency.51
Figure 5.13: Value, Weight, Ranks, and Rate of Change, Canadian Exports to the United
Kingdom
51 ‚United Kingdom‛, The World Factbook. Central Intelligence Agency. 23 March 2009
<https://www.cia.gov/library/publications/the-world-factbook/geos/uk.html#top>
3
33
2
2
99
10
9
6
0
2,000
4,000
6,000
8,000
10,000
12,000
14,000
2003 2004 2005 2006 2007
$ M
illi
on
s (2
007)
CA
D
000s
To
nn
es
Value Value Rank Weight Weight Rank
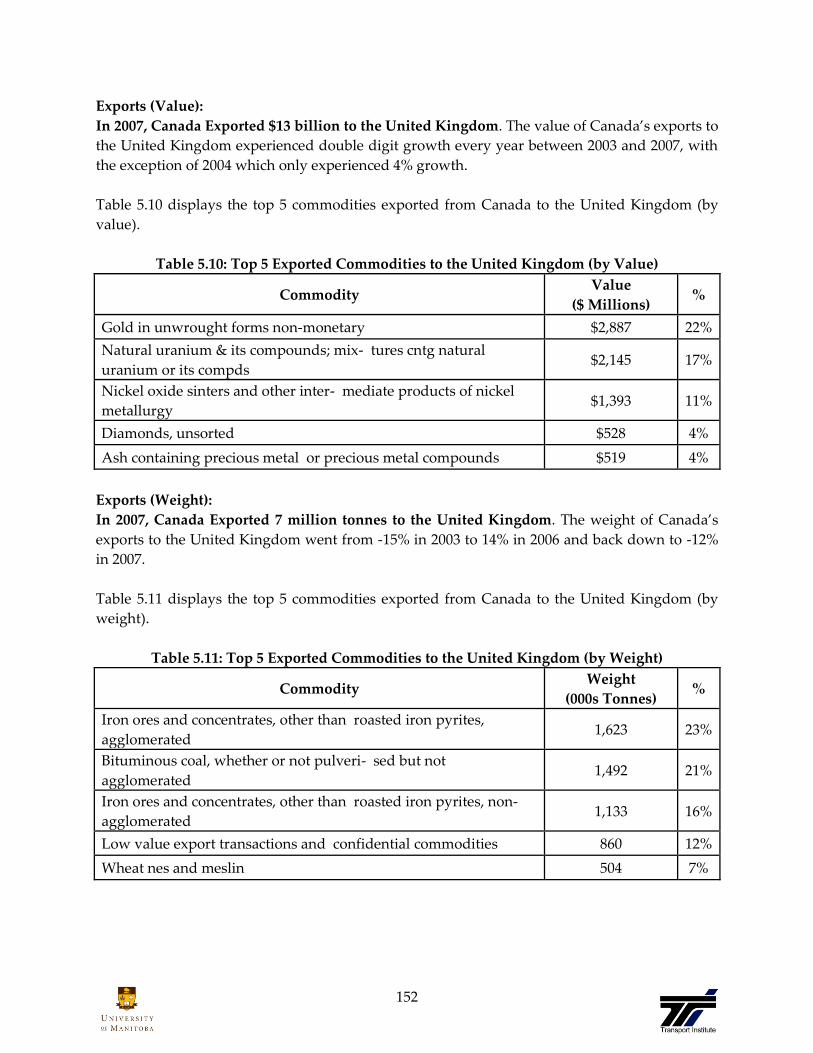
152
Exports (Value):
In 2007, Canada Exported $13 billion to the United Kingdom. The value of Canada’s exports to
the United Kingdom experienced double digit growth every year between 2003 and 2007, with
the exception of 2004 which only experienced 4% growth.
Table 5.10 displays the top 5 commodities exported from Canada to the United Kingdom (by
value).
Table 5.10: Top 5 Exported Commodities to the United Kingdom (by Value)
Commodity Value
($ Millions) %
Gold in unwrought forms non-monetary $2,887 22%
Natural uranium & its compounds; mix- tures cntg natural
uranium or its compds $2,145 17%
Nickel oxide sinters and other inter- mediate products of nickel
metallurgy $1,393 11%
Diamonds, unsorted $528 4%
Ash containing precious metal or precious metal compounds $519 4%
Exports (Weight):
In 2007, Canada Exported 7 million tonnes to the United Kingdom. The weight of Canada’s
exports to the United Kingdom went from -15% in 2003 to 14% in 2006 and back down to -12%
in 2007.
Table 5.11 displays the top 5 commodities exported from Canada to the United Kingdom (by
weight).
Table 5.11: Top 5 Exported Commodities to the United Kingdom (by Weight)
Commodity Weight
(000s Tonnes) %
Iron ores and concentrates, other than roasted iron pyrites,
agglomerated 1,623 23%
Bituminous coal, whether or not pulveri- sed but not
agglomerated 1,492 21%
Iron ores and concentrates, other than roasted iron pyrites, non-
agglomerated 1,133 16%
Low value export transactions and confidential commodities 860 12%
Wheat nes and meslin 504 7%
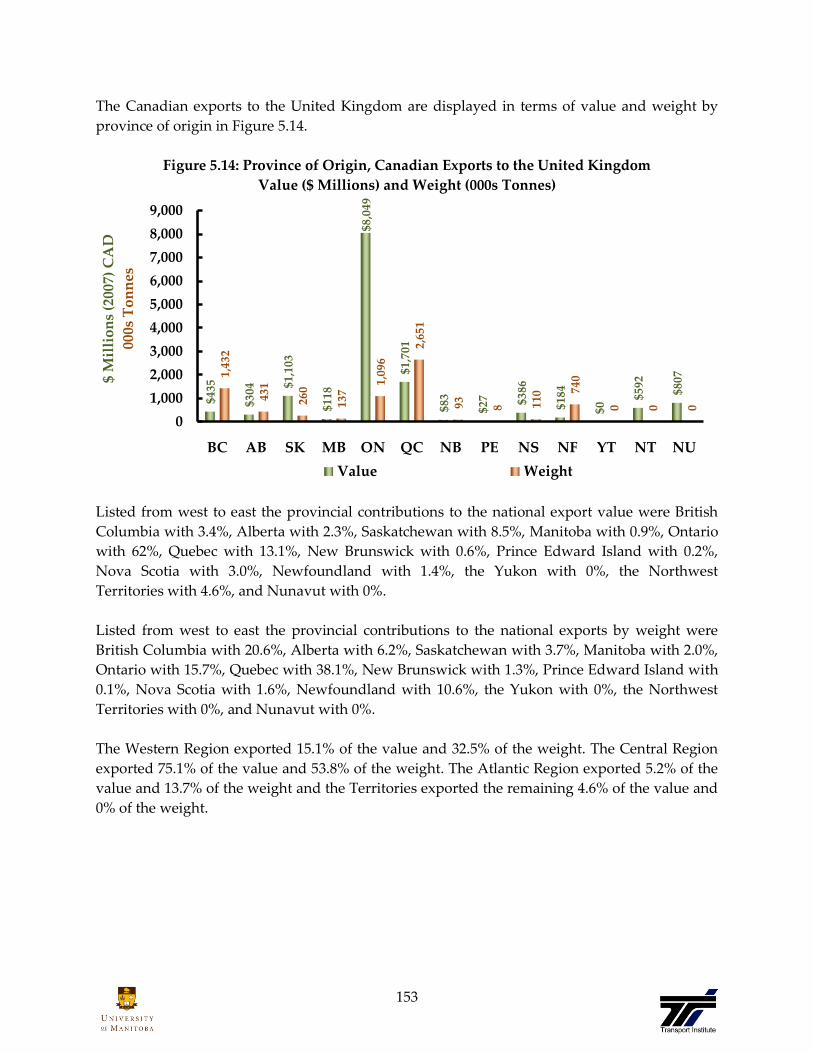
153
The Canadian exports to the United Kingdom are displayed in terms of value and weight by
province of origin in Figure 5.14.
Figure 5.14: Province of Origin, Canadian Exports to the United Kingdom
Value ($ Millions) and Weight (000s Tonnes)
Listed from west to east the provincial contributions to the national export value were British
Columbia with 3.4%, Alberta with 2.3%, Saskatchewan with 8.5%, Manitoba with 0.9%, Ontario
with 62%, Quebec with 13.1%, New Brunswick with 0.6%, Prince Edward Island with 0.2%,
Nova Scotia with 3.0%, Newfoundland with 1.4%, the Yukon with 0%, the Northwest
Territories with 4.6%, and Nunavut with 0%.
Listed from west to east the provincial contributions to the national exports by weight were
British Columbia with 20.6%, Alberta with 6.2%, Saskatchewan with 3.7%, Manitoba with 2.0%,
Ontario with 15.7%, Quebec with 38.1%, New Brunswick with 1.3%, Prince Edward Island with
0.1%, Nova Scotia with 1.6%, Newfoundland with 10.6%, the Yukon with 0%, the Northwest
Territories with 0%, and Nunavut with 0%.
The Western Region exported 15.1% of the value and 32.5% of the weight. The Central Region
exported 75.1% of the value and 53.8% of the weight. The Atlantic Region exported 5.2% of the
value and 13.7% of the weight and the Territories exported the remaining 4.6% of the value and
0% of the weight.
$435
$304
$1,1
03
$1
18
$8,0
49
$1,7
01
$83
$27 $3
86
$1
84
$0
$592
$8071,
432
431
260
137
1,09
6
2,65
1
93
8 110 74
0
0 0
0
0
1,000
2,000
3,000
4,000
5,000
6,000
7,000
8,000
9,000
BC AB SK MB ON QC NB PE NS NF YT NT NU
$ M
illi
on
s (2
007)
CA
D
000s
To
nn
es
Value Weight

154
The distribution of Canadian export value by region since the year 2003 is displayed in Figure
5.15.
Figure 5.15: Region of Origin, 2003-2007 Canadian Exports to the United Kingdom - Value
($ Millions)
Since 2003 the majority of the value of Canadian exports to the United Kingdom came from
Central Canada, with the second largest export region being Western Canada. In 2007 the value
of the Territories increased by $100 million, ranking last after the Atlantic region. Previously,
the Territories ranked 2nd after Central Canada, in 2003 and 2004, and later ranked 3rd after
Western Canada in 2005 and 2006.
In 2007 the value of exports from the Central region increased by $1,597 million; the value from
the Western region increased by $671 million; the Atlantic region increased exports by $243
million, and the Territories increased their exports by $100 million.
$794 $885 $1,041 $1,289 $1,960
$4,519 $5,967 $6,379 $8,153 $9,750
$358$414
$454$438 $681$1,187
$1,041$764
$493 $593
0%
10%
20%
30%
40%
50%
60%
70%
80%
90%
100%
2003 2004 2005 2006 2007
Western Central Atlantic Territories
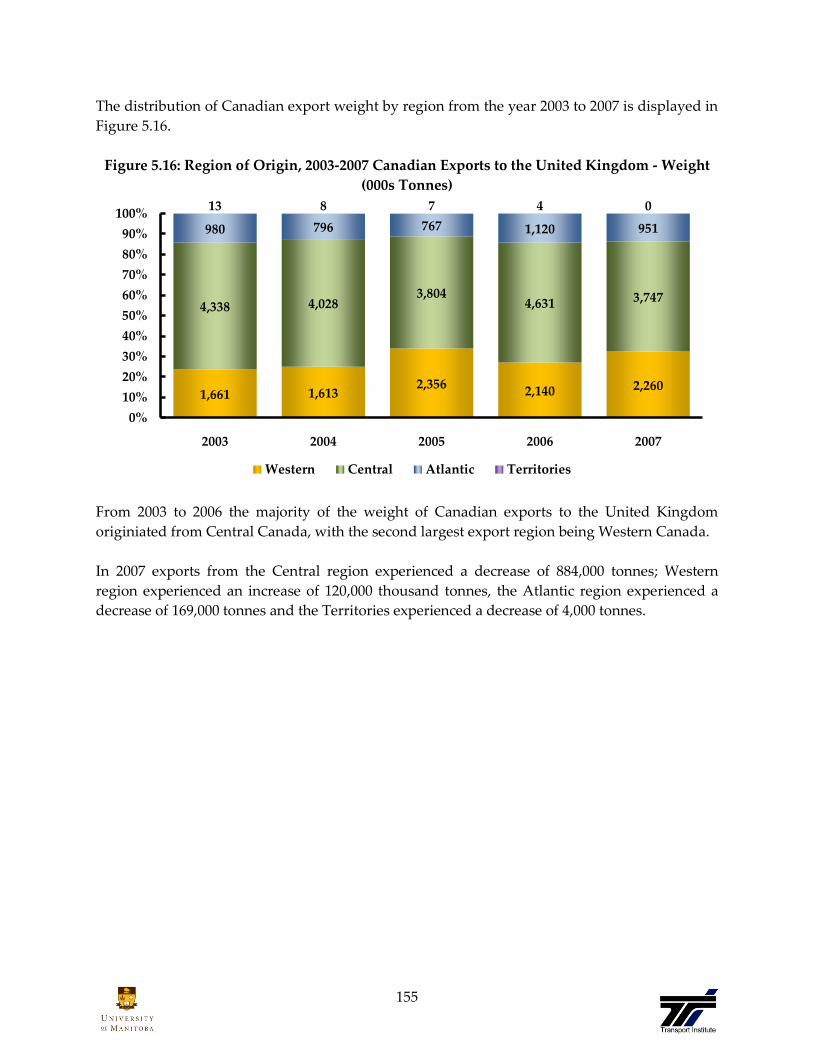
155
The distribution of Canadian export weight by region from the year 2003 to 2007 is displayed in
Figure 5.16.
Figure 5.16: Region of Origin, 2003-2007 Canadian Exports to the United Kingdom - Weight
(000s Tonnes)
From 2003 to 2006 the majority of the weight of Canadian exports to the United Kingdom
originiated from Central Canada, with the second largest export region being Western Canada.
In 2007 exports from the Central region experienced a decrease of 884,000 tonnes; Western
region experienced an increase of 120,000 thousand tonnes, the Atlantic region experienced a
decrease of 169,000 tonnes and the Territories experienced a decrease of 4,000 tonnes.
1,661 1,6132,356
2,140 2,260
4,338 4,0283,804
4,631 3,747
980 796 767 1,120 951
13 8 7 4 0
0%
10%
20%
30%
40%
50%
60%
70%
80%
90%
100%
2003 2004 2005 2006 2007
Western Central Atlantic Territories

156
Figure 5.17: Value, Weight, Ranks, and Rate of Change, Canadian Imports from the United
Kingdom
Imports (Value):
In 2007, Canada Imported $11.4 billion from the United Kingdom. The value of Canada’s
imports from the United Kingdom has experienced slight growth 2003 to 2007, going from -8%
in 2003 to 4% in 2005 and back down to 2% in the 2007.
Table 5.12 displays the top 5 commodities imported to Canada from the United Kingdom (by
value).
Table 5.12: Top 5 Imported Commodities from the United Kingdom (by Value)
Commodity Value
($ Millions) %
Petroleum oils and oils obtained from bituminous minerals, crude $4,377 38%
Medicaments nes, in dosage $781 7%
Aircraft parts nes $627 5%
Turbo-jets of a thrust exceeding 25 KN $398 3%
Parts of gas turbines nes $247 2%
5 55 6
6
33
5
6
5
0
2,000
4,000
6,000
8,000
10,000
12,000
2003 2004 2005 2006 2007
$ M
illi
on
s (2
007)
CA
D
000s
To
nn
es
Value Value Rank Weight Weight Rank

157
Imports (Weight):
In 2007, Canada Imported 10.4 million tonnes from the United Kingdom. The weight of
Canada’s imports from the United Kingdom fluctuated between 2003 to 2007. In 2003 the rate of
change was -19%, it rose to -3% in 2004 and 4% in 2005. The rate of change then dropped back to
-13% in 2006 and rose again to 17% in 2007.
Table 5.13 displays the top 5 commodities imported to Canada from the United Kingdom (by
weight).
Table 5.13: Top 5 Imported Commodities from the United Kingdom (by Weight)
Commodity Weight
(000s Tonnes) %
Petroleum oils and oils obtained from bituminous minerals, crude 6,295 61%
Low value export transactions and confidential commodities 2,893 28%
Offset printing machinery nes 173 2%
Light oils & prep obtained from bitumi- nous min, o/t crude etc,
o/t waste 126 1%
Kaolin and other kaolinic clays, whether or not calcined 75 1%
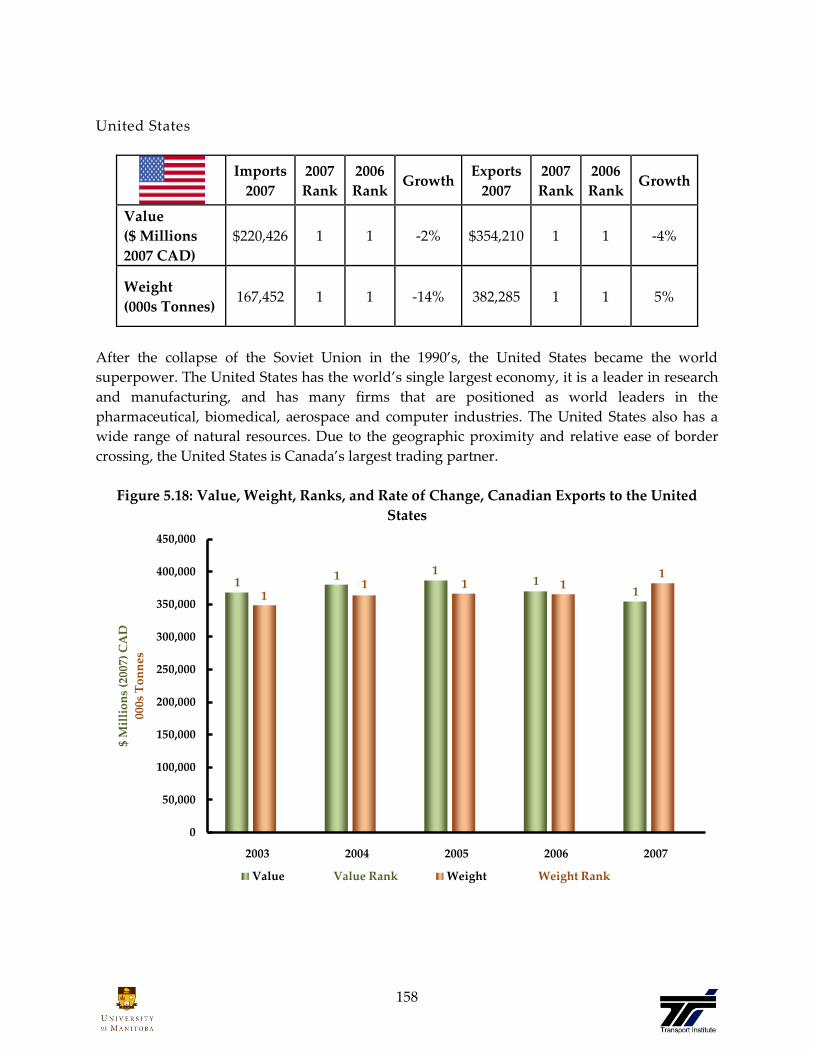
158
United States
Imports
2007
2007
Rank
2006
Rank Growth
Exports
2007
2007
Rank
2006
Rank Growth
Value
($ Millions
2007 CAD)
$220,426 1 1 -2% $354,210 1 1 -4%
Weight
(000s Tonnes) 167,452 1 1 -14% 382,285 1 1 5%
After the collapse of the Soviet Union in the 1990’s, the United States became the world
superpower. The United States has the world’s single largest economy, it is a leader in research
and manufacturing, and has many firms that are positioned as world leaders in the
pharmaceutical, biomedical, aerospace and computer industries. The United States also has a
wide range of natural resources. Due to the geographic proximity and relative ease of border
crossing, the United States is Canada’s largest trading partner.
Figure 5.18: Value, Weight, Ranks, and Rate of Change, Canadian Exports to the United
States
11 1
111
1 1 11
0
50,000
100,000
150,000
200,000
250,000
300,000
350,000
400,000
450,000
2003 2004 2005 2006 2007
$ M
illi
on
s (2
007)
CA
D
000s
To
nn
es
Value Value Rank Weight Weight Rank
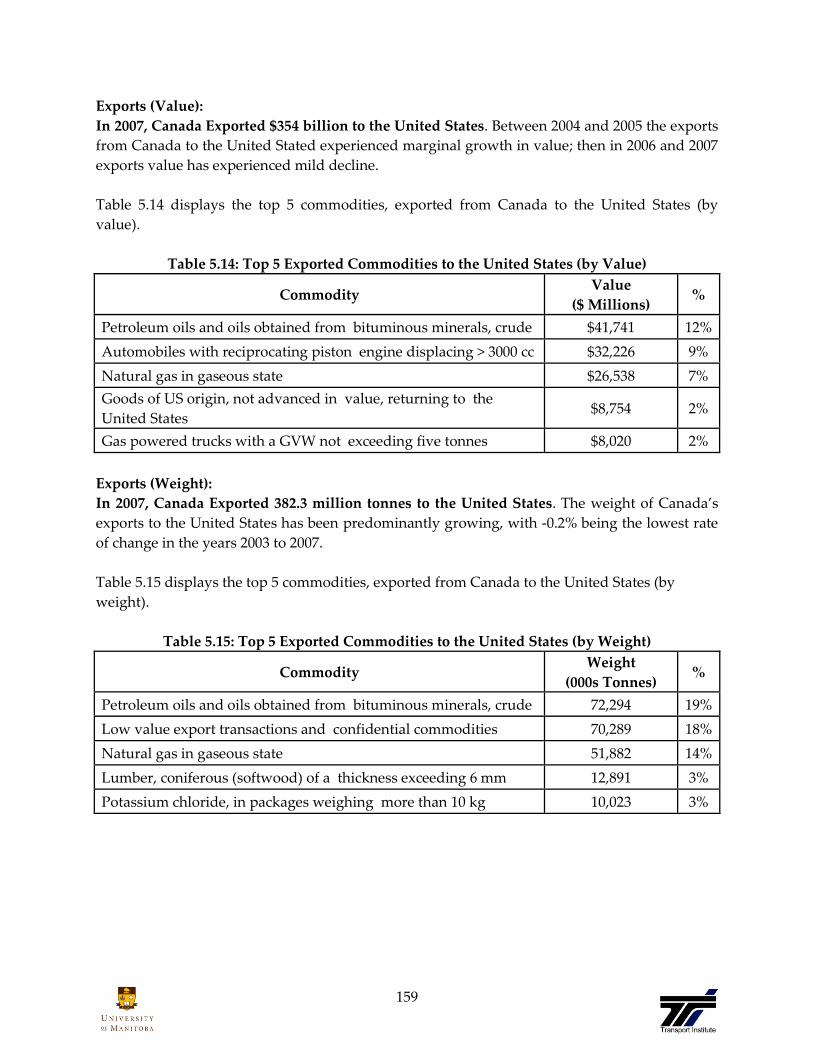
159
Exports (Value):
In 2007, Canada Exported $354 billion to the United States. Between 2004 and 2005 the exports
from Canada to the United Stated experienced marginal growth in value; then in 2006 and 2007
exports value has experienced mild decline.
Table 5.14 displays the top 5 commodities, exported from Canada to the United States (by
value).
Table 5.14: Top 5 Exported Commodities to the United States (by Value)
Commodity Value
($ Millions) %
Petroleum oils and oils obtained from bituminous minerals, crude $41,741 12%
Automobiles with reciprocating piston engine displacing > 3000 cc $32,226 9%
Natural gas in gaseous state $26,538 7%
Goods of US origin, not advanced in value, returning to the
United States $8,754 2%
Gas powered trucks with a GVW not exceeding five tonnes $8,020 2%
Exports (Weight):
In 2007, Canada Exported 382.3 million tonnes to the United States. The weight of Canada’s
exports to the United States has been predominantly growing, with -0.2% being the lowest rate
of change in the years 2003 to 2007.
Table 5.15 displays the top 5 commodities, exported from Canada to the United States (by
weight).
Table 5.15: Top 5 Exported Commodities to the United States (by Weight)
Commodity Weight
(000s Tonnes) %
Petroleum oils and oils obtained from bituminous minerals, crude 72,294 19%
Low value export transactions and confidential commodities 70,289 18%
Natural gas in gaseous state 51,882 14%
Lumber, coniferous (softwood) of a thickness exceeding 6 mm 12,891 3%
Potassium chloride, in packages weighing more than 10 kg 10,023 3%

160
The Canadian exports to the United States are displayed in terms of value and weight by
province of origin in Figure 5.19.
Figure 5.19: Province of Origin, Canadian Exports to United States
Value ($ Millions) and Weight (000s Tonnes)
Listed from west to east the provincial contributions to the national export value were British
Columbia with 5.4%, Alberta with 19.7%, Saskatchewan with 3.4%, Manitoba with 2.4%,
Ontario with 47.8%, Quebec with 14.7%, New Brunswick with 2.8%, Prince Edward Island with
0.2%, Nova Scotia with 1.2%, Newfoundland with 2.5%, the Yukon with 0%, the Northwest
Territories with 0%, and Nunavut with 0%.
Listed from west to east the provincial contributions to the national exports by weight were
British Columbia with 9.0%, Alberta with 31.9%, Saskatchewan with 8.1%, Manitoba with 2.3%,
Ontario with 26.4%, Quebec with 11.1%, New Brunswick with 3.5%, Prince Edward Island with
0.1%, Nova Scotia with 3.8%, Newfoundland with 3.8%, the Yukon with 0%, the Northwest
Territories with 0%, and Nunavut with 0%.
The Western Region exported 30.9% of the value and 51.2% of the weight. The Central Region
exported 62.5% of the value and 37.6% of the weight. The Atlantic Region exported 6.6% of the
value and 11.2% of the weight and the Territories exported the remaining 0% of the value and
0% of the weight.
$19,
097
$69,
784
$12,
174
$8,3
81
$169
,193
$5
2,1
49
$9,8
45
$563
$4,1
32
$8,8
66
$20
$5 $7
45
34,2
96
121,
800
30,8
21
8,74
0
101,
032
42,5
67
13,4
31
522 14
,402
14,6
44
21
5 6
0
20,000
40,000
60,000
80,000
100,000
120,000
140,000
160,000
180,000
BC AB SK MB ON QC NB PE NS NF YT NT NU
$ M
illi
on
s (2
007)
CA
D
000s
To
nn
es
Value Weight

161
The distribution of Canadian export value by region between 2003 and 2007 is displayed in
Figure 5.20.
Figure 5.20: Region of Origin, 2003-2007 Canadian Exports to United States - Value
($ Millions)
Since 2003 the large majority of the value of Canadian exports to the United States came from
Central Canada, with the second largest export region being Western Canada. In 2007 the value
of exports from the Central region decreased by $14,400 million; the value from the Western
region decreased $7,409 million; the Atlantic region increased exports by $6,237 million, and the
Territories increased their exports by $15 million.
$95,410 $104,330 $118,196 $116,845 $109,436
$254,739 $257,862 $249,806 $235,742 $221,342
$17,847 $17,910 $18,393 $17,170 $23,407
$77 $61 $21 $10 $25
0%
10%
20%
30%
40%
50%
60%
70%
80%
90%
100%
2003 2004 2005 2006 2007
Western Central Atlantic Territories

162
The distribution of Canadian exports by weight by region between 2003 and 2007 is displayed
in Figure 5.21.
Figure 5.21: Region of Origin, 2003-2007 Canadian Exports to United States – Weight
(000s Tonnes)
Since 2003, the large majority of the weight of Canadian exports to the United States were from
Western Canada, with the second largest export region being Central Canada.
In 2007 exports from the Western region experienced an decrease of 33.9 million tonnes, the
Central region experienced an increase of 40.8 million tonnes, the Atlantic region experienced
an increase of 9.5 million tonnes and the Territories experienced an increase of 29,000 tonnes.
207,965 221,123 223,753 229,599195,656
101,600 105,388 107,302 102,745143,599
38,824 37,155 35,150 33,081 42,999
25 3 2 2 31
0%
10%
20%
30%
40%
50%
60%
70%
80%
90%
100%
2003 2004 2005 2006 2007
Western Central Atlantic Territories

163
Figure 5.22: Value, Weight, Ranks, and Rate of Change, Canadian Imports from United States
Imports (Value):
In 2007, Canada Imported $220.4 billion from the United States. The value of Canada’s
imports from the United States has experienced marginal decrease between 2003 and 2007, with
the United States ranking as the top import partner by value during the same time period.
Table 5.16 displays the top 5 commodities, imported to Canada from the United States (by
value).
Table 5.16: Top 5 Imported Commodities from the United States (by Value)
Commodity Value
($ Millions) %
Automobiles with reciprocating piston engine displacing > 3000 cc $7,499 3%
Automobiles with reciprocating piston engine displacing > 1500 cc
to 3000 cc $7,263 3%
Gas powered trucks with a GVW not exceeding five tonnes $6,058 3%
Parts and accessories of bodies nes for motor vehicles $5,444 2%
Engines, spark-ignition reciprocating displacing more than 1000 cc $5,097 2%
1 1 1 1 1
1
1
1
1
1
0
50,000
100,000
150,000
200,000
250,000
2003 2004 2005 2006 2007
$ M
illi
on
s (2
007)
CA
D
000s
To
nn
es
Value Value Rank Weight Weight Rank

164
Imports (Weight):
In 2007, Canada Imported 167.5 million tonnes from the United States. The weight of
Canada’s imports from the United States experienced growth between 2003 and 2005 peaking at
31% in 2005 then declining to -8% in 2006 and -14% in 2007.
Table 5.17 displays the top 5 commodities, imported to Canada from the United States (by
weight).
Table 5.17: Top 5 Imported Commodities from the United States (by Weight)
Commodity 000s Tonnes %
Injection-moulding machines for working rubber or plastics nes 20,125 12%
Bituminous coal, whether or not pulveri- sed but not
agglomerated 8,196 5%
Coal nes, whether or not pulverised but not agglomerated 7,414 4%
Iron ores and concentrates, other than roasted iron pyrites,
agglomerated 7,235 4%
Low value export transactions and confidential commodities 6,547 4%
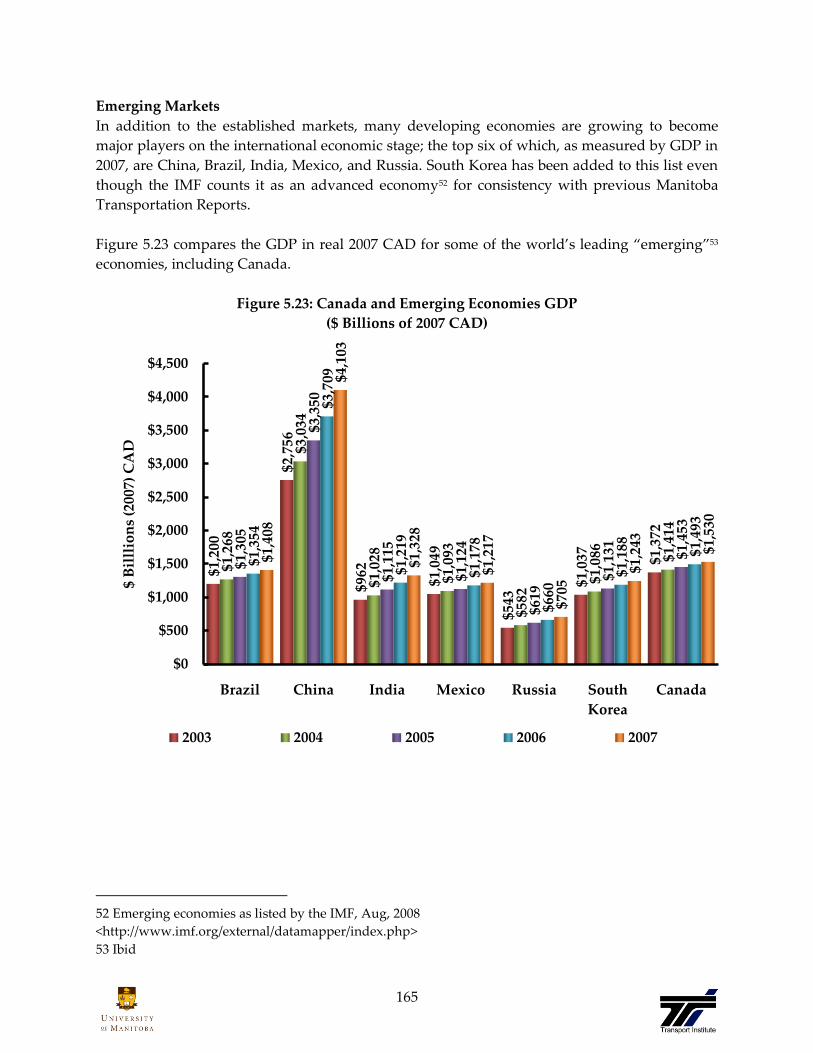
165
Emerging Markets
In addition to the established markets, many developing economies are growing to become
major players on the international economic stage; the top six of which, as measured by GDP in
2007, are China, Brazil, India, Mexico, and Russia. South Korea has been added to this list even
though the IMF counts it as an advanced economy52 for consistency with previous Manitoba
Transportation Reports.
Figure 5.23 compares the GDP in real 2007 CAD for some of the world’s leading ‚emerging‛53
economies, including Canada.
Figure 5.23: Canada and Emerging Economies GDP
($ Billions of 2007 CAD)
52 Emerging economies as listed by the IMF, Aug, 2008
<http://www.imf.org/external/datamapper/index.php>
53 Ibid
$1,2
00
$2,7
56
$962
$1,0
49
$543
$1,0
37 $1,3
72
$1,2
68
$3,0
34
$1,0
28
$1,0
93
$582
$1,0
86 $1,4
14
$1,3
05
$3,3
50
$1,1
15
$1,1
24
$619
$1,1
31 $1,4
53
$1,3
54
$3,7
09
$1,2
19
$1,1
78
$660
$1,1
88 $1,4
93
$1,4
08
$4,1
03
$1,3
28
$1,2
17
$705
$1,2
43 $1,5
30
$0
$500
$1,000
$1,500
$2,000
$2,500
$3,000
$3,500
$4,000
$4,500
Brazil China India Mexico Russia South
Korea
Canada
$ B
illl
ion
s (2
007)
CA
D
2003 2004 2005 2006 2007

166
Each of the developing economies shown here has enjoyed positive growth over the past five
years, at various rates of growth. Though Canada is considered an advanced economy, it is
barely larger then Brazil in terms of GDP. However, it should be noted that Canada had the 6th
largest GDP of the world when counting the EU13, so these numbers are not reason to start
thinking of Canada as a developing nation, but rather to acknowledge our position as a world
leader and a bridge between the developed and developing worlds.
Figure 5.24 compares the GDP in terms of rate of change for some of the world’s leading
‚emerging‛ economies, including Canada.
Figure 5.24: Emerging Economies Rate of Change
Every nation displayed has shown positive rates of change since 2003. China with a consistent,
high rate of growth that continues to increase with a measure of stability not displayed in any of
the other displayed economies. Canada’s rate of change appears relatively independent. This
shows that Canada has a diversified trade portfolio that insulates it from many of the global
shocks and strains that may occur. However, given Canada’s erratic rate of change it is clear
that it experiences its own boom-bust cycles.
0.0%
2.0%
4.0%
6.0%
8.0%
10.0%
12.0%
2003 2004 2005 2006 2007
Rat
e o
f C
han
ge
Brazil China India Mexico Russia South Korea Canada

167
Brazil
Imports
2007
2007
Rank
2006
Rank Growth
Exports
2007
2007
Rank
2006
Rank Growth
Value
($ Millions
2007 CAD)
$3,341 14 13 -5% $1,513 17 17 10%
Weight
(000s Tonnes) 5,102 10 5 -44% 4,700 9 10 -18%
Since the early 1800’s Brazil has gone from being a Portuguese protectorate to an independent
monarchy to a military republic to a populist state to a civilian led nation. Brazil continues to
pursue industrial and agricultural growth and development of its interior. Exploiting vast
natural resources and a large labour pool, today it is South America's leading economic power
and a regional leader.
Figure 5.25: Value, Weight, Ranks, and Rate of Change of Canadian Exports to Brazil
16 1717
17 17
11
10 1110
9
0
1,000
2,000
3,000
4,000
5,000
6,000
7,000
2003 2004 2005 2006 2007
$ M
illi
on
s (2
007)
CA
D
000s
To
nn
es
Value Value Rank Weight Weight Rank

168
Exports (Value):
In 2007, Canada Exported $1.5 billion to Brazil. The value of Canada’s exports to Brazil have
consistently experienced double digit growth each year between 2003 and 2007 with the
exception of 2004 (3%).
Table 5.18 displays the top 5 commodities exported from Canada to Brazil (by value).
Table 5.18: Top 5 Exported Commodities to Brazil (by Value)
Commodity Value
($ Millions) %
Potassium chloride, in packages weighing more than 10 kg $215 14%
Bituminous coal, whether or not pulveri- sed but not
agglomerated $157 10%
Newsprint, in rolls or sheets $153 10%
Wheat nes and meslin $85 6%
Sulphur of all kinds, o/t sublimed, precipitated and colloidal
sulphur $55 4%
Exports (Weight):
In 2007, Canada Exported 4.7 million tonnes to Brazil. The weight of Canada’s exports to
Brazil have fluctuated, ranging from -7% in 2003 to 19% in 2004 and back to decreasing rates for
2005 to 2007.
Table 5.19 displays the top 5 commodities exported from Canada to Brazil (by weight).
Table 5.19: Top 5 Exported Commodities to Brazil (by Weight)
Commodity Weight
(000s Tonnes) %
Bituminous coal, whether or not pulveri- sed but not
agglomerated 1,449 31%
Potassium chloride, in packages weighing more than 10 kg 1,179 25%
Sulphur of all kinds, o/t sublimed, precipitated and colloidal
sulphur 606 13%
Wheat nes and meslin 328 7%
Newsprint, in rolls or sheets 221 5%

169
The Canadian exports to Brazil are displayed in terms of value and weight by province of origin
in Figure 5.26.
Figure 5.26: Province of Origin, Canadian Exports to Brazil
Value ($ Millions) and Weight (000s Tonnes)
Listed from west to east the provincial contributions to the national export value were British
Columbia with 16.0%, Alberta with 11.0%, Saskatchewan with 14.8%, Manitoba with 1.6%,
Ontario with 25.4%, Quebec with 24.1%, New Brunswick with 4.5%, Prince Edward Island with
0.1%, Nova Scotia with 2.2%, Newfoundland with 0.2%, the Yukon with 0%, the Northwest
Territories with 0%, and Nunavut with 0%.
Listed from west to east the provincial contributions to the national exports by weight were
British Columbia with 36.9%, Alberta with 17.7%, Saskatchewan with 23.0%, Manitoba with
1.2%, Ontario with 3.6%, Quebec with 6.2%, New Brunswick with 6.7%, Prince Edward Island
with 0%, Nova Scotia with 1.2%, Newfoundland with 3.4%, the Yukon with 0%, the Northwest
Territories with 0%, and Nunavut with 0%.
The Western Region exported 43.4% of the value and 78.7% of the weight. The Central Region
exported 49.6% of the value and 9.9% of the weight. The Atlantic Region exported 7.0% of the
value and 11.4% of the weight and the Territories exported the remaining 0% of the value and
0% of the weight.
$242
$166
$2
24
$25
$385
$3
65
$68
$2 $34
$2 $0 $0 $54
1,73
2
831
1,08
0
58 17
1 293
316
2 55
162
0 0 0
0
500
1,000
1,500
2,000
BC AB SK MB ON QC NB PE NS NF YT NT NU
$ M
ilio
ns
(200
7) C
AD
000s
To
nn
es
Value Weight

170
The regional distribution of Canadian export value by region between 2003 to 2007 is displayed
in Figure 5.27.
Figure 5.27: Region of Origin, 2003-2007 Canadian Exports to Brazil – Value
($ Millions)
Since 2003 the slim majority of the value of Canadian exports to Brazil were from Central
Canada, with the second largest export region being Western Canada.
In 2007 the value of exports from the Central region increased by $51 million; the value from the
Western region increased by $98 million; the Atlantic region decreased exports by $14 million,
and the Territories did not change.
$535 $511$492 $559 $657
$374$394 $559 $699 $750
$99 $135 $112 $120 $106
$0 $0 $0 $0 $0
0%
10%
20%
30%
40%
50%
60%
70%
80%
90%
100%
2003 2004 2005 2006 2007
Western Central Atlantic Territories
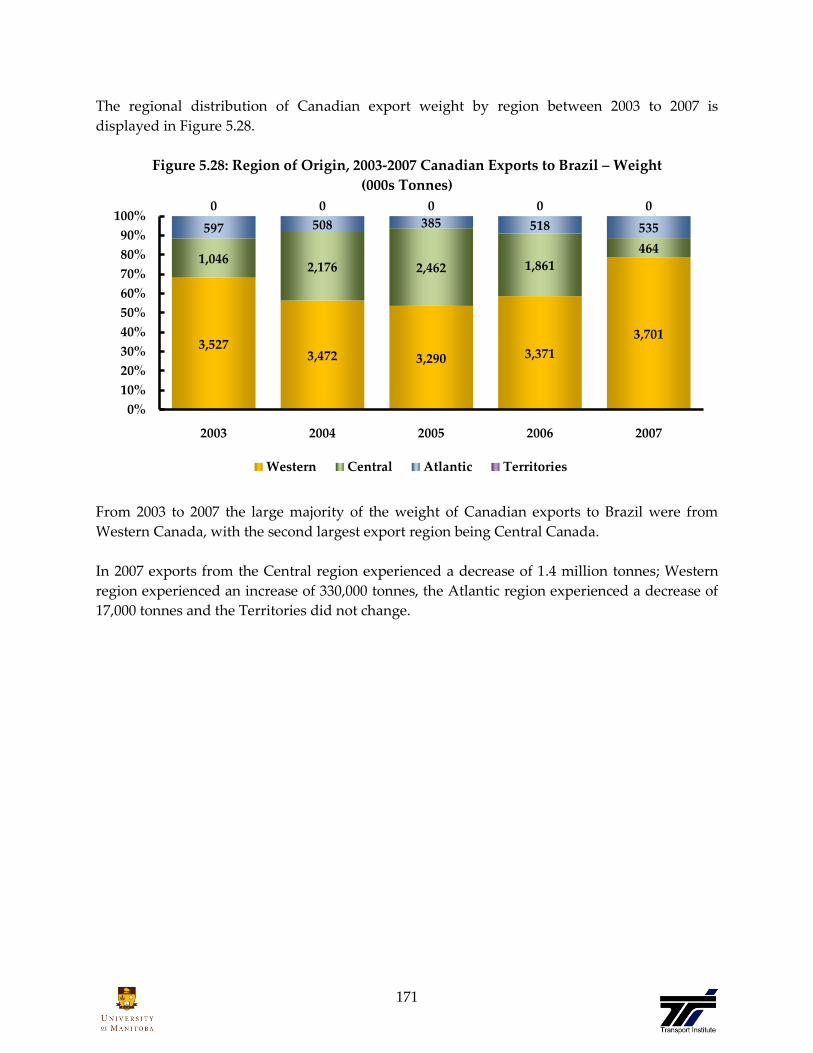
171
The regional distribution of Canadian export weight by region between 2003 to 2007 is
displayed in Figure 5.28.
Figure 5.28: Region of Origin, 2003-2007 Canadian Exports to Brazil – Weight
(000s Tonnes)
From 2003 to 2007 the large majority of the weight of Canadian exports to Brazil were from
Western Canada, with the second largest export region being Central Canada.
In 2007 exports from the Central region experienced a decrease of 1.4 million tonnes; Western
region experienced an increase of 330,000 tonnes, the Atlantic region experienced a decrease of
17,000 tonnes and the Territories did not change.
3,5273,472 3,290 3,371
3,701
1,0462,176 2,462 1,861
464
597 508 385 518 535
0 0 0 0 0
0%
10%
20%
30%
40%
50%
60%
70%
80%
90%
100%
2003 2004 2005 2006 2007
Western Central Atlantic Territories
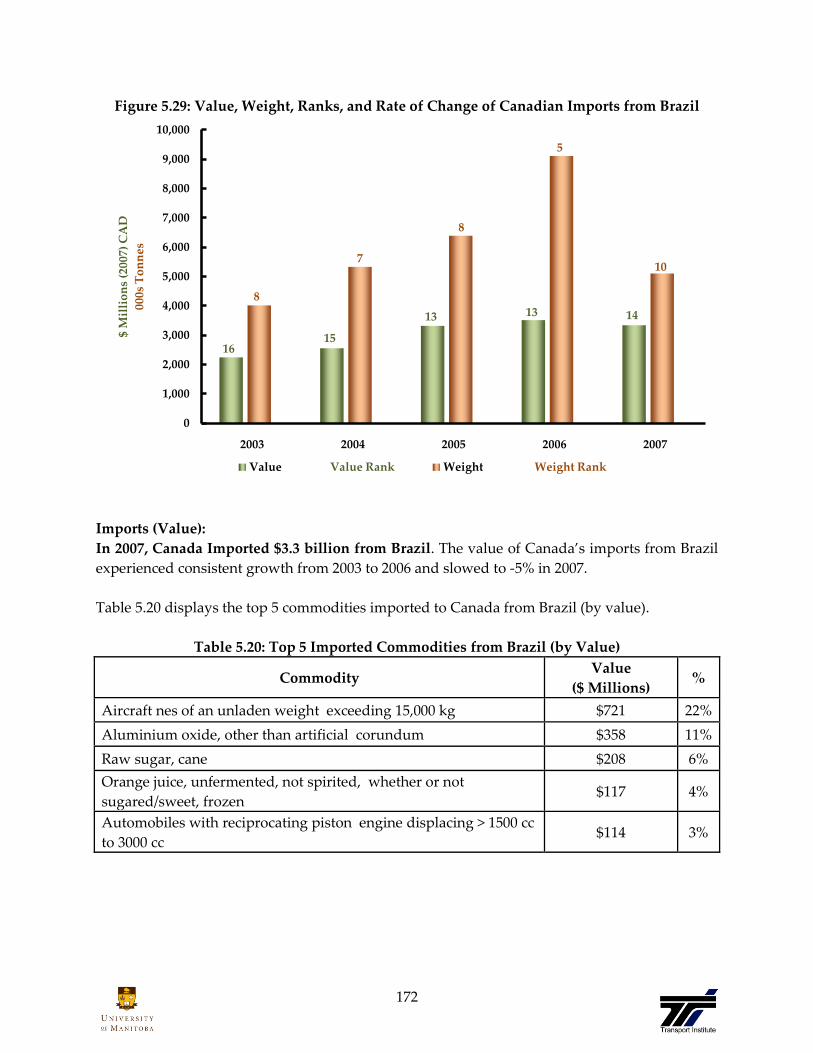
172
Figure 5.29: Value, Weight, Ranks, and Rate of Change of Canadian Imports from Brazil
Imports (Value):
In 2007, Canada Imported $3.3 billion from Brazil. The value of Canada’s imports from Brazil
experienced consistent growth from 2003 to 2006 and slowed to -5% in 2007.
Table 5.20 displays the top 5 commodities imported to Canada from Brazil (by value).
Table 5.20: Top 5 Imported Commodities from Brazil (by Value)
Commodity Value
($ Millions) %
Aircraft nes of an unladen weight exceeding 15,000 kg $721 22%
Aluminium oxide, other than artificial corundum $358 11%
Raw sugar, cane $208 6%
Orange juice, unfermented, not spirited, whether or not
sugared/sweet, frozen $117 4%
Automobiles with reciprocating piston engine displacing > 1500 cc
to 3000 cc $114 3%
1615
13 13 14
8
7
8
5
10
0
1,000
2,000
3,000
4,000
5,000
6,000
7,000
8,000
9,000
10,000
2003 2004 2005 2006 2007
$ M
illi
on
s (2
007)
CA
D
000s
To
nn
es
Value Value Rank Weight Weight Rank

173
Imports (Weight):
In 2007, Canada Imported 5.1 million tonnes from Brazil. The weight of Canada’s imports
from Brazil has experienced double digit growth every year from 2003 to 2006, dropping to -
44% in 2007. Table 5.21 displays the top 5 commodities imported to Canada from Brazil (by
weight).
Table 5.21: Top 5 Imported Commodities from Brazil (by Weight)
Commodity Weight
(000s Tonnes) %
Aluminium ores and concentrates 1,683 33%
Aluminium oxide, other than artificial corundum 972 19%
Raw sugar, cane 852 17%
Kaolin and other kaolinic clays, whether or not calcined 358 7%
Axles and wheels and parts 165 3%
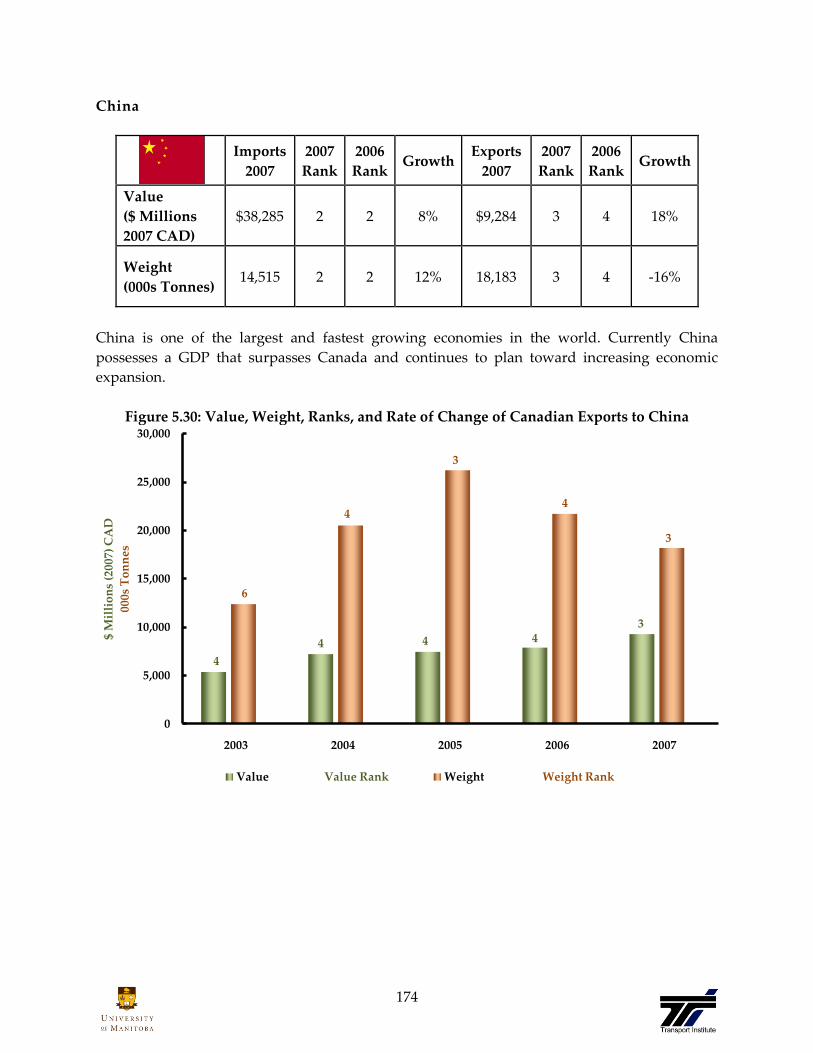
174
China
Imports
2007
2007
Rank
2006
Rank Growth
Exports
2007
2007
Rank
2006
Rank Growth
Value
($ Millions
2007 CAD)
$38,285 2 2 8% $9,284 3 4 18%
Weight
(000s Tonnes) 14,515 2 2 12% 18,183 3 4 -16%
China is one of the largest and fastest growing economies in the world. Currently China
possesses a GDP that surpasses Canada and continues to plan toward increasing economic
expansion.
Figure 5.30: Value, Weight, Ranks, and Rate of Change of Canadian Exports to China
4
4 4 43
6
4
3
4
3
0
5,000
10,000
15,000
20,000
25,000
30,000
2003 2004 2005 2006 2007
$ M
illi
on
s (2
007)
CA
D
000s
To
nn
es
Value Value Rank Weight Weight Rank

175
Exports (Value):
In 2007, Canada Exported $9.3 billion to China. The value of Canada’s exports to China have
consistently grown between 2003 and 2007, experiencing double digit growth every year except
2005 and 2006 when it slowed to 3% and 6% respectively. Table 5.22 displays the top 5
commodities exported from Canada to China (by value).
Table 5.22: Top 5 Exported Commodities to China (by Value)
Commodity Value
($ Millions) %
Ethylene glycol (ethanediol) $1,034 11%
Nickel unwrought, not alloyed $835 9%
Chemical wood pulp, soda or sulphate, coniferous, semi-bl or
bleached, nes $831 9%
Potassium chloride, in packages weighing more than 10 kg $415 4%
Wood pulp obtained by a combination of mechanical & chemical
pulping processes $404 4%
Exports (Weight):
In 2007, Canada Exported 18.2 million tonnes to China. The weight of Canada’s exports to
China experienced double digit growth from 2003 to 2005, but turned in 2006 and has been
experiencing double digit decline for 2006 and 2007. Table 5.23 displays the top 5 commodities
exported from Canada to China (by weight).
Table 5.23: Top 5 Exported Commodities to China (by Weight)
Commodity Weight
(000s Tonnes) %
Iron ores and concentrates, other than roasted iron pyrites,
agglomerated 2,650 15%
Sulphur of all kinds, o/t sublimed, precipitated and colloidal
sulphur 2,475 14%
Potassium chloride, in packages weighing more than 10 kg 2,348 13%
Iron ores and concentrates, other than roasted iron pyrites, non-
agglomerated 1,838 10%
Chemical wood pulp, soda or sulphate, coniferous, semi-bl or
bleached, nes 1,183 7%
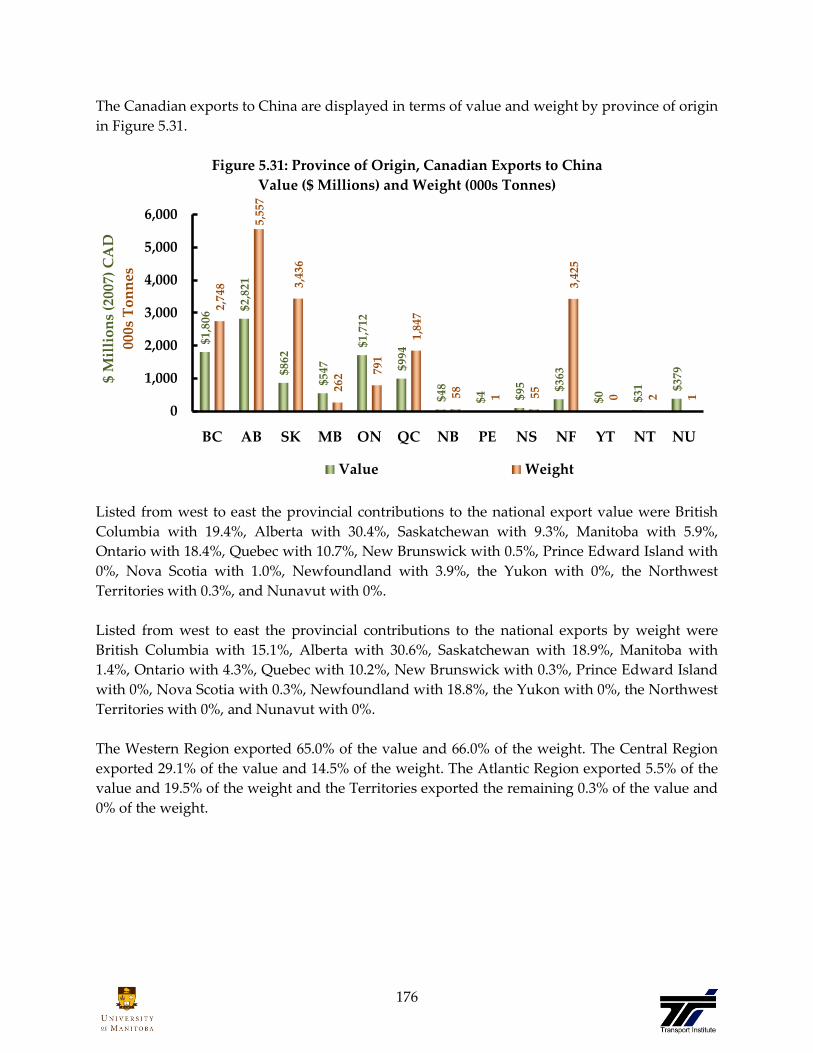
176
The Canadian exports to China are displayed in terms of value and weight by province of origin
in Figure 5.31.
Figure 5.31: Province of Origin, Canadian Exports to China
Value ($ Millions) and Weight (000s Tonnes)
Listed from west to east the provincial contributions to the national export value were British
Columbia with 19.4%, Alberta with 30.4%, Saskatchewan with 9.3%, Manitoba with 5.9%,
Ontario with 18.4%, Quebec with 10.7%, New Brunswick with 0.5%, Prince Edward Island with
0%, Nova Scotia with 1.0%, Newfoundland with 3.9%, the Yukon with 0%, the Northwest
Territories with 0.3%, and Nunavut with 0%.
Listed from west to east the provincial contributions to the national exports by weight were
British Columbia with 15.1%, Alberta with 30.6%, Saskatchewan with 18.9%, Manitoba with
1.4%, Ontario with 4.3%, Quebec with 10.2%, New Brunswick with 0.3%, Prince Edward Island
with 0%, Nova Scotia with 0.3%, Newfoundland with 18.8%, the Yukon with 0%, the Northwest
Territories with 0%, and Nunavut with 0%.
The Western Region exported 65.0% of the value and 66.0% of the weight. The Central Region
exported 29.1% of the value and 14.5% of the weight. The Atlantic Region exported 5.5% of the
value and 19.5% of the weight and the Territories exported the remaining 0.3% of the value and
0% of the weight.
$1,8
06
$2,8
21
$862
$547
$1,7
12
$994
$48
$4 $95 $3
63
$0 $31 $3
79
2,74
8
5,55
7
3,43
6
262 79
1
1,84
7
58
1 55
3,42
5
0 2 1
0
1,000
2,000
3,000
4,000
5,000
6,000
BC AB SK MB ON QC NB PE NS NF YT NT NU
$ M
illi
on
s (2
007)
CA
D
000s
To
nn
es
Value Weight

177
The distribution of Canadian export value by region between 2003 to 2007 is displayed in Figure
5.32.
Figure 5.32: Region of Origin, 2003-2007 Canadian Exports to China – Value
($ Millions)
Since 2003, the majority of the value of Canadian exports to China were from Western Canada,
with the second largest export region being Central Canada. In 2007 the value of exports from
the Central region increased by $116 million; the value from the Western region increased by
$1,331 million; the Atlantic region decreased exports by $50 million, and the Territories
decreased exports by $8 million.
The 2003-2007 regional distribution of Canadian exports by weight is displayed in Figure 5.33.
Figure 5.33: Region of Origin, 2003-2007 Canadian Exports to China - Weight
(000s Tonnes)
$2,783$4,637 $4,590 $4,704 $6,035
$2,167$2,169 $2,303 $2,590
$2,706
$419 $415 $462 $561 $511
$0 $1 $95 $40 $32
0%
20%
40%
60%
80%
100%
2003 2004 2005 2006 2007
Western Central Atlantic Territories
6,25112,216
13,369 10,390
12,004
4,0526,080
8,8316,976
2,637
2,077 2,222 3,959 4,353 3,540
0 0 64 3 2
0%
20%
40%
60%
80%
100%
2003 2004 2005 2006 2007
Western Central Atlantic Territories

178
Between 2003 to 2007 the large majority of the weight of Canadian exports to China were from
Western Canada, with the second largest export region being Atlantic Canada (Newfoundland,
New Brunswick, Prince Edward Island, and Nova Scotia).
In 2007 exports from the Central region experienced a decrease of 4.3 million tonnes; Western
region experienced an increase of 1.6 million tonnes, the Atlantic region experienced a decrease
of 813,000 tonnes and the Territories decreased exports by 1,000 tonnes.
Figure 5.34: Value, Weight, Ranks, and Rate of Change of Canadian Imports from China
2
2
2
2
2
6
6
32
2
0
5,000
10,000
15,000
20,000
25,000
30,000
35,000
40,000
45,000
2003 2004 2005 2006 2007
$ M
illi
on
s (2
007)
CA
D
000s
To
nn
es
Value Value Rank Weight Weight Rank
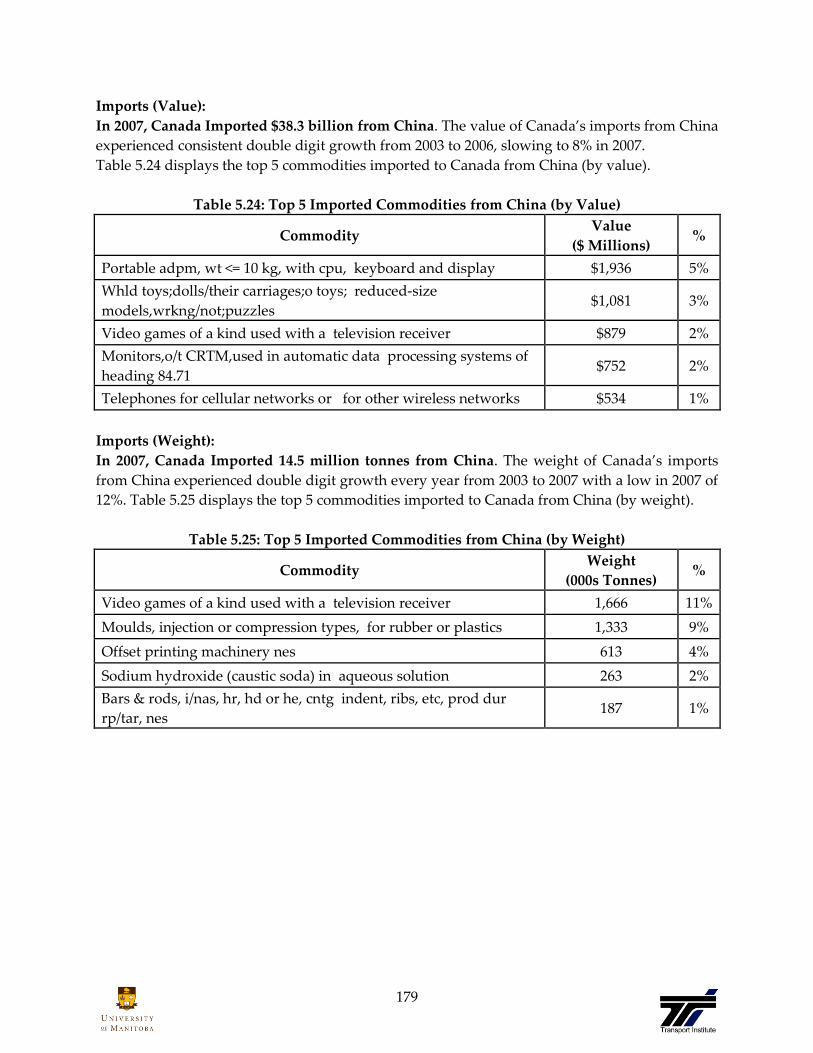
179
Imports (Value):
In 2007, Canada Imported $38.3 billion from China. The value of Canada’s imports from China
experienced consistent double digit growth from 2003 to 2006, slowing to 8% in 2007.
Table 5.24 displays the top 5 commodities imported to Canada from China (by value).
Table 5.24: Top 5 Imported Commodities from China (by Value)
Commodity Value
($ Millions) %
Portable adpm, wt <= 10 kg, with cpu, keyboard and display $1,936 5%
Whld toys;dolls/their carriages;o toys; reduced-size
models,wrkng/not;puzzles $1,081 3%
Video games of a kind used with a television receiver $879 2%
Monitors,o/t CRTM,used in automatic data processing systems of
heading 84.71 $752 2%
Telephones for cellular networks or for other wireless networks $534 1%
Imports (Weight):
In 2007, Canada Imported 14.5 million tonnes from China. The weight of Canada’s imports
from China experienced double digit growth every year from 2003 to 2007 with a low in 2007 of
12%. Table 5.25 displays the top 5 commodities imported to Canada from China (by weight).
Table 5.25: Top 5 Imported Commodities from China (by Weight)
Commodity Weight
(000s Tonnes) %
Video games of a kind used with a television receiver 1,666 11%
Moulds, injection or compression types, for rubber or plastics 1,333 9%
Offset printing machinery nes 613 4%
Sodium hydroxide (caustic soda) in aqueous solution 263 2%
Bars & rods, i/nas, hr, hd or he, cntg indent, ribs, etc, prod dur
rp/tar, nes 187 1%

180
India
Imports
2007
2007
Rank
2006
Rank Growth
Exports
2007
2007
Rank
2006
Rank Growth
Value
($ Millions
2007 CAD)
$1,979 22 22 0% $1,761 13 14 2%
Weight
(000s Tonnes) 523 36 40 -14% 4,789 8 13 11%
India is one of the largest and fastest growing economies in the world. With a large population
and a rising standard of living, India could become a very important trade partner in the years
to come.
Figure 5.35: Value, Weight, Ranks, and Rate of Change, Canadian Exports to India
The increase in export weight in 2005 is noteable as it marked an increase in the export tonnage
of Canadian goods to India. This initially was due to a large shipment of ‚Reel Fed Offset
Printing Machinery‛, that was exported from Ontario in 2005. Although exports of this
commodity declined in 2006 (-80.1%), total export tonnage only declined by 5.8% (attributed to
increased export of wheat). Export tonnage increased by 11.5% in 2007 due to increased exports
of agricultural products (e.g. peas, lentils, etc.) and industrial machinery (horizontal lathes).
1818
18
14 1317
16
13
13
8
0
500
1,000
1,500
2,000
2,500
3,000
3,500
4,000
4,500
5,000
2003 2004 2005 2006 2007
Mil
lio
ns
(200
7) C
AD
000s
To
nn
es
Value Value Rank Weight Weight Rank

181
Exports (Value):
In 2007, Canada Exported $1.8 billion to India. The value of Canada’s exports to India
experienced double digit annual growth between 2003 and 2006 and recorded a five year low of
2% in 2007. Table 5.26 displays the top 5 commodities exported from Canada to India (by
value).
Table 5.26: Top 5 Exported Commodities to India (by Value)
Commodity Value
($ Millions) %
Peas dried, shelled, whether or not skinned or split $257 15%
Potassium chloride, in packages weighing more than 10 kg $177 10%
Newsprint, in rolls or sheets $132 8%
Copper ores and concentrates $109 6%
Wheat nes and meslin $94 5%
Exports (Weight):
In 2007, Canada Exported 4.8 million tonnes to India. The weight of Canada’s exports to India
experienced double digit growth in 2003 and 2004 and grew to 139% in 2005. In 2006 Canada’s
annual export tonnage declined at a rate of -6%, rising back to 11% in 2007. Table 5.27 displays
the top 5 commodities exported from Canada to India (by weight).
Table 5.27: Top 5 Exported Commodities to India (by Weight)
Commodity Weight
(000s Tonnes) %
Peas dried, shelled, whether or not skinned or split 1,072 22%
Horizontal lathes numerically controlled for removing metal 1,047 22%
Potassium chloride, in packages weighing more than 10 kg 999 21%
Wheat nes and meslin 315 7%
Newsprint, in rolls or sheets 208 4%

182
The Canadian exports to India are displayed in terms of value and weight by province of origin
in Figure 5.36.
Figure 5.36: Province of Origin, Canadian Exports to India
Value ($ Millions) and Weight (000s Tonnes)
Listed from west to east the provincial contributions to the national export value were British
Columbia with 13.7%, Alberta with 6.8%, Saskatchewan with 32.0%, Manitoba with 3.7%,
Ontario with 18.3%, Quebec with 15.7%, New Brunswick with 3.7%, Prince Edward Island with
0.1%, Nova Scotia with 2.7%, Newfoundland with 2.1%, the Yukon with 0%, the Northwest
Territories with 1.2%, and Nunavut with 0%.
Listed from west to east the provincial contributions to the national exports by weight were
British Columbia with 5.0%, Alberta with 3.9%, Saskatchewan with 50.3%, Manitoba with 1.2%,
Ontario with 29.1%, Quebec with 6.9%, New Brunswick with 1.7%, Prince Edward Island with
0%, Nova Scotia with 1.5%, Newfoundland with 0.4%, the Yukon with 0%, the Northwest
Territories with 0%, and Nunavut with 0%.
The Western Region exported 56.2% of the value and 60.4% of the weight. The Central Region
exported 34.0% of the value and 36.0% of the weight. The Atlantic Region exported 8.5% of the
value and 3.6% of the weight and the Territories exported the remaining 1.2% of the value and
0% of the weight.
$242
$119
$564
$65 $3
22
$277
$65
$2 $47
$36
$0 $20 $1
35239
187
2,41
0
55
1,39
1
333
80
1 73
19
- 0
0
0
500
1,000
1,500
2,000
2,500
3,000
BC AB SK MB ON QC NB PE NS NF YT NT NU
$ M
illi
on
s (2
007)
CA
D
000s
To
nn
es
Value Weight

183
The distribution of Canadian export value by region between 2003 to 2007 is displayed in Figure
5.37.
Figure 5.37: Region of Origin, 2003-2007 Canadian Exports to India - Value
($ Millions)
Since 2003 the majority of the value of Canadian exports to India were from Western Canada,
with the second largest export region being Central Canada. In 2007 the value of exports from
the Central region increased by $107 million; the value from the Western region decreased by
$81 million; the Atlantic region increased exports by $12 million, and the Territories decreased
exports by $1 million.
The distribution of Canadian exports by weight by region since the year 2003 is displayed in
Figure 5.38.
Figure 5.38: Region of Origin, 2003-2007 Canadian Exports to India – Weight
(000s Tonnes)
$401 $444 $597$1,071 $990
$368 $403$427
$492 $599
$92 $109 $103 $138 $150$0 $0 $8 $22 $21
0%
20%
40%
60%
80%
100%
2003 2004 2005 2006 2007
Western Central Atlantic Territories
1,147 1,295
1,857
3,0612,892
287 461
2,562
1,0191,724
146 152 142 216 173
0 0 1 0 0
0%
20%
40%
60%
80%
100%
2003 2004 2005 2006 2007
Western Central Atlantic Territories
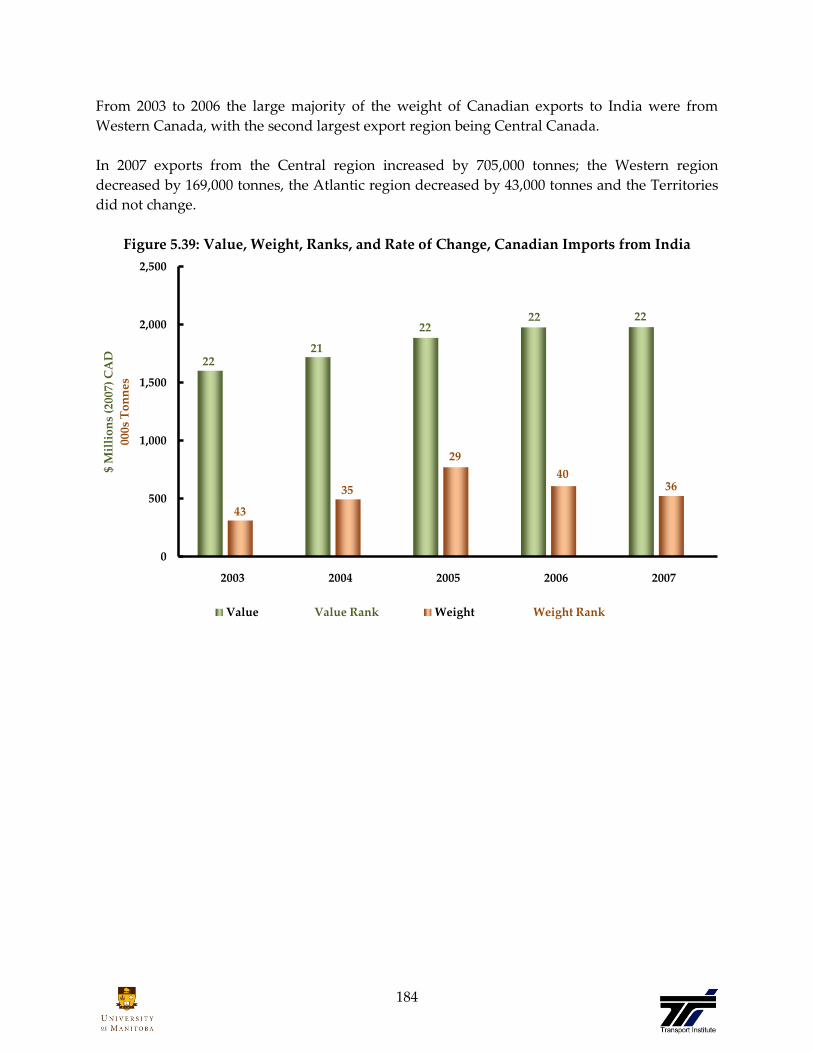
184
From 2003 to 2006 the large majority of the weight of Canadian exports to India were from
Western Canada, with the second largest export region being Central Canada.
In 2007 exports from the Central region increased by 705,000 tonnes; the Western region
decreased by 169,000 tonnes, the Atlantic region decreased by 43,000 tonnes and the Territories
did not change.
Figure 5.39: Value, Weight, Ranks, and Rate of Change, Canadian Imports from India
2221
2222 22
43
35
29
4036
0
500
1,000
1,500
2,000
2,500
2003 2004 2005 2006 2007
$ M
illi
on
s (2
007)
CA
D
000s
To
nn
es
Value Value Rank Weight Weight Rank
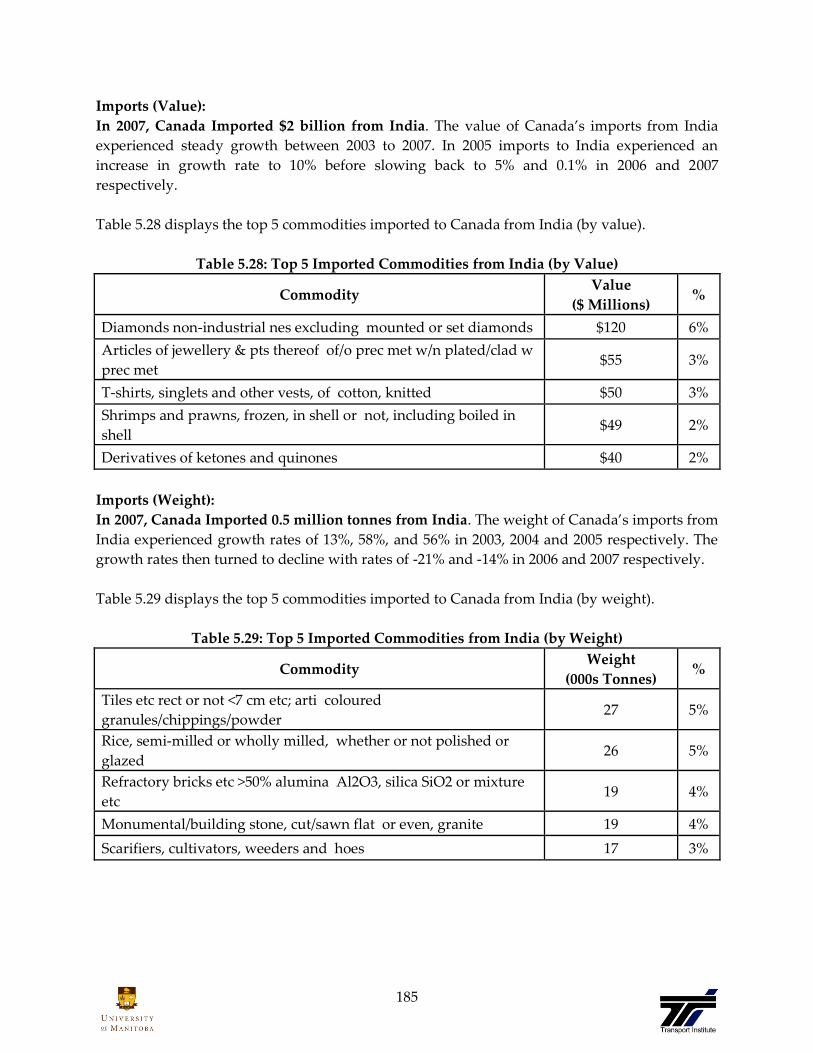
185
Imports (Value):
In 2007, Canada Imported $2 billion from India. The value of Canada’s imports from India
experienced steady growth between 2003 to 2007. In 2005 imports to India experienced an
increase in growth rate to 10% before slowing back to 5% and 0.1% in 2006 and 2007
respectively.
Table 5.28 displays the top 5 commodities imported to Canada from India (by value).
Table 5.28: Top 5 Imported Commodities from India (by Value)
Commodity Value
($ Millions) %
Diamonds non-industrial nes excluding mounted or set diamonds $120 6%
Articles of jewellery & pts thereof of/o prec met w/n plated/clad w
prec met $55 3%
T-shirts, singlets and other vests, of cotton, knitted $50 3%
Shrimps and prawns, frozen, in shell or not, including boiled in
shell $49 2%
Derivatives of ketones and quinones $40 2%
Imports (Weight):
In 2007, Canada Imported 0.5 million tonnes from India. The weight of Canada’s imports from
India experienced growth rates of 13%, 58%, and 56% in 2003, 2004 and 2005 respectively. The
growth rates then turned to decline with rates of -21% and -14% in 2006 and 2007 respectively.
Table 5.29 displays the top 5 commodities imported to Canada from India (by weight).
Table 5.29: Top 5 Imported Commodities from India (by Weight)
Commodity Weight
(000s Tonnes) %
Tiles etc rect or not <7 cm etc; arti coloured
granules/chippings/powder 27 5%
Rice, semi-milled or wholly milled, whether or not polished or
glazed 26 5%
Refractory bricks etc >50% alumina Al2O3, silica SiO2 or mixture
etc 19 4%
Monumental/building stone, cut/sawn flat or even, granite 19 4%
Scarifiers, cultivators, weeders and hoes 17 3%

186
Mexico
Imports
2007
2007
Rank
2006
Rank Growth
Exports
2007
2007
Rank
2006
Rank Growth
Value
($ Millions
2007 CAD)
$17,173 3 3 4% $4,890 5 5 8%
Weight
(000s Tonnes) 7,358 8 7 27% 5,145 7 11 -5%
Mexico has a free market economy in the trillion dollar class. It contains a mixture of modern
and outmoded industry and agriculture, increasingly dominated by the private sector. Recent
administrations have expanded competition in seaports, railroads, telecommunications,
electricity generation, natural gas distribution, and airports.54 Mexico is a member nation of the
NASCO Corridor and NAFTA, and is therefore an important trade partner.
Figure 5.40: Value, Weight, Ranks, and Rate of Change, Canadian Exports to Mexico
54 ‚Economy – ‘Mexico’, The World Factbook. Central Intelligence Agency. 23 March, 2009
<https://www.cia.gov/library/publications/the-world-factbook/geos/mx.html#Econ>
65 5
5 5
14
12
6
11 7
0
2,000
4,000
6,000
8,000
10,000
12,000
14,000
16,000
18,000
2003 2004 2005 2006 2007
$ M
illi
on
s (2
007)
CA
D
000s
To
nn
es
Value Value Rank Weight Weight Rank

187
Exports (Value):
In 2007, Canada Exported $4.9 billion to Mexico. The value of Canada’s exports to Mexico
experienced growth from 2004 to 2007, with a high of 32% in 2006, slowing down to 8% in 2007.
Table 5.30 displays the top 5 commodities exported from Canada to Mexico (by value).
Table 5.30: Top 5 Exported Commodities to Mexico (by Value)
Commodity Value
($ Millions) %
Low erucic acid rape or colza seeds, w/n broken $451 9%
Wheat nes and meslin $215 4%
Automobiles with reciprocating piston engine displacing > 1500 cc
to 3000 cc $202 4%
Gear boxes (transmissions), for motor vehicles and parts thereof $182 4%
Motor vehicle parts nes $177 4%
Exports (Weight):
In 2007, Canada Exported 5.1 million tonnes to Mexico. The weight of Canada’s exports to
Mexico experienced double digit growth from 2003 to 2004, 270% in 2005, and has been
experiencing decline for 2006 (-65%) and 2007 (-5%).
Table 5.31 displays the top 5 commodities exported from Canada to Mexico (by weight).
Table 5.31: Top 5 Exported Commodities to Mexico (by Weight)
Commodity Weight
(000s Tonnes) %
Low erucic acid rape or colza seeds, w/n broken 1,114 22%
Low value export transactions and confidential commodities 956 19%
Wheat nes and meslin 814 16%
Bituminous coal, whether or not pulverised but not agglomerated 230 4%
Bars & rods, alloy steel, o/t stainless nfw than hot
rolled/drawn/extruded, nes 166 3%

188
The Canadian exports to Mexico are displayed in terms of value and weight by province of
origin in Figure 5.41.
Figure 5.41: Province of Origin, Canadian Exports to Mexico
Value ($ Millions) and Weight (000s Tonnes)
Listed from west to east the provincial contributions to the national export value were British
Columbia with 4.2%, Alberta with 15.7%, Saskatchewan with 8.1%, Manitoba with 6.8%,
Ontario with 49.7%, Quebec with 13.7%, New Brunswick with 0.7%, Prince Edward Island with
0.1%, Nova Scotia with 0.7%, and Newfoundland, the Yukon, the Northwest Territories, and
Nunavut each exported less than 0.1%.
Listed from west to east the provincial contributions to the national exports by weight were
British Columbia with 7.6%, Alberta with 21.6%, Saskatchewan with 21.4%, Manitoba with
7.4%, Ontario with 20.0%, Quebec with 8.1%, New Brunswick with 2.6%, Prince Edward Island
with 0.1%, Nova Scotia with 11.2%, and Newfoundland, the Yukon, the Northwest Territories,
and Nunavut each exported less than 0.1%..
The Western Region exported 34.8% of the value and 58.0% of the weight. The Central Region
exported 63.3% of the value and 28.1% of the weight. The Atlantic Region exported 1.8% of the
value and 13.9% of the weight and the Territories exported less than 0% of the value and 0% of
the weight.
$207
$766
$398
$332
$2,4
29
$668
$34
$3 $52
$0 $0 $0
$29739
1
1,11
1
1,10
1
38
3
1,02
8
41
6
134
3
578
0 0 1 0
0
500
1,000
1,500
2,000
2,500
3,000
BC AB SK MB ON QC NB PE NS NF YT NT NU
$ M
illi
on
s (2
007)
CA
D
000s
To
nn
es
Value Weight

189
The 2003 to 2007 regional distribution of Canadian export value is displayed in Figure 5.42.
Figure 5.42: Region of Origin, 2003-2007 Canadian Exports to Mexico – Value
($ Millions)
Since 2005 the majority of the value of Canadian exports to Mexico were from Western Canada,
with the second largest export region being Central Canada. In 2007 the value of exports from
the Central region increased by $77 million; the value from the Western region increased by
$290 million; the Atlantic region increased exports by $9 million, and the Territories decreased
exports by $1 million.
The distribution of Canadian export weight by region between 2003 to 2007 is displayed in
Figure 5.43.
Figure 5.43: Region of Origin, 2003-2007 Canadian Exports to Mexico – Weight
(000s Tonnes)
$1,054$1,611
$1,333$1,412 $1,702
$1,367$1,593
$2,025$3,020 $3,097
$71 $44 $23 $81 $90$0 $0 $39 $1 $0
0%
20%
40%
60%
80%
100%
2003 2004 2005 2006 2007
Western Central Atlantic Territories
2,4463,605
2,912
3,419 2,986
512 493
12,473
1,3111,444
220 85 74 676 715
0 0 10 0 1
0%
20%
40%
60%
80%
100%
2003 2004 2005 2006 2007
Western Central Atlantic Territories

190
For 2003, 2004, 2006 and 2007 the large majority of exports to Mexico were from Western
Canada, but in 2005 the vast majority of the Canadian exports to Mexico were from the Central
region.
In 2005 Ontario produced and exported ‚Injection Moulding Machines for Rubber or Plastic‛
which were worth $27.2 million and weighed 11.6 million tonnes.
In 2007 exports from the Central region increased by 133,000 tonnes; Western region decreased
by 433,000 tonnes, the Atlantic region increased by 39,000 tonnes and the Territories increased
1,000 tonnes.
Figure 5.44: Value, Weight, Ranks, and Rate of Change, Canadian Imports from Mexico
4
33
33
711
9 7
8
0
2,000
4,000
6,000
8,000
10,000
12,000
14,000
16,000
18,000
2003 2004 2005 2006 2007
$ M
illi
on
s (2
007)
CA
D
000s
To
nn
es
Value Value Rank Weight Weight Rank

191
Imports (Value):
In 2007, Canada Imported $17.2 billion from Mexico. Following a period of decline in 2003 the
value of Canada’s imports from Mexico started experiencing growth in 2004 at 7%. Growth
rates remained stable between 2004 and 2007 staying between 4% and 7%.
Table 5.32 displays the top 5 commodities imported to Canada from Mexico (by value).
Table 5.32: Top 5 Imported Commodities from Mexico (by Value)
Commodity Value
($ Millions) %
O television receivers,colour,w/n incorp radio-broad
rece/sound/vid rec/repro app $1,766 10%
Automobiles with reciprocating piston engine displacing > 1500 cc
to 3000 cc $1,200 7%
Petroleum oils and oils obtained from bituminous minerals, crude $728 4%
Ignition wiring sets & ot wiring sets of a kind used in vehicles,
aircraft etc $715 4%
Diesel powered trucks with a GVW not exceeding five tonnes $603 4%
Imports (Weight):
In 2007, Canada Imported 7.4 million tonnes from Mexico. The weight of Canada’s imports
from Mexico experienced consistent, growth from 2003 to 2007. The lowest growth rate was
experienced in 2003 at 3%, while the highest was in 2007 at 27%.
Table 5.33 displays the top 5 commodities imported to Canada from Mexico (by weight).
Table 5.33: Top 5 Imported Commodities from Mexico (by Weight)
Commodity Weight
(000s Tonnes) %
Liq dielectric transf having a power handling capacity exceeding
10,000 KVA 2,522 34%
Petroleum oils and oils obtained from bituminous minerals, crude 1,226 17%
Salt (including table salt & denatured salt) pure sodium chloride &
sea water 350 5%
Lifting, handling, loading or unloading machinery, nes 272 4%
Transformers electric having a power handling capacity exceeding
500 KVA, nes 202 3%
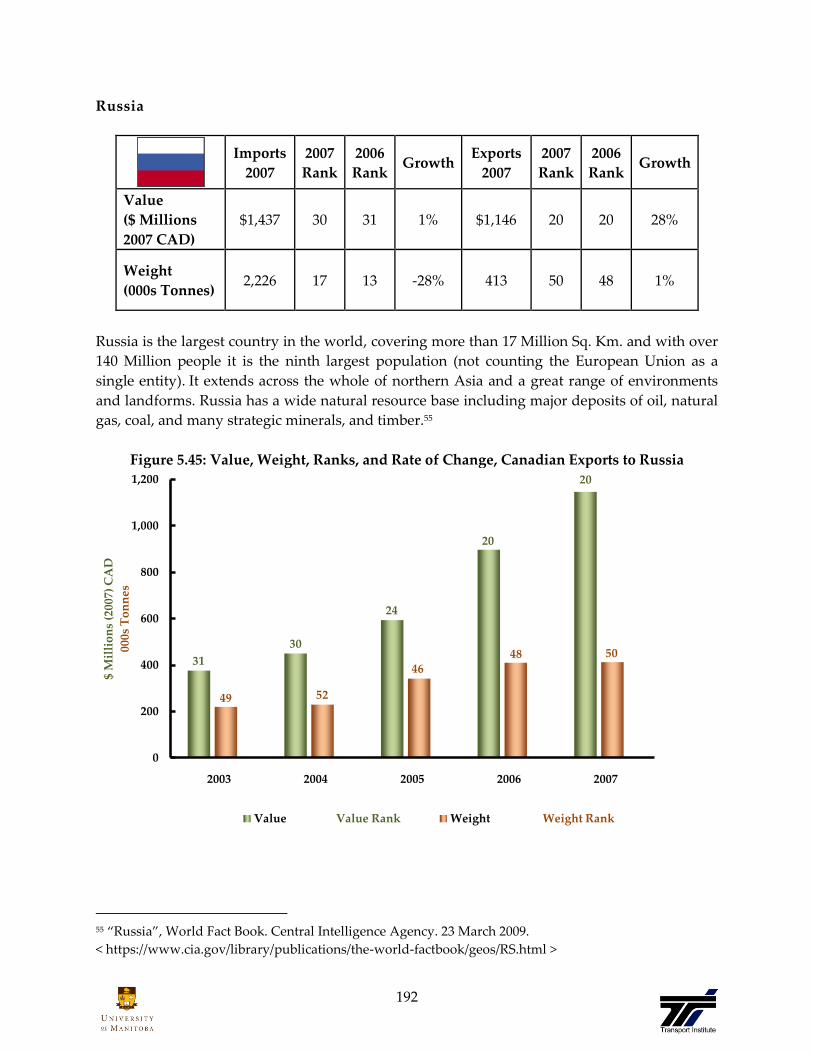
192
Russia
Imports
2007
2007
Rank
2006
Rank Growth
Exports
2007
2007
Rank
2006
Rank Growth
Value
($ Millions
2007 CAD)
$1,437 30 31 1% $1,146 20 20 28%
Weight
(000s Tonnes) 2,226 17 13 -28% 413 50 48 1%
Russia is the largest country in the world, covering more than 17 Million Sq. Km. and with over
140 Million people it is the ninth largest population (not counting the European Union as a
single entity). It extends across the whole of northern Asia and a great range of environments
and landforms. Russia has a wide natural resource base including major deposits of oil, natural
gas, coal, and many strategic minerals, and timber.55
Figure 5.45: Value, Weight, Ranks, and Rate of Change, Canadian Exports to Russia
55 ‚Russia‛, World Fact Book. Central Intelligence Agency. 23 March 2009.
< https://www.cia.gov/library/publications/the-world-factbook/geos/RS.html >
31
30
24
20
20
49 52
4648 50
0
200
400
600
800
1,000
1,200
2003 2004 2005 2006 2007
$ M
illi
on
s (2
007)
CA
D
000s
To
nn
es
Value Value Rank Weight Weight Rank

193
Exports (Value):
In 2007, Canada Exported $1.1 billion to Russia. The value of Canada’s exports to Russia
experienced double digit growth between 20003 and 2007 with rates ranging from 20% (2004) to
51% (2006).
Table 5.34 displays the top 5 commodities exported from Canada to Russia (by value).
Table 5.34: Top 5 Exported Commodities to Russia (by Value)
Commodity Value
($ Millions) %
Parts of boring or sinking machinery, whether or not self-
propelled $71 6%
Swine cuts, frozen nes $67 6%
Seeders, planters and transplanters $44 4%
Hams, shoulders and cuts thereof, of swine, bone in, frozen $36 3%
Shrimps and prawns, frozen, in shell or not, including boiled in
shell $32 3%
Exports (Weight):
In 2007, Canada Exported 0.4 million tonnes to Russia. The rate of change for the weight of
Canada’s exports to Russia has experienced constant growth ranging from 118% in 2003 to 1%
in 2007.
Table 5.35 displays the top 5 commodities exported from Canada to Russia (by weight).
Table 5.35: Top 5 Exported Commodities to Russia (by Weight)
Commodity Weight
(000s Tonnes) %
Sulphur of all kinds, o/t sublimed, precipitated and colloidal
sulphur 47 12%
Swine cuts, frozen nes 37 9%
Seeders, planters and transplanters 30 7%
Hams, shoulders and cuts thereof, of swine, bone in, frozen 22 5%
Boring or sinking machinery nes, not self-propelled 15 4%
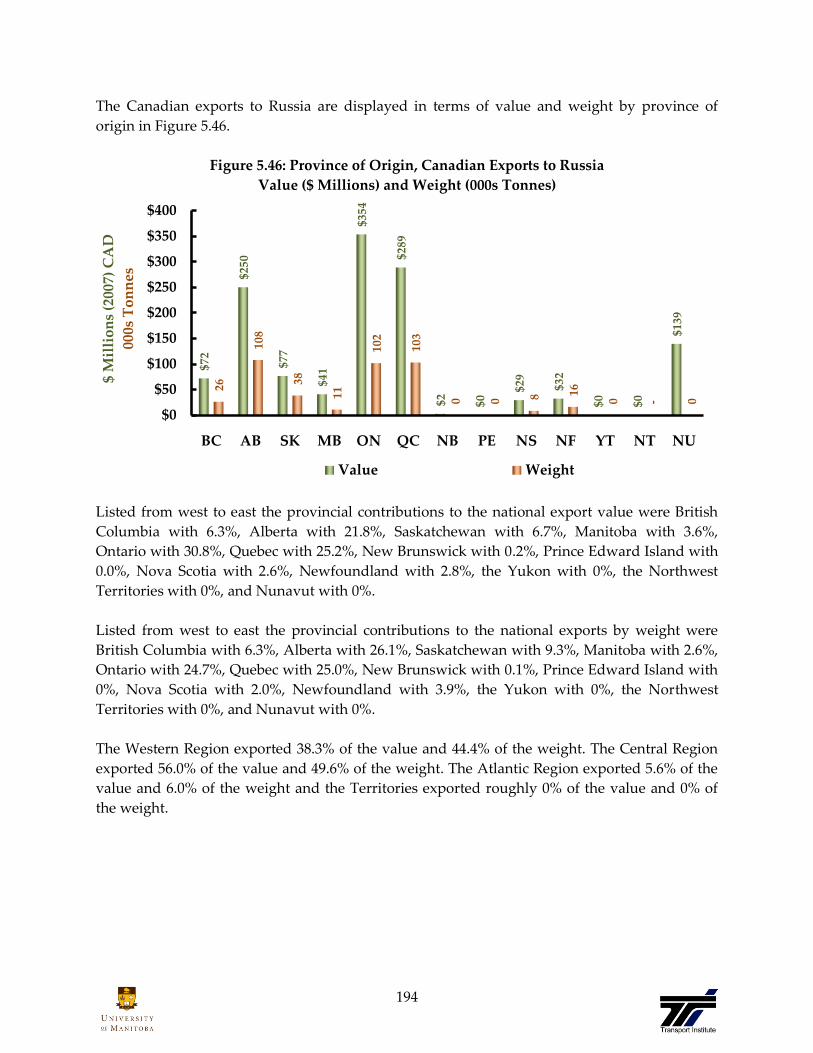
194
The Canadian exports to Russia are displayed in terms of value and weight by province of
origin in Figure 5.46.
Figure 5.46: Province of Origin, Canadian Exports to Russia
Value ($ Millions) and Weight (000s Tonnes)
Listed from west to east the provincial contributions to the national export value were British
Columbia with 6.3%, Alberta with 21.8%, Saskatchewan with 6.7%, Manitoba with 3.6%,
Ontario with 30.8%, Quebec with 25.2%, New Brunswick with 0.2%, Prince Edward Island with
0.0%, Nova Scotia with 2.6%, Newfoundland with 2.8%, the Yukon with 0%, the Northwest
Territories with 0%, and Nunavut with 0%.
Listed from west to east the provincial contributions to the national exports by weight were
British Columbia with 6.3%, Alberta with 26.1%, Saskatchewan with 9.3%, Manitoba with 2.6%,
Ontario with 24.7%, Quebec with 25.0%, New Brunswick with 0.1%, Prince Edward Island with
0%, Nova Scotia with 2.0%, Newfoundland with 3.9%, the Yukon with 0%, the Northwest
Territories with 0%, and Nunavut with 0%.
The Western Region exported 38.3% of the value and 44.4% of the weight. The Central Region
exported 56.0% of the value and 49.6% of the weight. The Atlantic Region exported 5.6% of the
value and 6.0% of the weight and the Territories exported roughly 0% of the value and 0% of
the weight.
$72
$250
$77
$41
$354
$289
$2 $0
$29
$32
$0 $0
$139
26
108
38
11
102
103
0 0 8 16
0 - 0
$0
$50
$100
$150
$200
$250
$300
$350
$400
BC AB SK MB ON QC NB PE NS NF YT NT NU
$ M
illi
on
s (2
007)
CA
D
000s
To
nn
es
Value Weight
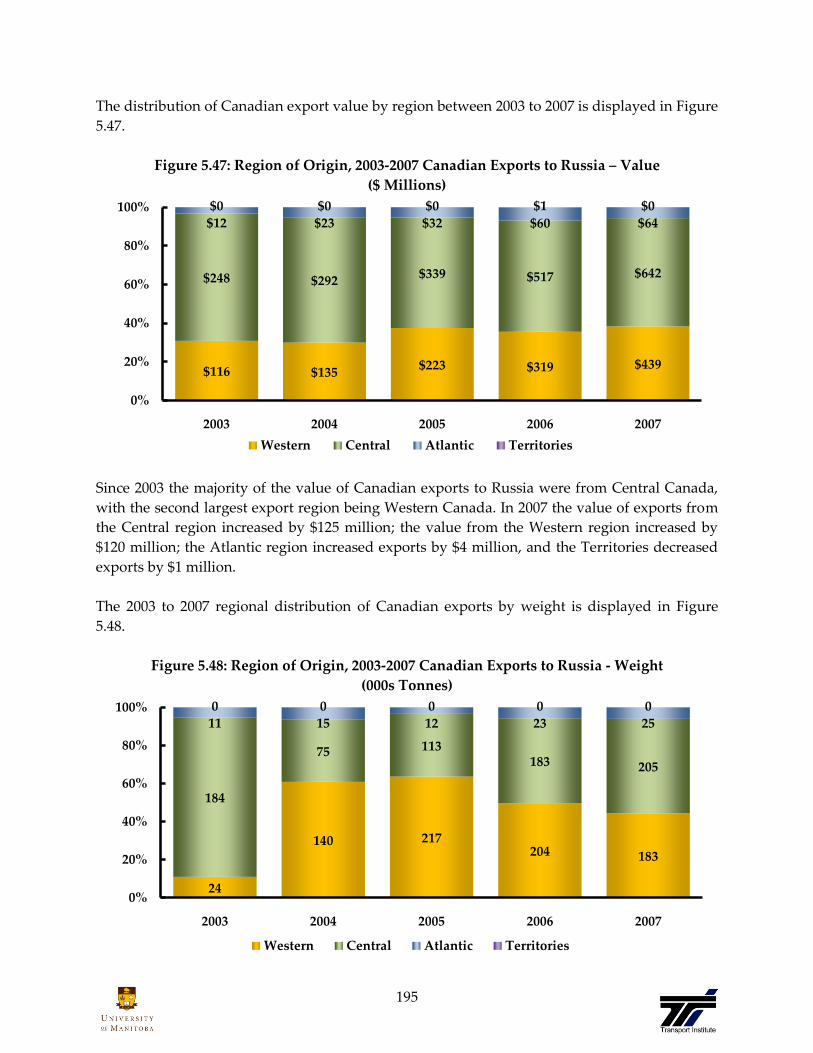
195
The distribution of Canadian export value by region between 2003 to 2007 is displayed in Figure
5.47.
Figure 5.47: Region of Origin, 2003-2007 Canadian Exports to Russia – Value
($ Millions)
Since 2003 the majority of the value of Canadian exports to Russia were from Central Canada,
with the second largest export region being Western Canada. In 2007 the value of exports from
the Central region increased by $125 million; the value from the Western region increased by
$120 million; the Atlantic region increased exports by $4 million, and the Territories decreased
exports by $1 million.
The 2003 to 2007 regional distribution of Canadian exports by weight is displayed in Figure
5.48.
Figure 5.48: Region of Origin, 2003-2007 Canadian Exports to Russia - Weight
(000s Tonnes)
$116 $135$223 $319 $439
$248 $292$339 $517 $642
$12 $23 $32 $60 $64
$0 $0 $0 $1 $0
0%
20%
40%
60%
80%
100%
2003 2004 2005 2006 2007
Western Central Atlantic Territories
24
140 217204 183
184
75 113183 205
11 15 12 23 25
0 0 0 0 0
0%
20%
40%
60%
80%
100%
2003 2004 2005 2006 2007
Western Central Atlantic Territories

196
In 2003 and 2007 the majority of the weight of exports to Russia was from Central Canada, but
in 2004 to 2006 the majority of the weights of the Canadian exports to Russia were from the
Western region.
In 2007 exports from the Central region increased by 22,000 tonnes while exports from the
Western region decreased by 21,000 tonnes, the Atlantic region’s exports increased by 2,000
tonnes and the Territories remain unchanged.
Figure 5.49: Value, Weight, Ranks, and Rate of Change, Canadian Imports from Russia
35
23
24
31 30
15
15
13
13
17
0
500
1,000
1,500
2,000
2,500
3,000
3,500
4,000
2003 2004 2005 2006 2007
$ M
illi
on
s (2
007)
CA
D
000s
To
nn
es
Value Value Rank Weight Weight Rank

197
Imports (Value):
In 2007, Canada Imported $1.4 billion from Russia. The value of Canada’s imports from Russia
experienced strong positive growth in 2003 (106%) slowing to 66% in 2004 and further slowing
to 21% in 2005 reaching decline in 2006 with -22% and slowly returning to growth in 2007 with
1%.
Table 5.36 displays the top 5 commodities imported to Canada from Russia (by value).
Table 5.36: Top 5 Imported Commodities from Russia (by Value)
Commodity Value
($ Millions) %
Petroleum oils and oils obtained from bituminous minerals, crude $840 58%
Light oils & prep obtained from bitumi- nous min, o/t crude etc,
o/t waste $100 7%
Vodka $52 4%
Palladium in other semi-manufactured forms $43 3%
Petroleum oil and oil,o/t light,obt from bituminous min,o/t
crude,etc,o/t waste $34 2%
Imports (Weight):
In 2007, Canada Imported 2.2 million tonnes from Russia. The weight of Canada’s imports
from Russia experienced growth from 2003 (255%) to 2005 (12%) and decline in 2006 (-12%) and
2007 (-28%).
Table 5.37 displays the top 5 commodities imported to Canada from Russia (by weight).
Table 5.37: Top 5 Imported Commodities from Russia (by Weight)
Commodity Weight
(000s Tonnes) %
Petroleum oils and oils obtained from bituminous minerals, crude 1,251 56%
Anthracite, whether or not pulverised but not agglomerated 279 13%
Axles and wheels and parts 233 10%
Light oils & prep obtained from bituminous min, o/t crude etc, o/t
waste 121 5%
Ammonium nitrate, whether or not in aqeuous sol in pack
weighing > 10 kg 92 4%

198
South Korea
Imports
2007
2007
Rank
2006
Rank Growth
Exports
2007
2007
Rank
2006
Rank Growth
Value
($ Millions
2007 CAD)
$5,365 7 7 -10% $3,004 10 7 -11%
Weight
(000s Tonnes) 1,215 25 17 -22% 8,451 5 6 -43%
Since WWII there has been tensions between the then-formed North and South Korean nations.
With an armistice signed in 1953, South Korea has achieved rapid economic growth. In 1993,
KIM Young-sam became South Korea's first civilian president following 32 years of military
rule. South Korea today is a fully functioning modern democracy.56
Figure 5.50: Value, Weight, Ranks, and Rate of Change Canadian Exports to South Korea
56 ‚Korea, South‛, The World Factbook. Central Intelligence Agency. July 7, 2009
<https://www.cia.gov/library/publications/the-world-factbook/geos/KS.html>
8 87
7 10
8
7
8
6
5
0
2,000
4,000
6,000
8,000
10,000
12,000
14,000
16,000
2003 2004 2005 2006 2007
$ M
illi
on
s (2
007)
CA
D
000s
To
nn
es
Value Value Rank Weight Weight Rank

199
Exports (Value):
In 2007, Canada Exported $3.0 billion to South Korea. From 2004 to 2006 the value of Canada’s
exports to South Korea experienced growth at 13%, 20%, and 14% consecutively. However, in
2007 the exports experienced a decline of -11%, the first decline since the -7% in 2003.
Table 5.38 displays the top 5 commodities exported from Canada to South Korea (by value).
Table 5.38: Top 5 Exported Commodities to South Korea (by Value)
Commodity Value
($ Millions) %
Bituminous coal, whether or not pulveri- sed but not
agglomerated $549 18%
Nickel oxide sinters and other inter- mediate products of nickel
metallurgy $169 6%
Wood pulp obtained by a combination of mechanical & chemical
pulping processes $151 5%
Chemical wood pulp, soda or sulphate, coniferous, semi-bl or
bleached, nes $127 4%
Chemical wood pulp, soda or sulphate, non-coniferous, semi-bl or
bleached, nes $125 4%
Exports (Weight):
In 2007, Canada Exported 8.5 million tonnes to South Korea. From 2004 to 2006 the weight of
Canada’s exports to South Korea experienced rapid growth at 21%, 47%, and 16%
consecutively. However, in 2007 the exports experienced a decline of -43%, the first decline
since the -4% in 2003.
Table 5.39 displays the top 5 commodities exported from Canada to South Korea (by weight).
Table 5.39: Top 5 Exported Commodities to South Korea (by Weight)
Commodity Weight
(000s Tonnes) %
Iron ores and concentrates, other than roasted iron pyrites,
agglomerated 1,623 23%
Bituminous coal, whether or not pulveri- sed but not
agglomerated 1,492 21%
Iron ores and concentrates, other than roasted iron pyrites, non-
agglomerated 1,133 16%
Low value export transactions and confidential commodities 860 12%
Wheat nes and meslin 504 7%

200
The Canadian exports to South Korea are displayed in terms of value and weight by province of
origin in Figure 5.51.
Figure 5.51: Province of Origin, Canadian Exports to South Korea
Value ($ Millions) and Weight (000s Tonnes)
Listed from west to east the provincial contributions to the national export value were British
Columbia with 44.6%, Alberta with 15.6%, Saskatchewan with 1.6%, Manitoba with 2.4%,
Ontario with 22.5%, Quebec with 10.4%, New Brunswick with 1.4%, Prince Edward Island with
0.1%, Nova Scotia with 0.9%, Newfoundland with 0.6%, the Yukon with 0%, the Northwest
Territories with 0%, and Nunavut with 0%.
Listed from west to east the provincial contributions to the national exports by weight were
British Columbia with 70.8%, Alberta with 16.8%, Saskatchewan with 1.8%, Manitoba with
1.5%, Ontario with 2.0%, Quebec with 6.1%, New Brunswick with 0.9%, Prince Edward Island
with 0%, Nova Scotia with 0.1%, Newfoundland with 0.1%, the Yukon with 0%, the Northwest
Territories with 0%, and Nunavut with 0%.
The Western Region exported 64.1% of the value and 90.9% of the weight. The Central Region
exported 32.9% of the value and 8.1% of the weight. The Atlantic Region exported 3.0% of the
value and 1.1% of the weight and the Territories exported less than 0% of the value and weight.
$1,3
39
$470
$47
$72 $6
75
$313
$42
$2 $26
$18
$0 $0 $29
5,98
4
1,42
2
149
12
4
167 51
5
75
1 9 5 0
0
0
0
1,000
2,000
3,000
4,000
5,000
6,000
7,000
BC AB SK MB ON QC NB PE NS NF YT NT NU
$ M
illi
on
s (2
007)
CA
D
000s
To
nn
es
Value Weight

201
The distribution of Canadian export value by region since 2003 is displayed in Figure 5.52.
Figure 5.52: Region of Origin, 2003-2007 Canadian Exports to South Korea - Value
($ Millions)
Since 2003 the majority of the value of Canadian exports to South Korea originated from Central
Canada, with the second largest export region being Western Canada.
In 2007 the value of exports from the Central region decreased by $239 million; the value from
the Western region decreased $128 million; the Atlantic region increased exports by $4 million,
and the Territories did not change.
The distribution of Canadian export weight by region between 2003 and 2007 is displayed in
Figure 5.53.
Figure 5.53: Region of Origin, 2003-2007 Canadian Exports to South Korea - Weight
(000s Tonnes)
$1,439 $1,623 $2,054$2,055 $1,927
$627 $743 $823$1,227 $988
$71 $96 $85 $85 $89
$45 $0 $0 $0 $0
0%
20%
40%
60%
80%
100%
2003 2004 2005 2006 2007
Western Central Atlantic Territories
5,4275,635 7,567
7,011
7,678
1,355
2,8434,854
7,704
682
220 196 374 110 91181 0 0 0 0
0%
20%
40%
60%
80%
100%
2003 2004 2005 2006 2007
Western Central Atlantic Territories
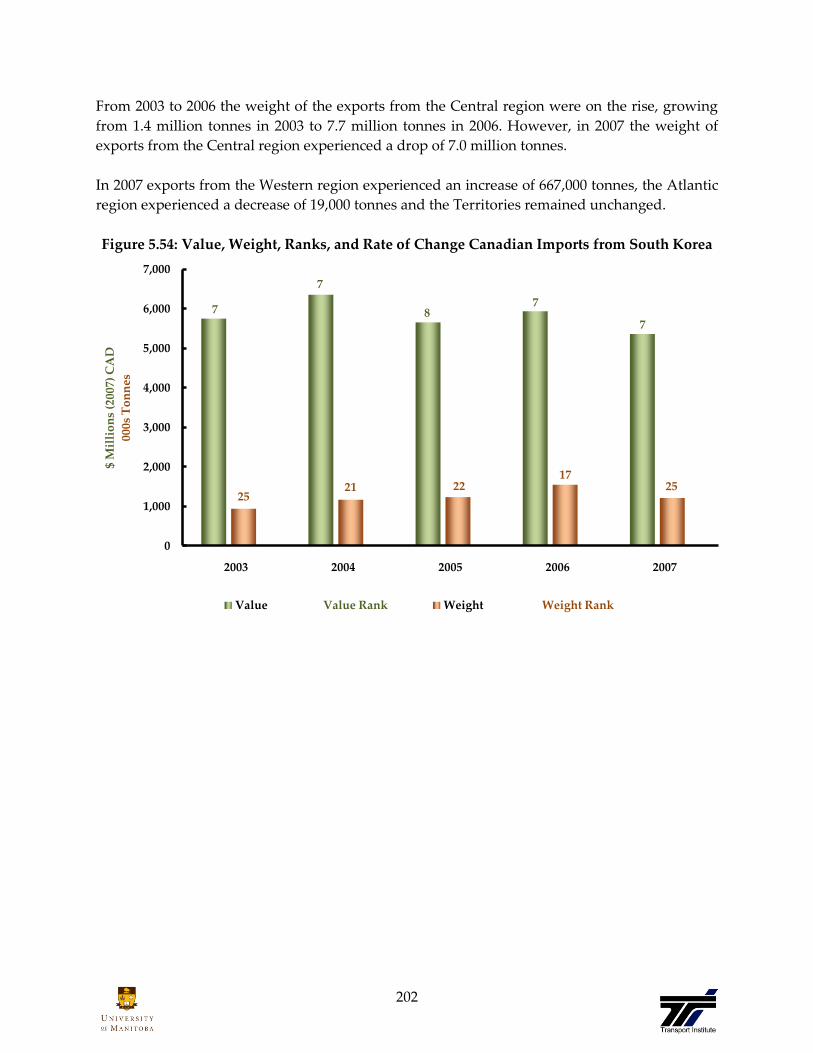
202
From 2003 to 2006 the weight of the exports from the Central region were on the rise, growing
from 1.4 million tonnes in 2003 to 7.7 million tonnes in 2006. However, in 2007 the weight of
exports from the Central region experienced a drop of 7.0 million tonnes.
In 2007 exports from the Western region experienced an increase of 667,000 tonnes, the Atlantic
region experienced a decrease of 19,000 tonnes and the Territories remained unchanged.
Figure 5.54: Value, Weight, Ranks, and Rate of Change Canadian Imports from South Korea
7
7
87
7
2521 22
1725
0
1,000
2,000
3,000
4,000
5,000
6,000
7,000
2003 2004 2005 2006 2007
$ M
illi
on
s (2
007)
CA
D
000s
To
nn
es
Value Value Rank Weight Weight Rank
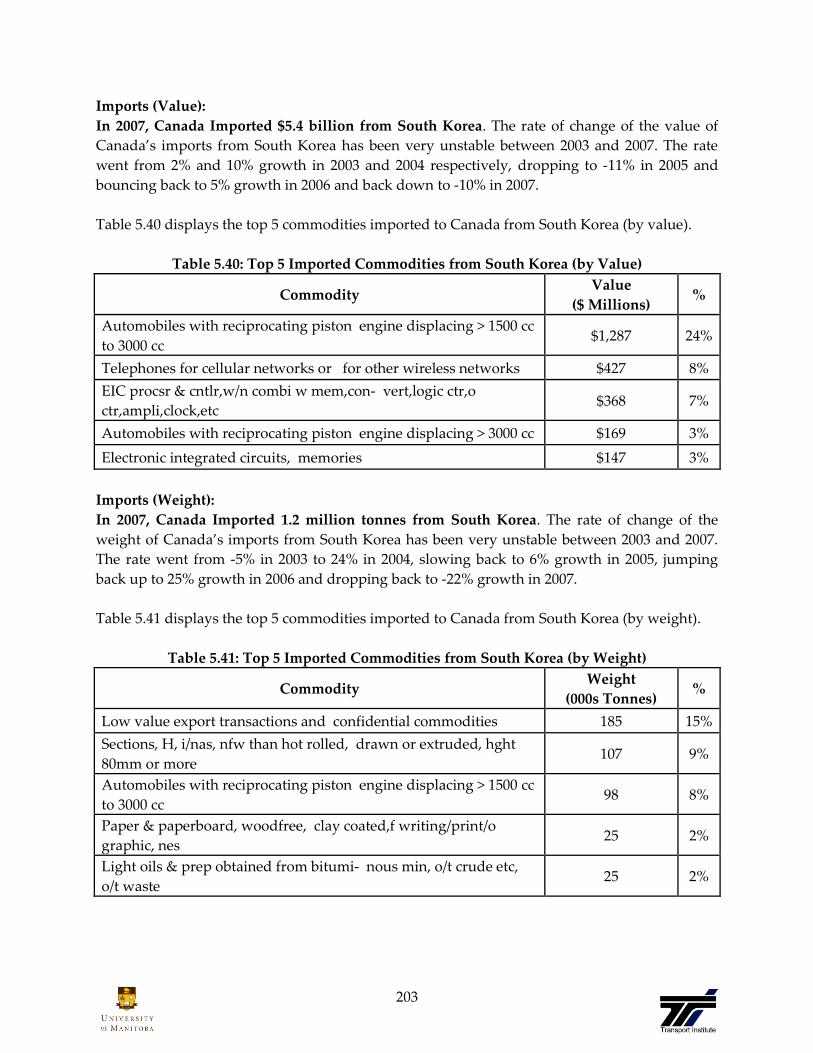
203
Imports (Value):
In 2007, Canada Imported $5.4 billion from South Korea. The rate of change of the value of
Canada’s imports from South Korea has been very unstable between 2003 and 2007. The rate
went from 2% and 10% growth in 2003 and 2004 respectively, dropping to -11% in 2005 and
bouncing back to 5% growth in 2006 and back down to -10% in 2007.
Table 5.40 displays the top 5 commodities imported to Canada from South Korea (by value).
Table 5.40: Top 5 Imported Commodities from South Korea (by Value)
Commodity Value
($ Millions) %
Automobiles with reciprocating piston engine displacing > 1500 cc
to 3000 cc $1,287 24%
Telephones for cellular networks or for other wireless networks $427 8%
EIC procsr & cntlr,w/n combi w mem,con- vert,logic ctr,o
ctr,ampli,clock,etc $368 7%
Automobiles with reciprocating piston engine displacing > 3000 cc $169 3%
Electronic integrated circuits, memories $147 3%
Imports (Weight):
In 2007, Canada Imported 1.2 million tonnes from South Korea. The rate of change of the
weight of Canada’s imports from South Korea has been very unstable between 2003 and 2007.
The rate went from -5% in 2003 to 24% in 2004, slowing back to 6% growth in 2005, jumping
back up to 25% growth in 2006 and dropping back to -22% growth in 2007.
Table 5.41 displays the top 5 commodities imported to Canada from South Korea (by weight).
Table 5.41: Top 5 Imported Commodities from South Korea (by Weight)
Commodity Weight
(000s Tonnes) %
Low value export transactions and confidential commodities 185 15%
Sections, H, i/nas, nfw than hot rolled, drawn or extruded, hght
80mm or more 107 9%
Automobiles with reciprocating piston engine displacing > 1500 cc
to 3000 cc 98 8%
Paper & paperboard, woodfree, clay coated,f writing/print/o
graphic, nes 25 2%
Light oils & prep obtained from bitumi- nous min, o/t crude etc,
o/t waste 25 2%
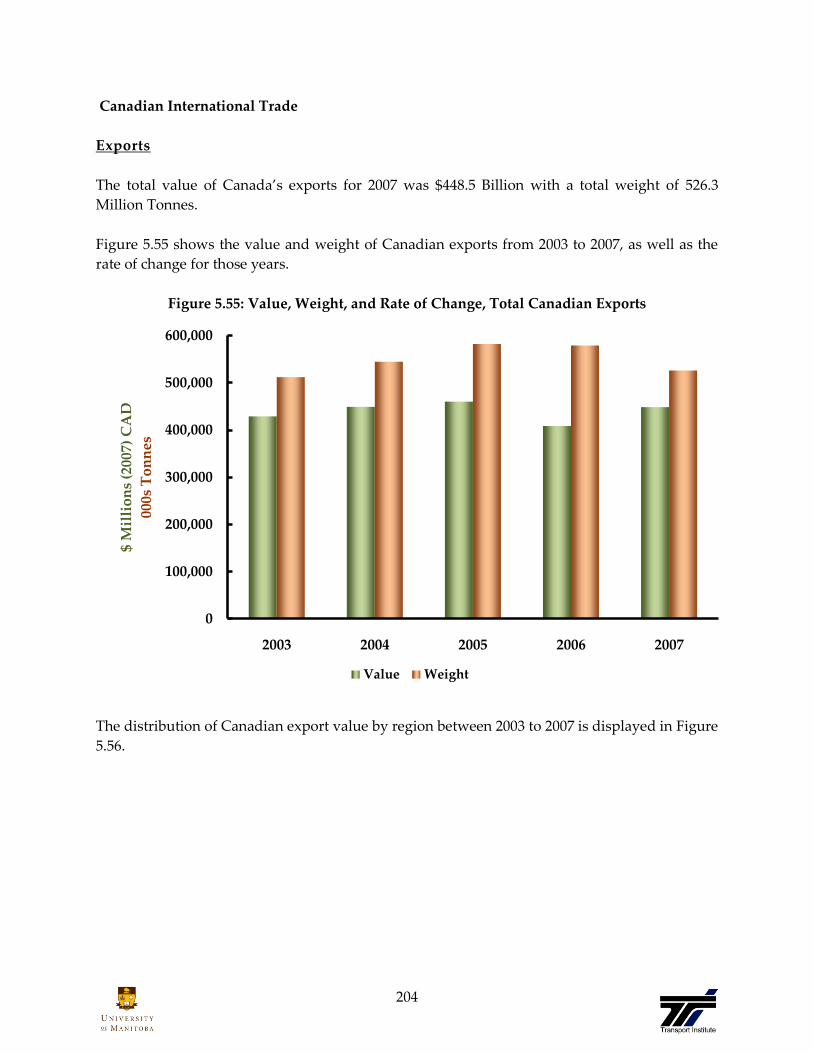
204
Canadian International Trade
Exports
The total value of Canada’s exports for 2007 was $448.5 Billion with a total weight of 526.3
Million Tonnes.
Figure 5.55 shows the value and weight of Canadian exports from 2003 to 2007, as well as the
rate of change for those years.
Figure 5.55: Value, Weight, and Rate of Change, Total Canadian Exports
The distribution of Canadian export value by region between 2003 to 2007 is displayed in Figure
5.56.
0
100,000
200,000
300,000
400,000
500,000
600,000
2003 2004 2005 2006 2007
$ M
illi
on
s (2
007)
CA
D
000s
To
nn
es
Value Weight

205
Figure 5.56: Region of Origin, 2003-2007 Canadian Exports – Value
($ Millions)
Since 2003 the majority of the value of Canadian exports were from Central Canada, with the
second largest export region being Western Canada.
In 2007 the value of exports from the Central region decreased by $8,518 million; the value from
the Western region decreased by $3,373 million; the Atlantic region increased exports by $7,228
million, and the Territories increased exports by $217 million.
The distribution of Canadian export weight by region between 2003 to 2007 is displayed in
Figure 5.57.
Figure 5.57: Region of Origin, 2003-2007 Canadian Exports - Weight
(000s Tonnes)
Since 2003 the majority of the weight of Canadian exports were from Western Canada, with the
second largest export region being Central Canada.
$119,922 $132,941 $147,765 $148,946 $145,573
$285,414 $291,839 $287,613 $280,535 $272,017
$21,964 $22,505 $23,185 $22,024 $29,252 $1,800 $1,847 $1,642 $1,505 $1,722
0%
20%
40%
60%
80%
100%
2003 2004 2005 2006 2007
Western Central Atlantic Territories
269,134 292,122 302,019 311,049 280,296
187,539 200,136 226,702 215,651 182,823
55,471 52,451 53,620 52,505 63,161
45 19 20 23 45
0%
20%
40%
60%
80%
100%
2003 2004 2005 2006 2007Western Central Atlantic Territories

206
In 2007 the weight of exports from the Central region decreased by 32.8 million tonnes; the
value from the Western region increased by 30.7 million tonnes; the Atlantic region increased
exports by 10.6 million tonnes, and the Territories increased by 23,000 tonnes.
Table 5.42 and 5.43 outline the top 10 Canadian export commodities by value and weight
respectively.
Table 5.42: Top 10 Canadian Export Commodities for 2007
by Value and Percentage of Total Export Value
Top 10 Export Commodities Value
($ Millions) %
Petroleum oils and oils obtained from bituminous minerals, crude $42,002 9%
Automobiles with reciprocating piston engine displacing >
3000 cc $32,586 7%
Natural gas in gaseous state $26,538 6%
Goods of US origin, not advanced in value, returning to the
United States $8,754 2%
Gas powered trucks with a GVW not exceeding five tonnes $8,138 2%
Petroleum oils &oils,o/t light,obt from bituminous min(o/t
crude) etc & o/t waste $7,384 2%
Automobiles with reciprocating piston engine displacing
>1500cc but<=3000 cc $7,227 2%
Lumber, coniferous (softwood) of a thickness exceeding 6 mm $7,081 2%
Low value import transactions and confidential commodities $6,724 1%
Light oils & prep obtained from bitumi- nous min,o/t crude
etc, o/t waste $5,869 1%
Total of Top 10 $152,304 34%
Total of all Export Commodities $448,565

207
Table 5.43: Top 10 Canadian Export Commodities for 2007
by Weight and Percentage of Total Export Weight
Top 10 Export Commodities Weight
(000s Tonnes) %
Low value import transactions and confidential commodities 80,400 19%
Petroleum oils and oils obtained from bituminous minerals, crude 73,082 17%
Natural gas in gaseous state 51,882 12%
Bituminous coal, whether or not pulveri- sed but not agglomerated 30,424 7%
Iron ores and concentrates, other than roasted iron pyrites,
agglomerated 18,641 4%
Potassium chloride, in packages weighing more than 10 kg 17,292 4%
Lumber, coniferous (softwood) of a thickness exceeding 6 mm 14,806 4%
Wheat nes and meslin 13,733 3%
Petroleum oils &oils,o/t light,obt from bituminous min(o/t
crude) etc & o/t waste 10,014 2%
Iron ores and concentrates, other than roasted iron pyrites, non-
agglomerated 9,635 2%
Total of Top 10 319,909 61%
Total of all Export Commodities 526,325

208
Table 5.44 shows the export break down by province of origin, showing which provinces
produced the most goods for export.
Table 5.44: Value and Weight of Goods Exported by Province of Origin
Province of Origin
Value
($ Millions
2007 CAD)
%
Weight
(000s
Tonnes)
%
British Columbia $32,116 7% 69,782 13%
Alberta $81,507 18% 144,877 28%
Saskatchewan $20,099 4% 53,143 10%
Manitoba $11,851 3% 12,493 2%
Ontario $202,198 45% 116,220 22%
Quebec $69,819 16% 66,602 13%
New Brunswick $11,184 2% 15,668 3%
Prince Edward Island $804 0% 704 0%
Nova Scotia $5,615 1% 17,072 3%
Newfoundland $11,649 3% 29,716 6%
Yukon $22 0% 21 0%
Northwest Territories $1,694 0% 12 0%
Nunavut $6 0% 12 0%
Total $448,565 526,325

209
Table 5.45 shows the export break-down by province of exit, showing which provinces were the
most used as an international trade hub.
Table 5.45: Value and Weight of Goods Exported by Province of Exit
Province of Exit
Value
($ Millions
2007 CAD)
%
Weight
(000s
Tonnes)
%
British Columbia $57,414 13% 125,983 24%
Alberta $32,127 7% 51,720 10%
Saskatchewan $18,190 4% 33,177 6%
Manitoba $16,538 4% 24,681 5%
Ontario $226,105 50% 161,780 31%
Quebec $67,748 15% 80,602 15%
New Brunswick $13,252 3% 17,309 3%
Prince Edward Island $102 0% 149 0%
Nova Scotia $7,593 2% 19,134 4%
Newfoundland $8,022 2% 11,717 2%
Yukon $205 0% 43 0%
Northwest Territories $1,268 0% 25 0%
Nunavut $1 0% 5 0%
Total $448,565 526,325

210
Top 10 International Export Partners by Value and Weight
Canada has a widely diversified trade portfolio, but even so, the bulk of the value and weight of
Canada’s trade is with roughly 10 nations.
Table 5.46 shows the major export partners of Canada by value and weight.
Table 5.46: Top 10 Export Partners of Canada (by Value and Weight)
Trade Partner
Value
($ Millions
2007 CAD)
% Trade Partner Weight
(000s Tonnes) %
United States $354,210 79.0% United States 382,285 72.6%
United Kingdom $12,983 2.9% Japan 21,537 4.1%
China $9,284 2.1% China 18,183 3.5%
Japan $9,155 2.0% Germany 10,111 1.9%
Mexico $4,890 1.1% Korea, South 8,451 1.6%
Netherlands $4,042 0.9% United Kingdom 6,958 1.3%
Germany $3,881 0.9% Mexico 5,145 1.0%
Norway $3,684 0.8% India 4,789 0.9%
France $3,125 0.7% Brazil 4,700 0.9%
Korea, South $3,004 0.7% Netherlands 4,597 0.9%
Total of Top 10 $408,257 91.0% Total of Top 10 466,756 88.7%
Total of all Export
Partners $448,565
Total of all Export
Partners 526,325
The top ten trade partners by value account for 91.0% of the total Canadian export value. The
top ten trade partners by weight account for 88.7% of the total Canadian export weight.

211
Figures 5.58 and 5.59 show the data from Table 5.46 in pie chart form.
Figure 5.58: Top 10 Export Partners of Canada (by Value)
($448.5 Billion)
Figure 5.59: Top 10 Export Partners of Canada (by Weight)
(526.3 Million Tonnes)
The nations that achieved Top 10 ranking in value but not weight were Norway and France;
while Brazil and India achieved Top 10 ranking in weight but not value.
United States, 87%
United Kingdom, 3%
China, 2%
Japan, 2%
Mexico, 1%Netherlands, 1%Germany, 1%Norway, 1%France, 1%Korea, South, 1%
United States, 82%
Japan, 5%
China, 4%
Germany, 2%
Korea, South, 2%
United Kingdom, 1%Mexico, 1%India, 1%Brazil, 1%Netherlands, 1%

212
Mode of International Exports for Canada in 2007
Figure 5.60 shows the breakdown of Canada’s exports by mode by value and weight.
Figure 5.60: Canadian Exports by Mode
Value Weight
($448.5 Billion) (526.3 Million Tonnes)
Road
In 2007, roughly $180.4 billion worth of goods weighing 74.8 million tonnes were shipped via
road. Approximately 96.7% of the value and 89.6% of the weight were exported to the United
States. Mexico received approximately 1.0% of the value and 0.8% of the weight of the exports.
Road accounted for 40% of the total value and 14% of the total weight of exports.
Table 5.47: Top 5 Export Commodities by Road
(By Value and Percentage of Total Value of Exports)
Commodity Value
($ Millions 2007 CAD) %
Automobiles with reciprocating piston engine displacing >
3000 cc $14,958 8%
Goods of US origin, not advanced in value, returning to the
United States $6,746 4%
Medicaments nes, in dosage $3,831 2%
Parts and accessories of bodies nes for motor vehicles $3,672 2%
Motor vehicle parts, nes $2,617 1%
Air,
9% Other,
2%
Pipeline &
Energy,
14%
Rail,
17%Road,
40%
Water,
18%
Air,
1%Other,
13%
Pipeline &
Energy,
22%
Rail,
14%
Road,
14%
Water,
36%
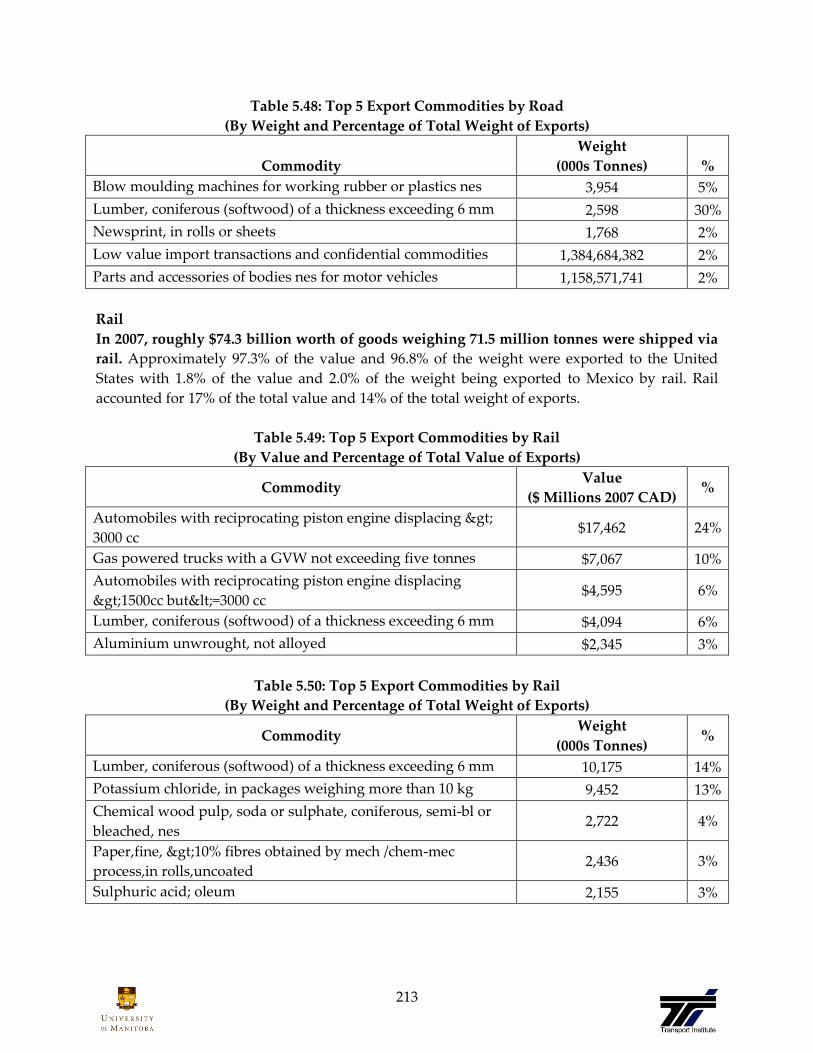
213
Table 5.48: Top 5 Export Commodities by Road
(By Weight and Percentage of Total Weight of Exports)
Commodity
Weight
(000s Tonnes) %
Blow moulding machines for working rubber or plastics nes 3,954 5%
Lumber, coniferous (softwood) of a thickness exceeding 6 mm 2,598 30%
Newsprint, in rolls or sheets 1,768 2%
Low value import transactions and confidential commodities 1,384,684,382 2%
Parts and accessories of bodies nes for motor vehicles 1,158,571,741 2%
Rail
In 2007, roughly $74.3 billion worth of goods weighing 71.5 million tonnes were shipped via
rail. Approximately 97.3% of the value and 96.8% of the weight were exported to the United
States with 1.8% of the value and 2.0% of the weight being exported to Mexico by rail. Rail
accounted for 17% of the total value and 14% of the total weight of exports.
Table 5.49: Top 5 Export Commodities by Rail
(By Value and Percentage of Total Value of Exports)
Commodity Value
($ Millions 2007 CAD) %
Automobiles with reciprocating piston engine displacing >
3000 cc $17,462 24%
Gas powered trucks with a GVW not exceeding five tonnes $7,067 10%
Automobiles with reciprocating piston engine displacing
>1500cc but<=3000 cc $4,595 6%
Lumber, coniferous (softwood) of a thickness exceeding 6 mm $4,094 6%
Aluminium unwrought, not alloyed $2,345 3%
Table 5.50: Top 5 Export Commodities by Rail
(By Weight and Percentage of Total Weight of Exports)
Commodity Weight
(000s Tonnes) %
Lumber, coniferous (softwood) of a thickness exceeding 6 mm 10,175 14%
Potassium chloride, in packages weighing more than 10 kg 9,452 13%
Chemical wood pulp, soda or sulphate, coniferous, semi-bl or
bleached, nes 2,722 4%
Paper,fine, >10% fibres obtained by mech /chem-mec
process,in rolls,uncoated 2,436 3%
Sulphuric acid; oleum 2,155 3%

214
Marine
In 2007, roughly $81.5 billion worth of goods weighing 191.1 million tonnes were shipped via
marine transport. Approximately 25.5% of the value and 31.8% of the weight of exports went to
the United States; 10.1% of the value and 9.4% of the weight went to China; and 9.8% of the
value and 11.1% of the weight went to Japan. Marine accounted for 18% of the total value and
36% of the total weight of exports.
Table 5.51: Top 5 Export Commodities by Marine
(By Value and Percentage of Total Value of Exports)
Commodity Value
($ Millions 2007 CAD) %
Petroleum oils and oils obtained from bituminous minerals,
crude $7,050 9%
Petroleum oils &oils,o/t light,obt from bituminous min(o/t
crude) etc & o/t waste $5,562 7%
Light oils & prep obtained from bitumi- nous min,o/t crude
etc, o/t waste $5,348 7%
Natural uranium & its compounds; mix- tures cntg natural
uranium or its compds $3,294 4%
Wheat nes and meslin $3,117 4%
Table 5.52: Top 5 Export Commodities by Marine
(By Weight and Percentage of Total Weight of Exports)
Commodity Weight
(000s Tonnes) %
Bituminous coal, whether or not pulveri- sed but not
agglomerated 29,375 15%
Iron ores and concentrates, other than roasted iron pyrites,
agglomerated 18,641 10%
Wheat nes and meslin 11,724 6%
Petroleum oils and oils obtained from bituminous minerals,
crude 10,800 6%
Iron ores and concentrates, other than roasted iron pyrites, non-
agglomerated 9,633 5%

215
Air
In 2007, roughly $40.7 billion worth of goods weighing 4.4 million tonnes were shipped via
air. Approximately 38.4% of the value and 20.8% of the weight were shipped to the United
States; 15.4% of the value and 11.3% of the weight to the United Kingdom; and 3.5% of the value
and 9.2% of the weight to Germany. Air accounted for 9% of the total value and 1% of the total
weight of exports.
Table 5.53: Top 5 Export Commodities by Air
(By Value and Percentage of Total Value of Exports)
Commodity Value
($ Millions 2007 CAD) %
Aircraft nes of an unladen weight exceeding 15,000 kg $4,207 10%
Gold in unwrought forms non-monetary $3,887 10%
Aircraft nes of an unladen weight > 2,000 kg but not
exceeding 15,000 kg $2,848 7%
Parts of tel sets,o app f trans/recep of vce/img/data,o/t
84.43,85.25,85.27,85.28 $2,255 6%
Goods of US origin, not advanced in value, returning to the
United States $1,777 4%
Table 5.54: Top 5 Export Commodities by Air
(By Weight and Percentage of Total Weight of Exports)
Commodity Weight
(000s Tonnes) %
Low value import transactions and confidential commodities 1,631,429,642 37%
Repairs 516,138,778 12%
Goods of US origin, not advanced in value, returning to the
United States 200,785,549 5%
Heat exchange units 135,645,102 3%
Radio active elements & isotopes nes, their mixtures
& compounds thereof 117,639,470 3%

216
Pipeline & Energy
In 2007, roughly $65 billion worth of goods weighing 113.4 million tonnes were exported via
pipeline and power lines. The United States is our only trade partner for pipeline and energy.
Pipeline accounted for 14% of the total value and 22% of the total weight of exports.
Table 5.55: Top 3 Export Commodities by Pipeline & Energy
(By Value and Percentage of Total Value of Exports)
Commodity Value
($ Millions 2007 CAD) %
Petroleum oils and oils obtained from bituminous minerals,
crude $34,499 54%
Natural gas in gaseous state $26,537 41%
Electrical energy $3,095 5%
Table 5.56: Top 3 Export Commodities by Pipeline & Energy
(By Weight and Percentage of Total Weight of Exports)
Commodity Weight
(000s Tonnes) %
Petroleum oils and oils obtained from bituminous minerals,
crude 61,512 54%
Natural gas in gaseous state 51,882 46%
Electrical energy 0 0%
Mode of Exports for Canada Historic Comparison
Figure 5.61 shows the rate of change of the Canadian exports modal mix by value. These graphs
are in 2007 real Canadian dollars. The mode ‚Other‛ has been left out of this analysis.
Figure 5.61: Rate of Change in Canadian Exports by Mode by Value
-25.00%-20.00%-15.00%-10.00%
-5.00%0.00%5.00%
10.00%15.00%20.00%25.00%30.00%
2001 2002 2003 2004 2005 2006 2007
% C
han
ge
Air Pipeline & Energy Rail Road Marine

217
From 2001 to 2007 the mode which experienced the largest fluctuations in growth was Pipeline
& Energy. In 2005 the Pipeline & Energy mode experienced 21.7% growth, dropping to negative
growth of 5.4% in with a more moderate decrease of 1.1% in 2007. The mode that has
experienced almost constant growth since 2002 is Marine, experiencing 1.1% growth in 2002 and
increasing to 14.7% growth in 2007. The Air mode has gone from -9.3% growth in 2001 to 4.0%
growth in 2004 to a slight drop in 2007 of -0.3%. The Rail mode has experienced only one year of
positive growth since 2001, that being 2004 with 4.5%. The Road mode has gone from a low of -
14.5% in 2004 to a high of 2.7% in 2005.
Figure 5.62 shows the modal distribution of Canadian export traffic by value.
Figure 5.62: Modal Distribution, 2000-2007 Canadian Export Traffic by Value
($ Millions 2007)
From 2000 to 2007 the proportion of goods in terms of value shipped by road has decreased
from 49.3% to 40.2% of total exports by value in 2007. Rail decreased from 18.5% in 2000 to
16.6% in 2007. Marine’s proportion increased from 11.4% in 2000 to 18.2% in 2007. The mode
‘other’ (which includes intermodal traffic) has fluctuated mildly, but changed little from 2000 (at
1.7% of the total exports by value) to 2007 (at 1.7% of the total exports by value).
$44,667 $40,522 $36,532 $36,065 $37,514 $40,243 $40,821 $40,709$8,611 $7,843 $7,175 $6,593 $6,823 $6,821 $6,645 $7,613
$53,449 $53,994$42,413
$52,234 $56,342 $68,557 $64,845 $64,134
$94,498 $89,579$89,113
$81,761 $85,472 $80,943 $77,722 $74,252
$252,337 $230,334 $232,371 $198,793 $204,175 $199,804 $191,893 $180,358
$58,294 $53,076 $53,641 $53,654 $58,807 $63,837 $71,085 $81,498
0%
10%
20%
30%
40%
50%
60%
70%
80%
90%
100%
2000 2001 2002 2003 2004 2005 2006 2007
Pro
po
rtio
n o
f T
ota
l E
xpo
rts
Marine Road Rail Pipeline & Energy Other Air
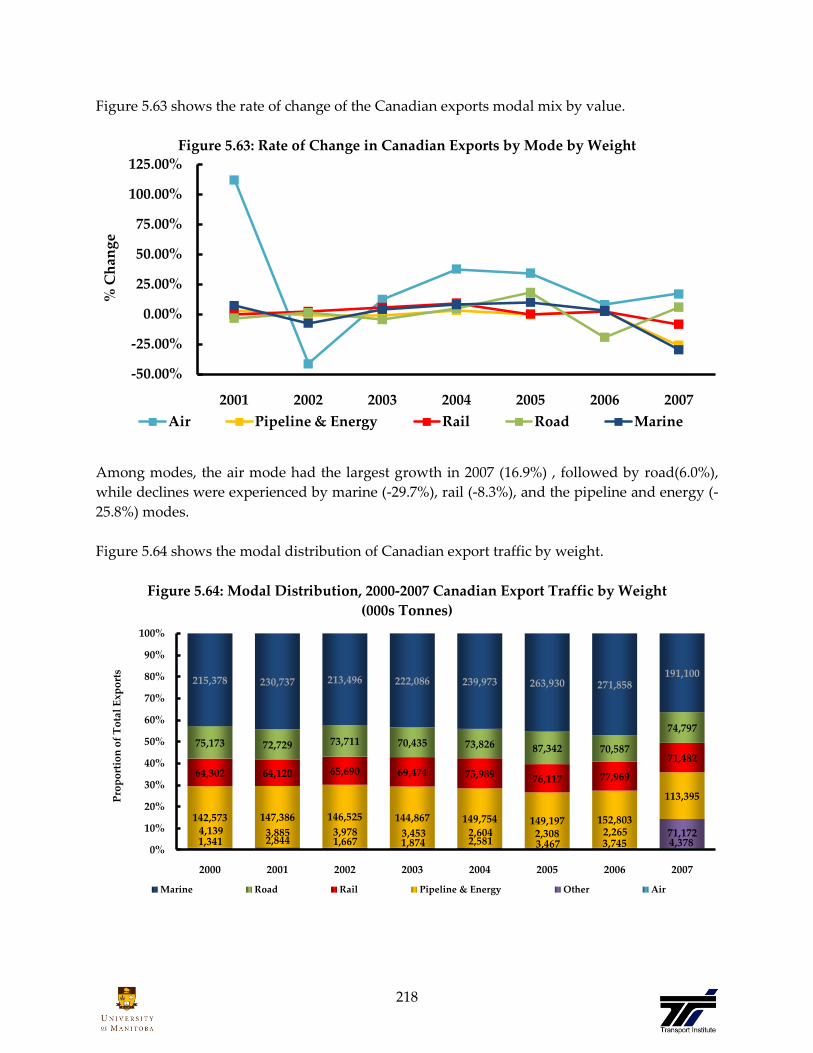
218
Figure 5.63 shows the rate of change of the Canadian exports modal mix by value.
Figure 5.63: Rate of Change in Canadian Exports by Mode by Weight
Among modes, the air mode had the largest growth in 2007 (16.9%) , followed by road(6.0%),
while declines were experienced by marine (-29.7%), rail (-8.3%), and the pipeline and energy (-
25.8%) modes.
Figure 5.64 shows the modal distribution of Canadian export traffic by weight.
Figure 5.64: Modal Distribution, 2000-2007 Canadian Export Traffic by Weight
(000s Tonnes)
-50.00%
-25.00%
0.00%
25.00%
50.00%
75.00%
100.00%
125.00%
2001 2002 2003 2004 2005 2006 2007
% C
han
ge
Air Pipeline & Energy Rail Road Marine
1,341 2,844 1,667 1,874 2,581 3,467 3,745 4,3784,139 3,885 3,978 3,453 2,604 2,308 2,265 71,172
142,573 147,386 146,525 144,867 149,754 149,197 152,803
113,395
64,302 64,120 65,690 69,474 75,989 76,117 77,969
71,482
75,173 72,729 73,711 70,435 73,826 87,342 70,587
74,797
215,378 230,737 213,496 222,086 239,973 263,930 271,858191,100
0%
10%
20%
30%
40%
50%
60%
70%
80%
90%
100%
2000 2001 2002 2003 2004 2005 2006 2007
Pro
po
rtio
n o
f T
ota
l E
xpo
rts
Marine Road Rail Pipeline & Energy Other Air

219
From 2000 to 2007 the proportion of goods in terms of weight shipped by road has decreased
from 14.9% in 2000 to 14.2% of total exports by weight in 2007. Rail increased from 12.8% in
2000 to 13.6% in 2007. Marine’s proportion increased from 42.8% in 2000 to 36.3% in 2007. Air
transportation of goods by weight has increased from 0.3% of the total weight of the goods
exported in 2000 to 0.8% of the total weight of the goods exported in 2007. The ‘other’ mode
(which includes intermodal traffic) increased from 0.8% in 2000 to 13.5% in 2007.
Imports
The total value of Canada’s imports for 2007 was $406 billion with a total weight of 308 Million
Tonnes.
Figure 5.65 shows the value and weight of Canadian imports from 2003 to 2007, as well as the
rate of change for those years.
Figure 5.65: Value, Weight, and Rate of Change, Total Canadian Imports
0
50,000
100,000
150,000
200,000
250,000
300,000
350,000
400,000
450,000
2003 2004 2005 2006 2007
$ M
illi
on
s (2
007)
CA
D
000s
To
nn
es
Value Weight

220
The commodities listed in this section are based on the HS02 codes. The Harmonized System
(HS) classification system is used by Statistics Canada for both import and export traffic and
contains multiple levels of coding. HS02 is one of the most broad categories that can be used
and is used here to give a better picture of the type of commodities that each mode moves
without going into specific items like the HS06 or HS08.
Table 5.57 and 5.58 outline the top 10 import commodities by value and weight respectively.
Table 5.57: Top 10 Canadian Import Commodities for 2007
(By Value and Percentage of Total Import Value)
Top 10 Import Commodities Value
($ Millions) %
Petroleum oils and oils obtained from bituminous minerals, crude $24,095 6%
Automobiles with reciprocating piston engine displacing
>1500cc but<=3000 cc $14,477 4%
Automobiles with reciprocating piston engine displacing >
3000 cc $10,270 3%
Medicaments nes, in dosage $7,128 2%
Gas powered trucks with a GVW not exceeding five tonnes $6,480 2%
Parts and accessories of bodies nes for motor vehicles $6,086 1%
Engines, spark-ignition reciprocating displacing more than 1000 cc $5,614 1%
Petroleum oils &oils,o/t light,obt from bituminous min(o/t
crude) etc & o/t waste $3,813 1%
Postal Services and Courier $3,756 1%
Gear boxes (transmissions), for motor vehicles and parts thereof $3,701 1%
Total of Top 10 $85,420 21%
Total of all Import Commodities $406,485
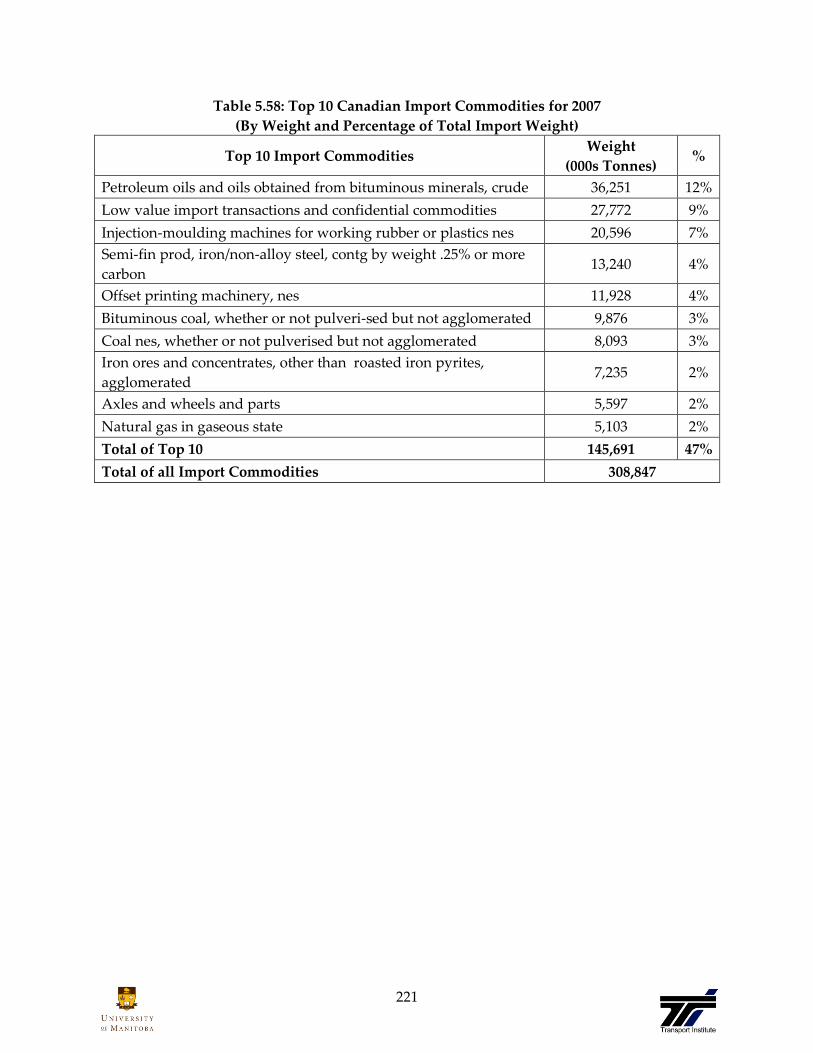
221
Table 5.58: Top 10 Canadian Import Commodities for 2007
(By Weight and Percentage of Total Import Weight)
Top 10 Import Commodities Weight
(000s Tonnes) %
Petroleum oils and oils obtained from bituminous minerals, crude 36,251 12%
Low value import transactions and confidential commodities 27,772 9%
Injection-moulding machines for working rubber or plastics nes 20,596 7%
Semi-fin prod, iron/non-alloy steel, contg by weight .25% or more
carbon 13,240 4%
Offset printing machinery, nes 11,928 4%
Bituminous coal, whether or not pulveri-sed but not agglomerated 9,876 3%
Coal nes, whether or not pulverised but not agglomerated 8,093 3%
Iron ores and concentrates, other than roasted iron pyrites,
agglomerated 7,235 2%
Axles and wheels and parts 5,597 2%
Natural gas in gaseous state 5,103 2%
Total of Top 10 145,691 47%
Total of all Import Commodities 308,847
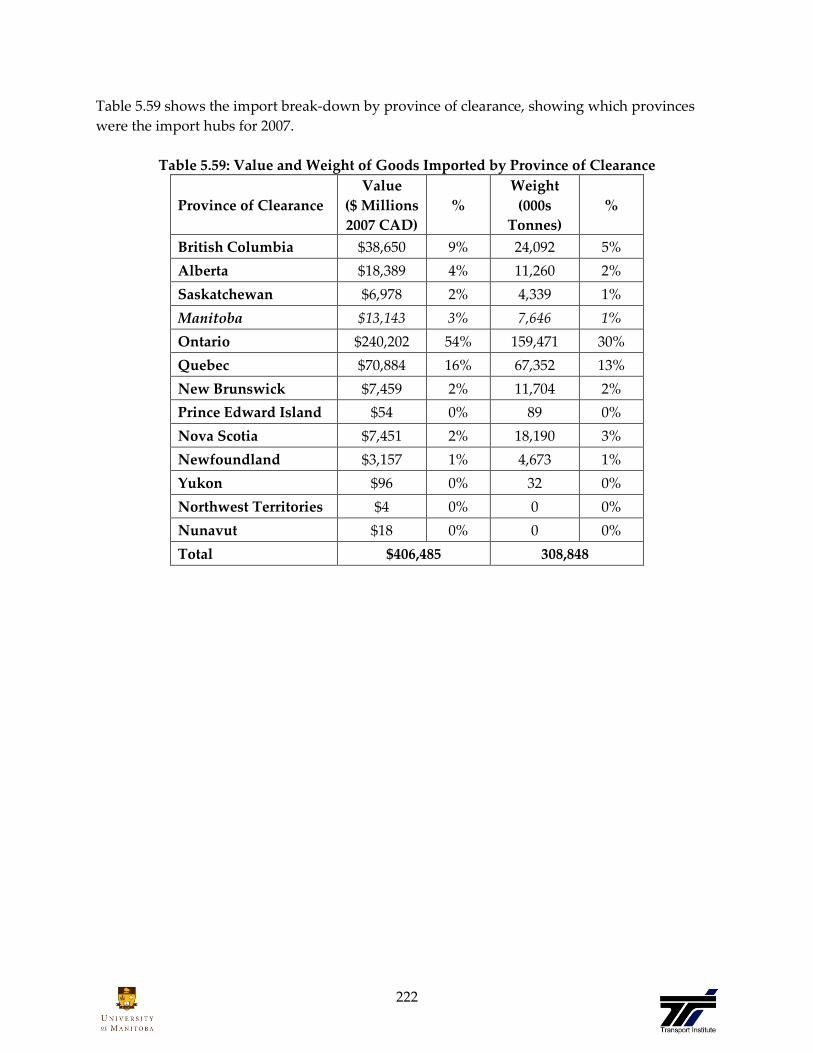
222
Table 5.59 shows the import break-down by province of clearance, showing which provinces
were the import hubs for 2007.
Table 5.59: Value and Weight of Goods Imported by Province of Clearance
Province of Clearance
Value
($ Millions
2007 CAD)
%
Weight
(000s
Tonnes)
%
British Columbia $38,650 9% 24,092 5%
Alberta $18,389 4% 11,260 2%
Saskatchewan $6,978 2% 4,339 1%
Manitoba $13,143 3% 7,646 1%
Ontario $240,202 54% 159,471 30%
Quebec $70,884 16% 67,352 13%
New Brunswick $7,459 2% 11,704 2%
Prince Edward Island $54 0% 89 0%
Nova Scotia $7,451 2% 18,190 3%
Newfoundland $3,157 1% 4,673 1%
Yukon $96 0% 32 0%
Northwest Territories $4 0% 0 0%
Nunavut $18 0% 0 0%
Total $406,485 308,848

223
Top 10 International Import Partners by Value and Weight
Canada has a widely diversified trade portfolio, but even so, the bulk of the value and weight of
Canada’s trade is with roughly 10 nations.
Table 5.60 shows the top 10 import partners by value and weight.
Table 5.60: Top 10 Import Partners of Canada (By Value and Weight)
Trade Partner
Value
($ Millions
2007 CAD)
% Trade Partner Weight
(000s Tonnes) %
United States $220,426 54.2% United States 167,452 54.2%
China $38,285 9.4% China 14,515 4.7%
Mexico $17,173 4.2% Argentina 13,434 4.3%
Japan $15,446 3.8% Cuba 12,336 4.0%
Germany $11,534 2.8% United Kingdom 10,359 3.4%
United Kingdom $11,406 2.8% Algeria 7,494 2.4%
Korea, South $5,365 1.3% Norway 7,432 2.4%
Norway $5,333 1.3% Mexico 7,358 2.4%
Algeria $5,071 1.2% Israel 6,593 2.1%
Italy $5,070 1.2% Brazil 5,102 1.7%
Total of Top 10 $335,108 82.4% Total of Top 10 252,074 81.6%
Total of all
Export Partners $406,485
Total of all
Export Partners 308,848
The top ten trade partners by value account for 82.4% of the total Canadian imports by value.
The top ten trade partners by weight account for 81.6% of the total Canadian imports by weight.
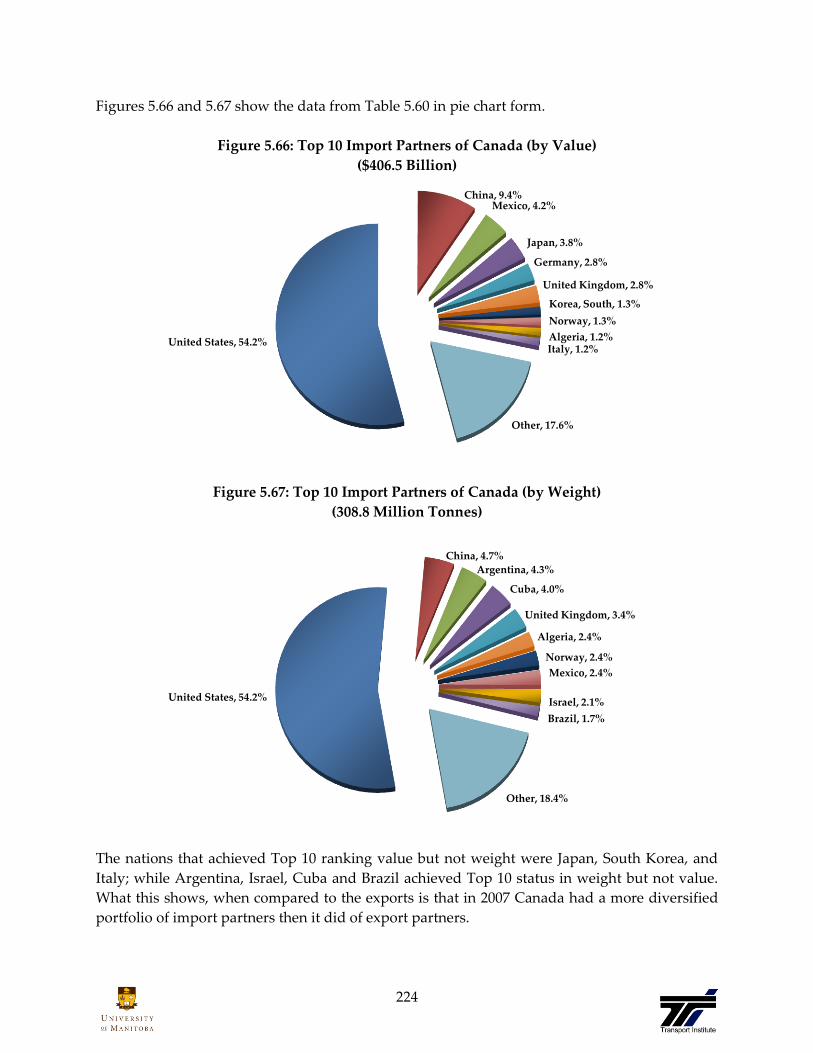
224
Figures 5.66 and 5.67 show the data from Table 5.60 in pie chart form.
Figure 5.66: Top 10 Import Partners of Canada (by Value)
($406.5 Billion)
Figure 5.67: Top 10 Import Partners of Canada (by Weight)
(308.8 Million Tonnes)
The nations that achieved Top 10 ranking value but not weight were Japan, South Korea, and
Italy; while Argentina, Israel, Cuba and Brazil achieved Top 10 status in weight but not value.
What this shows, when compared to the exports is that in 2007 Canada had a more diversified
portfolio of import partners then it did of export partners.
United States, 54.2%
China, 9.4%Mexico, 4.2%
Japan, 3.8%
Germany, 2.8%
United Kingdom, 2.8%
Korea, South, 1.3%
Norway, 1.3%
Algeria, 1.2%Italy, 1.2%
Other, 17.6%
United States, 54.2%
China, 4.7%
Argentina, 4.3%
Cuba, 4.0%
United Kingdom, 3.4%
Algeria, 2.4%
Norway, 2.4%
Mexico, 2.4%
Israel, 2.1%
Brazil, 1.7%
Other, 18.4%
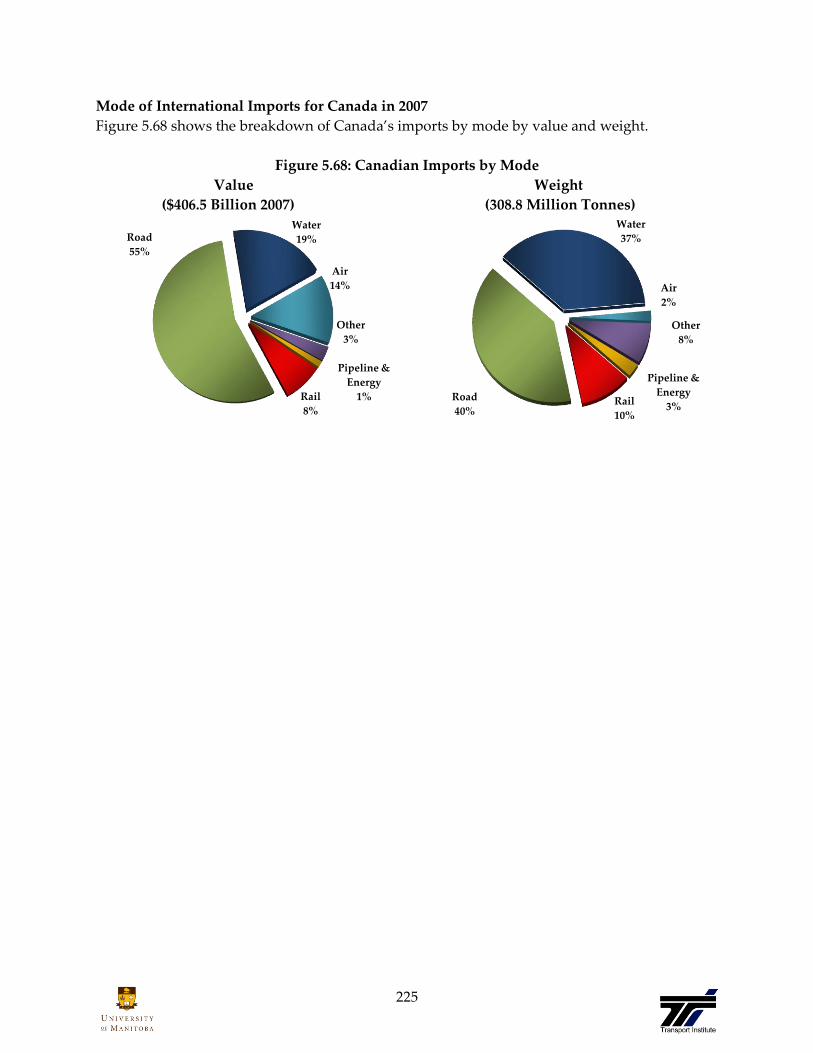
225
Mode of International Imports for Canada in 2007
Figure 5.68 shows the breakdown of Canada’s imports by mode by value and weight.
Figure 5.68: Canadian Imports by Mode
Value Weight
($406.5 Billion 2007) (308.8 Million Tonnes)
Air
14%
Other
3%
Pipeline &
Energy
1%Rail
8%
Road
55%
Water
19%
Air
2%
Other
8%
Pipeline &
Energy
3%Rail
10%
Road
40%
Water
37%
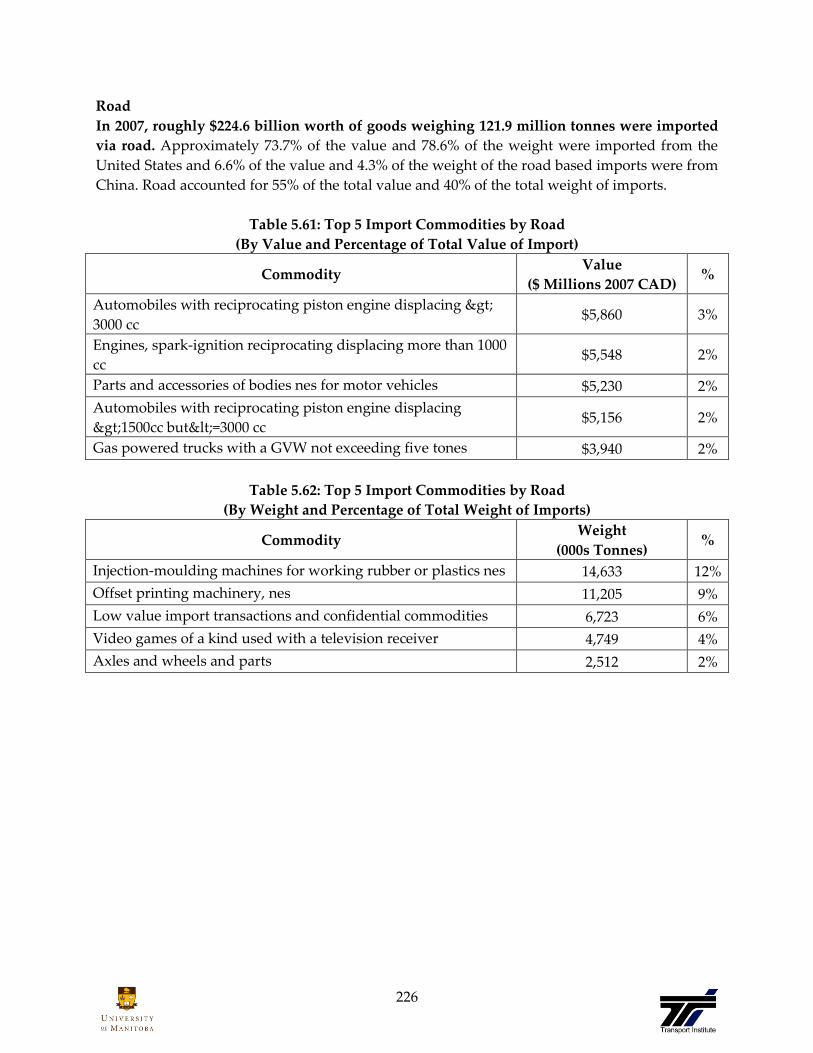
226
Road
In 2007, roughly $224.6 billion worth of goods weighing 121.9 million tonnes were imported
via road. Approximately 73.7% of the value and 78.6% of the weight were imported from the
United States and 6.6% of the value and 4.3% of the weight of the road based imports were from
China. Road accounted for 55% of the total value and 40% of the total weight of imports.
Table 5.61: Top 5 Import Commodities by Road
(By Value and Percentage of Total Value of Import)
Commodity Value
($ Millions 2007 CAD) %
Automobiles with reciprocating piston engine displacing >
3000 cc $5,860 3%
Engines, spark-ignition reciprocating displacing more than 1000
cc $5,548 2%
Parts and accessories of bodies nes for motor vehicles $5,230 2%
Automobiles with reciprocating piston engine displacing
>1500cc but<=3000 cc $5,156 2%
Gas powered trucks with a GVW not exceeding five tones $3,940 2%
Table 5.62: Top 5 Import Commodities by Road
(By Weight and Percentage of Total Weight of Imports)
Commodity Weight
(000s Tonnes) %
Injection-moulding machines for working rubber or plastics nes 14,633 12%
Offset printing machinery, nes 11,205 9%
Low value import transactions and confidential commodities 6,723 6%
Video games of a kind used with a television receiver 4,749 4%
Axles and wheels and parts 2,512 2%

227
Rail
In 2007, roughly $31.3 billion worth of goods weighing 29.6 million tonnes were imported via
rail. Approximately 83.0% of the value and 87.0% of the weight were imported from the United
States; 7.6% of the value and 6.4% of the weight was from Mexico and 1.8% of the value and
0.9% of the weight was from China. Rail accounted for 8% of the total value and 10% of the total
weight of imports.
Table 5.63: Top 5 Import Commodities by Rail
(By Value and Percentage of Total Value of Imports)
Commodity Value
($ Millions 2007 CAD) %
Automobiles with reciprocating piston engine displacing
>1500cc but<=3000 cc $5,193 17%
Automobiles with reciprocating piston engine displacing
>3000 cc $3,242 10%
Gas powered trucks with a GVW not exceeding five tonnes $2,539 8%
Diesel powered trucks with a GVW not exceeding five tonnes $1,056 3%
Parts and accessories of bodies nes for motor vehicles $529 2%
Table 5.64: Top 5 Import Commodities by Rail
(By Weight and Percentage of Total Weight of Imports)
Commodity Weight
(000s Tonnes) %
Axles and wheels and parts 1,625 5%
Liq dielectric transf having a power handling capacity
exceeding 10,000 KVA 1,380 5%
Maize (corn), nes 1,371 5%
Iron ores and concentrates, other than roasted iron pyrites,
agglomerated 1,188 4%
Silica sands and quartz sands 1,080 4%

228
Marine
In 2007, roughly $78.2 billion worth of goods weighing 118.7 million tonnes were imported
via marine transport. Approximately 21.5% of the value and 6.9% of the weight were imported
from China and 5.1% of the value and 6.9% of the weight were imported from the United States.
Marine accounted for 19% of the total value and 37% of the total weight of imports.
Table 5.65: Top 5 Import Commodities by Marine
(By Value and Percentage of Total Value of Imports)
Commodity Value
($ Millions 2007 CAD) %
Petroleum oils and oils obtained from bituminous minerals,
crude $14,584 19%
Automobiles with reciprocating piston engine displacing
>1500cc but<=3000 cc $4,124 5%
Light oils & prep obtained from bitumi- nous min,o/t crude
etc, o/t waste $2,490 3%
Petroleum oils &oils,o/t light,obt from bituminous min(o/t
crude) etc & o/t waste $2,151 3%
Low value import transactions and confidential commodities $1,701 2%
Table 5.66: Top 5 Import Commodities by Marine
(By Weight and Percentage of Total Weight of Imports)
Commodity Weight
(000s Tonnes) %
Petroleum oils and oils obtained from bituminous minerals,
crude 22,136 19%
Low value import transactions and confidential commodities 20,341 17%
Semi-fin prod, iron/non-alloy steel, contg by weight .25% or
more carbon 13,225 11%
Bituminous coal, whether or not pulveri- sed but not
agglomerated 7,950 7%
Coal nes, whether or not pulverised but not agglomerated 6,096 5%
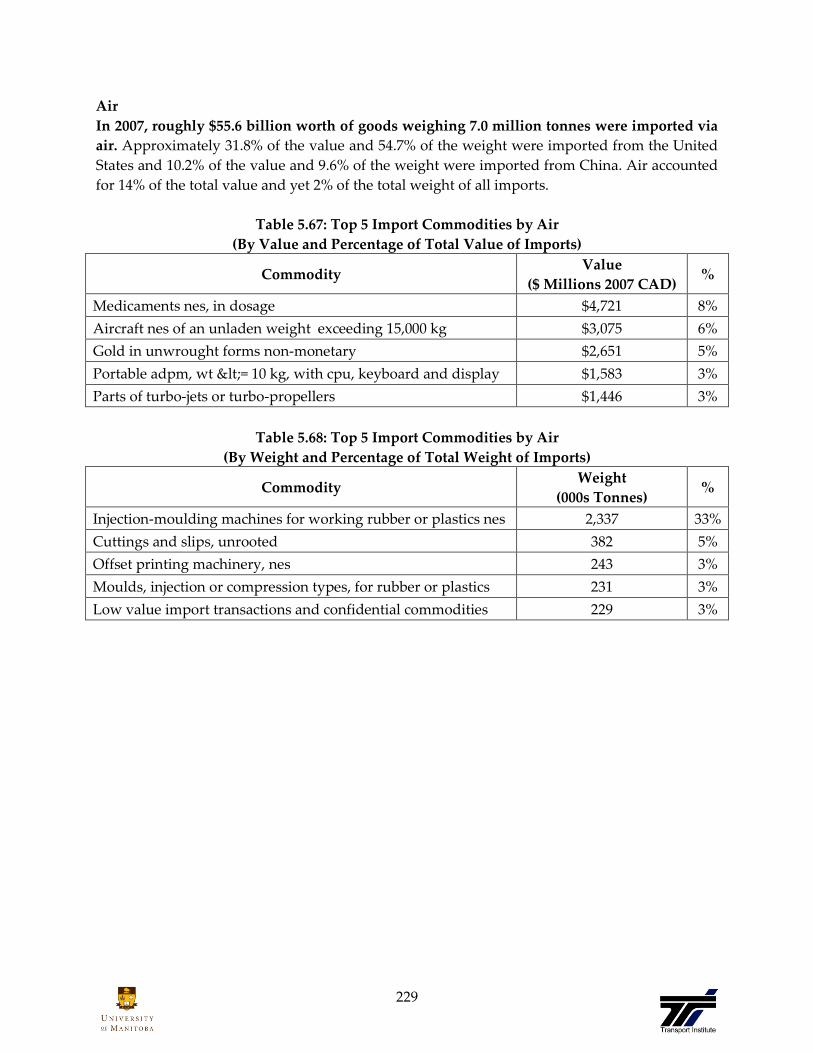
229
Air
In 2007, roughly $55.6 billion worth of goods weighing 7.0 million tonnes were imported via
air. Approximately 31.8% of the value and 54.7% of the weight were imported from the United
States and 10.2% of the value and 9.6% of the weight were imported from China. Air accounted
for 14% of the total value and yet 2% of the total weight of all imports.
Table 5.67: Top 5 Import Commodities by Air
(By Value and Percentage of Total Value of Imports)
Commodity Value
($ Millions 2007 CAD) %
Medicaments nes, in dosage $4,721 8%
Aircraft nes of an unladen weight exceeding 15,000 kg $3,075 6%
Gold in unwrought forms non-monetary $2,651 5%
Portable adpm, wt <= 10 kg, with cpu, keyboard and display $1,583 3%
Parts of turbo-jets or turbo-propellers $1,446 3%
Table 5.68: Top 5 Import Commodities by Air
(By Weight and Percentage of Total Weight of Imports)
Commodity Weight
(000s Tonnes) %
Injection-moulding machines for working rubber or plastics nes 2,337 33%
Cuttings and slips, unrooted 382 5%
Offset printing machinery, nes 243 3%
Moulds, injection or compression types, for rubber or plastics 231 3%
Low value import transactions and confidential commodities 229 3%

230
Pipeline & Energy
In 2007, roughly $4.4 billion worth of goods weighing 5.7 million tonnes were imported via
pipeline and power lines. The United States is our only trade partner for pipeline and energy.
Pipeline accounted for 1% of the total value and 3% of the total weight of imports.
Table 5.69: Top 5 Import Commodities by Pipeline & Energy
(By Value and Percentage of Total Value of Imports)
Commodity Value %
Natural gas in gaseous state $2,795,838,678 63%
Electrical energy $1,015,097,517 23%
Petroleum oils and oils obtained from bituminous minerals, crude $619,789,089 14%
Residues of petroleum oils or of oils obtained from bituminous
minerals nes $2,063,717 0%
Natural gas, liquefied $15,710 0%
Table 5.70: Top 5 Import Commodities by Pipeline & Energy
(By Weight and Percentage of Total Weight of Imports)
Commodity Weight
(000s Tonnes) %
Natural gas in gaseous state 4,783 84%
Petroleum oils and oils obtained from bituminous minerals,
crude 891 16%
Residues of petroleum oils or of oils obtained from bituminous
minerals nes 8 0%
Natural gas, liquefied 0.017 0%
Electrical energy - 0%

231
Mode of Imports for Canada Historic Comparison
Figure 5.69 shows the rate of change of the Canadian imports modal mix by value. These graphs
are in 2007 real Canadian dollars. The ‘other’ category has been left out of this analysis.
Figure 5.69: Rate of Change in Canadian Imports by Mode by Value
From 2001 to 2007 the mode to experience the most dramatic growth fluctuations was
pipeline/power. In 2006 pipeline/power mode experienced a negative growth of 70.25%, and
continued to drop with a slower decline of 0.4% in 2007.
-100.00%
-75.00%
-50.00%
-25.00%
0.00%
25.00%
50.00%
75.00%
100.00%
125.00%
150.00%
175.00%
2001 2002 2003 2004 2005 2006 2007
% C
han
ge
Air Pipeline & Energy Rail Road Marine

232
Figure 5.70 shows the rate of change of the Canadian imports modal mix by value without
pipeline and energy, due to the extreme rates of change for that mode.
Figure 5.70: Rate of Change in Canadian Imports by Mode by Value
(without Pipeline and Energy)
In 2007 road had -2.2% growth, air had a modest 6.33% growth, rail had 4.44% growth, and
marine had -0.81% growth.
Figure 5.71 shows the modal distribution of Canadian import traffic by value.
Figure 5.71: Modal Distribution, 2000-2007 Canadian Import Traffic by Value
($ Millions 2007)
-20.00%
-15.00%
-10.00%
-5.00%
0.00%
5.00%
10.00%
2001 2002 2003 2004 2005 2006 2007
% C
han
ge
Air Rail Road Marine
$66,744 $57,021 $50,958 $45,251 $48,878 $49,728 $52,271$55,579$581 $1,823 $532 $712 $2,402 $4,252 $13,498$12,417$1,970 $4,774 $5,172 $7,909 $9,706 $14,958 $4,449 $4,433$28,594 $28,771 $30,446 $27,627 $27,814 $29,165 $29,930$31,259
$275,102 $247,814 $252,430 $229,601 $229,282 $228,649 $229,635 $224,588
$69,221 $63,416 $66,401 $67,409 $69,780 $74,217 $78,847 $78,210
0%
10%
20%
30%
40%
50%
60%
70%
80%
90%
100%
2000 2001 2002 2003 2004 2005 2006 2007
Pro
po
rtio
n o
f T
ota
l Im
po
rts
Air Other Pipeline & Energy Rail Road Marine

233
From 2000 to 2007 the proportion of goods in terms of value imported by road has decreased
from 62.2% in 2000 to 55.3% of total imports by value in 2007. Rail increased from 6.5% in 2000
to 7.7% in 2007. Marine’s proportion increased from 15.7% in 2000 to 19.2% in 2007. Air
transportation of goods by value has decreased from 15.1% of the total value of the goods
imported in 2000 to 13.7% of the total value of the goods imported in 2007. The ‘other’ mode
(which includes intermodal traffic) increased from 0.1% in 2000 to 3.1% in 2007.
Figure 5.72 shows the rate of change of the Canadian imports modal mix by value.
Figure 5.72: Rate of Change in Canadian Imports by Mode by Weight
In 2007 road experienced a decline of -7.6%, air experienced a decline of -10.0%, rail experienced
an increase of 11.7%, marine experienced an increase of 22.6%, and pipeline/energy mode
experienced a decline of -23.2%.
-100.00%
-75.00%
-50.00%
-25.00%
0.00%
25.00%
50.00%
75.00%
100.00%
125.00%
150.00%
2001 2002 2003 2004 2005 2006 2007
% C
han
ge
Air Pipeline & Energy Rail Road Marine

234
Figure 5.73 shows the modal distribution of Canadian import traffic by weight.
Figure 5.73: Modal Distribution, 2000-2007 Canadian Import Traffic by Weight
(000s Tonnes)
From 2000 to 2007 the proportion of goods in terms of weight imported by road has increased
from 35.8% of total imports by weight in 2000 to 39.5% of total imports by weight in 2007. Rail
increased from 9.1% in 2000 to 9.6% in 2007. Marine’s proportion decreased from 51.4% in 2000
to 38.4% in 2007. Air transportation of goods by weight has increased from 1.7% of the total
weight of the goods imported in 2000 to 2.3% of the total weight of the goods imported in 2007.
The ‘other’ mode (which includes intermodal traffic) increased from 0.3% in 2000 to 2.3% in
2007.
3,450 2,861 3,605 4,035 7,260 6,950 7,764 6,985698 1,111 1,983 3,422 11,691 27,029 40,531 25,994
3,476 7,686 15,128 18,665 22,792 29,904 7,3985,683
18,662 20,889 19,078 21,668 23,71326,160 26,487
29,583
73,66071,466
74,841 74,941108,570
135,828 131,897121,869
105,601 100,438 99,467 105,697102,955 117,372 96,833
118,734
0%
10%
20%
30%
40%
50%
60%
70%
80%
90%
100%
2000 2001 2002 2003 2004 2005 2006 2007
Pro
po
rtio
n o
f T
ota
l Im
po
rts
Marine Road Rail Pipeline & Energy Other Air

235
Glossary
Couriers:
The courier industry group comprises establishments primarily engaged in providing air,
surface or combined courier delivery services. Courier establishments of the Post Office are
included. The local messenger industry group comprises establishments primarily engaged in
providing messenger and delivery services of small parcels within a single urban area.
Establishments engaged in the delivery of letters and documents, such as legal documents,
often by bicycle or on foot; and the delivery of small parcels, such as take‐out restaurant meals,
alcoholic beverages, and groceries, on a fee basis, usually by small truck or van, are included.
Definition Source:
<http://dsp‐psd.pwgsc.gc.ca/Collection‐R/Statcan/50‐002‐XIB/50‐002‐XIE2006003.pdf>
Direct Economic Activity
The direct employment, employment income, and expenditures and contribution to provincial
gross domestic product for a sector.
Employment:
Employed persons are those who, during the reference week:
(a) did any work at all at a job or business, that is, paid work in the context of an
employer‐employee relationship, or self‐employment. It also includes unpaid family work,
which is defined as unpaid work contributing directly to the operation of a farm, business or
professional practice owned and operated by a related member of the same household; or
(b) had a job but were not at work due to factors such as own illness or disability, personal or
family responsibilities, vacation, labour dispute or other reasons (excluding persons on
layoff, between casual jobs, and those with a job to start at a future date).
Definition Source:
<http://dsp‐psd.pwgsc.gc.ca/collection_2007/statcan/71‐543‐G/71‐543‐GIE2007001.pdf>
For Hire Trucking:
Any carrier that transports goods for compensation.
Definition Source:
<http://dsppsd.pwgsc.gc.ca/Collection‐R/Statcan/53‐222‐XIB/0000453‐222‐XIE.pdf>

236
Gross Domestic Product
Gross Domestic Product (GDP) by industry at basic prices is a measure of the economic
production which takes place within the geographical boundaries of Canada. The term
ʺgrossʺ in GDP means that capital consumption costs, that is the costs associated with
the depreciation of capital assets (buildings, machinery and equipment), are included.
The production estimates are prepared for 215 separate industries using the North
American Industrial Classification System (NAICS).
Definition Source:
<http://www.statcan.ca/cgibin/imdb/p2SV.pl?Function=getSurvey&SDDS=1301&lang=en&db=IMDB&
dbg=f&adm=8&dis=2>
Indirect Economic Activity
Additional economic activity that occur in firms that supply inputs to the direct
sector.
Induced Economic Activity
The trickle down affect of the expenditures by both the direct and related indirect
sector as they multiply through other sectors of the economy. These are largely driven
by consumption spending.
Labour Income
Labour income comprises wages and salaries and supplementary labour income. It is
defined as all compensation paid to employees. Earnings received by self‐employed
persons or working owners of unincorporated businesses are not included in labour
income. In addition to regular remuneration, it includes directorsʹ fees, bonuses,
commissions, gratuities, income in kind, taxable allowances, retroactive wage payments
and stock options. Wages and salaries are estimated on a ʺgrossʺ basis, that is, prior to
deductions for employeesʹ contributions to income tax, employment insurance, pension
funds etc. Supplementary labour income, which is defined as payments made by
employers for the future benefit of their employees, comprises employer contributions
to employee welfare, pensions, workers’ compensation and employment insurance.
Definiton Source:
<http://www.statcan.ca/cgi‐in/imdb/p2SV.pl?Function=getSurvey&SDDS=2602&lang=en&db=IMDB&
dbg=f&adm=8&dis=2>
Leading Indicators
The Canadian Composite Leading Indicator is comprised of ten components which lead
cyclical activity in the economy and together represent all major categories of Gross
Domestic Product (GDP). It thus reflects the variety of mechanisms that can cause
business cycles.
Definition Source:
<http://www.statcan.ca/cgibin/imdb/p2SV.pl?Function=getSurvey&SDDS=1601&lang=en&db=IMDB&
dbg=f&adm=8&dis=2.>

237
Leverage
The sum of the indirect and induced activities.
Paid Employment
Is work activity excluding housework and volunteer activity.
Definition Source:
<http://dsppsd.pwgsc.gc.ca/collection_2007/statcan/71‐543‐G/71‐543‐GIE2007001.pdf>
Rail
Traditionally rail data was classified under Class I and Class 2 railways. Since 1997 data
has been classified using the NAICS system. Rail Transportation falls under NAICS subsector
482, which is classified as follows:
Short‐Haul Freight Rail Transportation (482112)
Mainline Freight Rail Transportation (482113)
Passenger Rail Transportation (482114)
Definition Source:
<http://dsp‐psd.pwgsc.gc.ca/Collection‐R/Statcan/52‐216‐XIB/52‐216‐XIE2005000.pdf>
Unemployment
Given the concept of unemployment as the unutilized supply of labour, the operational
definition of unemployment is based primarily on the activity of job search and the
availability to take a job. In addition to being conceptually appropriate, job search
activities can, in a household survey, be objectively and consistently measured over
time. The definition of unemployment is therefore the following.
Unemployed persons are those who, during reference week:
(a) were on temporary layoff during the reference week with an expectation of recall and
were available for work, or
(b) were without work, had actively looked for work in the past four weeks, and were
available for work, or
(c) had a new job to start within four weeks from reference week, and were available for
work.
Persons are regarded as available if they reported that they could have worked in the
reference week if a suitable job had been offered (or recalled if on temporary layoff); or if
the reason they could not take a job was of a temporary nature such as: because of own
illness or disability, personal or family responsibilities, because they already have a job
to start in the near future, or because of vacation (prior to 1997, those on vacation were
not considered available). Full‐time students currently attending school and looking for
full‐time work are not considered to be available for work during the reference week.
They are assumed to be looking for a summer or co‐op job or permanent job to start
sometime in the future, and are therefore not part of the current labour supply.
Definition Source:
<http://dsp‐psd.pwgsc.gc.ca/collection_2007/statcan/71‐543‐G/71‐543‐GIE2007001.pdf>

238
Unemployment Rate
Number of unemployed persons expressed as a percentage of the labour force. The
unemployment rate for a particular group (for example, age, sex, marital status) is the
number unemployed in that group expressed as a percentage of the labour force for that
group.
Definition Source:
<http://dsp‐psd.pwgsc.gc.ca/collection_2007/statcan/71‐543‐G/71‐543‐GIE2007001.pdf>
Urban and Interurban Bus
Includes public transit from the Canadian Urban Transit Association and an estimate of
interurban buses based on historical Statistics Canada data. Interurban includes intercity,
school, charter, sightseeing and other buses.

239
List of Figures
Figure 1.1: Trend in Total GDP from Transportation in Manitoba ..................................................... 2
Figure 1.4: Trend in Total Employment from Trucking in Manitoba ................................................. 5
Figure 1.5: Trend in Total Employment from Aviation, Couriers, Rail, and Bus in Manitoba ...... 5
Figure 1.6: Trend in Employment by Leverage Component from Transportation in Manitoba ... 6
Figure 1.7: Trend in Total Labour Income from Transportation in Manitoba ................................... 7
Figure 1.8: Trend in Labour Income by Leverage Component from Transportation in Manitoba8
Figure 1.9: Total Contribution to Manitoba GDP by Transportation Mode: 2007 ............................ 9
Figure 1.10: Contribution to Manitoba GDP by Transportation Mode ............................................ 10
Figure 1.11: Leverage Ratios for Manitoba Total GDP by Transportation Mode ........................... 11
Figure 1.12: Contribution to Manitoba Total Employment by Transportation Mode: 2007 .......... 12
Figure 1.13: Total Employment by Transportation Mode .................................................................. 13
Figure 1.14: Leverage Ratios for Manitoba Employment by Transportation Mode ....................... 14
Figure 1.15: Contribution to Manitoba Total Labour Income by Transportation Mode: 2007 ...... 15
Figure 1.16: Total Labour Income by Transportation Mode .............................................................. 16
Figure 1.17: Leverage Ratios for Manitoba Labour Income by Transportation Mode ................... 17
Figure 2.1: Per Capita Direct GDP from Transportation and Warehousing by Region ................. 18
Figure 2.2: Ratio of Per Capita Contribution from Transportation and Warehousing to Direct
GDP: Western Canada Compared to Eastern Canada ........................................................................ 19
Figure 2.3: Per Capita Direct GDP from Transportation and Warehousing by Province Western
Canada ....................................................................................................................................................... 20
Figure 2.4: Transportation and Warehousing Direct Contribution to GDP by Region: 2007 ........ 21
Figure 2.5: Transportation and Warehousing Contribution to Direct GDP by Province: 2007 –
Western Canada ....................................................................................................................................... 22
Figure 2.6: Direct Employment in Transportation and Warehousing per 1,000 Population by
Region ........................................................................................................................................................ 23
Figure 2.7: Ratio of Per Capita Direct Transportation and Warehousing Employment: Western
Canada Compared to Eastern Canada .................................................................................................. 24
Figure 2.8: Direct Employment in Transportation and Warehousing per 1,000 Population by
Province: Western Canada ...................................................................................................................... 25
Figure 2.9: Transportation and Warehousing Contribution to Direct Employment by ................ 26
Figure 2.10: Direct Labour Income from Transportation and Warehousing per Capita by Region
.................................................................................................................................................................... 27
Figure 2.11: Ratio of Direct Per Capita Income Contribution from Transportation and
Warehousing to GDP: Western Canada Compared to Eastern Canada .......................................... 28
Figure 2.12: Direct Labour Income from Transportation and Warehousing per Capita by
Province: Western Canada ...................................................................................................................... 29
Figure 2.13: Transportation and Warehousing Direct Contribution to Labour Income by Region:
2007 ............................................................................................................................................................ 30
Figure 2.14: Direct GDP of Sectors of the Manitoba Economy: 2007 ................................................ 31
Figure 2.15: Direct GDP Level Transportation and Warehousing: Manitoba ................................. 32
Figure 2.16: Trend in Share of Manitoba Direct GDP from Transportation and Warehousing .... 33

240
Figure 2.17: Direct Paid Employment by Sector of the Manitoba Economy: 2007 Paid Employees
.................................................................................................................................................................... 34
Figure 2.18: Trend in Transportation and Warehousing’s Direct Total Employment ................... 35
Figure 2.19: Trend in Share of Manitoba Direct Paid Employment from Transportation and
Warehousing ............................................................................................................................................. 36
Figure 2.20: Direct Total Labour Income by Sector of the Manitoba Economy: 2007 ..................... 37
Figure 2.21: Direct Labour Income In Transportation and Warehousing: Manitoba ..................... 38
Figure 2.22: Trend in Share of Manitoba Labour Income from Transportation and Warehousing
.................................................................................................................................................................... 39
Figure 3.1: Gross Domestic Product (Canada/Manitoba) ................................................................... 47
Figure 3.2: Change in GDP (Canada/Manitoba) .................................................................................. 48
Figure 3.3: Labour Income (Canada/Manitoba) ................................................................................... 49
Figure 3.4: Change in Labour Income (Canada/Manitoba) ................................................................ 50
Figure 3.5: Consumer Price Index (Canada/Manitoba) ...................................................................... 51
Figure 3.6: Change in CPI (Canada/Manitoba) .................................................................................... 52
Figure 3.7: Personal Expenditures (Canada/Manitoba) ...................................................................... 53
Figure 3.8: Change in Personal Expenditures (Canada/Manitoba) ................................................... 54
Figure 3.9: Housing Starts (Canada/Manitoba) ................................................................................... 55
Figure 3.10: Change in Housing Starts (Canada/Manitoba) .............................................................. 56
Figure 3.11: Unemployment Rate (Canada/Manitoba) ....................................................................... 57
Figure 3.12: Change in Unemployment Rate (Canada/Manitoba) .................................................... 58
Figure 3.13: Quarterly Average Exchange Rates – U.S. dollar........................................................... 59
Figure 3.14: Quarterly Average Interest Rates (Bank of Canada Rate) ............................................ 60
Figure 3.15: Quarterly Average S&P/TSX Composite Index ............................................................. 61
Figure 3.16: Quarterly Average Composite Index of Leading Indicators (Canada) ....................... 62
Figure 3.17: Average Annual Composite Leading Indicator – Canada to Traditional
‚Developed‛ Economies ......................................................................................................................... 63
Figure 3.18: Average Annual Composite Leading Indicator Canada to Emerging International
Economies ................................................................................................................................................. 64
Figure 3.19: Quarterly Average Price Oil/Barrel ($US) ....................................................................... 65
Figure 3.20: Quarterly Average Unleaded Fuel Prices (Winnipeg Region) ..................................... 66
Figure 3.21: Quarterly Average Diesel Fuel Prices (Winnipeg Region) ........................................... 67
Figure 4.1: Percentage of Province/Territories’ Exports Leaving Canada From Original Province
(2007) .......................................................................................................................................................... 72
Figure 4.2: Percentage of Province/Territories’ Exports Leaving Canada From Original Province
(2007) .......................................................................................................................................................... 73
Figure 4.3: Percentage of Province/Territories’ Exports Leaving Canada From Original Province
(2007) .......................................................................................................................................................... 74
Figure 4.4: Percentage of Province/Territories’ Exports Leaving Canada From Original Province
(2007) .......................................................................................................................................................... 74
Figure 4.5: Percentage of Province/Territories’ Exports Leaving Canada From Original Province
(2007) .......................................................................................................................................................... 75
241
Figure 4.6: Percentage of Province/Territories’ Exports Leaving Canada From Original Province
(2007) .......................................................................................................................................................... 75
Figure 4.7: Percentage of Province/Territories’ Exports Leaving Canada From Original Province
(2007) .......................................................................................................................................................... 76
Figure 4.8: Percentage of Province/Territories’ Exports Leaving Canada From Original Province
(2007) .......................................................................................................................................................... 76
Figure 4.9: 2007 Provincial Exports Leaving Via Manitoba (By Value) ............................................ 77
Figure 4.10: 2007 Provincial Exports Leaving Via Manitoba, Excluding Powerline and Pipeline
Sectors (By Value) .................................................................................................................................... 78
Figure 4.11: 2007 Mode of Exports Leaving Via Manitoba, Excluding Powerline and Pipeline
Sectors (By Value) .................................................................................................................................... 78
Figure 4.12: 2007 Provincial Exports Leaving Via Manitoba, Excluding Powerline and Pipeline
Sectors (By Weight) .................................................................................................................................. 79
Figure 4.13: 2007 Mode of Exports Leaving Via Manitoba, Excluding Powerline and Pipeline
Sectors (By Weight) .................................................................................................................................. 79
Figure 4.15: 2007 Prairie Provinces’ Rail Export Weight Surplus/Deficit ........................................ 82
Figure 4.16: Rail Traffic Flows In/Through Manitoba, 2001-2007 (by Weight) ............................... 83
Figure 4.17: Rail Traffic Flows In/Through Alberta, 2001-2007 (by Weight) ................................... 84
Figure 4.18: Rail Traffic Flows In/Through Saskatchewan, 2001-2007 (by Weight) ....................... 84
Figure 4.19: Rail Traffic Flows In/Through Ontario, 2001-2007 (by Weight) ................................... 85
Figure 4.20: Rail Traffic Flows In/Through Quebec, 2001-2007 (by Weight) ................................... 85
Figure 4.21: Rail Traffic Flows In/Through Manitoba, by Originating Province, 2007 (by Weight)
.................................................................................................................................................................... 86
Figure 4.22: Westbound Rail Traffic Flowing Through Manitoba, Destined for SK, AB, BC, 2001-
2007 (by Weight)....................................................................................................................................... 87
Figure 4.23: Eastbound Rail Traffic Flowing Through Manitoba, Destined for ATL, QC, ON,
2001-2007 (by Weight) ............................................................................................................................. 88
Figure 4.24: Truck Traffic Flows In/Through Manitoba, 2004-2007 (by Weight) ............................ 89
Figure 4.25: Truck Traffic Flows In/Through Alberta, 2004-2007 (by Weight) ................................ 90
Figure 4.26: Truck Traffic Flows In/Through Saskatchewan, 2004-2007 (by Weight) .................... 90
Figure 4.27: Truck Traffic Flows In/Through Ontario, 2004-2007 (by Weight) ............................... 91
Figure 4.28: Truck Traffic Flows In/Through Quebec, 2004-2007 (by Weight) ............................... 91
Figure 4.29: Truck Traffic Flows Destined For/Through Manitoba, by Originating Province, 2007
(by Weight) ............................................................................................................................................... 92
Figure 4.30: Westbound Truck Traffic Flowing Through Manitoba, Destined for SK, AB, BC
2004-2007 (by Weight) ............................................................................................................................. 93
Figure 4.31: Eastbound Truck Traffic Flowing Through Manitoba, Destined for ATL, QUE, ON
2001-2007 (by Weight) ............................................................................................................................. 94
Figure 4.32: Rail Exports Border Crossings in Manitoba in 2007 ...................................................... 95
Figure 4.33: Major Rail Exports Border Crossings in 2007 for Canadian Western Provinces by
Value and Weight .................................................................................................................................... 96
Figure 4.34: Road Exports Border Crossings in Manitoba (Excluding Emerson) in 2007 .............. 97

242
Figure 4.35: Major Road Exports Border Crossings in 2007 for Canadian Western Provinces by
Value and Weight .................................................................................................................................... 98
Figure 4.36: Rail Imports Border Crossings in Manitoba in 2007 .................................................... 101
Figure 4.39: Major Road Imports Border Crossings in 2007 for the Canadian Western Provinces
by Value and Weight ............................................................................................................................. 104
Figure 4.40: Top 10 Export Partners of Manitoba (by Value) .......................................................... 110
Figure 4.41: Top 10 Export Partners of Manitoba (by Weight) ........................................................ 110
Figure 4.42: Manitoba’s Mode of Exports (by Value and Weight) .................................................. 111
Figure 4.43: Manitoba’s Modes of Exports Historical (by Value) ................................................... 112
Figure 4.44: Manitoba’s Modes of Exports Historical (by Weight) ................................................. 112
Figure 4.45: Top 10 Import Partners of Manitoba (by Value) .......................................................... 116
Figure 4.46: Top 10 Import Partners of Manitoba (by Weight)........................................................ 116
Figure 4.47: Manitobas Modes of Imports (by Value and Weight) ................................................. 117
Figure 4.48: Manitoba’s Modes of Imports Historical (by Value) ................................................... 118
Figure 4.49: Manitoba’s Modes of Imports Historical (by Weight)................................................. 118
Figure 4.50: Manitoba Exports to NASCO Partners, by Road ......................................................... 119
Figure 4.51: Distribution of NASCO Exports from Manitoba, by Road ......................................... 120
Figure 4.52: Manitoba Exports to NASCO Partners, by Road ......................................................... 121
Figure 4.53: Distribution of NASCO Exports from Manitoba, by Road ......................................... 122
Figure 4.54: Manitoba Exports to NASCO Partners, by Rail ........................................................... 123
Figure 4.55: Distribution of NASCO Exports from Manitoba, by Rail ........................................... 124
Figure 4.56: Manitoba Exports to NASCO Partners, by Rail ........................................................... 125
Figure 4.57: Distribution of NASCO Exports from Manitoba, by Rail ........................................... 126
Figure 4.58: Manitoba Imports from NASCO Partners, by Road .................................................... 127
Figure 4.59: Distribution of NASCO Imports to Manitoba, by Road ............................................. 128
Figure 4.60: Manitoba Imports from NASCO Partners, by Road .................................................... 129
Figure 4.61: Distribution of NASCO Imports to Manitoba, by Road ............................................. 130
Figure 4.62: Manitoba Imports from NASCO Partners, by Rail ...................................................... 131
Figure 4.63: Distribution of NASCO Imports to Manitoba, by Rail ................................................ 132
Figure 4.64: Manitoba Imports from NASCO Partners, by Rail ...................................................... 133
Figure 4.65: Distribution of NASCO Imports to Manitoba, by Rail ................................................ 134
Figure 5.1: Canada and Advanced International Economies GDP ................................................. 135
Figure 5.2: Advanced Economies Rate of Change 2003-2007 .......................................................... 136
Figure 5.3: Value, Weight, Ranks, and Rate of Change of Canadian Exports to European Union
.................................................................................................................................................................. 139
Figure 5.4: Province of Origin, Canadian Exports to European Union .......................................... 140
Figure 5.5: Region of Origin, 2003-2007 Canadian Exports to European Union – Value ............ 141
Figure 5.6: Region of Origin, 2003-2007 Canadian Exports to European Union - Weight ........... 142
Figure 5.7: Value, Weight, Ranks, and Rate of Change of Canadian Imports from European
Union ....................................................................................................................................................... 143
Figure 5.8: Value, Weight, Ranks, and Rate of Change, Canadian Exports to Japan ................... 145
Figure 5.9: Province of Origin, Canadian Exports to Japan ............................................................. 147
Figure 5.10: Region of Origin, 2003-2007 Canadian Exports to Japan – Value .............................. 148
243
Figure 5.11: Region of Origin, 2003-2007 Canadian Exports to Japan – Weight ........................... 148
Figure 5.12: Value, Weight, Ranks, and Rate of Change, Canadian Imports from Japan ............ 149
Figure 5.13: Value, Weight, Ranks, and Rate of Change, Canadian Exports to the United
Kingdom .................................................................................................................................................. 151
Figure 5.14: Province of Origin, Canadian Exports to the United Kingdom ................................. 153
Figure 5.15: Region of Origin, 2003-2007 Canadian Exports to the United Kingdom - Value .... 154
Figure 5.16: Region of Origin, 2003-2007 Canadian Exports to the United Kingdom - Weight . 155
Figure 5.17: Value, Weight, Ranks, and Rate of Change, Canadian Imports from the United
Kingdom .................................................................................................................................................. 156
Figure 5.18: Value, Weight, Ranks, and Rate of Change, Canadian Exports to the United States
.................................................................................................................................................................. 158
Figure 5.19: Province of Origin, Canadian Exports to United States .............................................. 160
Figure 5.20: Region of Origin, 2003-2007 Canadian Exports to United States - Value ................. 161
Figure 5.21: Region of Origin, 2003-2007 Canadian Exports to United States – Weight .............. 162
Figure 5.22: Value, Weight, Ranks, and Rate of Change, Canadian Imports from United States
.................................................................................................................................................................. 163
Figure 5.23: Canada and Emerging Economies GDP ........................................................................ 165
Figure 5.24: Emerging Economies Rate of Change ............................................................................ 166
Figure 5.25: Value, Weight, Ranks, and Rate of Change of Canadian Exports to Brazil ............. 167
Figure 5.26: Province of Origin, Canadian Exports to Brazil ........................................................... 169
Figure 5.27: Region of Origin, 2003-2007 Canadian Exports to Brazil – Value ............................. 170
Figure 5.28: Region of Origin, 2003-2007 Canadian Exports to Brazil – Weight ........................... 171
Figure 5.29: Value, Weight, Ranks, and Rate of Change of Canadian Imports from Brazil ........ 172
Figure 5.30: Value, Weight, Ranks, and Rate of Change of Canadian Exports to China ............. 174
Figure 5.31: Province of Origin, Canadian Exports to China ........................................................... 176
Figure 5.32: Region of Origin, 2003-2007 Canadian Exports to China – Value ............................. 177
Figure 5.33: Region of Origin, 2003-2007 Canadian Exports to China - Weight ........................... 177
Figure 5.34: Value, Weight, Ranks, and Rate of Change of Canadian Imports from China ....... 178
Figure 5.35: Value, Weight, Ranks, and Rate of Change, Canadian Exports to India .................. 180
Figure 5.36: Province of Origin, Canadian Exports to India ............................................................ 182
Figure 5.37: Region of Origin, 2003-2007 Canadian Exports to India - Value ............................... 183
Figure 5.38: Region of Origin, 2003-2007 Canadian Exports to India – Weight ............................ 183
Figure 5.39: Value, Weight, Ranks, and Rate of Change, Canadian Imports from India ............ 184
Figure 5.40: Value, Weight, Ranks, and Rate of Change, Canadian Exports to Mexico .............. 186
Figure 5.41: Province of Origin, Canadian Exports to Mexico ........................................................ 188
Figure 5.42: Region of Origin, 2003-2007 Canadian Exports to Mexico – Value ........................... 189
Figure 5.43: Region of Origin, 2003-2007 Canadian Exports to Mexico – Weight ........................ 189
Figure 5.44: Value, Weight, Ranks, and Rate of Change, Canadian Imports from Mexico ......... 190
Figure 5.45: Value, Weight, Ranks, and Rate of Change, Canadian Exports to Russia ............... 192
Figure 5.46: Province of Origin, Canadian Exports to Russia .......................................................... 194
Figure 5.47: Region of Origin, 2003-2007 Canadian Exports to Russia – Value ............................ 195
Figure 5.48: Region of Origin, 2003-2007 Canadian Exports to Russia - Weight .......................... 195
Figure 5.49: Value, Weight, Ranks, and Rate of Change, Canadian Imports from Russia .......... 196
244
Figure 5.50: Value, Weight, Ranks, and Rate of Change Canadian Exports to South Korea ...... 198
Figure 5.51: Province of Origin, Canadian Exports to South Korea ............................................... 200
Figure 5.52: Region of Origin, 2003-2007 Canadian Exports to South Korea - Value ................... 201
Figure 5.53: Region of Origin, 2003-2007 Canadian Exports to South Korea - Weight ................ 201
Figure 5.54: Value, Weight, Ranks, and Rate of Change Canadian Imports from South Korea . 202
Figure 5.55: Value, Weight, and Rate of Change, Total Canadian Exports ................................... 204
Figure 5.56: Region of Origin, 2003-2007 Canadian Exports – Value ............................................. 205
Figure 5.57: Region of Origin, 2003-2007 Canadian Exports - Weight ........................................... 205
Figure 5.58: Top 10 Export Partners of Canada (by Value) .............................................................. 211
Figure 5.59: Top 10 Export Partners of Canada (by Weight) ........................................................... 211
Figure 5.60: Canadian Exports by Mode ............................................................................................. 212
Figure 5.61: Rate of Change in Canadian Exports by Mode by Value ........................................... 216
Figure 5.62: Modal Distribution, 2000-2007 Canadian Export Traffic by Value ........................... 217
Figure 5.63: Rate of Change in Canadian Exports by Mode by Weight ......................................... 218
Figure 5.64: Modal Distribution, 2000-2007 Canadian Export Traffic by Weight ......................... 218
Figure 5.65: Value, Weight, and Rate of Change, Total Canadian Imports ................................... 219
Figure 5.66: Top 10 Import Partners of Canada (by Value) ............................................................. 224
Figure 5.67: Top 10 Import Partners of Canada (by Weight) ........................................................... 224
Figure 5.68: Canadian Imports by Mode ............................................................................................ 225
Figure 5.69: Rate of Change in Canadian Imports by Mode by Value ........................................... 231
Figure 5.70: Rate of Change in Canadian Imports by Mode by Value (without Pipeline and
Energy) .................................................................................................................................................... 232
Figure 5.71: Modal Distribution, 2000-2007 Canadian Import Traffic by Value ........................... 232
Figure 5.72: Rate of Change in Canadian Imports by Mode by Weight ......................................... 233
Figure 5.73: Modal Distribution, 2000-2007 Canadian Import Traffic by Weight ........................ 234

245
List of Tables
Table 4.1: 2007 Provincial/Territorial Usage of Jurisdictions’ Road Infrastructure ........................ 81
Table 4.2: Rail Traffic Flows Through Selected Canadian Provinces, 2007 ..................................... 86
Table 4.3: Truck Traffic Flows Through Selected Canadian Provinces, 2007 .................................. 92
Table 4.4: Top 15 Canadian Exports Border Crossings in 2007 by Value ........................................ 99
Table 4.5: Top 15 Canadian Exports Border Crossings in 2007 by Weight .................................... 100
Table 4.6: Top 15 Canadian Imports Border Crossings in 2007 by Value ...................................... 105
Table 4.7: Top 15 Canadian Imports Border Crossings in 2007 by Weight .................................... 106
Table 4.8: Top 10 Export Commodities from Manitoba (by Value) ................................................ 107
Table 4.9: Top 10 Export Commodities from Manitoba (by Weight) ............................................. 108
Table 4.10: Top 10 Export Partners of Manitoba (by Value and Weight) ....................................... 109
Table 4.11: Top 10 Import Commodities to Manitoba (by Value) ................................................... 113
Table 4.12: Top 10 Import Commodities to Manitoba (by Weight) ................................................ 114
Table 4.13: Top 10 Import Partners for Manitoba (by Value and Weight) ..................................... 115
Table 5.1: 2007 European Union Members, Canadian Trade Data ................................................. 138
Table 5.2: Top 5 Exported Commodities to the European Union (by Value) ................................ 139
Table 5.3: Top 5 Exported Commodities to the European Union (by Weight) ............................. 140
Table 5.4: Top 5 Imported Commodities from the European Union (by Value) .......................... 144
Table 5.5: Top 5 Imported Commodities from the European Union (by Weight) ........................ 144
Table 5.6: Top 5 Exported Commodities to Japan (by Value) .......................................................... 146
Table 5.7: Top 5 Exported Commodities to Japan (by Weight) ....................................................... 146
Table 5.8: Top 5 Imported Commodities from Japan (by Value) .................................................... 150
Table 5.9: Top 5 Imported Commodities from Japan (by Weight) .................................................. 150
Table 5.10: Top 5 Exported Commodities to the United Kingdom (by Value) ............................. 152
Table 5.11: Top 5 Exported Commodities to the United Kingdom (by Weight) ........................... 152
Table 5.12: Top 5 Imported Commodities from the United Kingdom (by Value) ........................ 156
Table 5.13: Top 5 Imported Commodities from the United Kingdom (by Weight) ..................... 157
Table 5.14: Top 5 Exported Commodities to the United States (by Value) .................................... 159
Table 5.15: Top 5 Exported Commodities to the United States (by Weight) ................................. 159
Table 5.16: Top 5 Imported Commodities from the United States (by Value) .............................. 163
Table 5.17: Top 5 Imported Commodities from the United States (by Weight) ............................ 164
Table 5.18: Top 5 Exported Commodities to Brazil (by Value) ....................................................... 168
Table 5.19: Top 5 Exported Commodities to Brazil (by Weight) ..................................................... 168
Table 5.20: Top 5 Imported Commodities from Brazil (by Value) .................................................. 172
Table 5.21: Top 5 Imported Commodities from Brazil (by Weight) ............................................... 173
Table 5.22: Top 5 Exported Commodities to China (by Value) ....................................................... 175
Table 5.23: Top 5 Exported Commodities to China (by Weight) ..................................................... 175
Table 5.24: Top 5 Imported Commodities from China (by Value) .................................................. 179
Table 5.25: Top 5 Imported Commodities from China (by Weight) ............................................... 179
Table 5.26: Top 5 Exported Commodities to India (by Value) ........................................................ 181
Table 5.27: Top 5 Exported Commodities to India (by Weight) ...................................................... 181
Table 5.28: Top 5 Imported Commodities from India (by Value) ................................................... 185
246
Table 5.29: Top 5 Imported Commodities from India (by Weight) ................................................ 185
Table 5.30: Top 5 Exported Commodities to Mexico (by Value) ..................................................... 187
Table 5.31: Top 5 Exported Commodities to Mexico (by Weight) .................................................. 187
Table 5.32: Top 5 Imported Commodities from Mexico (by Value) ............................................... 191
Table 5.33: Top 5 Imported Commodities from Mexico (by Weight) ............................................. 191
Table 5.34: Top 5 Exported Commodities to Russia (by Value) ...................................................... 193
Table 5.35: Top 5 Exported Commodities to Russia (by Weight) .................................................... 193
Table 5.36: Top 5 Imported Commodities from Russia (by Value) ................................................. 197
Table 5.37: Top 5 Imported Commodities from Russia (by Weight) .............................................. 197
Table 5.38: Top 5 Exported Commodities to South Korea (by Value) ............................................ 199
Table 5.39: Top 5 Exported Commodities to South Korea (by Weight) ......................................... 199
Table 5.40: Top 5 Imported Commodities from South Korea (by Value) ...................................... 203
Table 5.41: Top 5 Imported Commodities from South Korea (by Weight) .................................... 203
Table 5.42: Top 10 Canadian Export Commodities for 2007 by Value and Percentage of Total
Export Value ........................................................................................................................................... 206
Table 5.43: Top 10 Canadian Export Commodities for 2007 by Weight and Percentage of Total
Export Weight ......................................................................................................................................... 207
Table 5.44: Value and Weight of Goods Exported by Province of Origin ..................................... 208
Table 5.45: Value and Weight of Goods Exported by Province of Exit .......................................... 209
Table 5.46: Top 10 Export Partners of Canada (by Value and Weight) .......................................... 210
Table 5.47: Top 5 Export Commodities by Road (By Value and Percentage of Total Value of
Exports) ................................................................................................................................................... 212
Table 5.48: Top 5 Export Commodities by Road (By Weight and Percentage of Total Weight of
Exports) ................................................................................................................................................... 213
Table 5.49: Top 5 Export Commodities by Rail (By Value and Percentage of Total Value of
Exports) ................................................................................................................................................... 213
Table 5.50: Top 5 Export Commodities by Rail (By Weight and Percentage of Total Weight of
Exports) ................................................................................................................................................... 213
Table 5.51: Top 5 Export Commodities by Marine (By Value and Percentage of Total Value of
Exports) ................................................................................................................................................... 214
Table 5.52: Top 5 Export Commodities by Marine (By Weight and Percentage of Total Weight of
Exports) ................................................................................................................................................... 214
Table 5.53: Top 5 Export Commodities by Air (By Value and Percentage of Total Value of
Exports) ................................................................................................................................................... 215
Table 5.54: Top 5 Export Commodities by Air (By Weight and Percentage of Total Weight of
Exports) ................................................................................................................................................... 215
Table 5.55: Top 3 Export Commodities by Pipeline & Energy (By Value and Percentage of Total
Value of Exports) .................................................................................................................................... 216
Table 5.56: Top 3 Export Commodities by Pipeline & Energy (By Weight and Percentage of Total
Weight of Exports) ................................................................................................................................. 216
Table 5.57: Top 10 Canadian Import Commodities for 2007 (By Value and Percentage of Total
Import Value) ......................................................................................................................................... 220

247
Table 5.58: Top 10 Canadian Import Commodities for 2007 (By Weight and Percentage of Total
Import Weight) ....................................................................................................................................... 221
Table 5.59: Value and Weight of Goods Imported by Province of Clearance ............................... 222
Table 5.60: Top 10 Import Partners of Canada (By Value and Weight) ......................................... 223
Table 5.61: Top 5 Import Commodities by Road (By Value and Percentage of Total Value of
Import) ..................................................................................................................................................... 226
Table 5.62: Top 5 Import Commodities by Road (By Weight and Percentage of Total Weight of
Imports) ................................................................................................................................................... 226
Table 5.63: Top 5 Import Commodities by Rail (By Value and Percentage of Total Value of
Imports) ................................................................................................................................................... 227
Table 5.64: Top 5 Import Commodities by Rail (By Weight and Percentage of Total Weight of
Imports) ................................................................................................................................................... 227
Table 5.65: Top 5 Import Commodities by Marine (By Value and Percentage of Total Value of
Imports) ................................................................................................................................................... 228
Table 5.66: Top 5 Import Commodities by Marine (By Weight and Percentage of Total Weight of
Imports) ................................................................................................................................................... 228
Table 5.67: Top 5 Import Commodities by Air (By Value and Percentage of Total Value of
Imports) ................................................................................................................................................... 229
Table 5.68: Top 5 Import Commodities by Air (By Weight and Percentage of Total Weight of
Imports) ................................................................................................................................................... 229
Table 5.69: Top 5 Import Commodities by Pipeline & Energy (By Value and Percentage of Total
Value of Imports) ................................................................................................................................... 230
Table 5.70: Top 5 Import Commodities by Pipeline & Energy (By Weight and Percentage of
Total Weight of Imports) ....................................................................................................................... 230
Recommended