DOC ID© Chevron 2005
Drilling Optimization with Mechanical Specific Energy
SPE Drilling Studies Group
Christine Guerrero, Drilling EngineerDrilling Solutions TeamApril 5, 2007

DOC ID© Chevron 2005
Global MSE Opportunity
Reduce “Invisible Lost Time” component of drilling costs, by:
Maintaining optimal drilling parameters for the life of the bit
Increasing ROP to the system maximum regardless of bit type
Knowing when to replace a bit when performance is suboptimal

DOC ID© Chevron 2005
Specific Energy Principle relates the
Amount of Energy Required to Destroy a Unit Volume of Rock
with the Destruction Efficiency of the Bit.
Teale’s eqns for SE in rotary drilling at atmospheric conditions (‘65):
Pessier validated these eqns for drilling under pressure (SPE 24584 ‘92)
Mechanical Specific Energy
WOB*D
T36
*
***120
B
ROPAB
TNABWOBEs
CCS min Es
Es
min Es EFFM

DOC ID© Chevron 2005
Where:
MSE = Energy Input, psi
WOB = WOB (lbs)
AB = Bit Area, sq. inches
RPM = Rotary Speed
T = Torque, ft-lbs
ROP = Rate of Penetration, ft/hr
Factor = 0.35 (Efficiency factor)
Mechanical Specific Energy EquationSPE 92194, 2005
) *
***120( * 0.35 ROPA
TRPMAWOBMSE
BB
DOC ID© Chevron 2005
Trending ApproachSPE 92194, 2005
At perfect drilling efficiency, the MSE equals rock compressive strength. However, bits are typically only 30-40% efficient even at peak performance. That is where the Efficiency Factor comes into place (35%).
Operators commonly set the Efficiency uniformly to 0.35 regardless of bit type or WOB.
Though the value may not be as accurate as possible, the uniformity of the shift allows the curve to still be used effectively as a visual trending tool.
MSE typically uses surface drilling data only to calculate specific energy. Surface torque, WOB, and change in lithology could lead to wrong assessments in particular when drilling directional wells as surface torque and WOB do not take into account the friction losses between borehole and drillstring.
DOC ID© Chevron 2005
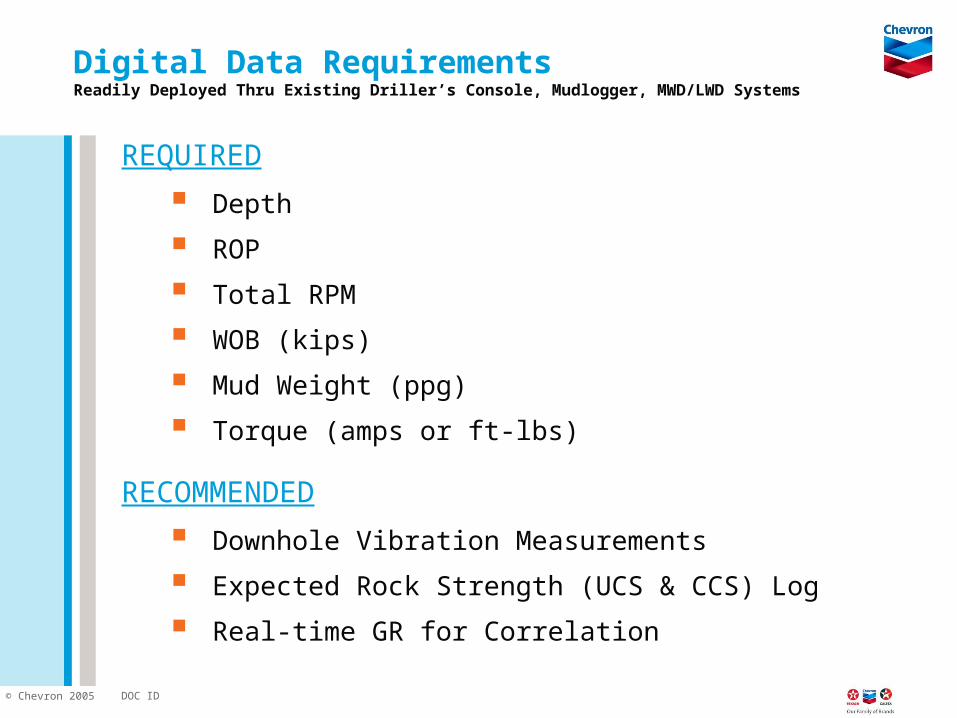
Digital Data Requirements Readily Deployed Thru Existing Driller’s Console, Mudlogger, MWD/LWD Systems
REQUIRED
Depth
ROP
Total RPM
WOB (kips)
Mud Weight (ppg)
Torque (amps or ft-lbs)
RECOMMENDED
Downhole Vibration Measurements
Expected Rock Strength (UCS & CCS) Log
Real-time GR for Correlation
DOC ID© Chevron 2005
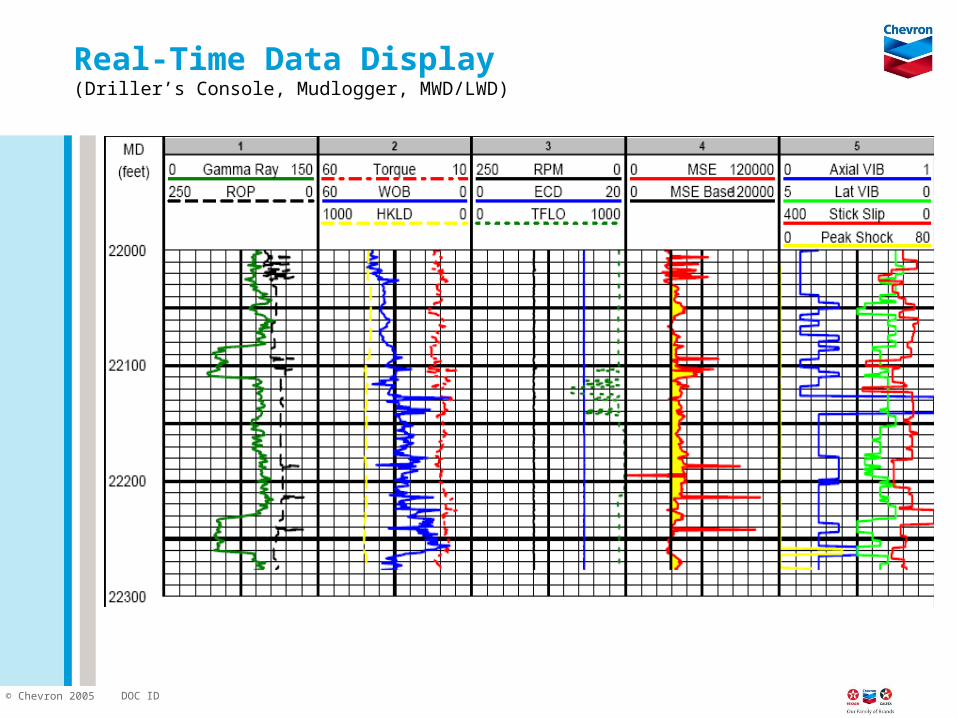
Real-Time Data Display (Driller’s Console, Mudlogger, MWD/LWD)

DOC ID© Chevron 2005
What is a Drill Off Test?
A drill off test is simply a step by step process of altering drilling parameters to maximize penetration rate and determine “Founder Point”
• “Founder Point” defined as point at which ROP stops responding linearly with increasing WOB and RPM.
Due to sensitivity of PDC bits to formation changes and the effects of wear, these tests must be performed periodically as the bits performance dictates.
2 methods of Drill Off Tests:
• Active and
• Passive
DOC ID© Chevron 2005
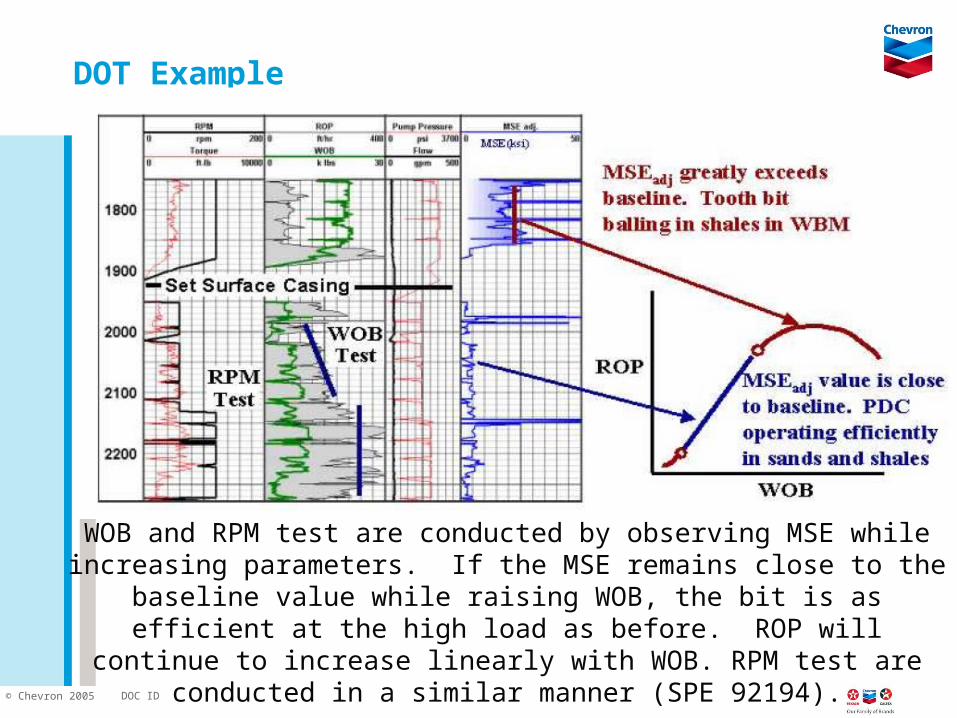
DOT Example
WOB and RPM test are conducted by observing MSE while increasing parameters. If the MSE remains close to the baseline value while raising WOB, the bit is as efficient at the high load as before. ROP will continue to increase linearly with WOB. RPM test
are conducted in a similar manner (SPE 92194).
DOC ID© Chevron 2005
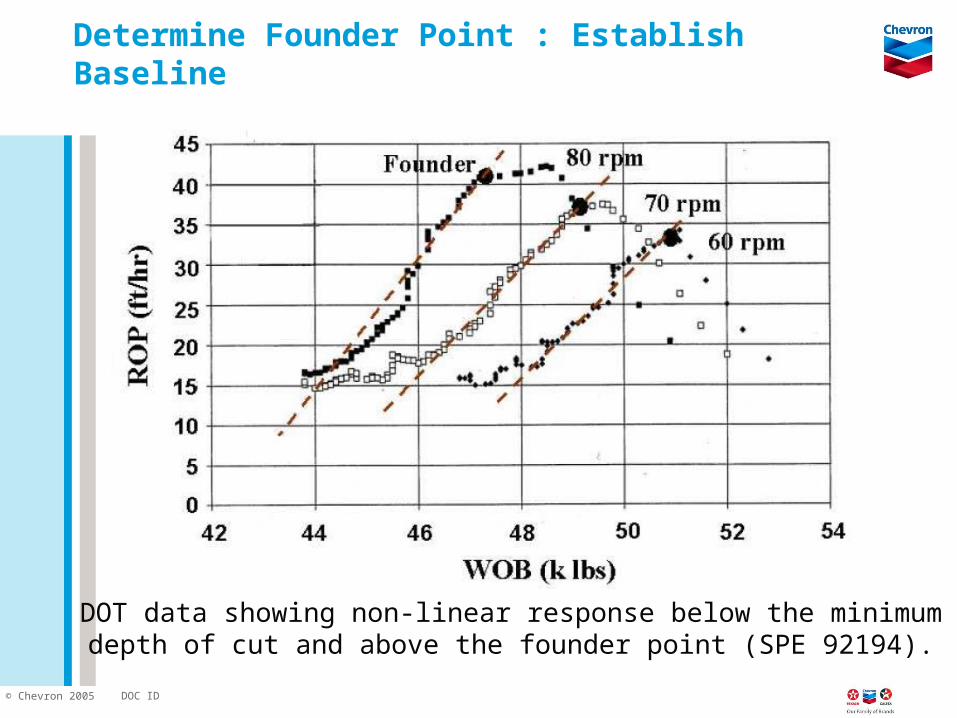
Determine Founder Point : Establish Baseline
DOT data showing non-linear response below the minimumdepth of cut and above the founder point (SPE 92194).
DOC ID© Chevron 2005
Causes of Founder - Inefficiency
Dull / Damaged Bit
Vibration
Inadequate Hole Cleaning
Bit Balling
Bottom Hole Balling
Rig / BHA Limits
DOC ID© Chevron 2005
General Guidelines for Drill-Off Tests inSoft Formations with PDC Bits
Responds well to increases in rotary speed since they fail in shear.
The absence of formations that require sufficiently high WOB to produce accelerated thermal wear allows drilling at relatively high RPM’s >150.
Cutter wear resulting from elevated rotary speeds will be low in soft non-abrasive formations.
Combination of relatively low WOB and higher RPM’s generally will yield the best performance.

DOC ID© Chevron 2005
General Guidelines for DOTs in Medium to Medium-Hard Formations w/ PDC Bits
Fail by a combination of shearing, chipping, and plowing.
These formations respond better to higher WOB rather than higher RPM’s.
Cutter wear will increase and bit life decrease to the generation of heat as harder more abrasive formations are drilled.
Only moderate increases in penetration rate are usually achieved by increasing rotary speed.
Bit weight should always be increased over rotary speed until the upper limit of the recommended weight range is obtained.
For PDC & TSP bits, higher WOB and moderated RPM’s should be utilized.

DOC ID© Chevron 2005
General Guidelines for Drill-Off Tests w/TSP bits
TSP bits will generally be drilling harder formation requiring higher WOB to effectively drill, perhaps as much as is normally applied to rock bits.
Moderate to high WOB in conjunction with moderate rotary speeds yield the best results.
Feed rate (ROP/RPM) should be maximized while attempting to maintain ROP.
DOC ID© Chevron 2005
The drilling parameters that the DOT yields can be expected to produce the optimum drilling rate only through the formation in which the test was taken.
Most formation changes will require bit weight and rotary speed changes to maintain optimum conditions.
When formation changes, a new DOT is required.
Additional DOTs are recommended every 5-6 hours to validate/confirm optimal parameter selection.
Drill Off Test Findings
DOC ID© Chevron 2005
Real-Time MSE Procedure
1. Verify current formation type via downhole Gamma reading.
2. Drill-Off Test to determine optimum WOB & RPM
3. Calculate MSE. (The amount of mechanical energy input at the rig floor per unit volume of material removed).
4. Establish “new bit” MSE trend as bit drills ahead
Observed while bit is sharp and adequate hole cleaning is achieved.
5. Monitor and compare the RT MSE to the “new bit” MSE.
Increase in MSE could indicate a drilling inefficiency!
Estimate the wear by comparing the current w/ the “new bit” MSE

DOC ID© Chevron 2005
Qualitative description of formation anddrilling tool dependencies (SPE 74520).
Relative Performance vs. Dull Grade
DOC ID© Chevron 2005
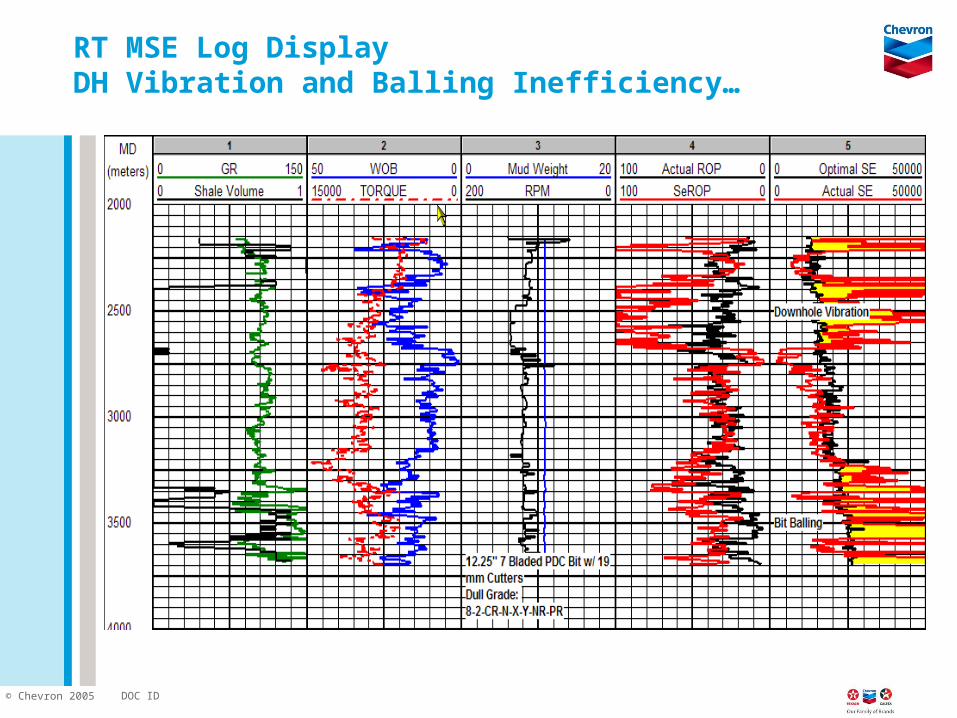
RT MSE Log DisplayDH Vibration and Balling Inefficiency…
DOC ID© Chevron 2005
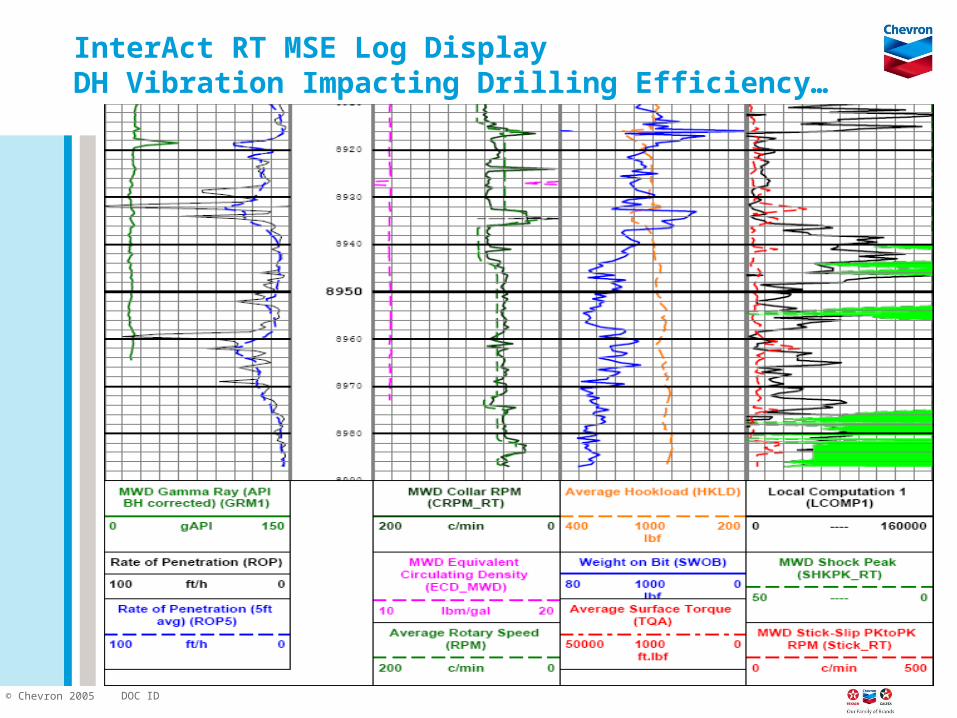
InterAct RT MSE Log DisplayDH Vibration Impacting Drilling Efficiency…

DOC ID© Chevron 2005
Know when to pull the bit…UK Sector North Sea - 7 Bladed PDC
DOC ID© Chevron 2005
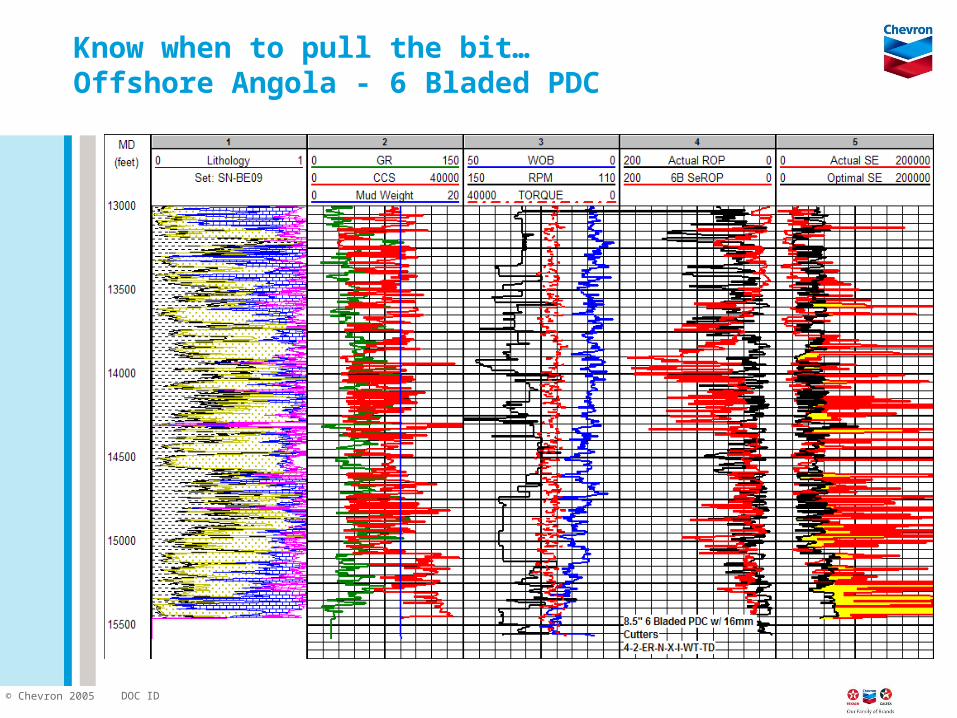
Know when to pull the bit…Offshore Angola - 6 Bladed PDC
DOC ID© Chevron 2005
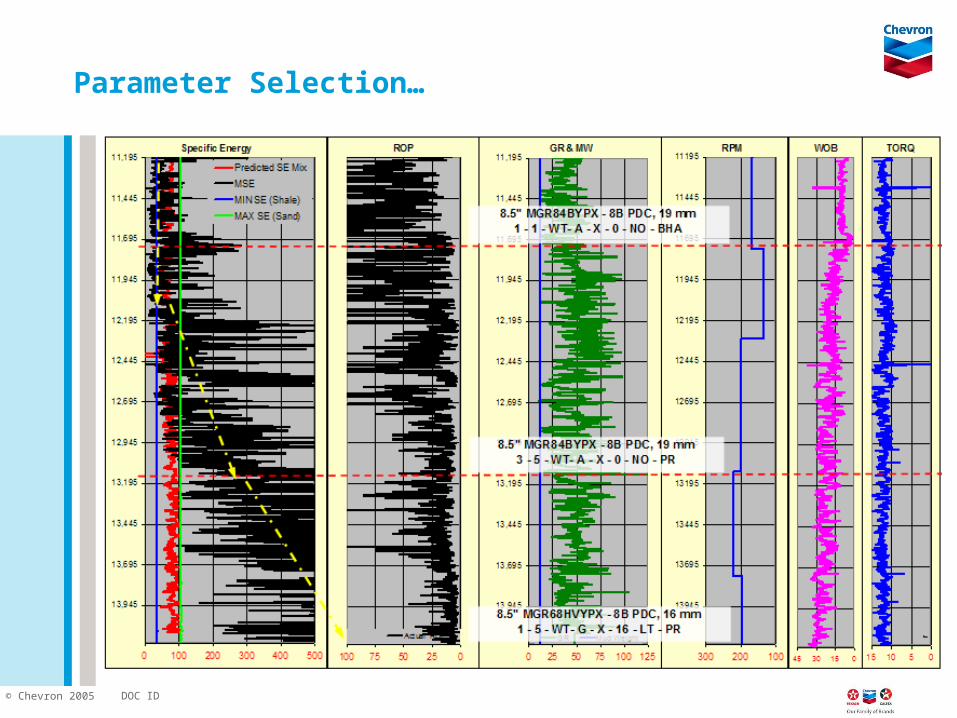
Parameter Selection…

DOC ID© Chevron 2005
Parameter Selection…
DOC ID© Chevron 2005
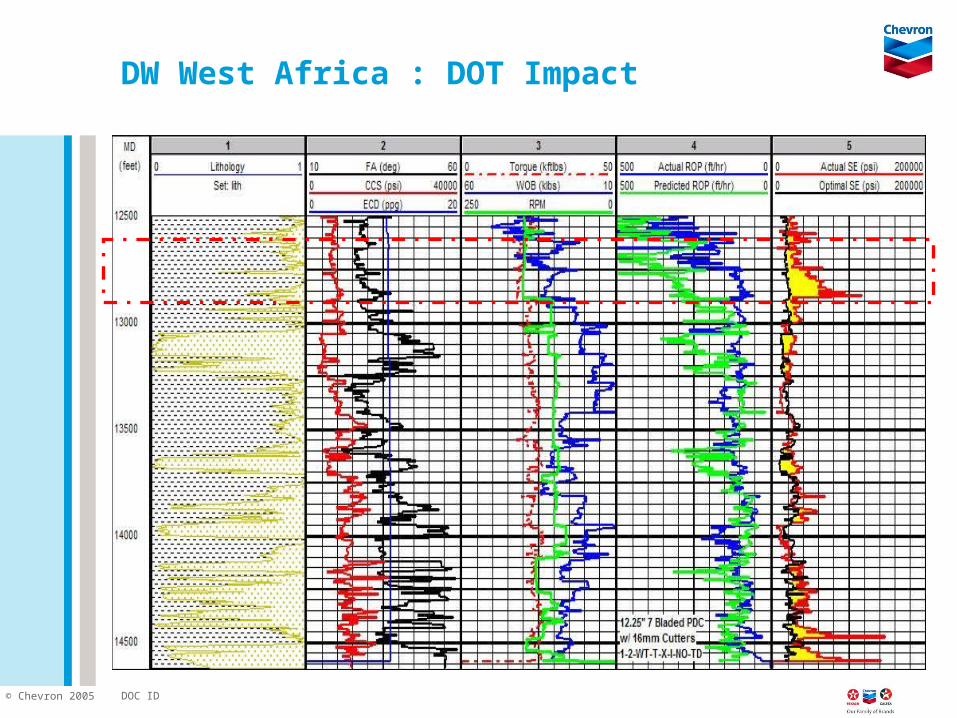
DW West Africa : DOT Impact
DOC ID© Chevron 2005
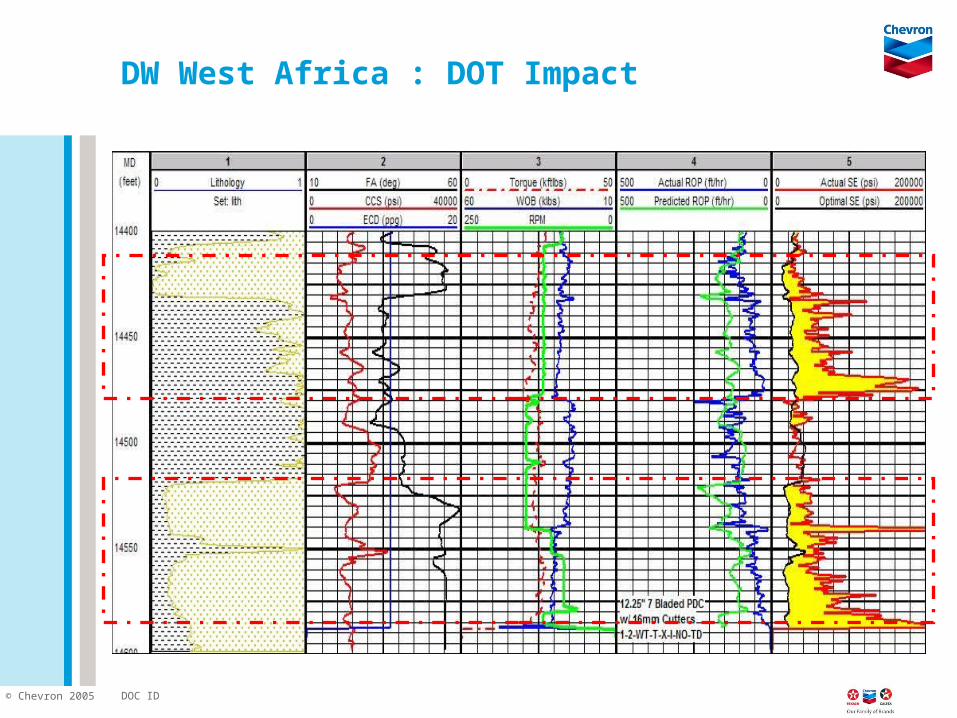
DW West Africa : DOT Impact
DOC ID© Chevron 2005
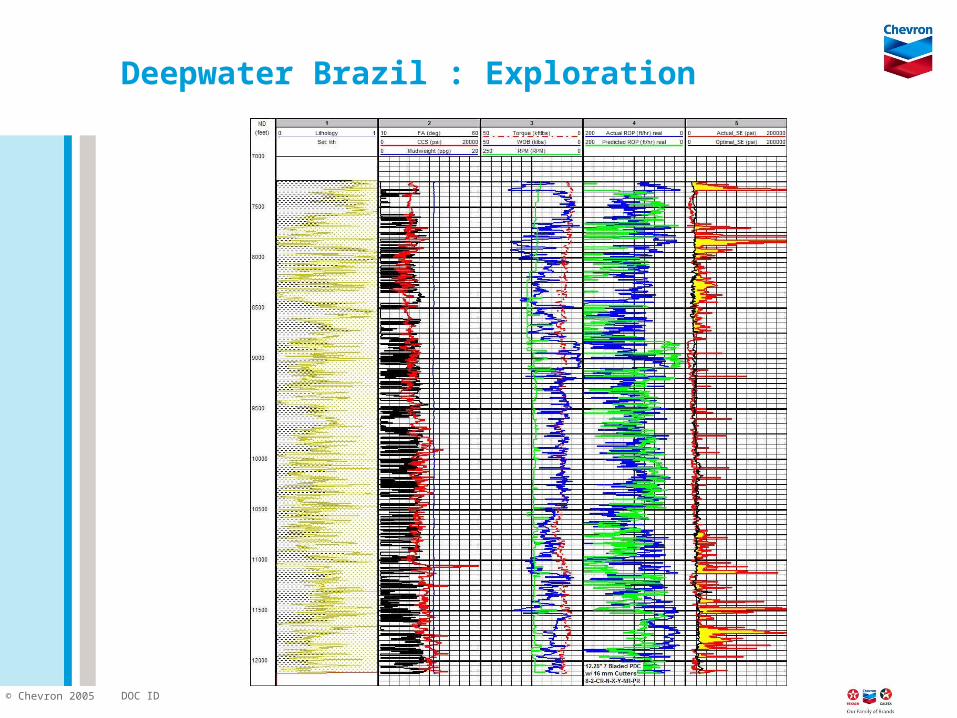
Deepwater Brazil : Exploration
DOC ID© Chevron 2005
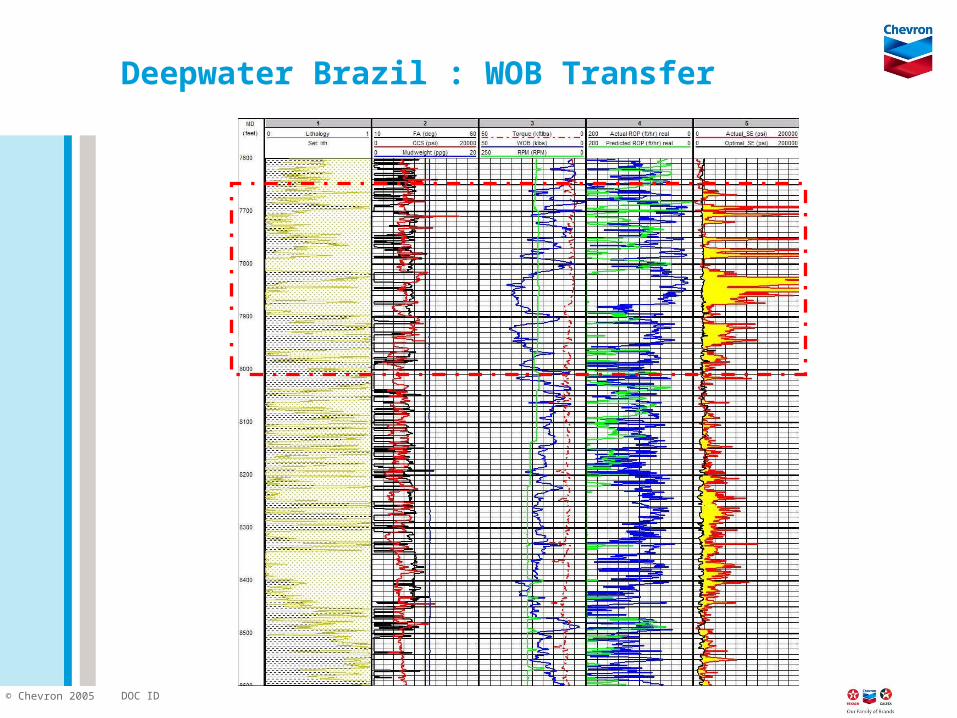
Deepwater Brazil : WOB Transfer
DOC ID© Chevron 2005
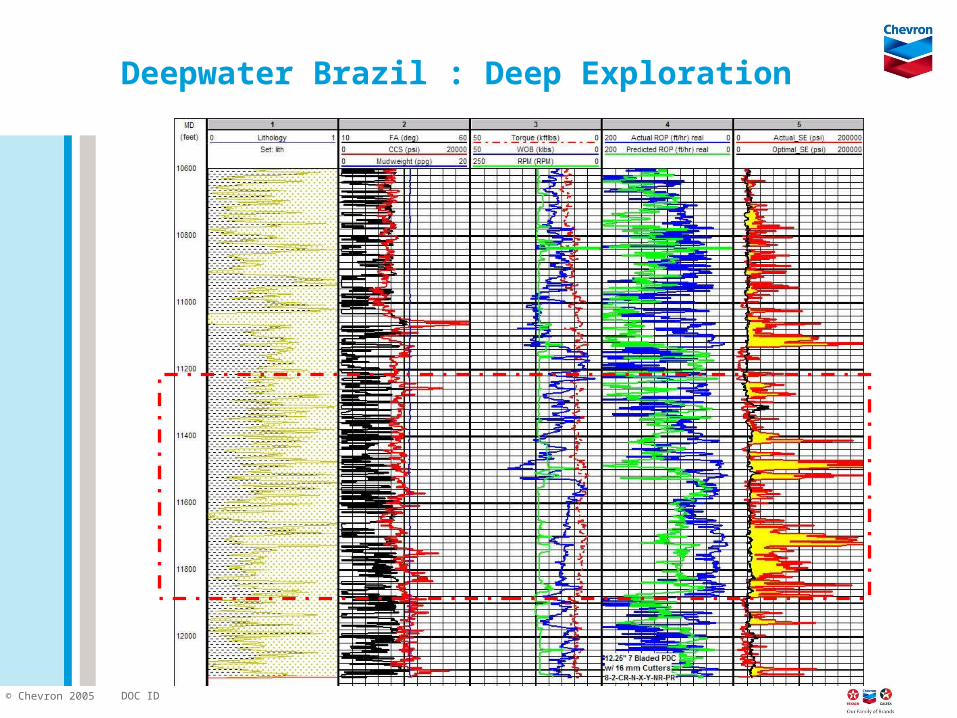
Deepwater Brazil : Deep Exploration

DOC ID© Chevron 2005
Deepwater GOM : Vibration

DOC ID© Chevron 2005
Recommended Reading
Teale, R.: “The Concept of Specific Energy in Rock Drilling,” Int. J. Rock Mech. Mining Sci. (1965) 2, 57-53.
Waughman, R., Kenner, J., Moore, R.: “Real-Time Specific Energy Monitoring Reveals Drilling Inefficiency and Enhances the Understanding of When to Pull Worn PDC Bits,” paper SPE 74520 presented at 2002 SPE Drilling Conference, Dallas, Texas, 26-28 February 2002.
Dupriest, F. and Koederitz, W.: “Maximizing Drill Rates with Real-Time Surveillance of Mechanical Specific Energy,” paper SPE 92194 presented at 2005 SPE Drilling Conference, Amsterdam, The Netherlands, 23-25 February 2005.
Caicedo, H., Calhoun, W., Ewy, R.: “Unique ROP Predictor Using Bit-specific Coefficient of Sliding Friction and Mechanical Efficiency as a Function of Confined Compressive Strength Impacts Drilling Performance,” paper SPE 92576 presented at 2005 SPE Drilling Conference, Amsterdam, The Netherlands, 23-25 February 2005.
Recommended