1
Earnings Release | Conference Call – 1Q12 May 15th 2012
2
Agenda
Ricardo Ribeiro
Vice President
Carlos Wollenweber
CFO | IR
1Q12 and Operating
Highlights
Financial Highlights
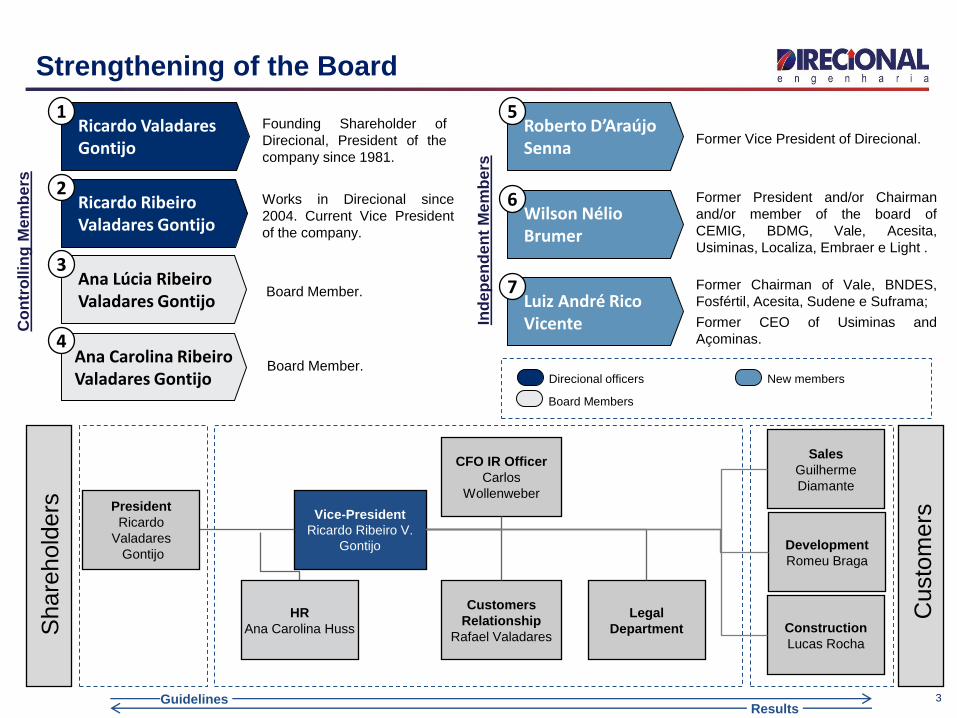
Strengthening of the Board
3
Co
ntr
ollin
g M
em
be
rs
Ind
ep
en
de
nt
Me
mb
ers
Ricardo Valadares Gontijo
Founding Shareholder of
Direcional, President of the
company since 1981.
Works in Direcional since
2004. Current Vice President
of the company.
Former Vice President of Direcional.
Former President and/or Chairman
and/or member of the board of
CEMIG, BDMG, Vale, Acesita,
Usiminas, Localiza, Embraer e Light .
Former Chairman of Vale, BNDES,
Fosfértil, Acesita, Sudene e Suframa;
Former CEO of Usiminas and
Açominas.
Vice-President
Ricardo Ribeiro V.
Gontijo
Guidelines
Share
hold
ers
Custo
mers
CFO IR Officer
Carlos
Wollenweber
Legal
Department
HR
Ana Carolina Huss
Customers
Relationship
Rafael Valadares Construction
Lucas Rocha
President
Ricardo
Valadares
Gontijo
Sales
Guilherme
Diamante
Development
Romeu Braga
Board Member.
Board Member.
Ricardo Ribeiro Valadares Gontijo
Ana Lúcia Ribeiro Valadares Gontijo
Ana Carolina Ribeiro Valadares Gontijo
1
2
3
4
Wilson Nélio Brumer
Luiz André Rico Vicente
Roberto D’Araújo Senna
5
6
7
Direcional officers New members
Board Members
Results

Main Figures
4
1. Adjusted by non-cash expenses (Stock-Options Program).
1Q12 4Q11
Launched PSV% Direcional
R$ million 143 428
Contracted PSV% Direcional
R$ million 133 367
Sales Over Supply (VSO) % PSV 16.1% 31.8%
Net Revenues R$ million 327 296
Adjusted Net Income¹ R$ million 54 48
Adjusted Net Margin¹ % 16.6% 16.2%
5
Operating Highlights
Launches
Sales
Delivered Units
Land Bank
Inventory
Operating Highlights Ricardo Ribeiro
Vice President
6
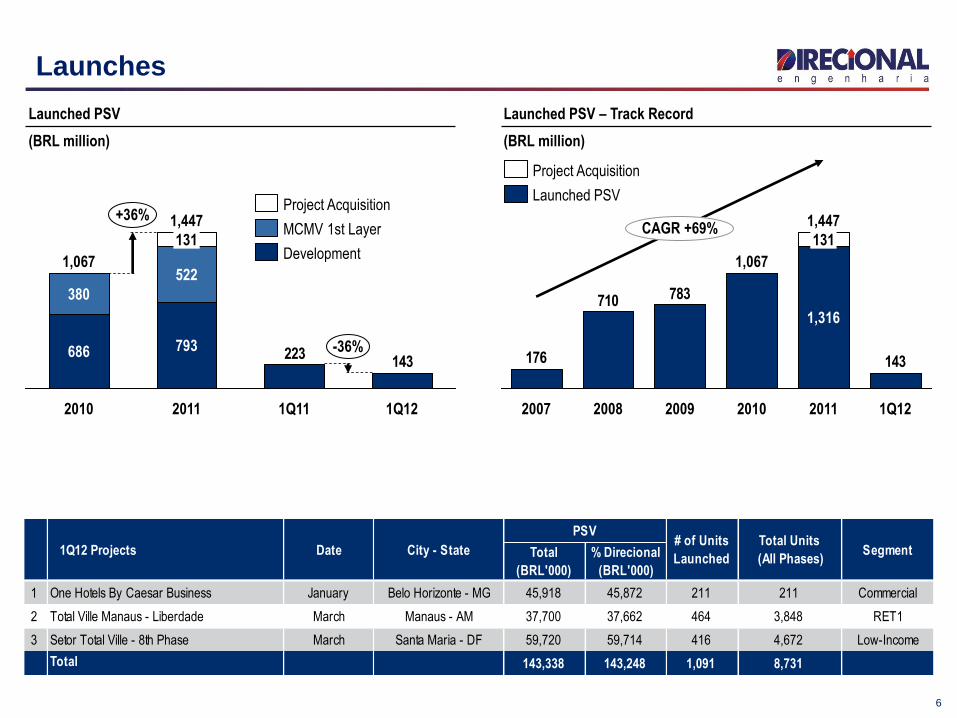
Launches
Launched PSV
(BRL million)
Launched PSV – Track Record
(BRL million)
143223
1,447
1Q12 1Q11 2011
793
522
131
2010
1,067
686
380
-36%
+36%
143
783710
176
CAGR +69%
1Q12 2011
1,447
1,316
131
2010
1,067
2009 2008 2007
Development
MCMV 1st Layer
Project Acquisition Launched PSV
Project Acquisition
Total
(BRL'000)
% Direcional
(BRL'000)
1 One Hotels By Caesar Business January Belo Horizonte - MG 45,918 45,872 211 211 Commercial
2 Total Ville Manaus - Liberdade March Manaus - AM 37,700 37,662 464 3,848 RET1
3 Setor Total Ville - 8th Phase March Santa Maria - DF 59,720 59,714 416 4,672 Low-Income
Total 143,338 143,248 1,091 8,731
# of Units
Launched
Total Units
(All Phases)Segment1Q12 Projects Date City - State
PSV
MG
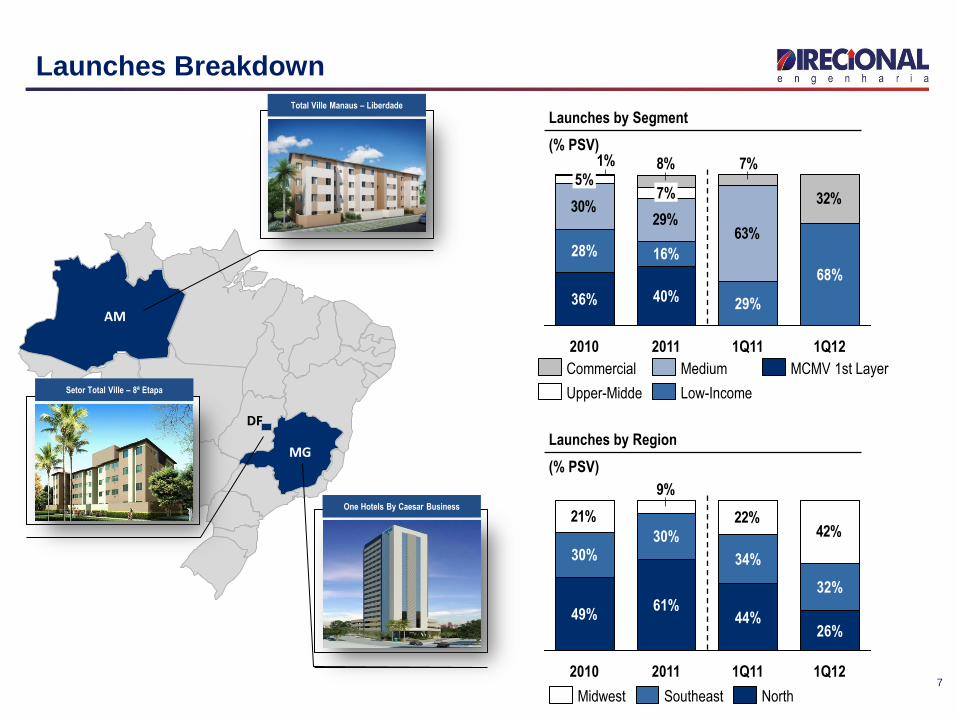
Launches Breakdown
7
DF
AM
30%29%
63%
32%
7%8%1%
1Q11
29%
2011
16%
2010
5%
40%
7%
36%
28%
1Q12
68%
Launches by Segment
(% PSV)
Launches by Region
(% PSV)
21% 22%42%
9%
1Q12
26%
32%
1Q11
44%
34%
2011
61%
30%
2010
49%
30%
North Southeast Midwest
MCMV 1st Layer
Low-Income
Medium
Upper-Midde
Commercial
Setor Total Ville – 8ª Etapa
Total Ville Manaus – Liberdade
One Hotels By Caesar Business
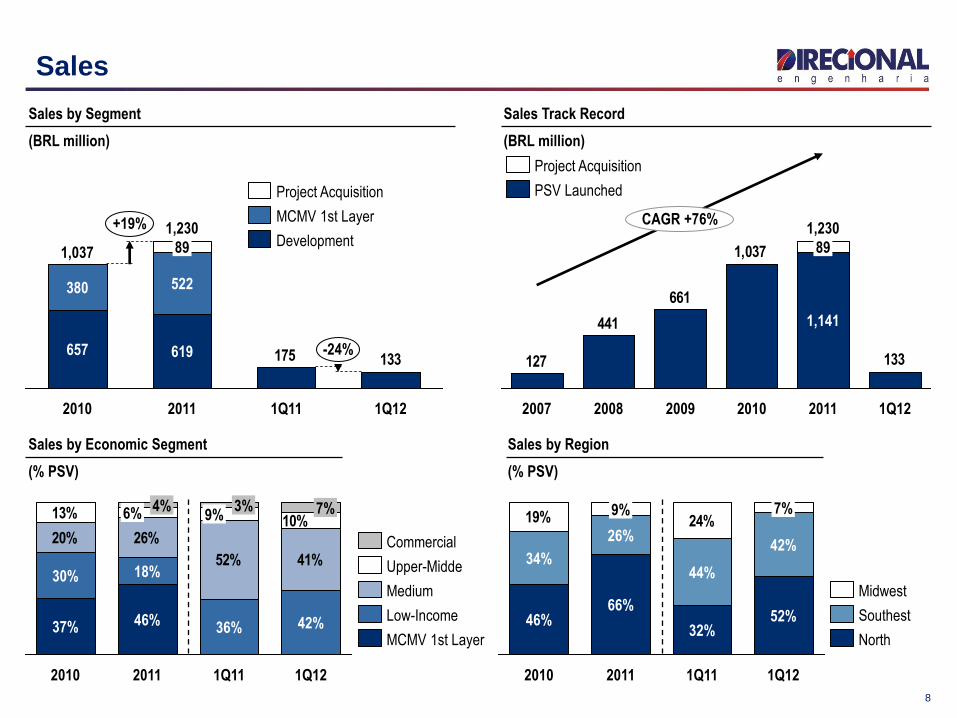
Sales
Sales by Segment
(BRL million)
Sales Track Record
(BRL million)
133175 -24%
1,230 +19%
1Q12 1Q11 2011
619
522
89
2010
1,037
657
380
Development
MCMV 1st Layer
Project Acquisition
133
1,037
661
441
127
CAGR +76%
1Q12 2011
1,230
1,141
89
2010 2009 2008 2007
PSV Launched
Project Acquisition
8
20% 26%
52% 41%
13%10%
1Q12
42%
7%
1Q11
36%
9% 3%
2011
46%
18%
6% 4%
2010
37%
30%
MCMV 1st Layer
Low-Income
Medium
Upper-Midde
Commercial
Sales by Economic Segment
(% PSV)
Sales by Region
(% PSV)
19% 24%
52%
42%
7%
1Q11
32%
44%
2011
66%
26%
9%
2010
46%
34%
1Q12
North
Southest
Midwest
9
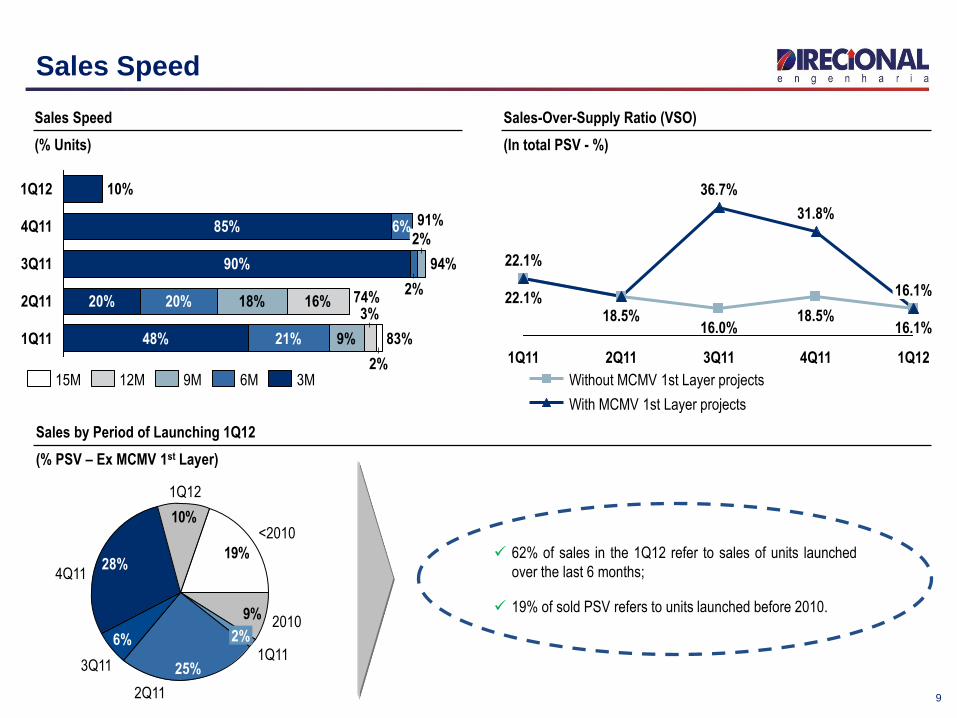
Sales Speed
1Q12
16.1%
16.1%
4Q11
31.8%
18.5%
3Q11
16.0%
2Q11
18.5%
1Q11
22.1%
22.1%
36.7%
With MCMV 1st Layer projects
Without MCMV 1st Layer projects
Sales-Over-Supply Ratio (VSO)
(In total PSV - %)
1Q11 83% 48% 21% 9%
3%
2%
2Q11 74% 20% 20% 18% 16%
3Q11 94% 90%
2%
2% 4Q11 91% 85% 6%
1Q12 10%
3M 6M 9M 12M 15M
10%
9%
19%
1Q12
4Q11 28%
3Q11
6%
2Q11
25% 1Q11
2% 2010
<2010
Sales by Period of Launching 1Q12
(% PSV – Ex MCMV 1st Layer)
Sales Speed
(% Units)
62% of sales in the 1Q12 refer to sales of units launched
over the last 6 months;
19% of sold PSV refers to units launched before 2010.
10
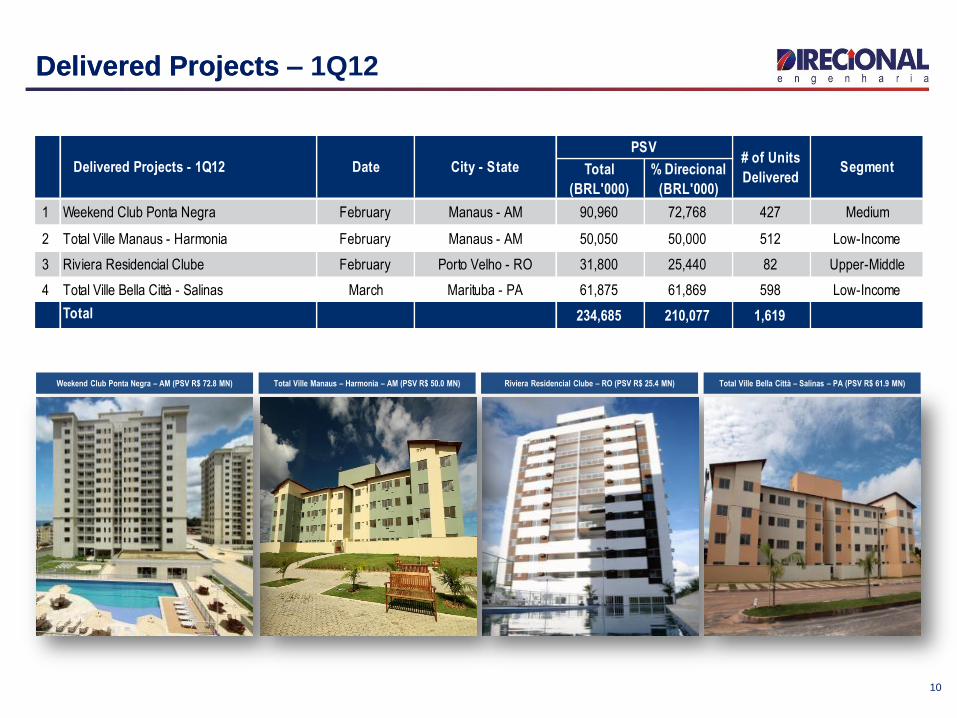
Delivered Projects – 1Q12
Delivered Projects
Total
(BRL'000)
% Direcional
(BRL'000)
1 Weekend Club Ponta Negra February Manaus - AM 90,960 72,768 427 Medium
2 Total Ville Manaus - Harmonia February Manaus - AM 50,050 50,000 512 Low-Income
3 Riviera Residencial Clube February Porto Velho - RO 31,800 25,440 82 Upper-Middle
4 Total Ville Bella Città - Salinas March Marituba - PA 61,875 61,869 598 Low-Income
Total 234,685 210,077 1,619
Delivered Projects - 1Q12 Date City - State
PSV# of Units
DeliveredSegment
Total Ville Manaus – Harmonia – AM (PSV R$ 50.0 MN) Total Ville Bella Città – Salinas – PA (PSV R$ 61.9 MN)Riviera Residencial Clube – RO (PSV R$ 25.4 MN)Weekend Club Ponta Negra – AM (PSV R$ 72.8 MN)
11
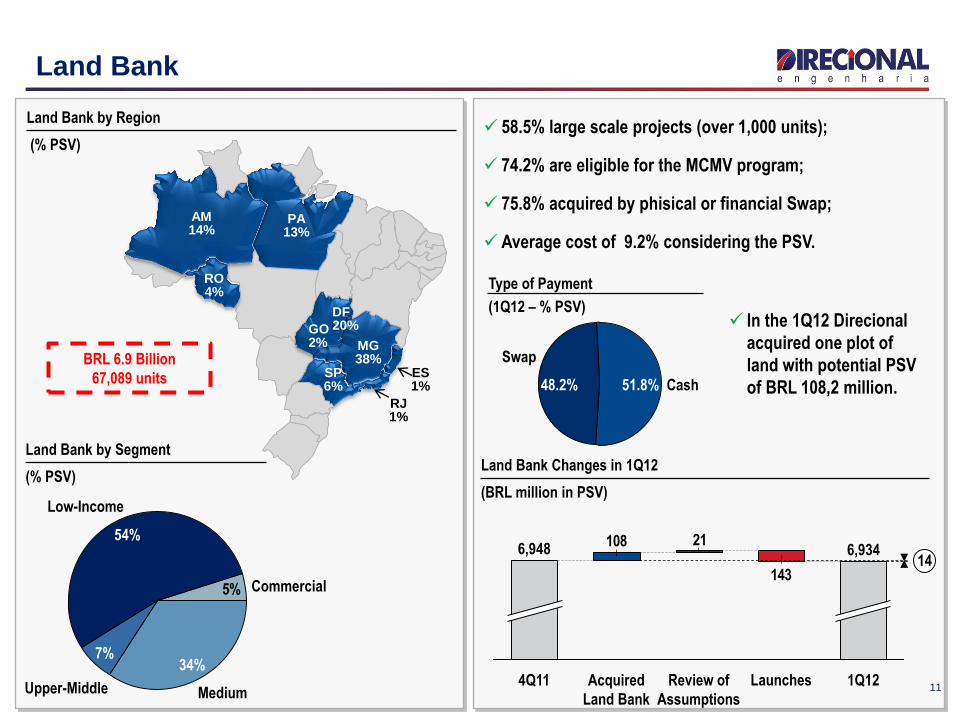
Land Bank
58.5% large scale projects (over 1,000 units);
74.2% are eligible for the MCMV program;
75.8% acquired by phisical or financial Swap;
Average cost of 9.2% considering the PSV.
BRL 6.9 Billion
67,089 units
Land Bank by Segment
(% PSV) Land Bank Changes in 1Q12
(BRL million in PSV)
143
211086,934
1Q12 Launches Review of
Assumptions
Acquired
Land Bank
4Q11
6,948 14
Land Bank by Region
(% PSV)
In the 1Q12 Direcional
acquired one plot of
land with potential PSV
of BRL 108,2 million.
Type of Payment
(1Q12 – % PSV)
ES 1%
AM 14%
MG 38%
RO 4%
SP 6%
PA 13%
DF 20%
RJ 1%
GO 2%
Swap
48.2% Cash 51.8%
5%
Low-Income
54%
Upper-Middle
7%
Medium
34%
Commercial

12
Inventory
10,3% of PSV are finished units;
90,0% of units under construction have already been sold.
15.1%
2011
<2010
14.4%
1Q12
37.9%
10.3%
Finished Units
22.2%
2010 Midwest 17%
Southwest 17%
66% North
Inventory by Region
( % PSV)
Inventory by Year of Launching
(% PSV)
Total % Direcional
Under Construction 702,142 633,181 89.7% 3,525 90.9%
Finished Units 94,195 72,732 10.3% 352 9.1%
Total 796,336 705,913 100.0% 3,877 100.0%
%InventoryPSV in Inventory (BRL'000)
% Units in Inventory

13
Financial Highlights
Financial Highlights
Capital Structure
Cash Burn
Deferred Results
DIRR3 Stock Analysis
Financial Highlights Carlos Wollenweber
CFO | IR
14
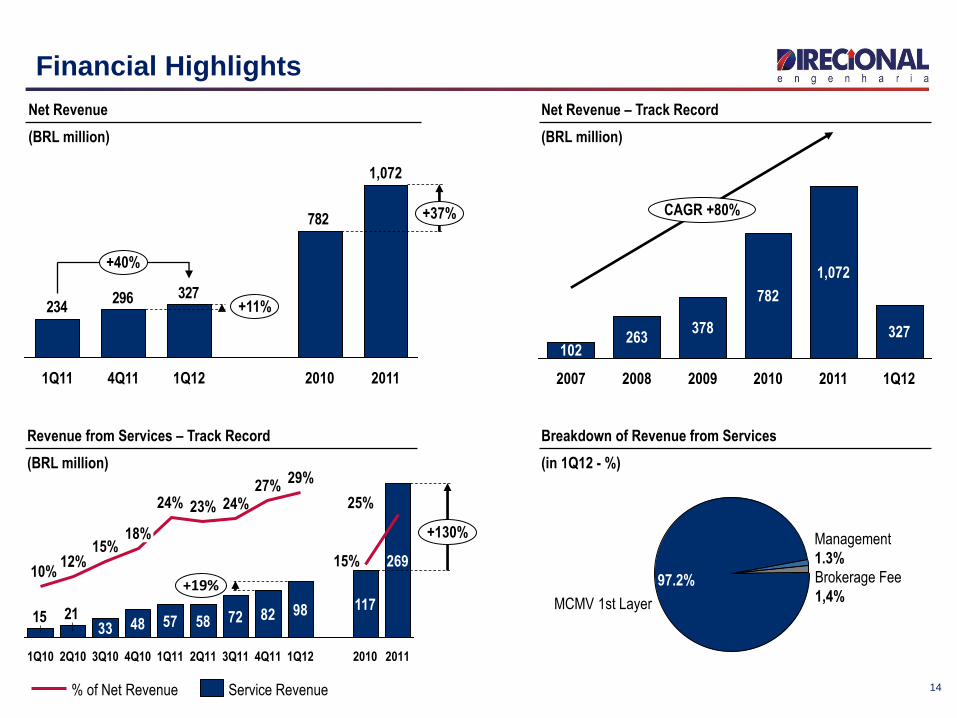
Financial Highlights
782
327296234
+40%
+11%
1,072
+37%
2011 2010 1Q12 4Q11 1Q11
CAGR +80%
1Q12
327
2011
1,072
2010
782
2009
378
2008
263
2007
102
Net Revenue
(BRL million)
Net Revenue – Track Record
(BRL million)
2115
+130%
2011
269
25%
+19% 117
15%
1Q12 2010
98
29%
4Q11
82
27%
3Q11
72
24%
2Q11
58
23%
1Q11
57
24%
4Q10
48
18%
3Q10
33
15%
2Q10
12%
1Q10
10%
Revenue from Services – Track Record
(BRL million)
MCMV 1st Layer
97.2% Brokerage Fee
1,4%
Management
1.3%
Breakdown of Revenue from Services
(in 1Q12 - %)
Service Revenue % of Net Revenue
1Q11 1Q12 D %
Gross Revenue 239 339 42%
Development 182 241 32%
Services 57 98 73%
15
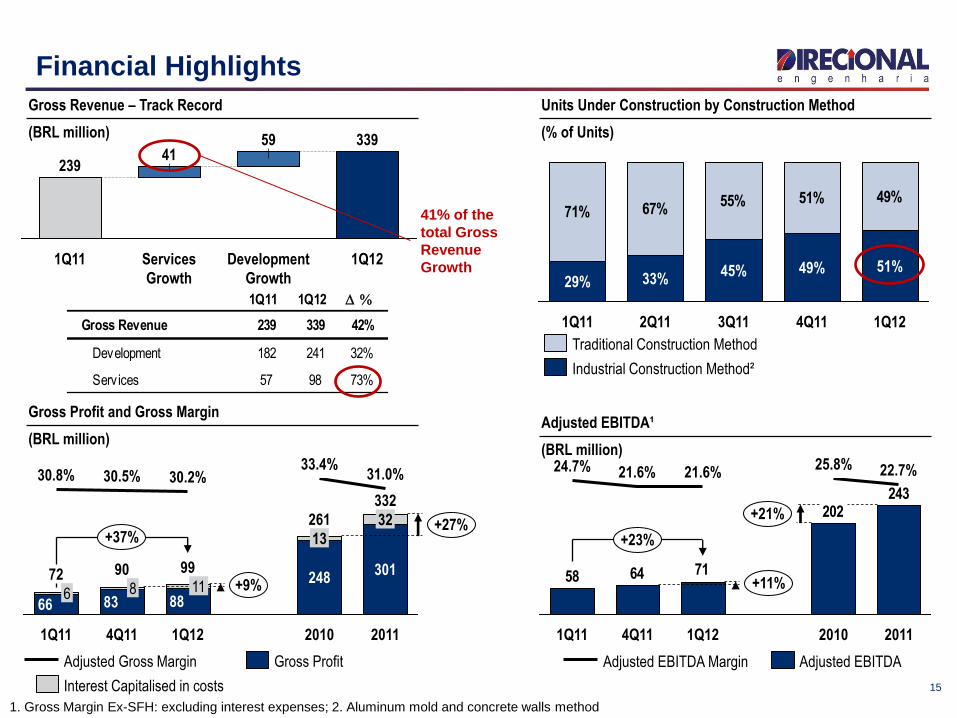
Gross Revenue – Track Record
(BRL million)
1Q12
339
Development
Growth
59
Services
Growth
41
1Q11
239
71% 67%55% 51% 49%
1Q12
51%
4Q11
49%
3Q11
45%
2Q11
33%
1Q11
29%
Industrial Construction Method²
Traditional Construction Method
Units Under Construction by Construction Method
(% of Units)
+37%
+9%
332
+27%
2011
301
32
31.0%
2010
261
248
13
33.4%
1Q12
99
88
30.2%
4Q11
90
83
30.5%
1Q11
72
66
30.8%
11 8 6
Gross Profit
Interest Capitalised in costs
Adjusted Gross Margin
Gross Profit and Gross Margin
(BRL million) Adjusted EBITDA¹
(BRL million)
Financial Highlights
1. Gross Margin Ex-SFH: excluding interest expenses; 2. Aluminum mold and concrete walls method
41% of the
total Gross
Revenue
Growth
243202
716458
+23%
+11%
+21%
2011
22.7%
2010
25.8%
1Q12
21.6%
4Q11
21.6%
1Q11
24.7%
Adjusted EBITDA Adjusted EBITDA Margin

16
Financial Highlights
199176
544851+14%
+13%
2011
18.5%
2010
22.6%
1Q12
16.6%
4Q11
16.2%
1Q11
21.7%
+7%
CAGR +74%
1Q12
54
16.6%
2011
199
18.5%
2010
176
22.6%
2009
85
22.5%
2008
64
24.5%
2007
22
21.1%
Adjusted Net Income¹
(BRL million)
Adjusted Net Income - Track Record
(BRL million)
Adjusted Net Income¹ Adjusted Net Margin¹ Adjusted Net Income¹ Adjusted Net Margin¹
Adjusted¹ G&A
(BRL million)
Sales Expenses
(BRL million)
2423
171617
7.3%6.5%7.8%7.1%6.9%6.6%
1Q12 4Q11
19
16
3
3Q11 2Q11 1Q11 4Q10
99
67
56
2.6%3.1%2.0%3.1%2.1%2.3%
1Q12 4Q11 3Q11 2Q11 1Q11 4Q10
Sales Expenses % Net Revenue
Accounting adjustments
Adjusted¹ G&A % Net Revenue
1. Adjusted by non-cash expenses (Stock-Options Program).

Cash and Debt 1Q12 4Q11 1Q11 D % D %
(BRL'000) (a) (b) (c) (a/b) (a/c)
Loans and Financing 556,575 473,152 348,307 17.6% 59.8%
SFH 492,754 407,563 282,674 20.9% 74.3%
Receivables Securitization 30,080 31,847 36,429 -5.5% -17.4%
FINAME and others 13,707 13,076 8,611 4.8% 59.2%
Working Capital 20,034 20,666 20,593 -3.1% -2.7%
Cash and Cash Equivalents 364,088 351,112 355,410 3.7% 2.4%
Net debt 192,487 122,040 -7,103 57.7% n/a
Net debt / Equity 14.8% 9.9% -0.6%
17
Capital Structure
Net Debt
192
Cash and Cash
Equivalent
364
Net Debt
Without SFH
-300
Gross Debt
557
SFH
493
64
Indebtedness
(BRL million)
SFH
93.6%
FINAME and others
2.6%
Working Capital
3.8%
Loans and Financing Ex-Securitization
(% Loans and Financing)

1. Cash Burn: measured by the variation of the net debt, less capital increases, dividends and share repurchase plan.
18
Cash Burn
+12%
1Q12
70
4Q11 4Q09
33
3Q09
22
2Q09
25
1Q09
15
86
2Q10
55
1Q10
41 28
3Q11
52
2Q11
34
1Q11
63
4Q10
101
3Q10
Cash Burn¹
(BRL million)
D Accounts
receivable from
concluded units
-6
Cash Burn
176
Cash Burn
70
-33
Adjusted
Cash Burn
103
D Accounts
receivable from
concluded units
Cash Burn vs D Accounts receivable from concluded units
(BRL million)
2011 1Q12
-38%
2011
176
2010
283

19
Deferred Results
Schedule of Deferred Results
(%)
1%
34%
65%
2014 2013 2012
Deferred Results
(BRL million)
-1%
553 560
334
226
1Q11
382
+45%
1Q12
343
210
4Q11
326
57
Development
MCMV 1st Layer projects
Consolidated Deferred Results (BRL'000) 1Q12 4Q11 1Q11 D % D %
(a) (b) (c) (a/b) (a/c)
Consolidated Deferred results (1+2) 552,655 560,382 382,339 -1.4% 44.5%
Deferred revenues 1,434,378 1,482,460 967,047 -3.2% 48.3%
Deferred results - Margin 38.5% 37.8% 39.5% 0.7 p.p. -1.0 p.p.
Deferred results - Development (1) 342,617 334,100 325,687 2.5% 5.2%
Deferred revenues 815,321 775,531 762,873 5.1% 6.9%
Deferred results - Margin 42.0% 43.1% 42.7% -1.1 p.p. -0.7 p.p.
Deferred results - MCMV 1st Layer projects (2) 210,038 226,282 56,652 -7.2% 270.8%
Deferred revenues 619,058 706,928 204,174 -12.4% 203.2%
Deferred results - Margin 33.9% 32.0% 27.7% 1.9 p.p. 6.2 p.p.
20
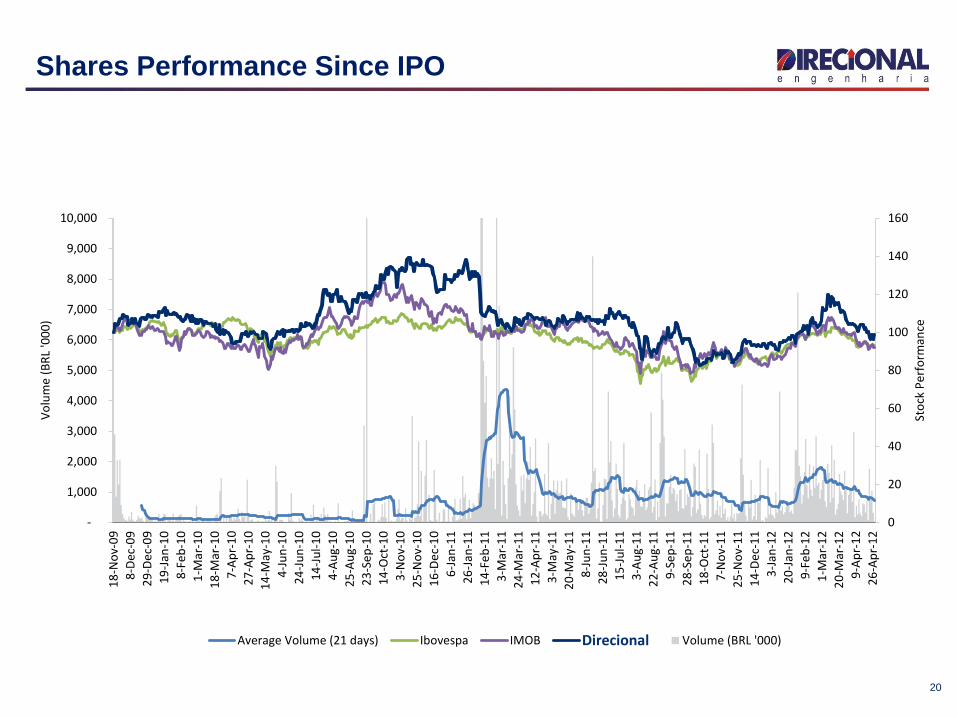
Shares Performance Since IPO
0
20
40
60
80
100
120
140
160
-
1,000
2,000
3,000
4,000
5,000
6,000
7,000
8,000
9,000
10,000
19
-no
v-0
9
9-d
ez-0
9
30
-dez
-09
20
-jan
-10
9-f
ev-
10
2-m
ar-1
0
19
-mar
-10
8-a
br-
10
28
-ab
r-1
0
17
-mai
-10
7-j
un
-10
25
-ju
n-1
0
15
-ju
l-1
0
5-a
go-1
0
27
-ago
-10
24
-set
-10
15
-ou
t-1
0
4-n
ov-
10
26
-no
v-1
0
17
-dez
-10
7-j
an-1
1
27
-jan
-11
15
-fe
v-1
1
4-m
ar-1
1
25
-mar
-11
13
-ab
r-1
1
4-m
ai-1
1
23
-mai
-11
9-j
un
-11
29
-ju
n-1
1
18
-ju
l-1
1
4-a
go-1
1
23
-ago
-11
12
-set
-11
29
-set
-11
19
-ou
t-1
1
8-n
ov-
11
28
-no
v-1
1
15
-dez
-11
4-j
an-1
2
23
-jan
-12
10
-fe
v-1
2
2-m
ar-1
2
3/2
1/2
01
2
4/1
0/2
01
2
4/2
7/2
01
2
Pre
ço d
a A
ção
Vo
lum
e (
R$
mil)
Volume (BRL '000)
0
20
40
60
80
100
120
140
160
-
1,000
2,000
3,000
4,000
5,000
6,000
7,000
8,000
9,000
10,000
18
-No
v-0
9
8-D
ec-0
9
29
-De
c-0
9
19
-Jan
-10
8-F
eb
-10
1-M
ar-1
0
18
-Mar
-10
7-A
pr-
10
27
-Ap
r-1
0
14
-May
-10
4-J
un
-10
24
-Ju
n-1
0
14
-Ju
l-1
0
4-A
ug-
10
25
-Au
g-1
0
23
-Se
p-1
0
14
-Oct
-10
3-N
ov-
10
25
-No
v-1
0
16
-De
c-1
0
6-J
an-1
1
26
-Jan
-11
14
-Fe
b-1
1
3-M
ar-1
1
24
-Mar
-11
12
-Ap
r-1
1
3-M
ay-1
1
20
-May
-11
8-J
un
-11
28
-Ju
n-1
1
15
-Ju
l-1
1
3-A
ug-
11
22
-Au
g-1
1
9-S
ep
-11
28
-Se
p-1
1
18
-Oct
-11
7-N
ov-
11
25
-No
v-1
1
14
-De
c-1
1
3-J
an-1
2
20
-Jan
-12
9-F
eb
-12
1-M
ar-1
2
20
-Mar
-12
9-A
pr-
12
26
-Ap
r-1
2
Sto
ck P
erfo
rman
ce
Vo
lum
e (B
RL
'00
0)
Average Volume (21 days) Ibovespa IMOB Direcional
21
Disclosure
This presentation contains certain forward-looking statements concerning the business prospects,
projections of operating and financial results and growth potential of the Company, which are based on
management’s current expectations and estimates of the future performance of the Company. Although the
Company believes such forward-looking statements are based on reasonable assumptions, it can give no
assurance that its expectations will be achieved. Expectations and estimates that are based on the future
prospects of the Company are highly dependent upon market behavior, Brazil’s political and economic
situation, existing and future regulations of the industry and international markets and, therefore, are
subject to changes outside the Company’s and management’s control. The Company undertakes no
obligation to update any information contained herein or to revise any forward-looking statement as a result
of new information, future events or other information.

22
Contacts
Carlos Wollenweber CFO | IR Officer
Paulo Sousa IR Analyst
www.direcional.com.b/ri
(55 31) 3214-6200
(55 31) 3214-6450
Recommended