11
Exceptional Event Case Studies Clark County, Nevada
WESTAR-EPA Meeting
San Francisco, CA
February 25, 2009

22
Outline

33
• June 29th and 30th, 2005 Clark County was surrounded by wildfires.
• NE Clark County, NV
• SE Washington County, UT
• Northwestern and Central AZ
• Southern CA
• Highest O3 concentrations in Clark County in 25 years
• Typical summertime O3 season of May 1 to September 30
Wildfire Event WILDFIRE EFFECTS: Blazes! It's a stew out there
44
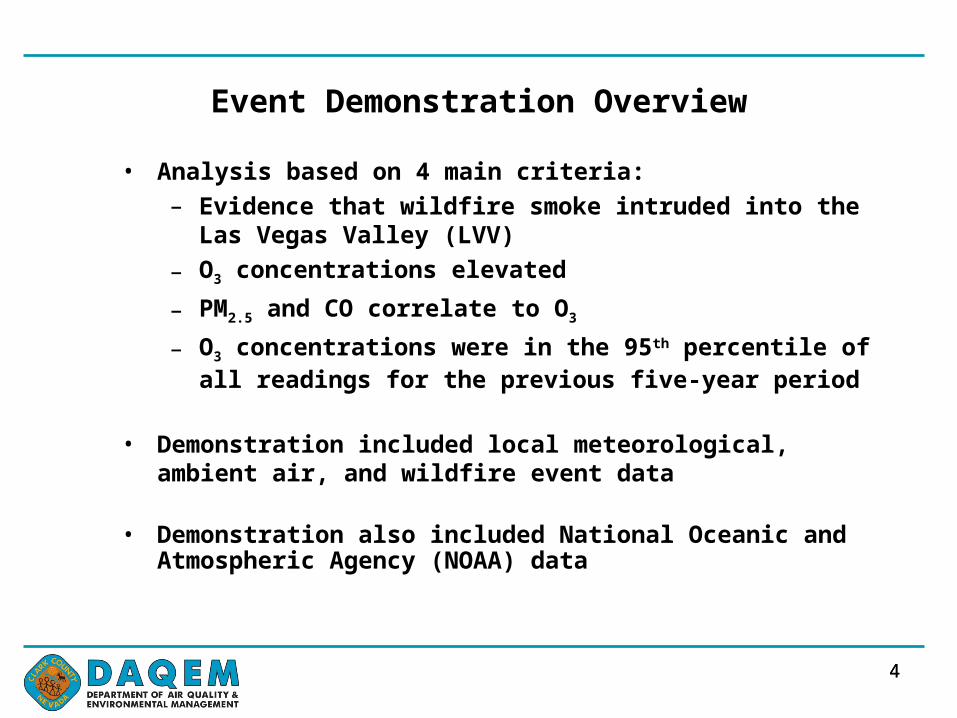
• Analysis based on 4 main criteria:
– Evidence that wildfire smoke intruded into the Las Vegas Valley (LVV)
– O3 concentrations elevated
– PM2.5 and CO correlate to O3
– O3 concentrations were in the 95th percentile of all readings for the previous five-year period
• Demonstration included local meteorological, ambient air, and wildfire event data
• Demonstration also included National Oceanic and Atmospheric Agency (NOAA) data
Event Demonstration Overview

55
Event Demonstration ElementsClark County Monitoring Network

66
Event Demonstration ElementsClark County Monitoring Network

77
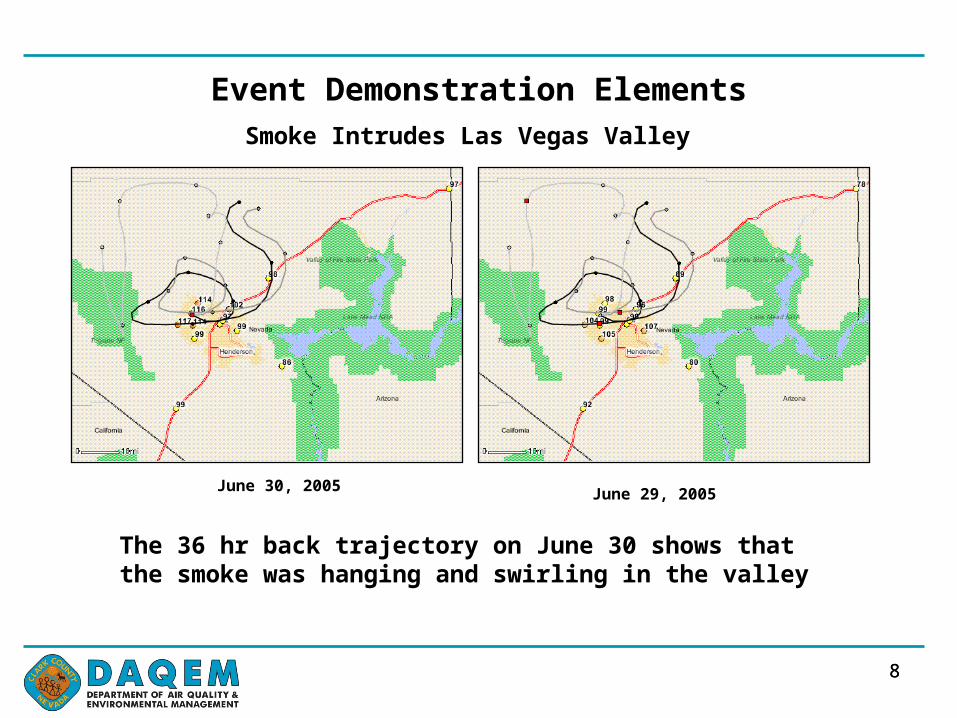
Event Demonstration ElementsSmoke Intrudes Las Vegas Valley
June 29, 2005 June 30, 2005
The Las Vegas Valley was surrounded by wildfires, the smoke impact was almost simultaneous, there was a huge volume of smoke
88
Event Demonstration ElementsSmoke Intrudes Las Vegas Valley
June 29, 2005
The 36 hr back trajectory on June 30 shows that the smoke was hanging and swirling in the valley
June 30, 2005

99
Event Demonstration Elements
O3 concentrations at all stations
Station Name Rank and Date of Reading 1st High Date 2nd High Date 3rd High Date 4th High Date
S.E. Valley 0.087 6/30/05 0.086 6/29/05 0.080 7/17/05 0.077 7/8/05 E. Craig Road 0.095 6/30/05 0.092 6/29/05 0.083 7/16/05 0.083 6/12/05 Apex 0.098 6/30/05 0.095 6/29/05 0.079 7/16/05 0.078 7/3/05 Mesquite 0.092 6/30/05 0.082 6/29/05 0.075 6/1/05 0.072 6/2/05 Paul Meyer 0.100 6/30/05 0.096 6/29/05 0.080 6/12/05 0.080 6/13/05 Walter Johnson 0.101 6/30/05 0.095 6/29/05 0.089 7/18/05 0.088 6/12/05 Lone Mountain 0.105 6/30/05 0.097 6/29/05 0.095 7/18/05 0.089 6/12/05 Palo Verde 0.101 6/30/05 0.096 6/29/05 0.088 6/12/05 0.088 7/18/05 Joe Neal 0.105 6/30/05 0.099 6/29/05 0.091 7/18/05 0.087 7/3/05 Winterwood 0.100 6/29/05 0.094 6/30/05 0.079 7/17/05 0.079 7/3/05 Boulder City 0.084 6/29/05 0.083 6/30/05 0.079 7/17/05 0.078 6/1/05 Jean 0.092 6/30/05 0.088 6/29/05 0.085 7/2/05 0.083 7/8/05 J.D. Smith 0.098 6/29/05 0.095 6/30/05 0.087 7/18/05 0.082 7/16/05 = Wildfire Impact Day
O3 concentrations on the fire days was 9 to 20 ppb higher than on non-fire days

1010
Event Demonstration Elements
O3 concentrations at all stations
Station Name Rank and Date of Reading 1st High Date 2nd High Date 3rd High Date 4th High Date
S.E. Valley 0.087 6/30/05 0.086 6/29/05 0.080 7/17/05 0.077 7/8/05 E. Craig Road 0.095 6/30/05 0.092 6/29/05 0.083 7/16/05 0.083 6/12/05 Apex 0.098 6/30/05 0.095 6/29/05 0.079 7/16/05 0.078 7/3/05 Mesquite 0.092 6/30/05 0.082 6/29/05 0.075 6/1/05 0.072 6/2/05 Paul Meyer 0.100 6/30/05 0.096 6/29/05 0.080 6/12/05 0.080 6/13/05 Walter Johnson 0.101 6/30/05 0.095 6/29/05 0.089 7/18/05 0.088 6/12/05 Lone Mountain 0.105 6/30/05 0.097 6/29/05 0.095 7/18/05 0.089 6/12/05 Palo Verde 0.101 6/30/05 0.096 6/29/05 0.088 6/12/05 0.088 7/18/05 Joe Neal 0.105 6/30/05 0.099 6/29/05 0.091 7/18/05 0.087 7/3/05 Winterwood 0.100 6/29/05 0.094 6/30/05 0.079 7/17/05 0.079 7/3/05 Boulder City 0.084 6/29/05 0.083 6/30/05 0.079 7/17/05 0.078 6/1/05 Jean 0.092 6/30/05 0.088 6/29/05 0.085 7/2/05 0.083 7/8/05 J.D. Smith 0.098 6/29/05 0.095 6/30/05 0.087 7/18/05 0.082 7/16/05 = Wildfire Impact Day
1111
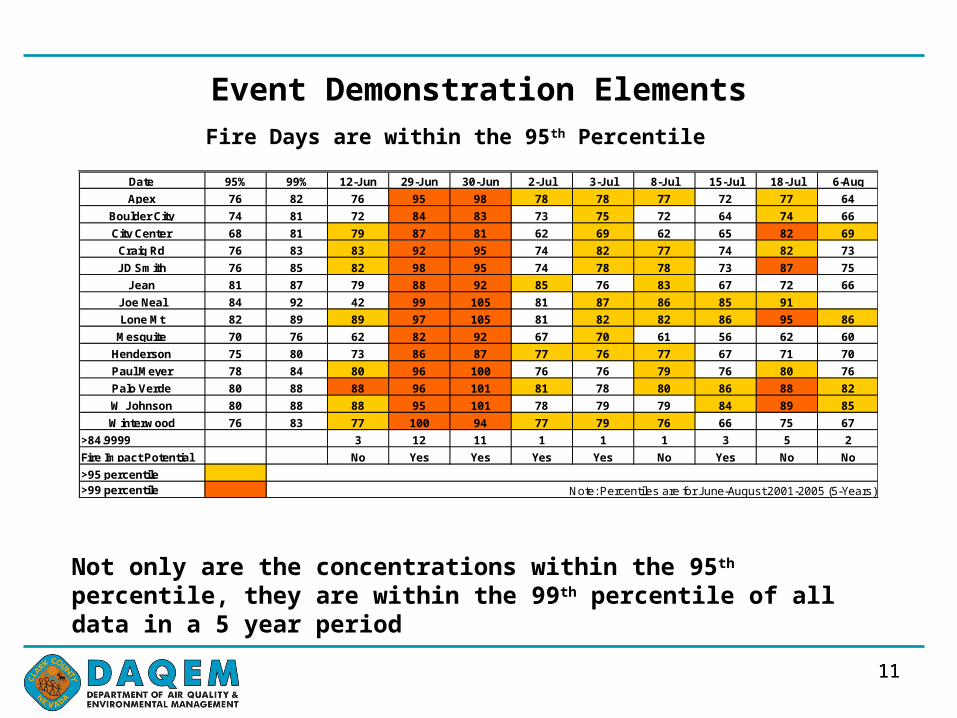
Event Demonstration ElementsFire Days are within the 95th Percentile
Not only are the concentrations within the 95th percentile, they are within the 99th percentile of all data in a 5 year period
Date 95% 99% 12-Jun 29-Jun 30-Jun 2-Jul 3-Jul 8-Jul 15-Jul 18-Jul 6-Aug
Apex 76 82 76 95 98 78 78 77 72 77 64
Boulder City 74 81 72 84 83 73 75 72 64 74 66
City Center 68 81 79 87 81 62 69 62 65 82 69
Craig Rd 76 83 83 92 95 74 82 77 74 82 73
JD Smith 76 85 82 98 95 74 78 78 73 87 75
Jean 81 87 79 88 92 85 76 83 67 72 66
Joe Neal 84 92 42 99 105 81 87 86 85 91
Lone Mt 82 89 89 97 105 81 82 82 86 95 86
Mesquite 70 76 62 82 92 67 70 61 56 62 60
Henderson 75 80 73 86 87 77 76 77 67 71 70
Paul Meyer 78 84 80 96 100 76 76 79 76 80 76
Palo Verde 80 88 88 96 101 81 78 80 86 88 82
W Johnson 80 88 88 95 101 78 79 79 84 89 85
Winterwood 76 83 77 100 94 77 79 76 66 75 67
>84.9999 3 12 11 1 1 1 3 5 2
Fire Impact Potential No Yes Yes Yes Yes No Yes No No
>95 percentile>99 percentile Note: Percentiles are for June-August 2001-2005 (5-Years)

1212
Event Demonstration ElementsAQI and Weather Data
Date Ozone
AQI PM2.5 AQI
CO AQI
Max. Temp °F
Max. Humidity
%
Avg. Wind Speed mph
Max Wind Speed mph
6/27/05 51 34 9 102 14 10 20 6/28/05 61 40 11 98 17 10 22 6/29/05 140 89 25 100 18 6 16 6/30/05 151 101 23 106 19 5 14 7/1/05 90 59 11 109 16 6 18 7/2/05 101 47 8 108 15 10 21
Weather vs Concentrations
0102030405060708090
100110120130140150160
6/27/05 6/28/05 6/29/05 6/30/05 7/1/05 7/2/05
Date
Val
ue
Ozone AQI
PM2.5 AQI
CO AQI
Max. Temp °F
Max. Humidity %
Avg. Wind Speed MPHMax Wind Speed MPH

1313
Event Demonstration Elements
Correlation between O3, CO and PM2.5
0
1020
30
40
5060
70
80
90100
110
120
130140
150
160
6/27/05 6/28/05 6/29/05 6/30/05 7/1/05 7/2/05
Date
AQ
I Va
lue Ozone
PM 2.5
CO

1414
DAQEM was convinced all the requirements described in the EER were met:
– Evidence that smoke intruded the LVV
– Tables and charts show the relationship between PM2.5, CO and O3
– Weather had little influence on the concentrations
– AQI for O3, PM2.5 and CO track uniformly and were elevated proportionately
– Clark County took steps to protect public health
– Concentrations were in the 99th percentile of all readings for the previous five-year period
DAQEM Conclusions

1515
Region IX Response to Demonstration
• Documentation failed to show that Clark County was impacted by smoke at the surface level
• The measured O3 values were not outside of the normal magnitude seen in the county
• Documentation failed to show unusually high levels of PM2.5 and CO
• No data was provided which characterizes the fire events relative to specific stations
• Failed to prove that high concentrations of O3 were found in forest fire plumes that were transported long distances

1616
Region IX Response to Demonstration
Region IX did not concur with our findings and flagging of the measurements as exceptional because DAQEM failed to provide weight of evidence to support the “but for” argument
Region IX made several suggestions regarding weight of evidence elements:
measure VOC concentrations;measure levoglucosan concentrations;measure formaldehyde concentrations;develop a regression model…

1717
What is next?
Ozone Characterization Study - Analyzed weather, transport and local ozone production trends for 1999 – 2003
Clark County Regional Ozone & Precursor Study (CCROPS) – Conducted saturation sampling during 2005 summer season to better characterize the role of local versus transported ozone and ozone precursors
Southwest Desert/ Las Vegas Ozone Transport Study (SLOTS) - Assessed the role of pollutant transport into southern Nevada
Characterization of Wildfire Smoke Impacts on Ozone Concentrations - Study the impacts and relationships of wildfire smoke on O3 concentrations in Clark County
Develop Regression Model – Prediction of daily O3 concentrations
Summer 2009 – Addition enhanced monitoring for O3, PM2.5 and levoglucosan during wildfire events during the 2009 ozone season

1818
EPA Headquarters needs to define the requirements for event demonstrations
Region IX needs to define a set of tools to use to evaluate packages
Region IX needs to work with state/local agencies to develop what they want included in the packages and not make determinations ad hoc
EPA needs to be reasonable in their requests
What is next?

1919
Questions and Discussion

20
Clark County High Wind Exceptional Events Program
• Program developed as part of the Natural Events Action Plan
• Program has been very successful for Clark County
• Proactive approach to protecting public health
• Proactive approach to minimizing high wind impacts on air quality

21
High Wind Exceptional Event Demonstrations
• Exceptional event wind speed thresholds
• Meteorological forecasting program
• Proactive public notification program
• BACM implemented for all sources
• Proactive enforcement prior to and during the event
• Resources are available to stabilize sources
• Compliance and enforcement activity documentation
22
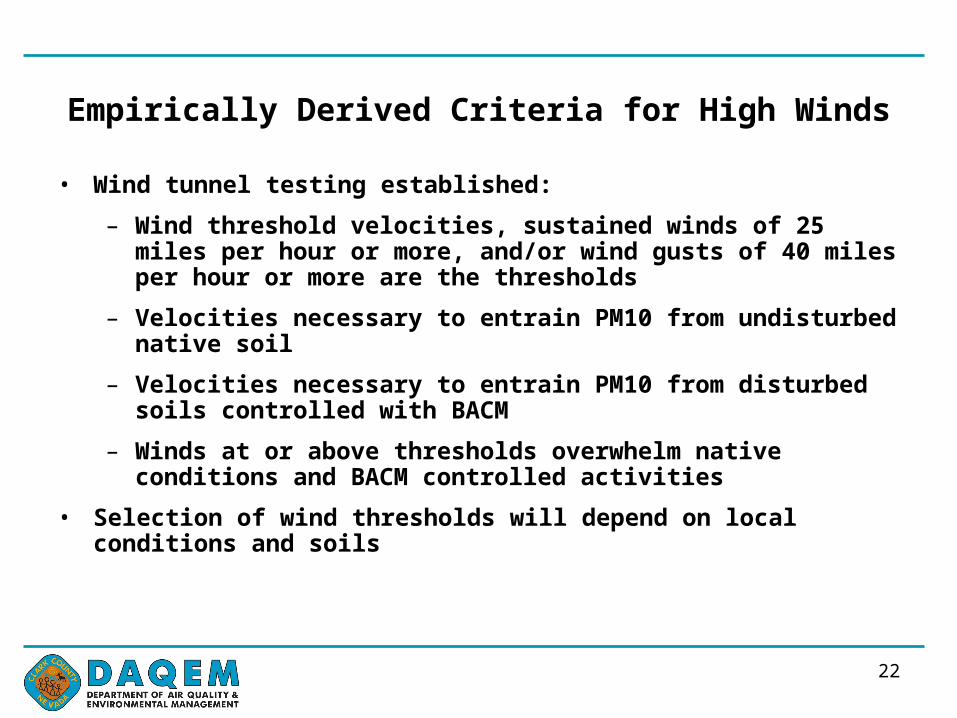
Empirically Derived Criteria for High Winds • Wind tunnel testing established:
– Wind threshold velocities, sustained winds of 25 miles per hour or more, and/or wind gusts of 40 miles per hour or more are the thresholds
– Velocities necessary to entrain PM10 from undisturbed native soil
– Velocities necessary to entrain PM10 from disturbed soils controlled with BACM
– Winds at or above thresholds overwhelm native conditions and BACM controlled activities
• Selection of wind thresholds will depend on local conditions and soils

23
Example High Wind EventPM10 Concentration and Max Wind Gust
Monitoring Site Location & AIRS Code
Date of High Wind Event
Measured QA/QC
Concentration (µg/m3)
Wind Dir.
Max. Wind Gust (mph)
East Sahara (MC) #320030539 3/13/02 180 SW 47 Joe Neal (JO) #320030075 3/13/02 258 SW 47 JD Smith (JD) #320032001 3/13/02 177 SW 47 East Craig (BS) #320030020 3/13/02 335 SW 47

24
High-Wind Event Activities
• Notifications based on forecasted conditions
• Notifications typically occur 24-36 hours in advance of predicted high winds
• All permit holders receive a fax advisory
• News media, schools, agencies, and interested persons receive email via list server
• This year, DAQEM started using EnviroFlash notifications
Public Notification and Advisory Procedures
25
High-Wind Event Activities
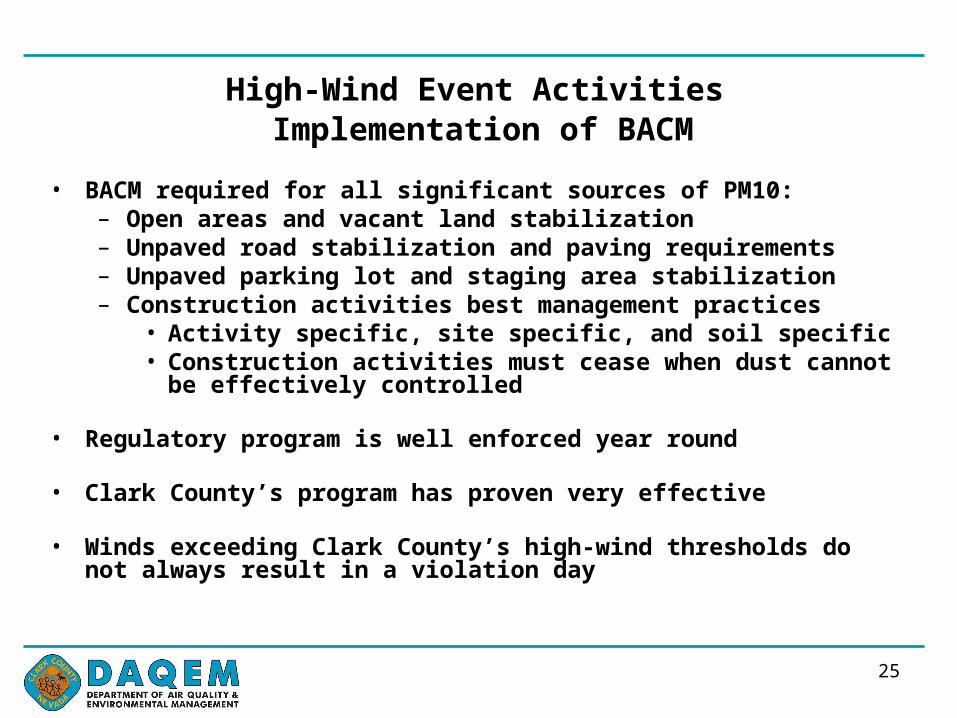
• BACM required for all significant sources of PM10:– Open areas and vacant land stabilization– Unpaved road stabilization and paving requirements– Unpaved parking lot and staging area stabilization– Construction activities best management practices
• Activity specific, site specific, and soil specific• Construction activities must cease when dust cannot be
effectively controlled
• Regulatory program is well enforced year round
• Clark County’s program has proven very effective
• Winds exceeding Clark County’s high-wind thresholds do not always result in a violation day
Implementation of BACM
26
High-Wind Event Activities
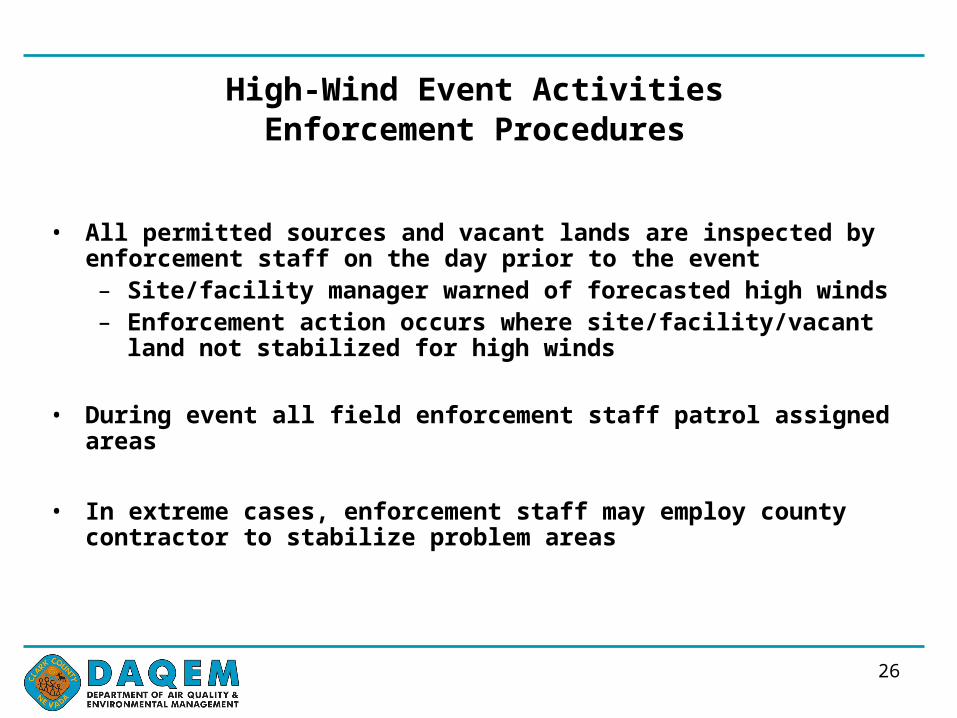
• All permitted sources and vacant lands are inspected by enforcement staff on the day prior to the event– Site/facility manager warned of forecasted high winds– Enforcement action occurs where site/facility/vacant land not
stabilized for high winds
• During event all field enforcement staff patrol assigned areas
• In extreme cases, enforcement staff may employ county contractor to stabilize problem areas
Enforcement Procedures
27
High-Wind Event ActivitiesDemonstration Package Contents
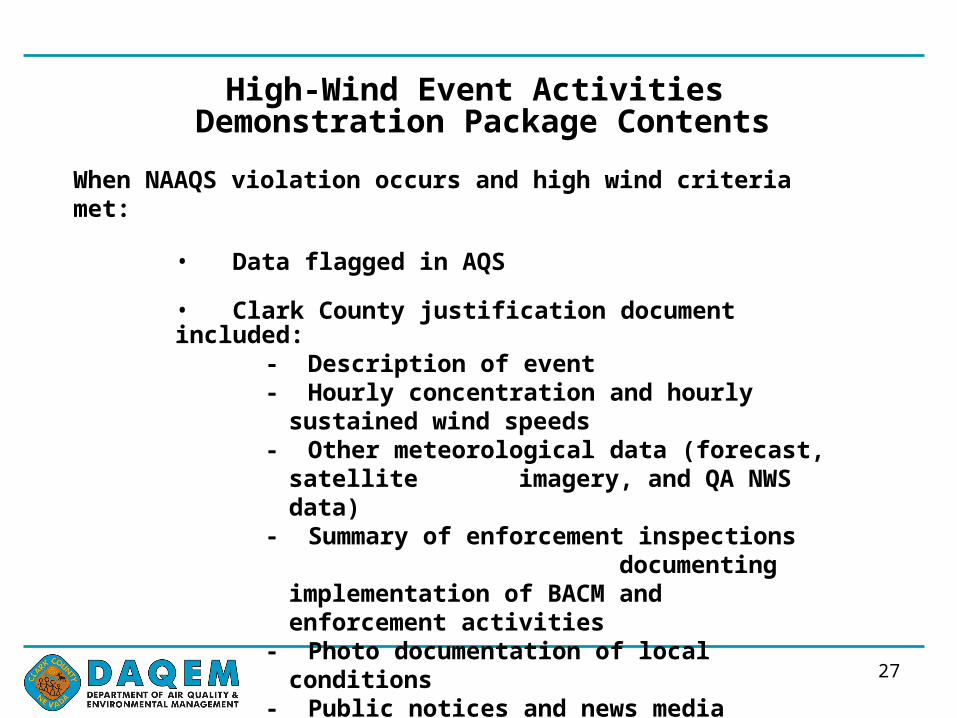
When NAAQS violation occurs and high wind criteria met:
• Data flagged in AQS
• Clark County justification document included:- Description of event- Hourly concentration and hourly sustained wind
speeds - Other meteorological data (forecast, satellite
imagery, and QA NWS data)- Summary of enforcement inspections
documenting implementation of BACM and enforcement activities
- Photo documentation of local conditions- Public notices and news media documentation
EPA concurred with 8 out of 8 DAQEM demonstration packages
28
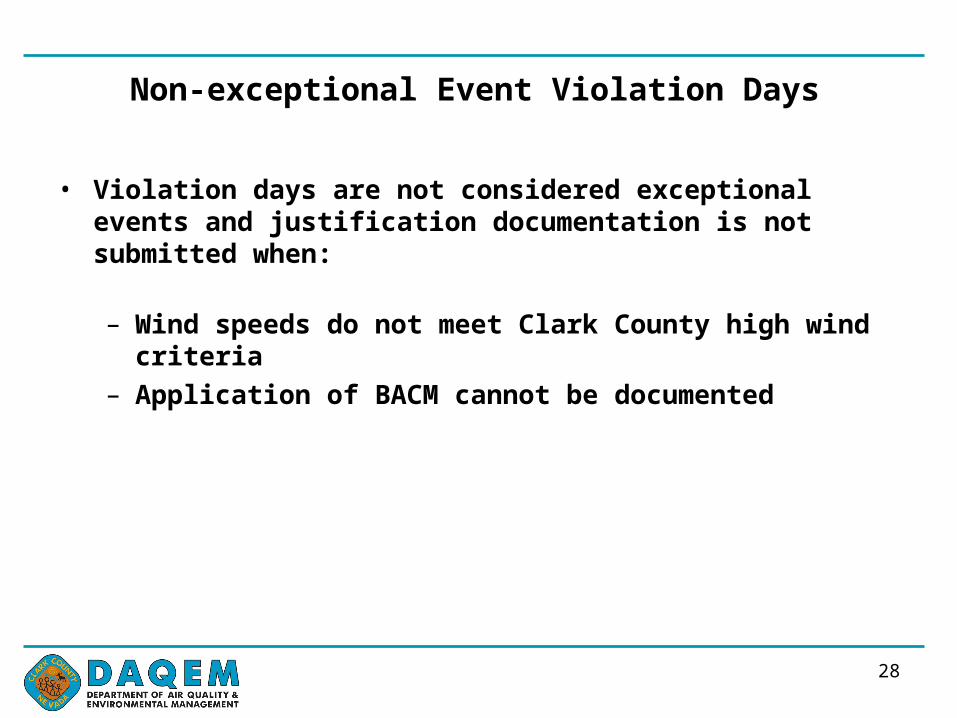
Non-exceptional Event Violation Days
• Violation days are not considered exceptional events and justification documentation is not submitted when:
– Wind speeds do not meet Clark County high wind criteria– Application of BACM cannot be documented

29
Summary of Key Program Elements
• High-wind thresholds are based on local empirical measurements that demonstrate:– Wind speeds overwhelm undisturbed native soils– Wind speeds overwhelm BACM
• BACM must be applied to all significant dust sources
• High wind forecasting
• Proactive public notification program
• Proactive source notification program
• Proactive enforcement and stabilization

30
Where Do We Go From Here?
• Clark County has an effective program that is protective of public health and minimizes high-wind impacts on air quality
• Clark County has two justification packages pendingsubmittal
• Are additional elements required beyond our current program for approval by EPA under the Exceptional Events Rule?
• Consistent guidance is needed to allow states to effectively utilize resources
31
DiscussionWhere Do We Go From Here?
Recommended