wiiw
1
The New Member States in the context of the
European financial and economic crisis:
differentiation and prospects
Michael A Landesmann
Lecture at the University of Finance and Administration, Prague, 25.11.2011

wiiw
2
Topics to be covered
Features of the European economic and financial crisis
The position of ‘Emerging Europe’: GIPSI and CEECs
The ‘growth model’ of the CEECs pre-crisis
The crisis and pitfalls in the ‘growth model’
Differentiation across CEE economies
Prospects and policy lessons

wiiw
3
3
The ‘growth model’ in the NMS prior to the crisis
• In the last two decades the region experimented with unique model
of growth through integration into the EU:
• Key features
- Strong institutional anchoring – a model of ‘unconditional convergence’
- Trade and FDI integration
- Financial integration (downhill capital flows)
- (Labour mobility)
• Made considerable sense in view of initial conditions
- Foster institutional build-up after transition
- Substitute lack of domestic saving by foreign saving
- Make use of wealth of human capital
wiiw
4
4
Pre-crisis growth model, cont’d
Integration boosted capital inflows- low level of physical capital offering higher return on
capital; complementary highly-educated labour force and low level of wages
- EU accession prospect and improvement in the business climate
- low level of domestic credit offering the potential for substantial credit expansion
- Seemingly low exchange rate risk
Rapid productivity growth; up-grading of production and trade structures

wiiw
7
Growth – GDP at constant prices
Average annual growth rates, 2002-2008, in %

wiiw
8
The NMS/CEECs and the build-up to the crisis
Features of the development experiences prior to the crisis
Differentiation across NMS/CEECs:
- Extent of external imbalances
- Private vs. public debt build-up
- De- and re-industrialisation and the build-up of export capacity
- Differences in the sectoral allocation of FDI
wiiw
9
9
CEECs and comparisons with other emerging
economies
CE-5: Czech Republic, Hungary, Poland, Slovakia and Slovenia
BB-5: Bulgaria, Romania (SE-2); Estonia, Latvia, Lithuania (B-3)
WB-6: Albania, Bosnia and Herzegovina, Croatia, Former Yugoslav Republic of Macedonia, Montenegro and Serbia;
EU-Coh: (Ireland), Greece, Portugal, Spain Asia-6: Indonesia, Korea, Malaysia, Philippines, Taiwan and
Thailand Latam-8: Argentina, Brazil, Chile, Columbia, Ecuador,
Mexico, Peru and Uruguay
wiiw
10
10
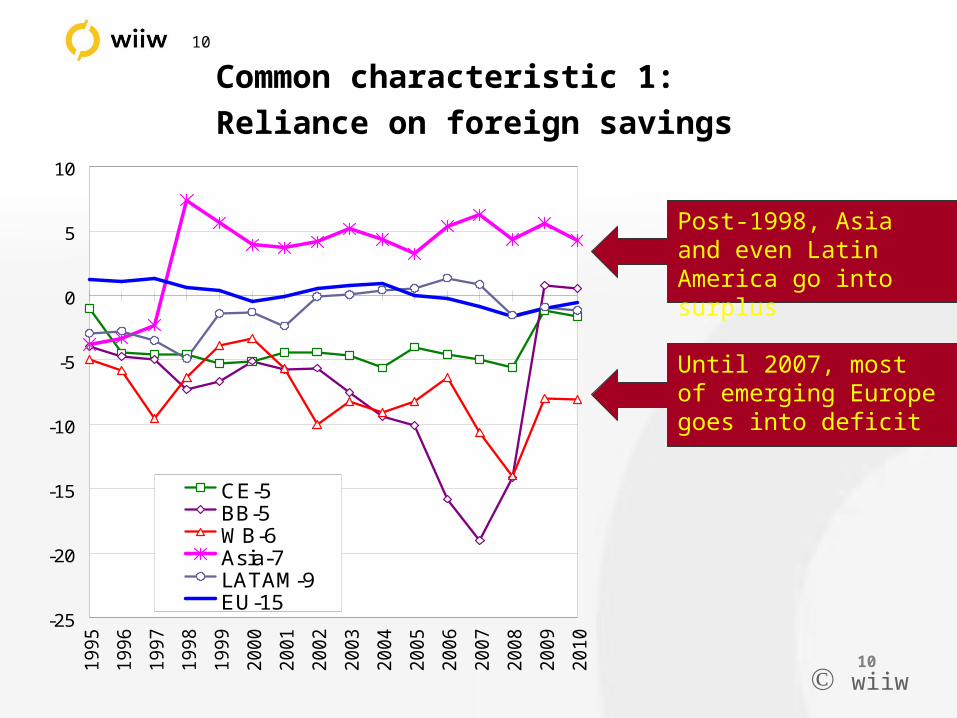
Common characteristic 1:
Reliance on foreign savings
-25
-20
-15
-10
-5
0
5
10
19
95
19
96
19
97
19
98
19
99
20
00
20
01
20
02
20
03
20
04
20
05
20
06
20
07
20
08
20
09
20
10
CE-5BB-5WB-6Asia-7LATAM-9EU-15
CA/GDPPost-1998, Asia and even Latin America go into surplus
Until 2007, most of emerging Europe goes into deficit

wiiw
12
Composition of the current account of the balance of
payments, 1995-2009
Note: ASIA-6 excl. Taiwan.
Source: IMF International Financial Statistics and IMF WEO October 2010.
wiiw
14
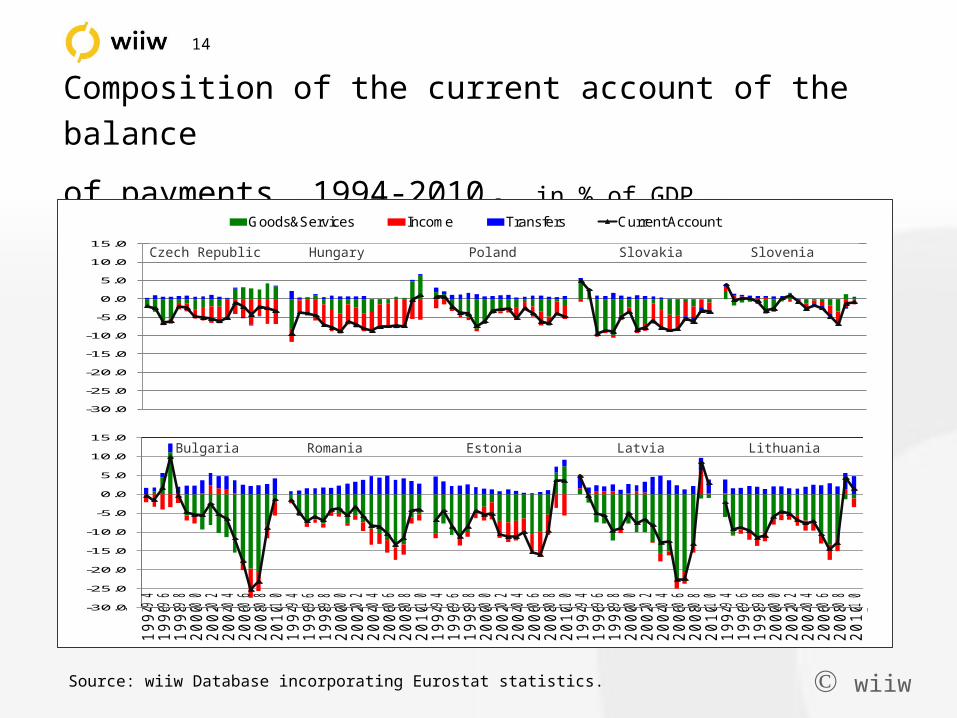
Source: wiiw Database incorporating Eurostat statistics.
Composition of the current account of the balance
of payments, 1994-2010, in % of GDP
-30.0
-25.0
-20.0
-15.0
-10.0
-5.0
0.0
5.0
10.0
15.0
-12.0
-9.0
-6.0
-3.0
0.0
3.0
6.0
9.01
99
41
99
61
99
82
00
02
00
22
00
42
00
62
00
82
01
01
99
41
99
61
99
82
00
02
00
22
00
42
00
62
00
82
01
01
99
41
99
61
99
82
00
02
00
22
00
42
00
62
00
82
01
01
99
41
99
61
99
82
00
02
00
22
00
42
00
62
00
82
01
01
99
41
99
61
99
82
00
02
00
22
00
42
00
62
00
82
01
0
Goods&Services Income Transfers Current Account
Czech Republic Hungary Poland Slovakia Slovenia
-30.0
-25.0
-20.0
-15.0
-10.0
-5.0
0.0
5.0
10.0
15.0
19
94
19
96
19
98
20
00
20
02
20
04
20
06
20
08
20
10
19
94
19
96
19
98
20
00
20
02
20
04
20
06
20
08
20
10
19
94
19
96
19
98
20
00
20
02
20
04
20
06
20
08
20
10
19
94
19
96
19
98
20
00
20
02
20
04
20
06
20
08
20
10
19
94
19
96
19
98
20
00
20
02
20
04
20
06
20
08
20
10
Goods&Services Income Transfers Current Account
Bulgaria Romania Estonia Latvia Lithuania
Czech Republic Hungary Poland Slovakia Slovenia
Bulgaria Romania Estonia Latvia Lithuania
-30.0
-25.0
-20.0
-15.0
-10.0
-5.0
0.0
5.0
10.0
15.0
19
94
19
96
19
98
20
00
20
02
20
04
20
06
20
08
20
10
19
94
19
96
19
98
20
00
20
02
20
04
20
06
20
08
20
10
19
94
19
96
19
98
20
00
20
02
20
04
20
06
20
08
20
10
19
94
19
96
19
98
20
00
20
02
20
04
20
06
20
08
20
10
19
94
19
96
19
98
20
00
20
02
20
04
20
06
20
08
20
10
Goods&Services Income Transfers Current Account
Bulgaria Romania Estonia Latvia Lithuania
wiiw
15
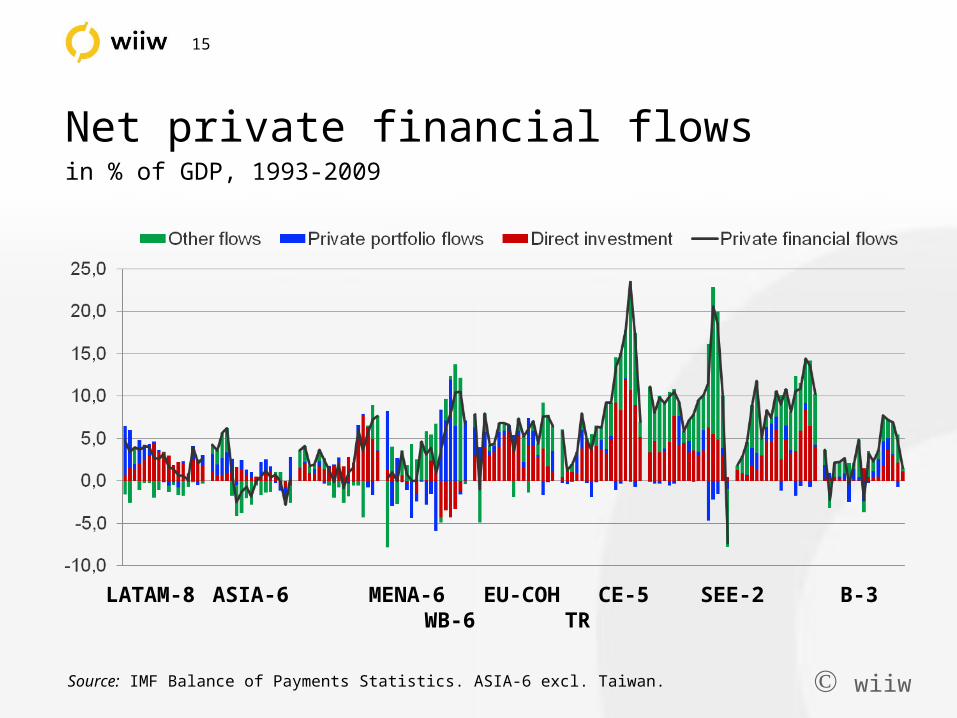
Net private financial flows in % of GDP, 1993-2009
Source: IMF Balance of Payments Statistics. ASIA-6 excl. Taiwan.
LATAM-8 ASIA-6 MENA-6 EU-COH CE-5 SEE-2 B-3 WB-6 TR

wiiw
17
17
Common characteristic 2:
Credit booms
10
100
1000
19
95
19
96
19
97
19
98
19
99
20
00
20
01
20
02
20
03
20
04
20
05
20
06
20
07
20
08
20
09
CE-5BB-5WB-5Asia 7LATAM-9EU-15
Boom in emerging Europe (from very low levels)
Slowdown in Asia
Slowdown in LatAm

wiiw
18
CESEE: GDP growth was well above the interest rate
before the crisis
Nominal interest rate on government debt
and nominal GDP growth (%), 2000-2010
Note: Interest rate = government interest expenditures / previous year gross debt.
-5.0
0.0
5.0
10.0
15.0
20.0
20
00
20
02
20
04
20
06
20
08
20
10
Nominal GDP growth
Nominal interest rate
CESEE
-5.0
0.0
5.0
10.0
15.0
20.0
20
00
20
02
20
04
20
06
20
08
20
10
Nominal GDP growth
Nominal interest rate
OECD (non-CESEE)
wiiw
19
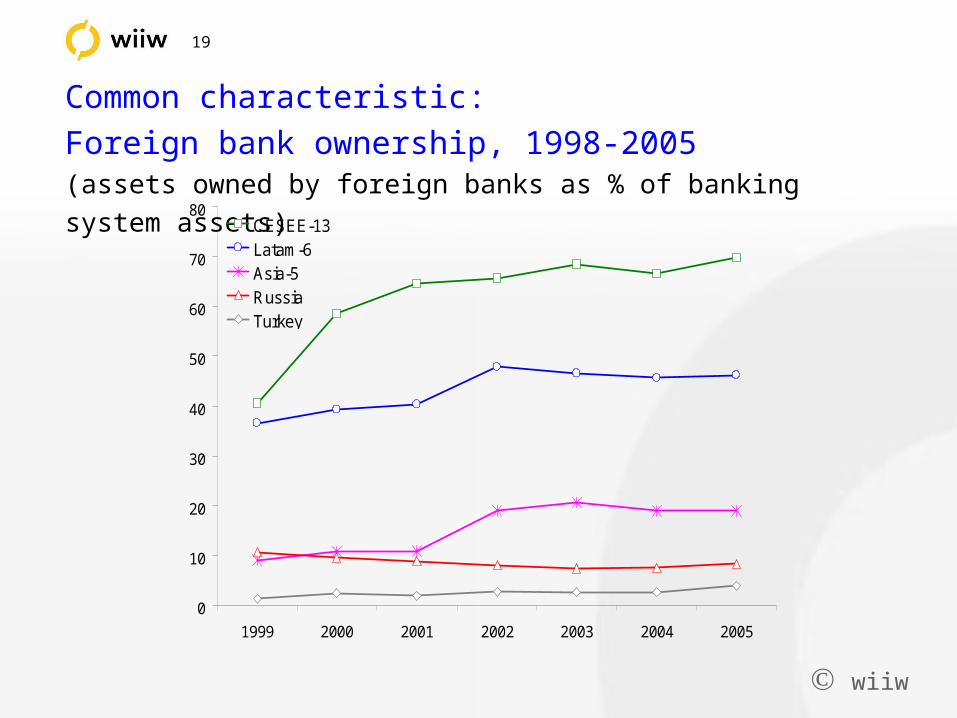
Common characteristic:
Foreign bank ownership, 1998-2005 (assets owned by foreign banks as % of banking system assets)
0
10
20
30
40
50
60
70
80
1999 2000 2001 2002 2003 2004 2005
CESEE-13Latam-6Asia-5RussiaTurkey

wiiw
20 Common characteristic 3:
It’s not mostly public debt
20
10
20
30
40
50
60
70
80
199
5
199
6
199
7
199
8
199
9
200
0
200
1
200
2
200
3
200
4
200
5
200
6
200
7
200
8
200
9
201
0
CE-5BB-5WB-3ASIA-8LATAM-6EU-15
Debt
If anything, more favourable public debt developments until 2008, especially in BB countries
wiiw
21
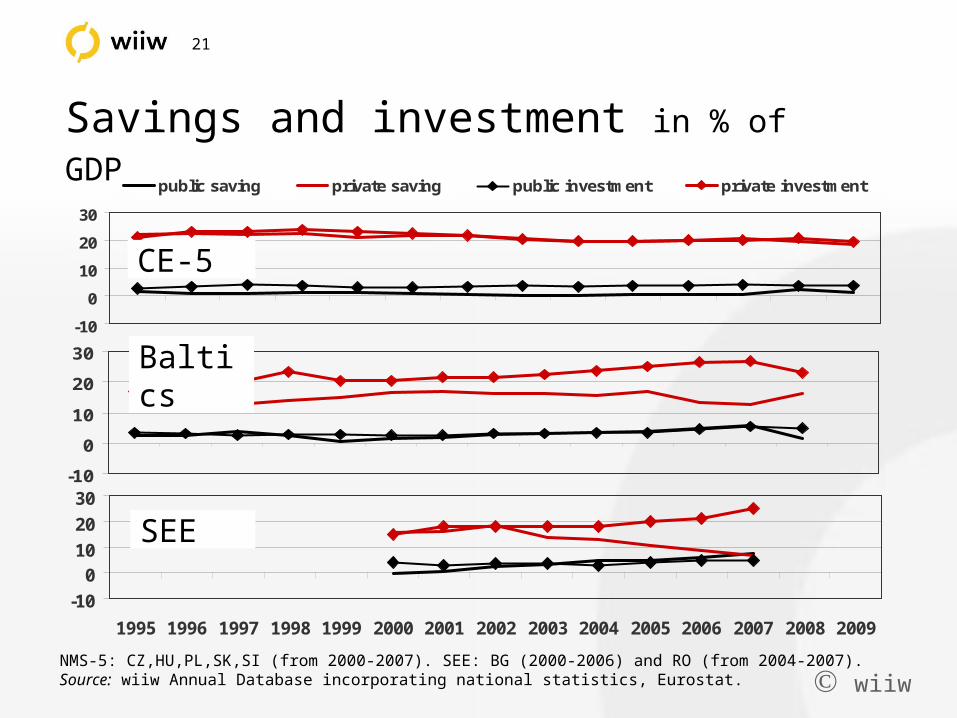
Savings and investment in % of GDP
-10
0
10
20
30
public saving private saving public investment private investment
-10
0
10
20
30
-10
010
20
30
1995 1996 1997 1998 1999 2000 2001 2002 2003 2004 2005 2006 2007 2008 2009
CE-5
Baltics
SEE
NMS-5: CZ,HU,PL,SK,SI (from 2000-2007). SEE: BG (2000-2006) and RO (from 2004-2007). Source: wiiw Annual Database incorporating national statistics, Eurostat.
wiiw
22
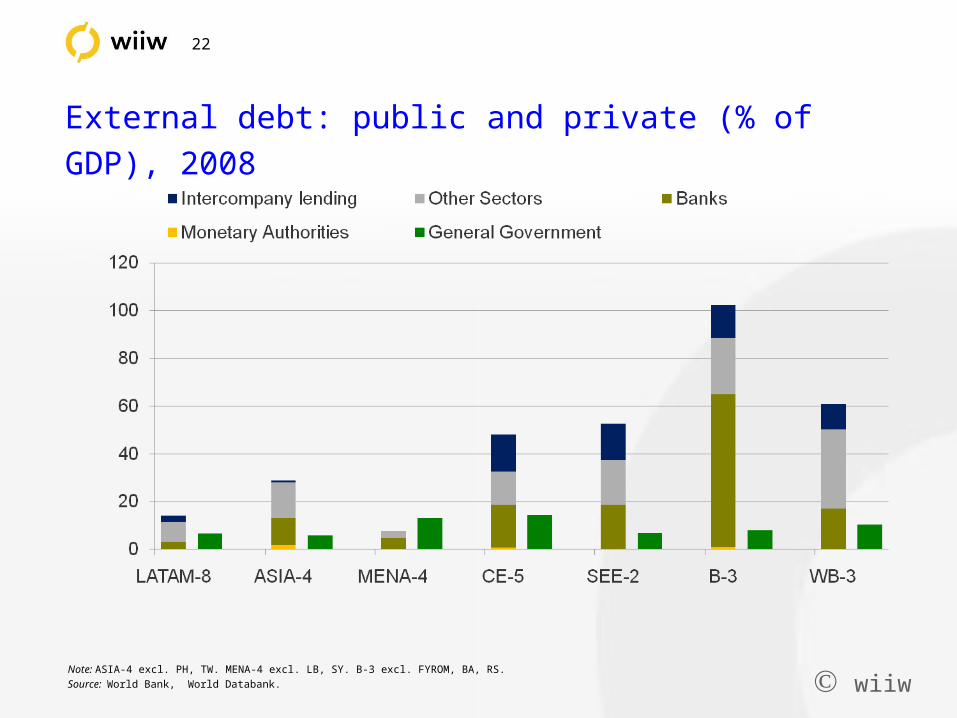
External debt: public and private (% of GDP), 2008
Note: ASIA-4 excl. PH, TW. MENA-4 excl. LB, SY. B-3 excl. FYROM, BA, RS.
Source: World Bank, World Databank.

wiiw
23
Source: Eurostat, IMF.
Gross private and public debt (% of GDP), 2009
wiiw
24
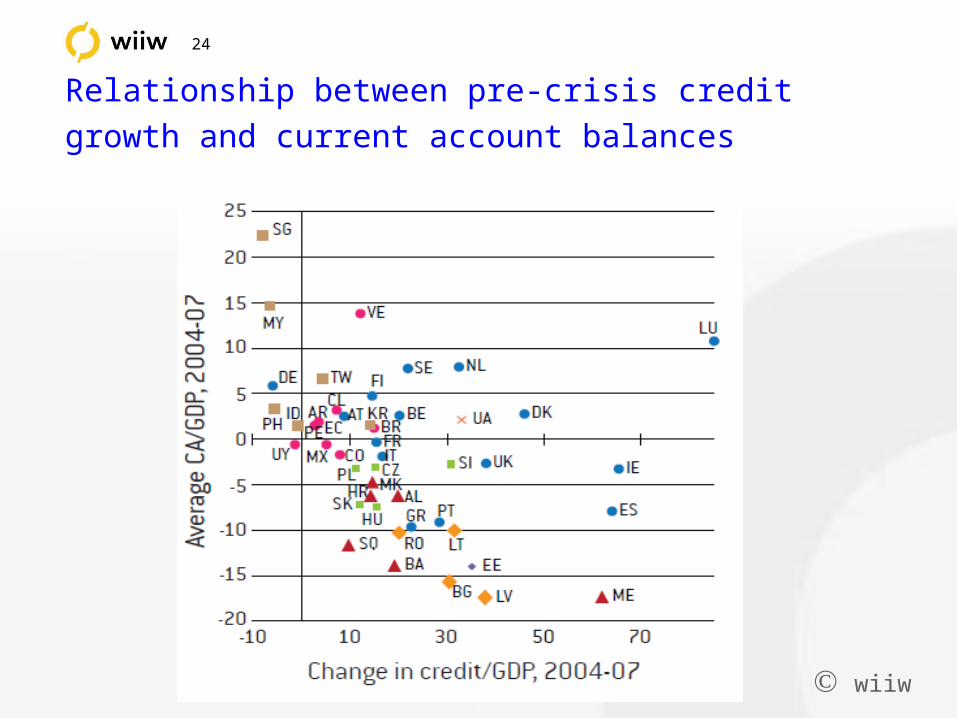
Relationship between pre-crisis credit growth and
current account balances

wiiw
25
25
Differences:
Real exchange rate developments
20
30
40
50
60
70
20 30 40 50 60 70
Rela
tive p
rice l
evel
(perc
en
t)
CE-5
BB-5
WB-5
ASIA-7
LATAM-9
1995
1997
1995
1995
1995
2010
2010
2010
2010
2010
Relative GDP per capita at PPP (percentage points)
Appreciation hands-in-hands with catching-up in Central Europe
Misalignment in the Baltics/Balkans
Stable real X-rate in Asia post crisis
wiiw
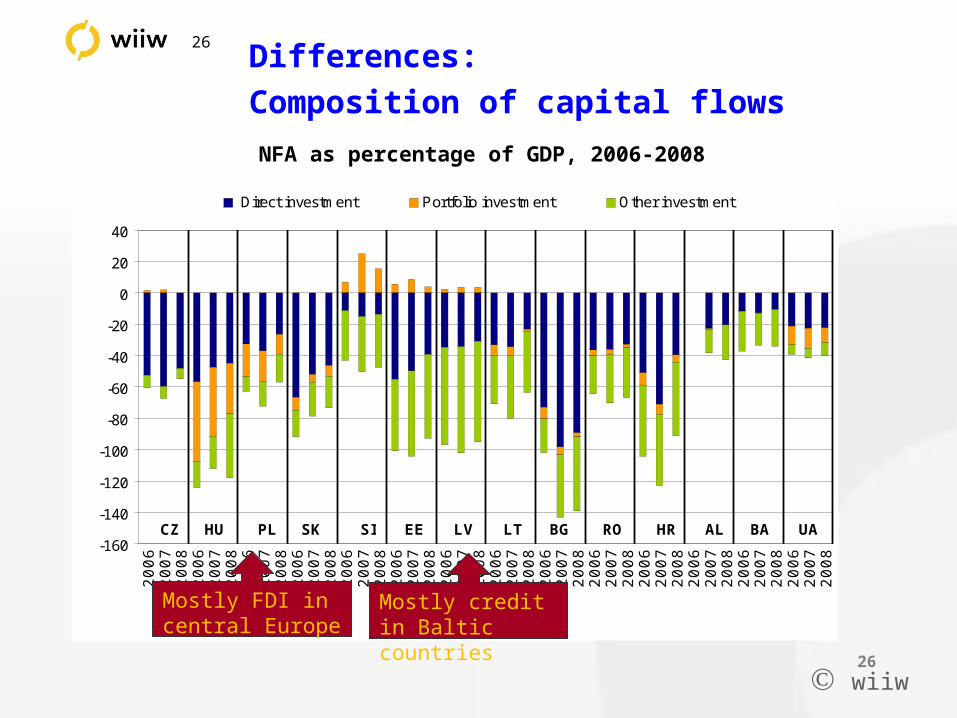
26Differences:
Composition of capital flows
26
-160
-140
-120
-100
-80
-60
-40
-20
0
20
40
20
06
20
07
20
08
20
06
20
07
20
08
20
06
20
07
20
08
20
06
20
07
20
08
20
06
20
07
20
08
20
06
20
07
20
08
20
06
20
07
20
08
20
06
20
07
20
08
20
06
20
07
20
08
20
06
20
07
20
08
20
06
20
07
20
08
20
06
20
07
20
08
20
06
20
07
20
08
20
06
20
07
20
08
Direct investment Portfolio investment Other investment
CZ HU SISKPL BAALHRROBGLTLVEE UA
Mostly FDI in central Europe
Mostly credit in Baltic countries
NFA as percentage of GDP, 2006-2008

wiiw
27
Summary of pre-crisis growth period and
differentiation amongst the CEECs
CEE region in general had a classic pre-crisis pattern
of catching-up with ‘down-hill’ capital flows; other
emerging economy regions had changed their patterns A lot of differentiation amongst CEECs:
- extent of capital inflows
- nature and composition of capital inflows
- private and public debt build-up
- real exchange rate (mis)alignments
wiiw
28
Differentiation amongst the CEECs:
further relevant features
Prior periods of de- and re-industrialisation Exchange rate regimes Distortions tradable/non-tradable sectors Structure and up-grading of export sector

wiiw
29
Industrial production, cumulative change
wiiw
30
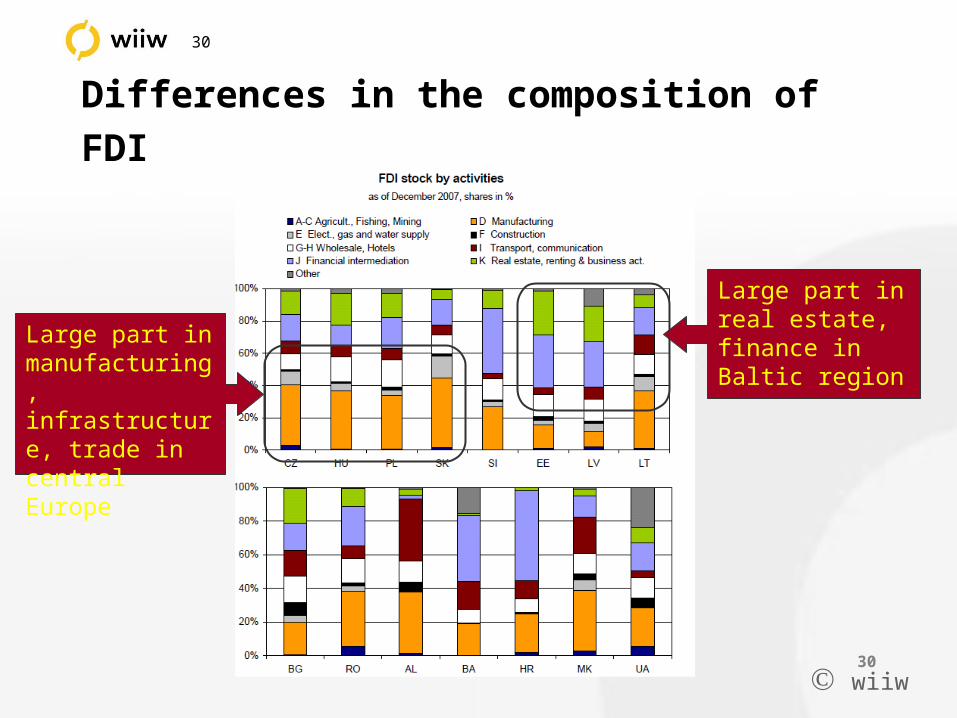
Differences in the composition of FDI
30
Large part in manufacturing, infrastructure, trade in central Europe
Large part in real estate, finance in Baltic region

wiiw
31
Real lending NB/ECB interest rates, 2008-2010 CPI-deflated, in % p.a.
-10
-8
-6
-4
-2
0
2
4
6
8
Jan-
08
Apr
-08
Jul-0
8
Oct
-08
Jan-
09
Apr
-09
Jul-0
9
Oct
-09
Jan-
10
HU PL RO
-10
-8
-6
-4
-2
0
2
4
6
8
Jan-
08
Apr
-08
Jul-0
8
Oct
-08
Jan-
09
Apr
-09
Jul-0
9
Oct
-09
Jan-
10
SK BG EE LV LT
Note: For Estonia: 1-month interbank lending rate (Talibor); for Lithuania: 1-month interbank lending rate (Vilibor).
Source: Eurostat.
Flexible ER Fixed ER

wiiw
32
Structural features: the role of exchange rate regimes
‘Fixers’ and ‘floaters’ amongst the CESEEs
CESEE float CESEE fix
Credit/GDP, change from 2004 to 2008 (percentage points) 20.5 32.8
Real interest rate average, 2005-2007 1.6 -1.6
Current account balance/GDP, 2007 (%) -6.6 -11.8
Gross external debt, 2009 (% of GDP) 78.8 95.6
GDP-growth, 2008-2010 1.18 -1.78
FDI to finance and real estate sectors, 2007 (per cent of total FDI stock) 26.5 40.2
Change in unemployment rate from 2007 to 2010 (percentage points) 1.5 3.9
Source: wiiw calculations.
wiiw
33
The crisis and its aftermath
Sudden stops in net capital flows Turn-around in current accounts:
- differences in GDP declines
- sharp credit contraction
- differences between fix-ex and flex-ex countries
wiiw
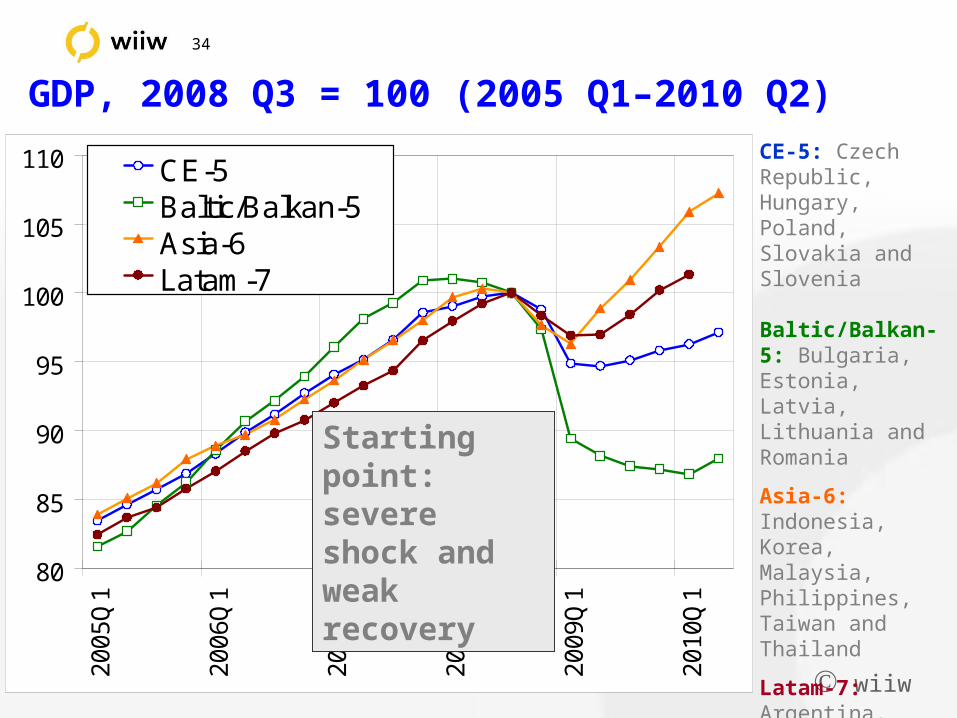
34
CE-5: Czech Republic, Hungary, Poland, Slovakia and Slovenia
Baltic/Balkan-5: Bulgaria, Estonia, Latvia, Lithuania and Romania
Asia-6: Indonesia, Korea, Malaysia, Philippines, Taiwan and Thailand
Latam-7: Argentina, Brazil, Chile, Columbia, Ecuador, Mexico and Uruguay
80
85
90
95
100
105
110
2005
Q1
2006
Q1
2007
Q1
2008
Q1
2009
Q1
2010
Q1
CE-5Baltic/Balkan-5Asia-6Latam-7
Starting point: severe shock and weak recovery
GDP, 2008 Q3 = 100 (2005 Q1–2010 Q2)

wiiw
36
Source: wiiw Database and Eurostat
Net private financial flows
in % of GDP, 1995-2010
Folie 55
-20.0
-10.0
0.0
10.0
20.0
30.0
40.0
50.0
19
95
20
00
20
05
20
10
19
95
20
00
20
05
20
10
19
95
20
00
20
05
20
10
19
95
20
00
20
05
20
10
19
95
20
00
20
05
20
10
Direct investment Private portfolio flows Other flows Private financial flows
Czech Republic Hungary Poland Slovakia SloveniaCzech Republic Hungary Poland Slovakia Slovenia
-20.0
-10.0
0.0
10.0
20.0
30.0
40.0
50.0
19
95
20
00
20
05
20
10
19
95
20
00
20
05
20
10
19
95
20
00
20
05
20
10
19
95
20
00
20
05
20
10
19
95
20
00
20
05
20
10
Direct investment Private portfolio flows Other flows Private financial flows
Bulgaria Romania Estonia Latvia LithuaniaBulgaria Romania Estonia Latvia Lithuania
-20.0
-10.0
0.0
10.0
20.0
30.0
40.0
50.01
99
5
20
00
20
05
20
10
19
95
20
00
20
05
20
10
19
95
20
00
20
05
20
10
19
95
20
00
20
05
20
10
19
95
20
00
20
05
20
10
Direct investment Private portfolio flows Other flows Private financial flows
Czech Republic Hungary Poland Slovakia Slovenia
-20.0
-10.0
0.0
10.0
20.0
30.0
40.0
50.0
19
95
20
00
20
05
20
10
19
95
20
00
20
05
20
10
19
95
20
00
20
05
20
10
19
95
20
00
20
05
20
10
19
95
20
00
20
05
20
10
Direct investment Private portfolio flows Other flows Private financial flows
Czech Republic Hungary Poland Slovakia Slovenia

wiiw
40
Pre-crisis credit growth and GDP growth in 2009
wiiw
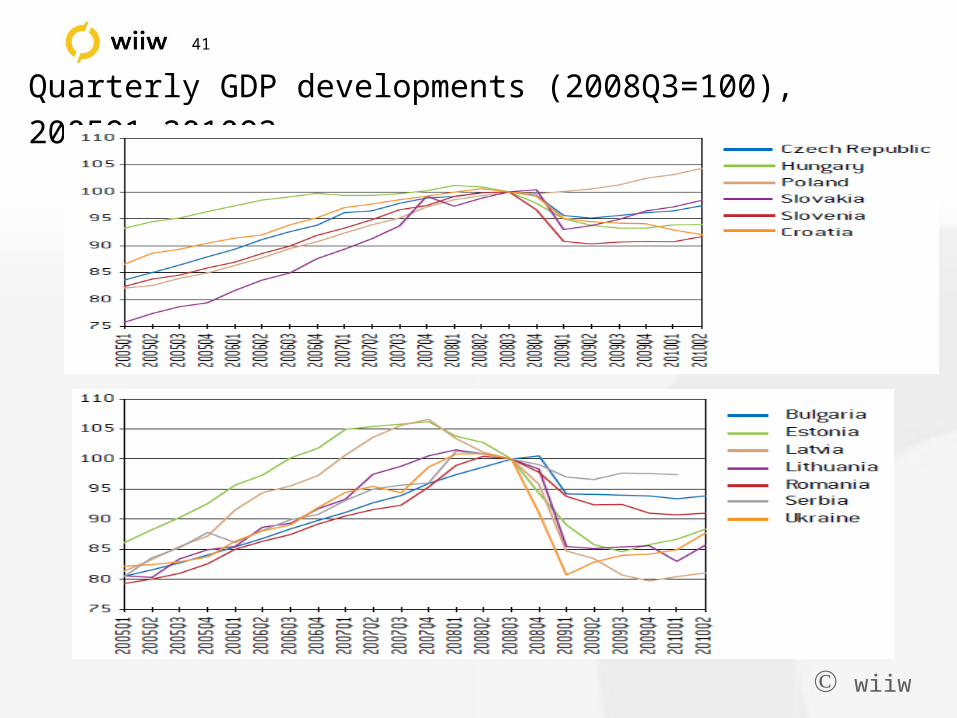
41
Quarterly GDP developments (2008Q3=100), 2005Q1-2010Q2
wiiw
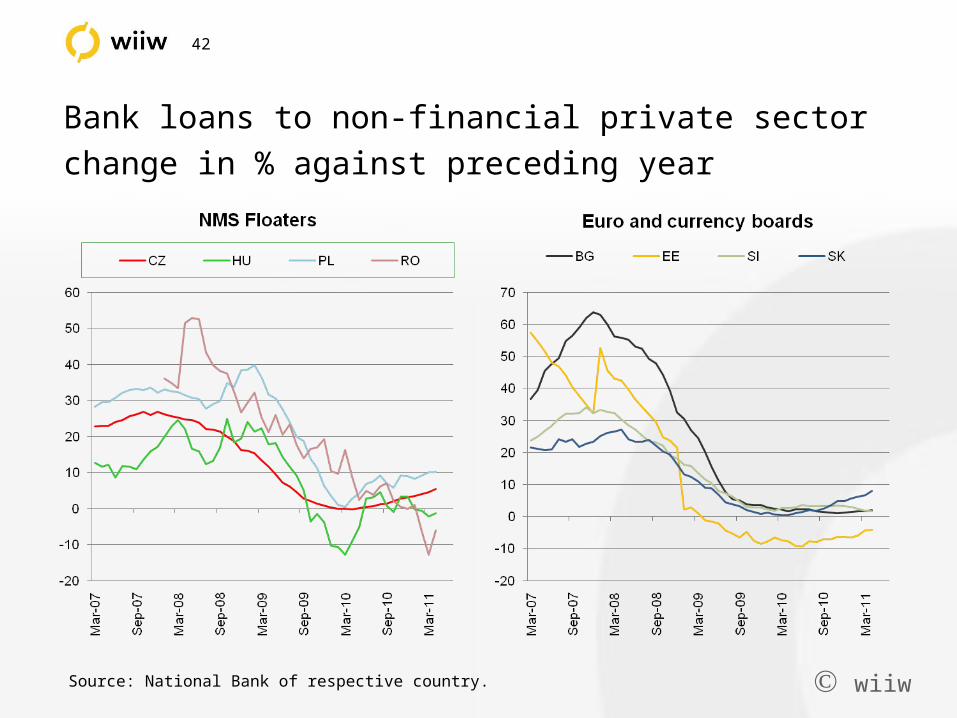
42
Source: National Bank of respective country.
Bank loans to non-financial private sector
change in % against preceding year
wiiw
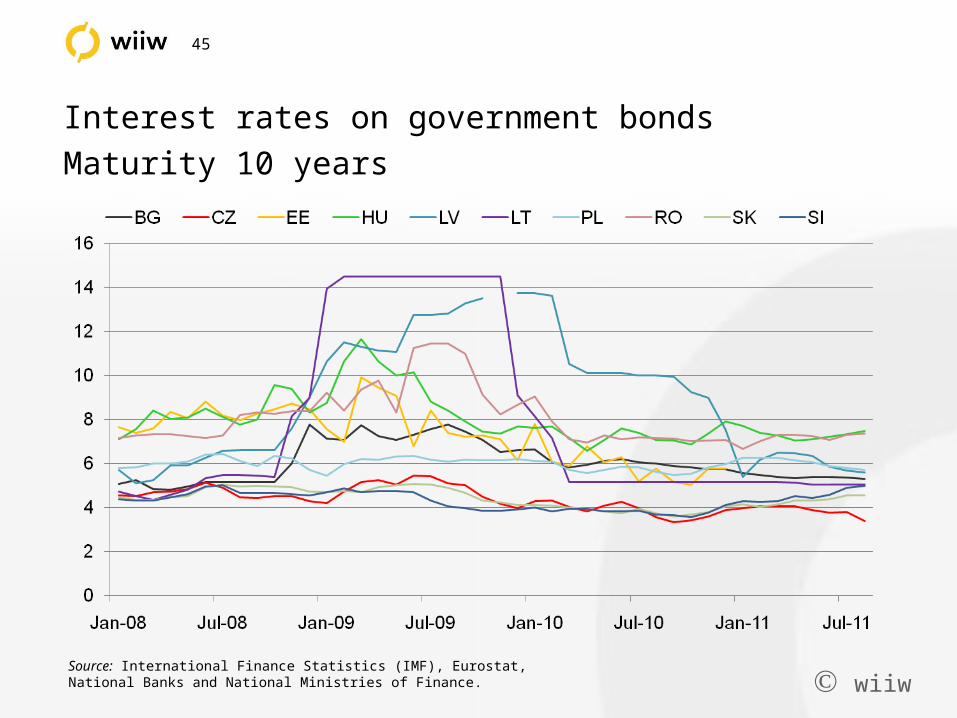
45
Source: International Finance Statistics (IMF), Eurostat,National Banks and National Ministries of Finance.
Interest rates on government bonds
Maturity 10 years
wiiw
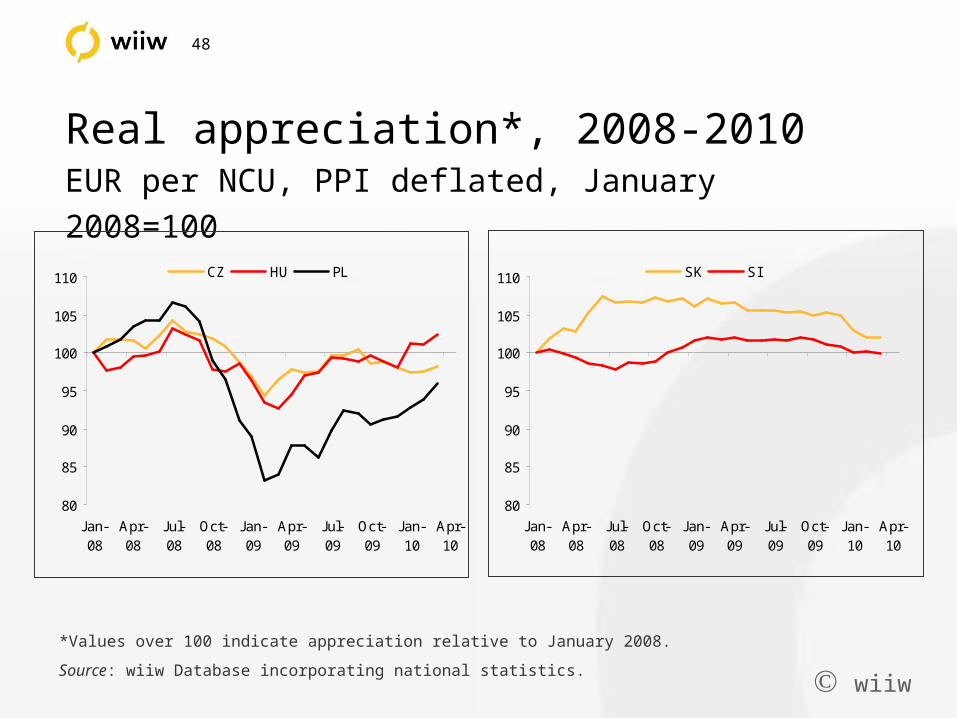
48
Real appreciation*, 2008-2010EUR per NCU, PPI deflated, January 2008=100
80
85
90
95
100
105
110
Jan-08
Apr-08
Jul-08
Oct-08
Jan-09
Apr-09
Jul-09
Oct-09
Jan-10
Apr-10
CZ HU PL
*Values over 100 indicate appreciation relative to January 2008.
Source: wiiw Database incorporating national statistics.
80
85
90
95
100
105
110
Jan-08
Apr-08
Jul-08
Oct-08
Jan-09
Apr-09
Jul-09
Oct-09
Jan-10
Apr-10
SK SI

wiiw
49
Real appreciation*, 2008-2010EUR per NCU, PPI deflated, January 2008=100
90
95
100
105
110
115
Jan-08
Apr-08
Jul-08
Oct-08
Jan-09
Apr-09
Jul-09
Oct-09
Jan-10
Apr-10
AL MK RO RS
*Values over 100 indicate appreciation relative to January 2008.
Source: wiiw Database incorporating national statistics.
90
95
100
105
110
115
Jan-08
Apr-08
Jul-08
Oct-08
Jan-09
Apr-09
Jul-09
Oct-09
Jan-10
Apr-10
BA BG ME HR
wiiw
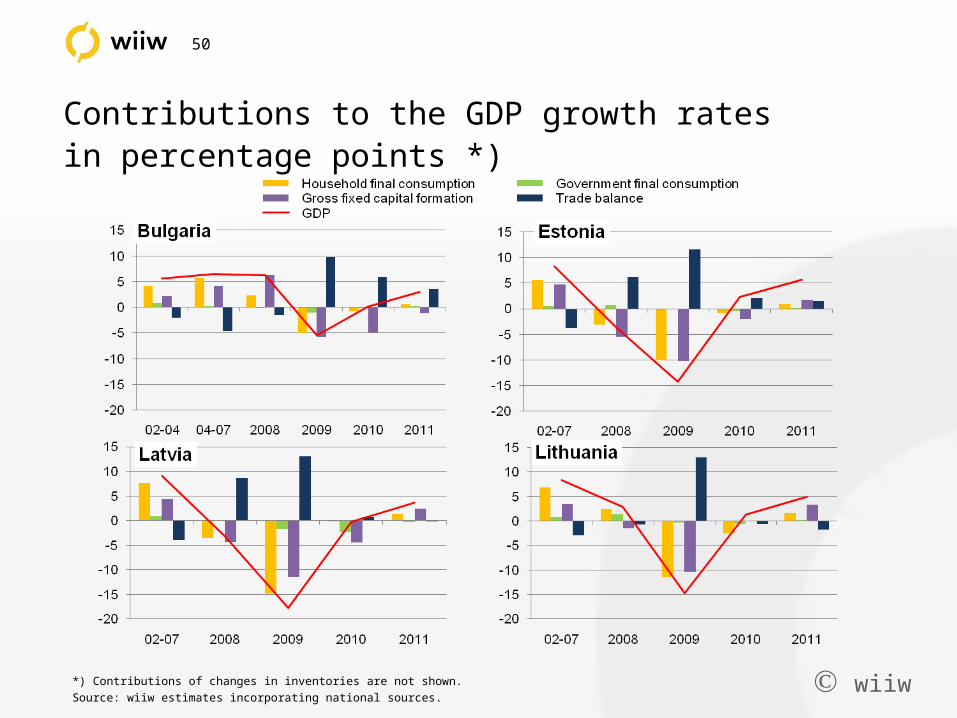
50
*) Contributions of changes in inventories are not shown.
Source: wiiw estimates incorporating national sources.
Contributions to the GDP growth ratesin percentage points *)

wiiw
51
*) Contributions of changes in inventories are not shown.
Source: wiiw estimates incorporating national sources.
Contributions to the GDP growth ratesin percentage points *)
wiiw
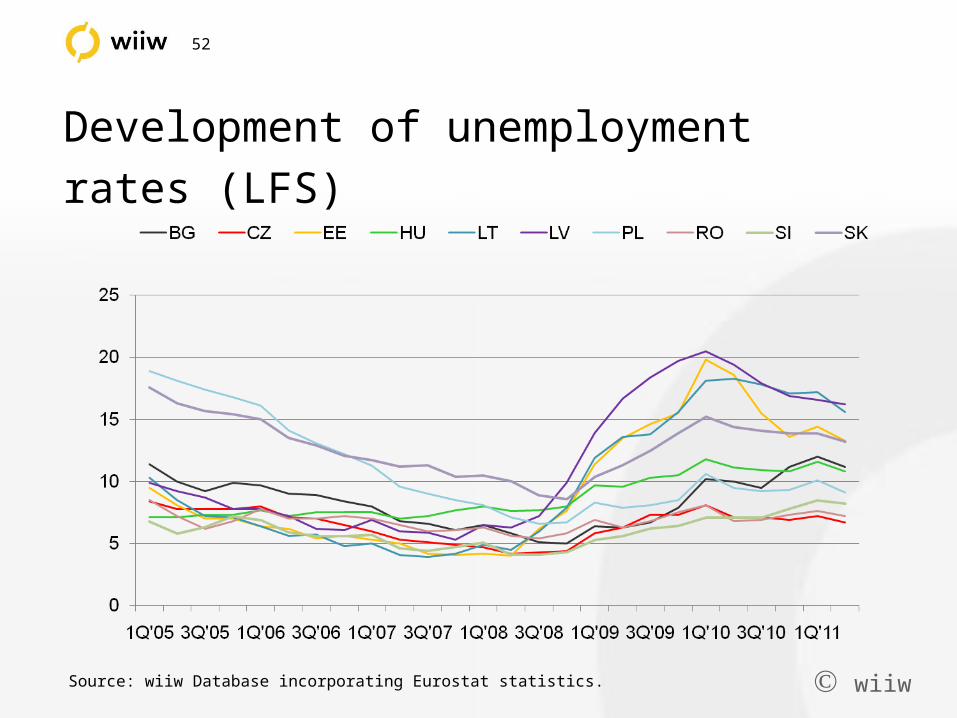
52
Source: wiiw Database incorporating Eurostat statistics.
Development of unemployment rates (LFS)

wiiw
53
Resurrecting growth?
New constraints following the crisis
wiiw
54
Constraints following the crisis:
Internal factors:
‘Deleveraging’ of private sector, affects private sector spending;
Public debt has gone up: less fiscal space;
Weak and cautious banking sector;
Differentiated processes of real exchange rate adjustments

wiiw
55
Constraints following the crisis:
External factors:
Volatile risk assessment of the region (debt overhang);
Difficult external (and internal) financing;
Contagion effects of banking crisis in Western Europe: consolidation process of banks’ balance sheets
Reduced growth expectations in the most important export markets;
Crisis in the eurozone: new OCA debate; unfinished governance structure leads to wait-and-see w.r.t. EMU membership

wiiw
56
Principal policy lessons:
In national and EU policy frameworks: neglect of private sector debt
build-up relative to public sector
Fixed exchange rate regimes bear high risks; much stronger emphasis
on OCA criteria on the way to EMU and after
Financial market regulation severely underdeveloped; specific issue of
cross-border banking
Use of taxation or insurance to prevent bubbles in financial markets
(sand in the wheels taxes on particular types of investments)
Use scope for counter-cyclical policy, but beware of debt sustainability
and restructure public finance in growth-enhancing manner
Direct policies towards tradable sector: structural policies, avoid
distorting macro-policies; use EU funds

wiiw
57
Unresolved issues:
Will Euro-zone deal with governance issues?
Will there be recapitalisation of banks?
What would be repercussions of a break-up of the Euro-zone?
New timetables – if at all – for further Enlargements and EMU memberships
Recommended