Embed Size (px)
Citation preview

.. ,
·r /', jp
.•.. : r
' N
~ • i
I J ,.
r' ,;
p . . ". ~.~ , (,
r rf
r {, ,J
r: r:
'
~~ f,, .
1' .:.:"
f~
~:i
~
:::...&zo.: ·Plea~& Rttum 1o
aecuatnCOIRRGL THE PO'~ENT!AL FOR ELECTRICITY CONSERVA-TION
" liN TRE RAILBEJ.T lEGION OF ALASKA
DAVID A. TlLLMA1J HARZA-ZBASCO JOIN.T YE:NTURE
MAY 3• 1983
1.0 Introduction -- ··-=:=-: ,. lnergy con•ervatiop baa nu•erous aeaninss including: (1) eli•ination uf ~&~te, (2) accoapliabing the •~•e tam~s (or life•tyl~) wi~b laaa energy expenditure, and (S) simply usifig le~• ene~gy. CottiHtlt"'?ation can be au:coriplif.ibed by ~~ var:tety of ~ea~a iaeluding technical adjustments (e.g., waste heat .re~ov.e·r.y 10· hou$~bo!d ineul~t i.9n) ii ~nd l if.'! .~.t.y.le adju9tme:nt5 . ." (e.g., lovering the setting on the thermosta~). It can be accoaap 1 isbe<i.•i.n" ·r·et iaerri! ~. i, ct~uu~atn:·e i~ l,; :~ndu·i$·t r·ia 1; · and institutional economic sector~; and it can be ~ccompli•b~d.~icb respect to all fuels and energy GourceG. Energy cons~rvation can be effected by two means: (1) establishment of programs pro~oting or 5ubsidizing conservation. and (2) relianace on economic fore~$ GS$aclated with ri5ing cost$ of ~nergy. Tbi5 re·pori:. ·de~,l~ .w~~-~ .. ethir;Sy·. c~l_l~e.i'~ii~}~.ta. ~~it~ bi:<?~d~~H-~ s~~~~~ .. ueing leas energy; and it includes technical and lifeGtyle
. . ...... ~ ...... .
-..-.. ...... ~..,-m""'-.~ :~~!I --~·-----if!,.~- "'·-r.l-A-'1"'!'.1'3 ,_.;~.,.&~.~~ !'!>' -'-,.,•,.., --!a.a.. ....... ._. _ _.,J;;;·;:~if,.;z:!"tot ·:·;?,o Su·i>l ·;a¥V."i:r';.-·;;ota. 'l:t';.. ""~""""'·-~~""""*'srta;,. ·~· ... ..... ,.. . .,ti'if,s:~ .. :;·:~·- .. · S<""'"'P'~~~;~!tf·.·-&.'£;£:'·',.· .. • ·4-' .: - : ~... . '
both prograaatic ~nd market driven ene~gy conservation. However, this repqrt deals specifically ~ith.electricity COD$ervation rather than the reduction in use of all fuels.
In oraer to· f·ccua· on .. el.ec:tr·iciey ·ct>nscr'Y'·at ~rt, ·it is u.sef·~l to ... ..._,._.:.,. . ., .,.1- ................ '/ ,0 . .,...,. ... .dl"'""•~ ........ eft ,&1•.af.,_. s• Q ._.,t....,.l.-. c$-..5. :.,. .. s.a_..,._ e ........... e .. iie ....... - • .,. -x ... - .. ""' ... _.. ....... 1 •• fi ......... a ..... - ..... ,_ .,.., , .......... ..... .... •• "" Railbelt particularly. These are presented in Tables 1-3. lt is sd.anific;a~t to note that .. elec.tricity "•~counts. for; only 6.1% of the t"otal ene.rgy budget in t!aska; and th~t it has its highest uae in industry (6 xlO Btu) 8 with about equal amount$ being us~d ic re$ident1al and commercial applications.
Given the fact that mueb of the manuf~~turing basd of Alaska (pulp aillsJ aavmilla, canneries) is in the Goutheaat region. it ls necessary to ex~mine aor~ closely the distribution of energy usage io the Rallbelt Region. This is shown in Table 3.
Fro• Table 3. it can be seen that electricity is not u1ed a~ sauch irt the Railbelt Region as in Alaska as a JJhole. Electricty
@
,tpiP' ..

-r ' -'
~
r aecouots for 5.5% of the non-utility energy budgets within the reaion (eleccricity accounts fo 4.61 of tbte total eneray consu•ed in the reaion). Fro• Table 3 it can also be seen that t.be doainant ei:ectrieity coneuaing sectors are coaaercial (33.7~) and reaidentiai (32.8%), with the industrial sector accou,t\ting for 18.7% of electricity eona.uaption and the •ilita~ry sector accounting for 14.8% of ~lectricity usage.
The dominant electricity conserv•tion potentials in the R.ailbelt Region, thee, are in the t·esideKltial and coaaercial econo•ic sectors. Industrial and ailitary uses of eloctricity iu the R.ai lbe,lt R-egion are f-ar less iaportant.
lecaull~ the t>esiden~ial aeetor is one of the tvo iraport.ant eleetricitJ con8u•ing groups in the Railbelt, it it iaport•nt to exaaine, ~ore closely, tbia aecto~'s energy budgete. Tables 4 and 5 are preaented to •bow the distribution of epace and hot wlt~ h.~•tift·g in the· ltailbelt Region. Electricity bas only 10% of the space .. heating market, while oil 8nd ~as combine to have
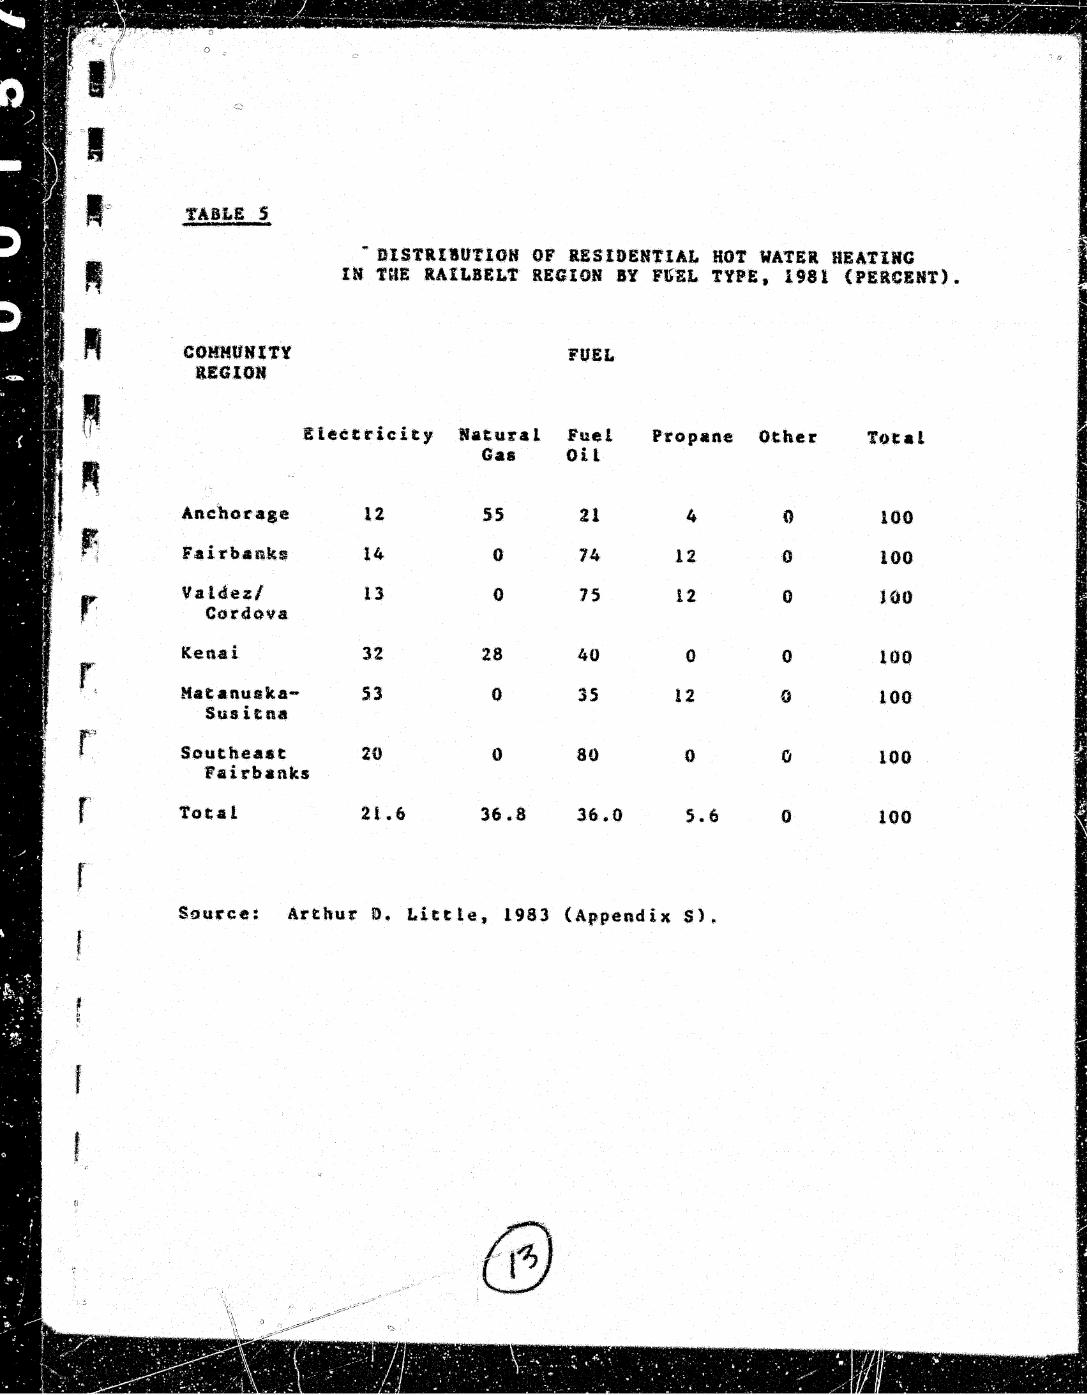
· n~a1:ly 831 .. o-f t~hat earket as is shown in TabLe 4. Electricity haQ',.t:~~red only 2~' of. the hot water heating market in the Railbelt Region, while oil and gas eoubined have 73 percent of the hot water heating market as is shown in Table 5.
Electricity bas captured a very ~•all portion of the residential ·the~mal ~•rketg ~~ ia shown in Tables 4 and 5. Further, the aajothy .. o·f ·~«!i.raw.at·t ·hours consume~ by the residential sector
·~·r·.·""D>., ··:··" ......... ~r.~ .. not. . .;;;9.Jt.f~~~~ .t.o.,,rulrve thermal ap?licationa. This dis-. · tribution ~f electri~ity consumpion in the residential sector is · ; shown in Table 6~
r ..
r~'
' ! 1 l
. The coamercial sector in the Railbelt Region is housed largely i~ the.lo8d -~~nte~• of Attehor~ge and Fairbanks. Like the resith!ntie·1 S11;ctor~ :it relies largely upon non-eiectic !~lf!ersy in thermal applications. In Anchorage, the dominant ~ouree of the'Fmai ·en~t"gy i4 n4.t.ural &•• (Poray, 1983; also see A.D. Littlet 1983),· In fairbankw, nearly 60% Df tbe thermal ene~gy is supplied by patroleum products (e.g., distillate oil).
Future d•~•nds at~ likely to eontinue the current distribution of ther•a& eneTgy loads bet~een aon-electrlc and electric energy aou~:ces. tn Anc!uu.·•ae. eleetriccl,ty tleat.ed homes are considet"ed a d~aa on the ~~rket, and they are not being built at this tiae (Poray. 1983). Tbeir share of the market i~ expected !o decline over t:i~,t~ 1!ouae, 1983). With ele,ctrieity coating 8.Si1kWh in

• r:
rl . .)
'~ r'.' /
!: ;
t.~
L
Fairbank• (Reauae, 1982), or $24.90/aillion Btu. it is difficult to f'reca•t a rise in el.ctric beat in that load center (particularly when diotilla,te 1~il costs a5-90t/gal or $6.30•$6.ti7/ •illioo Btu in-that cc:ua•t~nity). In the Ancho&:age area, tb.e dQ•inant load cente~, abt!)ut 70% of tlur. co•••erc ia 1 off ice apace baa beeu built aince 19713. Almost all of it (with one •ajor developcaent exception) iJ5 heated with natural gas (Poray, 1983). Poray expect1 this trend to extend into the future. In F~irbanka 1 wbere 2.1.1% of the c:oaaerieal apace is heated with electricity, 59.1% by fuel oil. and 19.7% by steaa, the relative prices of distillate oil and electricity favor conti,"ua.tion of this diat~·ibution (Reau•e, 1982).
Given tho•e data concerning energy con•umption in tbe ljllbelt Region, certain conclu•ions can be drawn:
(1) The l~rgeat markets for energy coneervatioo 3 the thermal markets 1 are served predominantly by non-electric energy sources. Therefore, the largest conservation potentials lie outside the electricity arena.
(2) The dominant uaes of electricity are non-thermal applications (e.g., lightiag) where co~se~vation potential~ are less significant and less importafitQ
(3) The ut~s of electricity in industry, vber~ proces$ chan~es can effect energy conservation, are not particularly aignlfic~nt in the Rmilbelt Region of Alaakil.
Given tbose limitation~ on electricity conauaption in the Railbelt Region, it is important to ~xamine the programatic and market potefttials for reducing th~ use of electricity.
2,.·0 ProL~!.a&t~at!,c ~,2,2roach~s to Ener~-~ CoruhH:'Vation
Energy conservation proarams i•pactlng upon eleeticity conau•ption h•ve been developed ~nd implemented both by tbe State of Ala•ka and by the various utilities withift the Railbelt Reaion. Additional progra~a have been developed by the City of Ancho~&ge. All of these programs have. to some extent, reduced the consu•ption of electricity in the Rallbelt Region~

n
" • , ; ·~·
' ~··.: . ' . )
r r ~
r
r.,.-J. ' '
... }
r. j. _)
Virtually all of th~ proar••• bave been directed at the residen~i•l aector~ However, in Anchorage. aoae progra•• have i•p~ct•d che g~vern•ental sector (including lnternal use of eL0ctri~city by Aneboraae l!&.Y.cipal Light and Power). conaervat ion in the co•a~{i~al and industrial sec. tor a baa Larsely been left to marketplace driven actions.
t.l .!..ttl ~t&~e (DEPD) frosraa
The DEPD energy prcgrac bas been in place since 1981. Thla p~ograa bas involved the following activities:
(1) Tr~ining of enersy auditors;
(2) Perfor•ance of r•sidential energy audits, which are pbysic~l inspection:1including •easure•ents of heat loss, upon request;-
(J.) Providing grants of up to $300/household, o-r loans, for enersy conservation improvements based upon tbe audit;
(4) Providing r~t~ofit (e.g. insulation, weatberi~ation) for low inco$e homes.
The key to the program is the audit. which is performed by private contractors. The forma ~mployed are designed to show ••vings that can be achieved in tbe first year, tbe seventh year, and the tenth year after energy conservation measures have been imple•ented. The aavinga demonstrated provide the basis tor qualifyina for a gran,t or loan. The audits focus on majotr coQservatioa opportunities such as insulation and reduction of infiltration (e.g., by veather •tripping, caulking. and stor• vindov application).
The DEPD prog~a•$ overelt, achieved a.significant Level of peftetration into the conservation marketplace, as is shovn in Table 7. Penetration in the state as a whole acbieved 24%; and
r; ~~be state ia charged for • portiQ• of the coat of the audit. on a sliding scale. depending upon location in the
f state. The ho•eowuer pays the differ~nce between t-at p~ice L~ and tbe market p~ice.

Jl
R ~ ::X
~
~
~
! , ~ , ,_ ,.
.~
" , ... ci
r: ~ .
~~ . t
•) t L
•
in tbe co•hln•d load center• of Anchorage and Fairbanks lt also ~cbiev~d 24%. It ia useful to note that the audit proar•• waa aore effective in blgh cost enersy &reae (e.g~, Fairbanks) lndicatina thai public participation was based upon aarket fo~eea at least to ao•e mod~st extent.
The DSPD ~rograa, accordina to ita representative a. Qou1e, h~s •cbie:v•d a 30 mill ion Btu/houae/yr or a 4. 2% aaviaaa of energy in Alaska~ of which 18% ia electricity (House, 1983). Over 80 perc~nt of the ene~g~ cofiserved baa beE~ in the area of fossil fuels. This is cgnaiatent with the directioQ of the program towards cher•al enersy aavinsa (Brewer, 1983).
The DIPD prograa ia currently being phased out, except for low inco•e faaily ascistance, particularly in the Bu•b Com•unities (B~ewer, 1983). Even in those communities. only 13% of the homes vill be treated (at ~ cost of $2000/bouse) in the next l years (Brewer, 1983). Educational efforts, however, will continue (House~ 1983). tf progra~s are constructed for the future, they will b~ directed at fosall fuel conservation. Particularly in the remote areas (Kou•e, 1983).
2.2 lhe qity of Ancbo!age Progra~
The Anchorage Program is the other non-source-$peeific conservation progra• operated by the En~rgy Coordinator for the City of Anchorage. This program also inYolvea audits, weatherization, and educational efforts. CursDry walk-through audita have been perforeed on city buildings and •ehoola, and detailed audits have been performed on •elected inatitutional buildings. According to energy coordinator P. Poray, few coat effective donservation measures were ~ncovared by the sudits {Poray, 1983) ..
Tbe ~eatherization proaram is applied in the case of low income perso~~el, and involv•~ Jiving grants of up to $160U f~r ~aterials and incidental repairs. Labor is supplied from the Compreh•naive !aployment Training Act (CETA) program. It is designed to help those families hardest hit by rising energy costs including the elderly and the handicapped (ML&P, 1902).
the educ&tionaL program haa involved wo~king with realtors • bankers, contractors an4 businessmen. It also has involved infofaal contacts with eoa•er~ial building maintenance

.)
I 1
·~ j
d '
·~··i .. , ' . '
r ,.~
\
j
r: ~ . r: r;
' fj
. r··~ I ":* \
per•Ganel. finally, it has involved contacts with the aen~rcl pub 1 ic.
2. 3 !h.~ Anc,:.horaae t1unic i pal Light. and P~wer {ML&P) -~,~o~~~-
Ti'i.~ HL&P pl'oar•• specifically addresses elutricity c~nservation i~n. both residential c;nd institutional setti~l-•· It is a for•al conservation program as aandated by the Pov~rplant and Industrial Fuel Use Act of 1978 (PUA).
The p~ogr•• of M~&f i• de~igned to ~cbieve a !01 Teduction in electricity consumption froa the base year, July 1. 1980 to June 30. 1981, as shown in Table 8. To achieve this level of conservation, ML&P provides infor•ation on available state &ad city programs (some employing Federal funds). Additionally, it has programs to:
(1) distribute bot water flow restrictors;
{2) in•ulate 1000 electric bot water heaters;
(3) heat the city water supply, increasing the temp~ratnre by 15•F (decreasing the thermal needs of hot wat~r heaters); and
(4) convert two of its boiler feedwate~ pumps from electricity to steam.
(5) convert city street lights from mercury vapor !amps to high pressure sodium lamps; and
(6) convert the transmission system from 34.5 KV to 115 KV.
ML&P also supp!iea edecational materials to its customers along with "F~rget-~e-not" •tickers for light switches. lt has a full time energy engineer devoted to energy c~nservation prograa deve~opft:ent.
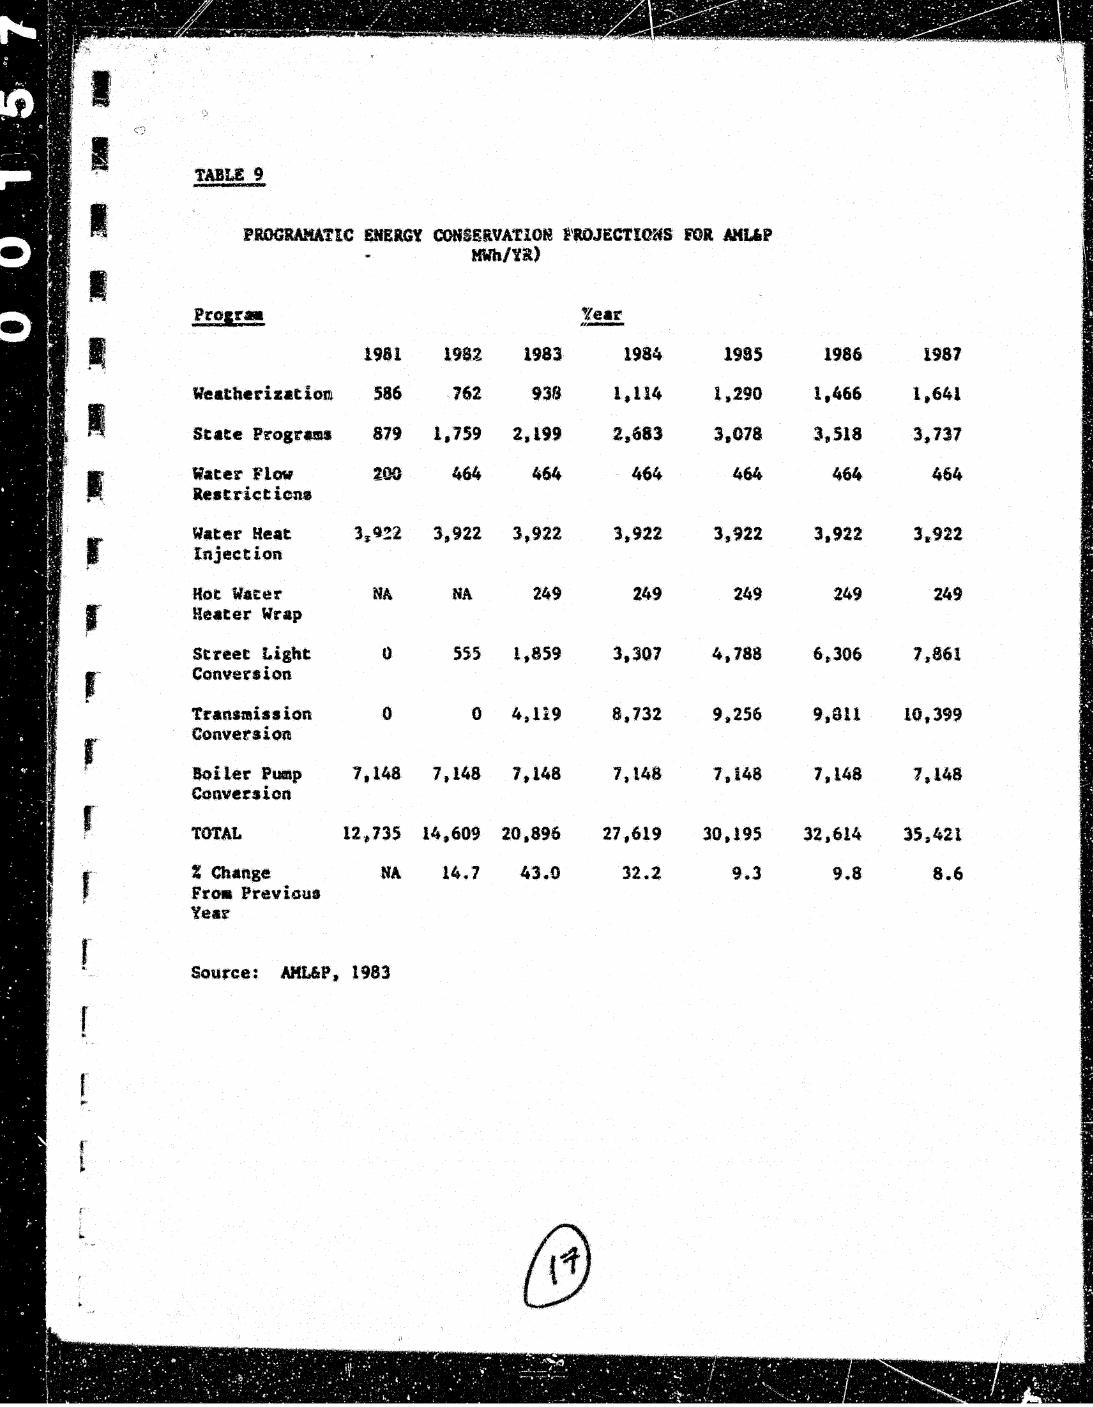
The project~d impacts of specific ML&P enet'y conservation proara•a are detailed in T~ble 9. They are doain•ted by non-residential public aeetor programs such as street light conve..-sioa, tt:ansmis•ion line conversion, and poliler pl•nt boiler feed pump conversion. the•e thr~e programs, for example,

··~
" " ·~
" " t ~
" /1 , .. '
F ~
r r ;
r J
r ,-J' •
r t.
r t,..,.~
r (..
r ~ ' -,.., j
r # > 1-,., ,,;:i
r ,,,-~v
..,..
provide 25,408 HWb of electrlci;y conaervatlon in 1987. or 721 of tb•'· total proar••••t ic eneray conservation. They .ar;e con•idered to be one-allot suceeasesa by AML&P (Ke.itcb. 1983) that vill p~ak-iB 1982.
The aarket driven conservation expectation of AML&P are c:ospatt·ed to the progra•aatlc efforts in Table 10. As can be seen. aarket driven conaer\tation is the doainant force. If one further pl11•t• pro&ramaatic cona~rvation proir••• i•pacting reaidential dvelliB& (weatherization, atate proaram•• flow reetricto~•• and water heating) aaai~at market induced conservation, the ~ominance of that latter force iA ~• follo~•:
Year
1981 1982 1983 1984 1985 1986 1987
Market con•ervation as of a % of total private aector conservation
77.8 79.8 82.5 82.9 83.6 83.7 83.9
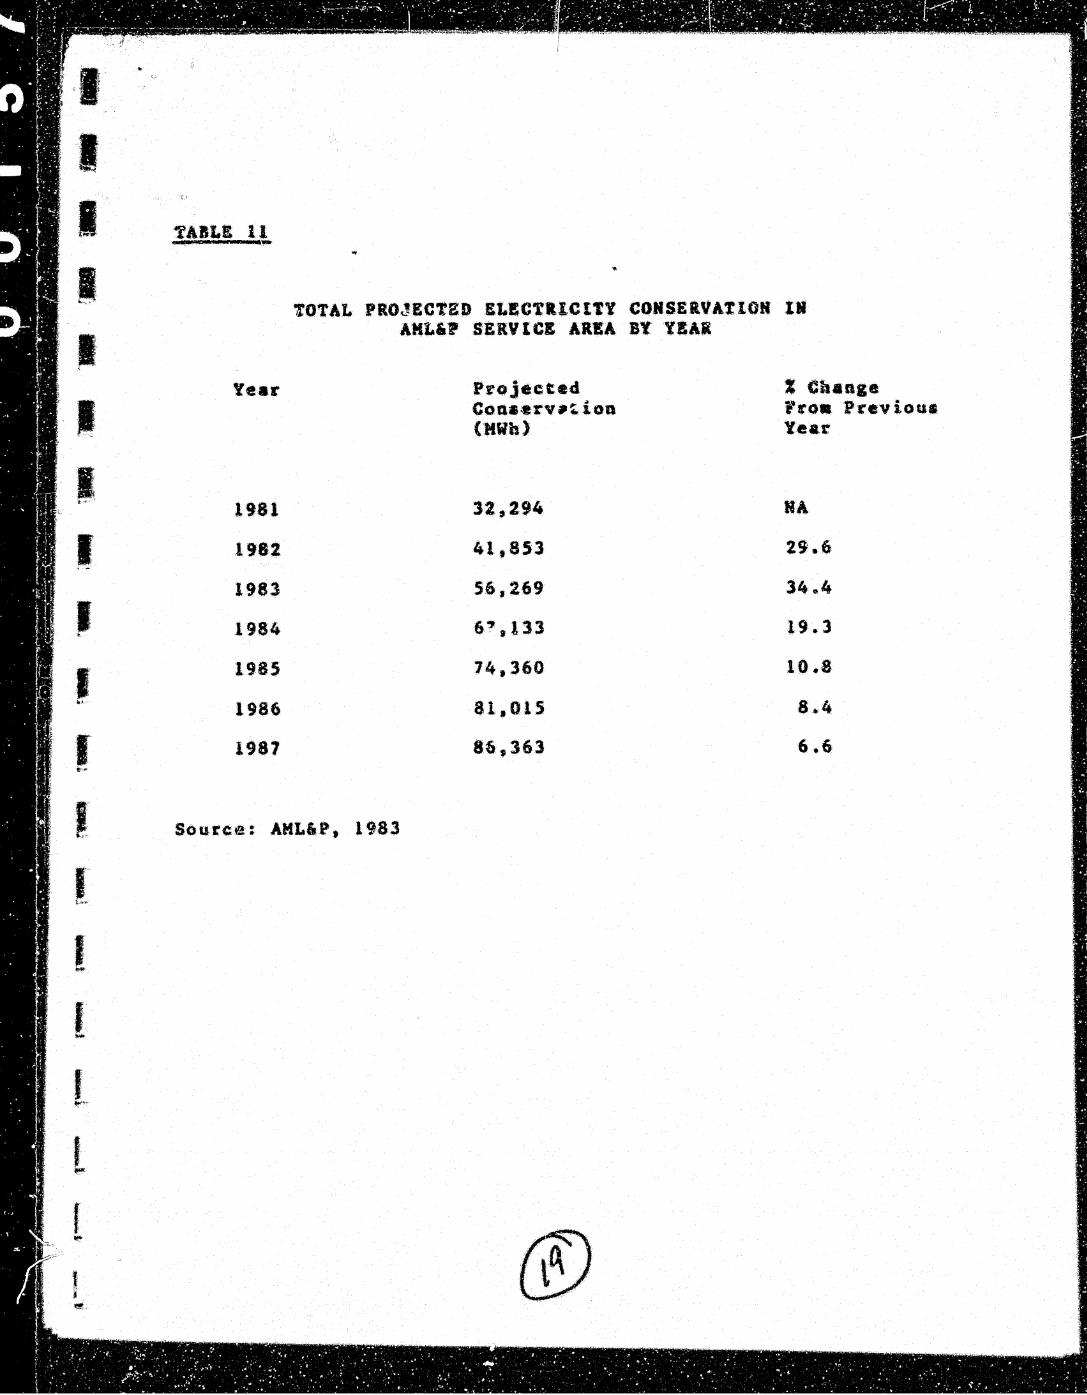
The total conservation forecast by AML&P is $hown in Table 11. It 1• clear that. after 19bl, the rate of inc~ease in conservation decline• precipitously~ The rate of improvement dropa sufficiently that the obse~vationa of Keitch (1913), that realistic conservation reacbes ~ aaxiaua realistic level by 1983~ can be reasonably docuaented. Beyond that time frame ~arket driven conservation may be considered as the ove~whelming contributor.
2.4 The G~lden yaLley El!'ct,!J~. Associaeion Pru.1.ram
Golden ValLey Electric Aaaa. • in Fairbanks, provides an education oriented •pproacb to ~nergy cons~rv~tion programs. this utility, which serves •11 of the electric best custo•ers in Fairbanks (Coloaell. 1983); La Marca, 1983)• relies heavily upon tb~ ••rketplace and provides it• customers with inforaatioQ concerning bov money can be aaved. tt uses heavy reliance en Market lore~• due to the blgh cost of electricity in that city ($57.01/500 KWh in Fairbanks vs $28.08/500 KWh in Anchorage~ Oct~. 1982) and the hi&h coJt of electric energy vs other fuel 2s abown in T•ble 12.

'"""' "-r
~ ..
0
"
r I
f t
r
; ~ .. . ~ . . ,.. .' : . ··:: -.:~~::#-., ~ ~-:~~ ~~h :~~~-... :~:: •• ~
. - .... - .... f. ~< •• • ~., ~ • - •
:.:. ·/·-~:-~~~
To as~oapliab the educ&tion progra•• GVEA baa adapted a· plan pur,auint to REA, resulations$ Thi.a utility nr•loya an Enersy Us4~ Advisor vbo pe~for•• the following taako:
(1) perforas advisory (non-quantitative) audite;
(2) counsels cueto•ers on an individual basis on aeans to cona~rve electricity;
(3) provides group pr•aent~tioas and panel diseu•slons; •net
(4} provi-des printed aaterial, including pt:eas 1:elea~es and publications*
-· --GVEA also eliminated ita ~pecial rate fo~ all-~leetric homes~ and placed a aaoratorius on electric hofae book•upm in 1977. It bas given out flow restrictors~ lt ha5 prep~red displays and presentations for the Fairbanks Ho~e Sho~ ~nd tb~ Tanana ¥alley State Fair~ tt cootdlnatea It$ proara~~ with tke state (DEPD) program and with ether programs.
The CVZA budget for conservation activities involves 1.8 man years of effo~t. In 1981. the last year for which data were available, it budgeted $102a733 for its conservation efforts.
The efforts of GVEA, combined with price increases and other a.ocioeconortic phenomena! produced a eonset,Jation effect as shown. tn Tabl~ 13. lt is i•possible to attribute the entire reduction ln en~rgy use per household to the program •$ to price conservation p~f •~• hovftver the dat• do show • radnctlo~ from 17,331 lt\olh/houaeiyr in 1975 to a level of 9,303 KWh/house/yr in 1982. Electricity consu2ption per household bas been cut nearly in half (by 47.6%). ·
The data in Table 13 also sbo~ a moder•te upturn in elect~iclty consumption per househoid in 1982, indi~ating tbat the practical limit of cons~rvatlon •ay have been r~ached in the GVEA sy•tem. This is the belief of GVEA (Col~nell, 1983).
2.S Other Utility Prosr,am.!.
Other uti t ity progr2as in the ~aajor load eenter_.a are represented by the Anehorage based Chugach El~ctric Aseoclaticn
, I •I
f ¥ j
c f
\!I
(CEA) and the Fairbank• Municipal U~ility Systea (PMVS). Both proar••• are afaecl &t get&iftg i.nfora•tioa to tlle public conca~ning the 1ollar aavina• aasoclated with electricity conservation. Both utilltiee rely on aarket forces, and aid in conauae~ gecognition of those forcea. Althouah their electrical rates are not aa hiah aa those associated vlth GVEA, they are •ufficiently bigh to induce •arket driven conservation. (See Fiaure 1) .•
3.0 Price Induced ~ectricity Con•~!X•tio~
Pri~e induced electricity conaervation bas been showA to be •ere ieportant than progra•aatie conaecvation, and for several reasofts.
(1) it already i• having the doainant i•pact, particularly in the Anchorage area (see Table 9-11);
(2) programQatic effo~ts in the areas of subsidized audits and investments for residence• •re being phased out;
(3) programmatic effo~ts in the areas of inctitutional building$ and systems are approaching the practicaL limit of impact; and
(4) the dominant programs for the present and future, •~ i•ple•ented by electric utilities and government agenc iea, are educational pror&ram;;l designed to support, r~ther than supplement, price or ~arket induc«d coneervation.
The details of aarket induced conservation are covered elslewhere in this report. Ho~ev~c, it is significant to concl~de that the procese has been going on for a sufficient length of tiMe due to high prices tb4t many oppoctunitiea are eabedded in tbe eai•ting building stock, and th•t further opportunitlea •~Y be li•ited~
.(.~q)., lY

~
" " " " ' \
. 1*. r t ·~
. '
~.·.·. ·~r .~ : . 0 . ,;
r f
r . r
,. f r
.
0
'flt.,JL.E 1 •u• r Mllf·
SECTOR
Residential
Co11aercia1
tnduatrial
National Defense
transportation
Total~./
.. IHD USE OF ENERGY IN~ ALA.SK'A IY ICONOMIC SiCTOR AND FUEL, 1~81 (TRILLION BTU).
FUEL TYPE
fuel Natu~al Coal Electricity Wood tot at.!/ Oil Gaa
15.1 8.3 0.1(. 4.5 3 .. 1 31.0
3.3 7.6 1.1 4.4 -o- 16.4
32 •. s 32.3 -o- 6.0 -o- 70.8
15.4 4.6 5.9 1.7 -o- 27.S
127.4 -o- o. 1 -o- -o- 127.4
193.6 52.7 7.2 16.6 3.1 273.2
Source: Arthur D. Li..tt·le, 1983 (Append.ix S).

.r
r ;
·.··' -··
' t,. ~
K '
TAIL£ 2
ENERGY US£ DtSTRIBUTION IN ALASKA, 1981 (PERCENT) • ...
SECtOR FUEL TYPE
Fuel Natural Coal &lectTicity Wood
Ites ich~nt ia l
Industrial
Nat. ional Defense
Transpot:tation
Tot at.!/
01 .. 1 G ••• 48~7
20.1
45.9
56.0
100.0
71.9
2,6'!'8
46.3
45.6
16.7
-o-19.3
REG~:.!
6.:.1
-o-21 .. 4
0.1
2.6
t~totals Do Not Add Due to Rounding - 11.1.3% of Total Energy ConsuaHlld in Alaska i-6 .. 0% of Total Energy Cuneuaed in Alaska -~25.9~ of Total Energy Conau•ed in Alaska f 10.11 of Total Energy Conau~ed in Alaska - 146.61 of Total Energy Consumed in ALaska
..
14.$
26~8
8.5
6.2
-o-6. 1
Source: Arthur D. Little. 1983 (App~ndi~ S).
10.0
-o-
-o-
-o-
-o-1 .. 1
Tot.cat!-.1
too.o!.i
99. 9·'-' S:,.l
too.o!l
100. 3!.1.!1
AOO.l~/!l
tG'l.o!.1
??' • •

I . c
~ , , ·a
" ':
·~
~· . .
~ ~: ,, '
tt 1
~ r, .,_....., .'1
r~ r J :
~ ,),
,.
tw
[ :_~~
L • c
i .....
TABLE 3
• ECONOMIC
SECTOI
Utilities
Co•aercial
Industrial
Res i.dent ial
Military
Other
Total
..
RA .. ILBELT ENERGY DIS~RlBUTlON FOR 1981, BY ECONOMIC SECTOR AND FUEL (VALUES IM TRILLION BTU)
FUEL TYPE
Fuel Natural Coal ELect~i~ity Wood Oil ~as
2.15 5.41 29.65 ""o- 2.90
2.26 ItO? 1 ~.33 -o- -o-13 .. 26 --o~, 31 .. 44 -o- -o-9.65 u .lS 8.11 1.$6 -o-
15.36 5.89 4. 59 -o- -o-95.08 0.07 -o- -o- -o-
137.76 12.58 81.12 1.56 2.90
Source: Arthur D. Little, 1983 (Appendix S).
247.31 4.6 207.20 s.s
total
-o-s.a2 2 .. 13
3.75
-o--o.--
11.39

I w
r I I
f •
TABLE 4
, ·cnltMttlf I t'Y REGI.ok·
JllSTliBUT!.ON OF IESIDEMTI,AL SPACE HEAt' IH THE .AAIL8ELT REGION BY FUEL TYPE, 1981 (PERCENT).
FUEL
El"ct~icity Natural Fuel Pl'opaQe Wood Coal Gas Oil
Anchorage to!.1 62 %6 2 0 0
Fairbanks 5!.' 0 70 s 17 3
Valdez/ 0 o. 94 0 6 Q Cordova
.Kenai le.C./ o-- 28 4S 0 6 0
Matanuska- zs!1 0 69 0 6 0 Susitna
Southeast 0 q 94 0 0 Vairh.:snks
Tot~l 10.2 40.9 41.8 2.1 4.4 Qt. 6
Source: Arthur D. Little, 1983 (Appendix S)o
Total
lOG
100
100
100
100
100
100
i'~B,attelle .Placed th~s value at 16.1%. .. -Battelle p!ac~d th&s value at 15.2%~ the Fa1rbanks Consumer
Advocacy Com•ittee placed it ac 9.6%, and the Interior Woodcutters Association placed it at 7.8%.
f~Batteile pl•c.ed tbis value at 20 .. 6% .. ~Battelle placed this value ac 27.7%.
(/
I cl
·~ ,
" ~ \,
r
r r 1
f
COHHUNlTY lEGION
"' DlSTI.IIUTtON OF B.ES,lDENT.IAI. HOT WATER HEATING IN tUE R.AILBELT REGION BY .FI)IL TYPE, 1981 (PERCENT:).
FUEL
Etettticity Natural Fuel Propane Other Tot a! Gas Oil
Anchorage 12 55 21 4 0 100
F4i rbardu~ 14 0 74 12 0 100
Valdez/ 13 0 75 12 0 lOU Cordova
Kenai 32 28 40 0 0 100
Matanuaka- 53 0 3S 12 0 100 Susitna
Southeaat 20 0 80 0 100 Fairbanks
Total 21.6 36.8 36.0 5.6 0 100
S9urce: Arthur D. Little, 1983 (Appendix S).
~; 0

• ~ -~
!ul
" .
~~-- \,i
/f, jl;,~ :~r
0
-';)
CONSUMPTiON OF ~ECTRICtTY FOR. RESIDENTIAL THERMAL APPLICATIONS AS 4 PERCENt OF TOTA.L ELECTRICITY COISUHED
!f~ THE RAILBELT REGION, 1981.
liLSCtRICl*tY COHSUHPTION
SECTOR
Wat«u: Qe~~lng ~~.-1 Reaidentia!
KWH CtiNSUMED
384,327
116,937 1,097,725
Source: Arthur o. Little, 1983 (Appendix S).
% OF TIME
35.0
10.7 .... 1-8 -f{ ltJO,O
.-,

I .I
I f .
r r
I J· I
TAIL£ 1
COMMUNITY REGION
Kenai Peninsula
Anchorage
Matantu&ka-Susicna
Faix-banks
Southeast Fairbanks
Total
..
MARKET PEHETRATIOR OF ·~HE DEPD AUDIT P!OCRAH AS OF.' 1983.
HOMES AUDITS
11,740 2,659
70,363 16,.2.97
10,198 2,801
22,708. 6,202
2,490 734
39 J 188
HARKE~ PRODUCTION (%)
22.6
23.2
17.7
27.3
29.5
Source: Arthur D~ Little 1 1983 (Appendix S).

• ...
r f
r •
1\ l!
'tA.ILB 8 --~ "Y'
BASE YEALt
·PERIOD
J\il. , '80!
At.~& • ~ '80
S•lp., '80
Oc: t. ~ •so
Nov. • •so Dec., •so
Jan., '31
Feb<)' , '81
Mar.,. 1 81
Apr. • •st
Hay. '81
l.,tt~..:...;r •at
'Total. Te#t Year:
I Source: AML6P, 1982. ~
I
EHIRGi1' GEN£R.A'l1IOH FOR !.CLiP --- ,.,_
M.t,6P NIT GEN. ' PUll. GJJ:H. (KVH) (KWH) ._Ntf~ '5 .,
;; 311410440 43410797
3~1967600 42626788
~13371400 44974121
41815000 49635210
47803480 50876384
59459560 64276SOl
4774·1 520 52873639
42382280 49064429
39289000 50301269
38478600 47449439
404~~6200 42789541
3844.2120 43564710 -4926,57200 581843030
I '
I < '
I
J i , . •
r '
r ..
r ..
r •
PROOIWIATIC EHERGY CONSERVA1:101 I'_,JECTIOifS FOR MU.P HWh/Yil)
Proara Year ,,...,.,._
1981 1982 1983 1984 1985
Weatberizat io111 586 .. 762 93rJ 1.114 1,290
State Progr_. 879 1,759 2,199 2,683 3,078
Water Flow 200 464 464 464 464 lestrictic.me
Water Heat 3~4!2 3,922 3,922 3,922 3,922 Injec.tion
Hot Water NA NA 249 249 249 Heater Wrap
Street .Light 0 sss 1,859 3,307 4,788 Conversion
Transmission 0 0 4,119 8,732 9,256 Conversion
Boiler Pump 7,148 7,148 7,148 7,148 7,148 Convez:sion
TOTAL 12,735 14,609 20,896 27,619 30,195
% Ch•nge NA 14 .. 7 43.0 32.2 9.3 FrOil Previcuo Year
Source: AHL&P, 1983
1986 1987
1,466 1,641
.3,518 3,737
464 464
3,922 3.922
249 249
6,306 1,861
9,911 10,399
7,148 7,148
32,614 35$421
9.8 8.6

;I
I I
-I I I J
r ....
1981
1982
1983
1984
1985
1986
1987
PIOORAHAflC VS HARUT· DRIVU MERCY C'ASIRVATIOH PB.OJECTlONS IN ·THE A.KU.P SERVICE Ai!A
Proaraaatic Coaaervation (MWb)(% o,f total)
12,73S ,39.5
191,609 34.9
20,896 37.1
217619 41.1
30,195 40.4
32,614 40.6
35,421 41..0
Market Driven Conaervation (MWb)(%)
19,558 60 .. 5
27,243 6Sol
35,374 62CJ9
39;;560 58.9
44,536 59.6
48,133 59.4
50,940 59.0
Total (HW1i)(%)
32,194
41,853
56,289
67,133
74,730
81,015
86,363
Source: AKL&P, 1983
C•
100
100
100
100
100
100
100
' ; . If
I ..,..,,
I ·I ......,.
I
J I .\J;.<.•,
I
I ..
I ••
,,
~ABLE 11 -
Year
1981
1982
1983
.1984
1985
1986
1987
TOTAL PROJECTED ILECTillCtTY CONSER.VA'llOH 18 AHL&ll SER.VlCI ARIA BY Y!Ai
Projected Conaerv.-~ion (KWh)
32,294
41,853
56,269
6~,133
74,360
81.015
86,363
% Change Froa Previous Year
HA
2S.6
34o4
19.3
.10.8
8.4
6.6
Source: AML&P, 1983

•• I . I •. ·?,~
I
TAIL£ 12
I ··· ruel .. , -l!lect:-ieity
i2 Heatin& Oil
I coaL
.Propane
Stea
.Wocd
Birch SprU-ce
THE COST OF 1HERHAL ENERGY IM FAIRBANXS 1982
Dollar• Per Million BTU•
Neat Coat~nt Coat Per Unit of Mea•ut:e (BTUa/Unit) Unit*
lilowatt-Hour,KWb 3,414 Btu/K"Wb 8.371
Gallona, G 138,000 Btu/G 114.30f
Tons, T 17,400,000 Btu/T $83.00
Gallons, G
Pounds,
Cords, C Corda. C
lbs.
91,800 Btu/G 123.CJt
970 Btu/tb. 0.6Si
21,500,000 Btu/C**$100.00 1s,soo,ooo Btu/C** 92.50
Typical Heat ina Syct•
lffiei~ncy
100%
6S%
60%
70%
100%
52%*** 52.%***
Cost Per One Million BTU
$24.52
12.74
7,95
19.28
6.70
8.46 10.85
I.
*the co•t per unit assumes bulk delivery of fuel:. the cost for electricity is the MUS and GV!A averas~ tuuaed on 2,000 KWh delivered; the cost of #2 heatinv, oi.l ~•~waes autodelivery of 500 sallons; the ct>st of coal i.a for one ton ~f lump ~o•~ de!J.v~1:ed; the propane cost is for bulk delivery of beating propantt; ilnd the COl't of wood as~u!uts delivery of one cord cut to length or aplit.
I ** Air-dried,"''moitture content of 2·0% and 80 cubic feet of wood. per cord.
*** Assuaea an airtight. woodstove is used. Note: tbia table deals only with the cost co~apariaon between different fuel or energy
aourclle. The initial. cost of the individual heating ·~fstea (furnace or atove andotber haJ:>dware) ia not included ..
J Source: Fai;-banka North Star Borough Co•unity ReJearch Center, ~let.. 1982. :~,
I -

,., .. I ~ .. • TAIL! 13 • F _&& ,,..
f''
I I
I I I I ·iJ
I
1972
1973
107&. - ...........
1975
1977
1978
1979
1980
1981
1982
c
AVERAGE ANNUAL !L!CTI.tCl'tY COKSUMPtJ.OH PER HOUSEHOLD ON Til£ GYIA SYSTEM, 1972-1982
Annual Monthly Conswaption Conauaption Pereent (kvH) (kvll) Cbai11tl
13,919 1.160 +5 .• 6
14,479 1,207 +4.0
15,822 1,319 +9.3
17,332 1,444 +9.S
15,203 1,267 -12.3
14,2SS 1,188 -6 .. 2
lt,S74 96.5 -18.8
10,519 877 -9.1
9.767 td14 -7.1
9,080 757 -7.0
9,303 775 +2.5
I
I I Source: GVEA (Colon~li, 1983)
I
I ..

,,
•.. ·J~ . . 3 ;:;· ., ·:;c '.• /-·-· . I ·~:.. ~~ ltJIIIIr tmm~~~•
(l n
~·--------------~----~---- 111.1 ~ .. ~; --""""""'""--OAU:',_.~ __ ""'!' __ _
"~
I I I I
•• I I I I I I I I I •• . I
/!
l
' ......... , ' I CKICtCEO PAGI: --01 -- PAQD
...
Figure' PRICE Of 1"1100 ~!'f .. OIIAn-HOURS OF RESIDENTIAL ELECTRICifY
for Selected Utiltties
• ...
F~trblnks, Anchorage, and Seattle 1978-1982
120~---D------~~~~·--------------~-~--~ -
o._.-------~·----p--·-·-~~,--~----~------~~ Fall 1971
Flill 1979
Fall 1981
Fall 1982
" .•
... I " ... J r · flii I.& :alit••• ua n u u; rli t • .t