Embed Size (px)
Citation preview

doi.org/10.26434/chemrxiv.11105576.v1
Zn Doping Induced Band Gap Widening of Ag2O NanoparticlesArup Kumar De, Sourav Majumdar, Shaili Pal, Sunil Kumar, Indrajit Sinha
Submitted date: 26/11/2019 • Posted date: 02/12/2019Licence: CC BY-NC-ND 4.0Citation information: De, Arup Kumar; Majumdar, Sourav; Pal, Shaili; Kumar, Sunil; Sinha, Indrajit (2019): ZnDoping Induced Band Gap Widening of Ag2O Nanoparticles. ChemRxiv. Preprint.https://doi.org/10.26434/chemrxiv.11105576.v1
The present investigation widens the narrow bandgap of Ag2O to make it a semiconductor with moreattractive properties. A typical hydrothermal synthesis procedure was used to prepare Zn doped Ag2Onanoparticles. The X-ray diffraction analysis of the prepared powder samples showed that the latticeparameters of Ag2O increase with doping, indicating the occupation of interstitial positions by the dopantatoms. Density functional theory calculations also demonstrated the expansion of the Ag2O crystal lattice withthe dopant at an interstitial location. The bandgap of the Ag2O increases to 1.65 eV for 5-mole percent doping.The doped Ag2O nanoparticles photocatalytically degrade methyl orange under aerobic visible lightconditions. It appears that the rise in the percentage of higher valence Zn doping converts the originally p-typeto an n-type semiconductor.
File list (1)
download fileview on ChemRxivPAPER ARUP_261119.doc (3.75 MiB)

Zn doping induced band gap widening of Ag2O nanoparticles
Arup Kumar De, Sourav Majumdar, Shaili Pal, Sunil Kumar and Indrajit Sinha*
Department of Chemistry,
Indian Institute of Technology (Banaras Hindu University),
Varanasi 221005, India
*Corresponding author email: [email protected]
Abstract
The present investigation widens the narrow bandgap of Ag2O to make it a semiconductor with
more attractive properties. A typical hydrothermal synthesis procedure was used to prepare Zn
doped Ag2O nanoparticles. The X-ray diffraction analysis of the prepared powder samples
showed that the lattice parameters of Ag2O increase with doping, indicating the occupation of
interstitial positions by the dopant atoms. Density functional theory calculations also
demonstrated the expansion of the Ag2O crystal lattice with the dopant at an interstitial location.
The bandgap of the Ag2O increases to 1.65 eV for 5-mole percent doping. The doped Ag2O
nanoparticles photocatalytically degrade methyl orange under aerobic visible light conditions. It
appears that the rise in the percentage of higher valence Zn doping converts the originally p-type
to an n-type semiconductor.
Keywords: Hydrothermal synthesis, Doping, Bandgap widening, DFT calculations,
Photocatalysis
1. Introduction
One component photocatalysts suffer from several disadvantages. For instance, only
wideband semiconductors have conduction (CB) and valence band (VB) positions that offer
sufficient driving force for photo-oxidation or reduction reactions. However, such photocatalysts

suffer from recombination and photo-efficiency issues. They require UV radiation for photo-
excitation, which is only 4% of the solar spectrum [1]. Indeed nowadays, preference is for visible
light photocatalysts over those that need UV range radiation.
Doping of wideband semiconductors by metal or non-metal ions is one technique that has
been widely used in literature to tackle these issues. It introduces defects in the crystal lattice of
the pure phase semiconductor that may increase the catalytic activation of particular bonds in
substrate molecules. Alternatively, defects can trap the excitons and prevent their recombination.
Another significant effect is the introduction of new dopant bands that may narrow or widen the
bandgap of the photocatalyst. Such doping can result in the introduction of intermediate energy
levels that contract the original bandgap, making the initially wideband semiconductor photo-
responsive to visible light irradiation. Following this, quite a few researchers have reported
doping of ZnO, TiO2, and other wideband semiconductors by suitable metals such that this gives
rise to intermediate dopant bands [2]. For instance, reports show that the bandgap of ZnO can be
reduced to a value in the visible range by the addition of a small amount of Ag or Au [3].
The opposite approach is a less commonly followed strategy. In this case, a
semiconductor is doped with a metal ion to increase the bandgap of the native semiconductor. An
example of such bandgap widening is the Zn doping of CdS [4-5]. In these investigations, the
authors showed that Zn doping CdS modified the VB and CB positions of the resulting
semiconductor [5]. The change in the VB position was more than that in the CB energy.
Likewise, Ohtomo et al. [6] demonstrated that Mg doping of ZnO significantly widens the
bandgap to the solar-blind region. In another paper, Choopun et al. [7] reported ultra-wide
bandgaps above 5.0 eV in cubic phase MgxZn1-xO thin films. Recently, Xie et al. [8] investigated

the effect of lattice restraint on the widening of the ZnO bandgap due to the doping of Mg2+
cations along with Be ions as a co-dopant.
The present study follows this strategy and attempts to dope Zn2+ in the Ag2O lattice to
widen its bandgap. While silver oxide is a p-type semiconductor with a small bandgap, ranging
from 1.2 to 1.5 eV, ZnO is a semiconductor having a wide bandgap. It is essential to mention that
no attempt has been made to investigate this particular problem before. The main feature of Zn2+
ion doping in Ag2O is that the former ion is more than 50% smaller in size than Ag+ cations.
Given this size mismatch, the doping of only low percentages of Zn2+ ions in the Ag2O lattice is
possible. Also, the investigation of the position of Zn in the Ag2O lattice is a noteworthy issue.
The introduction of a dilute concentration of Zn salt under high temperature and pressure
conditions could lead to its inclusion in the Ag2O lattice. Generally, metal d-orbitals make the CB
and oxygen 2p orbitals usually compose the VB of a metal oxide semiconductor. In this case, the
3d orbitals of the dopant (Zn2+) would lie above the CB of Ag2O, which should lead to the
widening of the bandgap of the semiconductor.
Methods like vapor deposition, sol-gel, calcination, solvothermal, etc. have been
successfully used to fabricate doped metal oxides nanostructure [9-12]. The present study uses a
co-precipitation based hydrothermal technique to synthesize Zn doped Ag2O nanoparticles. For
the sake of comparison, the same protocol was utilized to prepare un-doped Ag2O nanoparticles
as well. X-ray diffraction (XRD) analysis and density functional theory (DFT) calculations were
employed to investigate the position of the dopant atoms in the Ag2O lattice. DFT studies were
used to calculate the formation energy due to the doping of Zn in substitutional and interstitial
sites of the Ag2O supercell. The doped Ag2O nanoparticle samples showed useful photocatalytic

properties for aerobic degradation of methyl orange (MO) and Rhodamine B (RhB) dyes in their
aqueous solutions. Active species responsible for such aerobic photocatalytic properties were
revealed by conducting the experiments in the presence of suitable scavenger molecules.
2. Experimental
2.1. Sample Preparation
A hydrothermal co-precipitation protocol was designed to fabricate Zn doped silver
oxides nanoparticles. The precursors were Zn(NO3)2.6H2O (SRLchem), AgNO3 (Merck), and
NaOH (Merck). All reagents were of analytical grade and used without further purification. All
synthesis procedures used double distilled water. Three different molar ratios of Zn(NO3)2.6H2O
and AgNO3 (corresponding to 1.25, 2.5, and 5% Zn salt mole percent in overall composition)
were dissolved in the proper volume of distilled water and mechanically stirred at 620
revolutions per minute. At the same time, 0.2 (M) NaOH solution was added in a drop-wise
manner until the pH of the mixture became nearly 11.24. Then the reaction mixture was
transferred to a stainless steel autoclave in an oven at 150oC. The heat treatment of the reaction
vessel at this temperature continued for 24 hours. Symbols A1, A2, and A3 respectively denote
the doped samples corresponding to 1.25, 2.5, and 5-mole percent Zn in the overall composition.
The same protocol was used to synthesize pure Ag2O (denoted by A0). In this instance, AgNO3
was the precursor.
2.2. Characterization
Rigaku SmartLab 9 kW powder type (RIGAKU Corporation) with Cu Kα irradiation
source ( λ = 1.54056 Å) at a scan rate of 5.09o 2θ min-1 with a step size of 0.01 recorded high-
resolution XRD patterns for identifying the crystalline phases formed in the synthesized

materials. The accelerating voltage and applied current was 40 kV and 200mA, respectively. The
Scherrer equation [13-14] (d = 0.9 λ/B cosθ) has been used to calculate the average crystallite
size (d) of the doped Ag2O. In this equation, d, λ, B and θ denote the crystallite size, Cu Kα
wavelength (0.154056 nm), full width at half maximum (FWHM) intensity in radians, and
Bragg’s diffraction angle, respectively. Transmission electron microscopy (TEM) and high-
resolution TEM (HRTEM) images were taken on Tecnai G2 20 TWIN (EDAX Inc.) using 200
kV accelerating voltage. Agilent Cary 60 UV-Vis spectrometer was used to record the absorption
spectrums in this research work. The HORIBA PTI QM-400 spectrofluorometer with xenon
lamp was used to record the photoluminescence spectrums of the samples.
2.3. Computational Details
All theoretical calculations utilized the plane-wave density functional theory (DFT) in
the Vienna ab-initio simulation package (VASP). The MedeA VASP software platform was used
to make the models investigated in the present research. The generalized gradient approximation
Perdew-Burke-Ernzerhoff (PBE) exchange-correlation functional was used to calculate the
defect formation energy, as in reference [15-16]. The Projected Augmented Wave (PAW)
pseudopotential modeled the interaction between valence electrons and core-shell electrons. All
calculations were performed using optimized parameters. The Kohn-Sham orbitals were
expanded using the plane-wave basis set to a cut-off value of 800 eV with a k-point
mesh size. The Ag2O unit cell was multiplied to construct a supercell, followed by its
geometry optimization and energy calculation. One model was built by substituting Zn for Ag at
a lattice position in the original Ag2O supercell (denoted by M1). In another model, Zn was

located in an interstitial site of the Ag2O supercell (represented by M2). The energies of the two
models were separately calculated after optimizing their geometry. Fig. 1a, 1b, and 1c displays
the optimized configurations of the Ag2O supercell, M1 and M2, respectively.
Fig. 1. Optimized supercells of a) Ag2O, b) Ag2O with Zn substituting an Ag, and c) Ag2O with
Zn placed in an interstitial position.
Equation (1) gave the formation energy for the model with the substitutional defect (M1), while
formula (2) was used to calculate the same for the interstitial defect system (M2).
(1)

(2)
Here is the defect formation energy, the energy of the M1,
and are the chemical potentials of Zn and Ag [17-18].
2.4. Photocatalytic Performance Measurements
The photocatalytic visible-light aerobic degradation of MO and RhB dyes was used to
assess the activity of the doped Ag2O samples. The reaction mixture of 2.4 ml aqueous solution
of MO (concentration 4.7 mg/L) and 0.23 mg photocatalyst were mixed in a standard quartz
cuvette of 1 cm path length. A few drops of 0.1 (M) HCl was added to reduce the pH of the
reaction mixture to ~3.0. In the case of RhB degradation 0.2 mg catalyst and 2.4 ml aqueous
solution of RhB (concentration 4.7 mg/L) was used. The cuvette was kept in a photocatalytic
chamber and irradiated with visible light from 14W Philips cool white LED bulb. The absorption
spectrum of the reaction mixture was measured after every two-minute interval. For the RhB
degradation, the same was done after every three minutes interval. The efficiency of all the
catalysts was compared estimating the turn over frequency (TOF).
3. Results and Discussion

Fig. 2a. Normalized HR-XRD patterns of pure Ag2O (A0) and different Zn doped Ag2O (A1, A2,
A3) samples.

Fig. 2b. Comparison of the Ag2O (111) peaks with the increase in Zn doping (from the HR-XRD
patterns).
3.1. Structural Properties
Fig. 2a shows high-resolution XRD spectra of undoped and Zn doped Ag2O nanoparticle
samples. All peaks in the XRD patterns of both doped and undoped Ag2O nanoparticle samples
match with the standard diffraction patterns of the FCC Ag2O (JCPDS Card No. 75-1532) phase.
These XRD patterns did not show any ZnO phase peaks. Fig. 2b compares the positions of peaks
corresponding to the (111) plane of various doped Ag2O samples. The diffraction peak for the
Ag2O (111) plane shifts slightly to the left, as Zn concentration increased from 1.25% to 5%. The
shift towards lower Bragg’s angle increases with the percentage of the Zn dopant in the Ag2O
sample. Thus, the change is maximum for 5% Zn doping and points towards the expansion of the
Ag2O lattice. When Zn goes into the Ag2O lattice, it can either go into an interstitial or a
substitutional position. Substitution of the larger ion by a smaller one will result in the
contraction of lattice, while the incorporation of a larger ion into a smaller interstitial void
expands the lattice [20]. Accordingly, the expansion of the lattice tells us that the dopant ions
occupy vacant interstitial positions in the Ag2O lattice.
Table 1 presents the change in the crystallite size and lattice parameters calculated from
the (111) plane XRD peak of doped and un-doped Ag2O powder. The average crystallite sizes of
the pure Ag2O and different Zn doped Ag2O samples were calculated using the Scherrer equation
from the broadening of Ag2O (111) facet diffraction peak. There are two unambiguous trends.
One that Ag2O lattice undergoes expansion with doping percentage. Fig. 3 displays the nature of
change in the lattice parameter with doping. If we consider only the doped samples (A1

onwards), then a linear relation following Vegard’s law may be invoked. Doping also results in a
decrease of the crystallite size. Reduction in crystallite size with doping is a frequently observed
phenomenon, due to an increase in lattice strain with defect concentration [8, 21].
Table 1 Crystallite sizes and lattice parameter values found from XRD patterns
Dopant concentrations(mol %)
Crystallite sizea (nm) Lattice parameter (Å)
0 86.8 4.7275
1.25 76.1 4.7278
2.5 73.4 4.7286
5 66.8 4.7305
Fig. 3. Variation in lattice parameter with Zn percentage.

3.2. DFT calculations
DFT calculations give additional evidence supporting the experimental findings. The
defect formation energy for substitutional and interstitial defect was found out to be 0.52 eV and
-0.96 eV, respectively, from the DFT calculations. Thus, interstitial doping is more favorable and
agrees with the experimental results. Table 2 presents the expansion in dimensions due to the
inclusion of a Zn in an interstitial position of the Ag2O supercell. The calculated parameters show
that the cubic Ag2O lattice expands in all three directions, but the increase is lesser in the ‘z’
direction.
Table 2 The change in supercell dimensions with Zn in an interstitial position,
Dimension Pure Ag2O After dopingX 9.620 9.678Y 9.620 9.678Z 9.620 9.647
3.3. TEM analysis
TEM images were used to analyze the morphology of the synthesized materials. The
representative images show the formation of approximately spherical nanoparticles in all
samples. TEM images of about 150 nanoparticles were sampled to calculate the particle size
distributions. Sample A1 displays the smallest average particle sizes (~14.9 nm). The average
particle size increases from 15.9 to 23.1 nm (Fig. 4d and 4f) with doping from 2.5 to 5%

(samples A2 and A3). Thus, the particles in sample A1 (with 1.25% doping) are much smaller
than those in A2 or A3.

Fig. 4. TEM images of Zn doped Ag2O samples a) A1, c) A2, and e) A3. Part b), d) and f) present
the particle size distributions corresponding to samples A1, A2, and A3, respectively.
The trend for change in particle sizes with doping is opposite to that found for crystallite
sizes, which decrease with doping. The mismatch between the average particle size obtained for
TEM images and XRD crystallite size is due to the following reason. The sample for TEM
imaging is prepared by re-dispersing the respective powder sample in an appropriate solvent by
sonication. Even after sonication, the larger nanoparticles in the sample tend to settle down. The
diluted supernatant of this sonicated suspension is taken to prepare the TEM sample on a carbon-
coated Cu grid. Since the liquid of the supernatant of the re-dispersed sample contains the
smaller nanoparticles, therefore, only these are seen in the TEM images.
3.4. Raman Analysis

Fig. 5. Comparison of the Raman spectrums of doped and un-doped Ag2O samples.
As mentioned earlier, doping increases the strain in the lattice that may disturb the crystal
symmetry. Such disruption also affects the vibrational modes of the crystal lattice. Thus, doping
may shift, broaden, and in some cases, may lead to the disappearance of some bands of the
Raman spectrum of the pure crystal. Fig. 5 presents the Raman spectra of the pure and Zn-doped
Ag2O samples. The Ag-lattice vibrational mode (i.e., phonons) causes the initial peak at 146 cm-
1. The next major peak is at 230 cm-1, which is due to Ag-O lattice vibration [22]. The peak shifts
increasingly to higher wavenumbers with dopant percentage, indicating that this is due to lattice
expansion as a consequence of Zn doping. Also, the shift to high wavenumber is characteristic of
p-type doping [23]. The Raman signals at 928 cm-1 and 971 cm-1 in the Ag2O samples are due to

chemisorbed atomic/molecular oxygen species. Other characteristic Ag-O stretching and bending
modes are at 1055 cm-1 and 1100 cm-1 [22]. The 1055 cm-1 peak also shifts to a higher
wavenumber value, but the change is more for sample A2. The peak movement is lesser for
sample A3. Moreover, the peaks at ~1100 cm-1 and higher wavenumbers disappear in Zn-doped
Ag2O samples. The presence of major Ag2O peaks and the absence of any new peak in all doped
samples indicates the incorporation of the dopant in the Ag2O crystal.
3.5. XPS analysis
XPS investigations were done to understand the chemical binding states in different
species in sample A0 and A3. Fig. 6 displays the high-resolution XPS spectra of Ag 3d and O1s
of Ag2O (A0) and Zn doped Ag2O (A3). In both doped and pure samples, spin-orbit coupling
splits the Ag 3d peak into Ag 3d5/2 and Ag 3d3/2 doublet. Fig. 6a shows that the deconvolution of
the Ag 3d5/2 region gives two peaks with binding energies (BE) 367.84 eV and 368.27 eV due to
Ag2O and Ag0, respectively. The Ag 3d3/2 region of the same plot exhibits peaks corresponding to
BE values 373.86 eV and 374.67 eV ascribed to Ag2O and Ag0, respectively.

Fig. 6. High resolution deconvoluted XPS spectra for (a,b) Ag 3d (samples A0 and A3) and (c,d)
O1s (samples A0 and A3).
The deconvolution of Ag 3d5/2 peak of the XPS of sample A3 displayed peaks at 367.30,
and 368.13 eV, while the Ag 3d3/2 gave peaks at 373.44 eV and 374.36 eV BE values. Compared
with pure Ag2O, the Ag 3d and O1s peaks of A3 shift toward lower BE values. It indicates an
increase in electron density on the surface of the material due to the incorporation of the dopant
in the semiconductor [25]. The shift towards lower BE values is characteristic of doping by an
element of lower electronegativity than Ag.

3.6. Bandgap analysis
Fig. 7. Tauc plots of prepared samples A1, A2, and A3.
Bandgap values are required to elucidate the mechanism of photocatalysis. Fig. 7 shows
the Tauc plots derived from corresponding UV-visible solid-state absorbance data of the doped
Ag2O nanomaterials. These plots were constructed using the following relation:
(4)
The intercept of the tangent to the linear part of the plot on the x-axis gives the bandgap energies
of these doped materials. Samples A1, A2, and A3 exhibit bandgap energies1.50, 1.64, and 1.65
eV, respectively. The bandgap increases with Zn doping and is significant compared to the
generally observed value of 1.2 (to 1.4) eV for pure Ag2O nanoparticles [26-27]. However, the
increase in bandgap from A2 to A3 is quite small.
3.7. Fluorescence spectra
Figure 8 displays the fluorescence spectra of the A0, A2, and A3 samples. The excitation
wavelength was 400 nm for all samples. The fluorescence intensities of doped materials (A2, A3)
were lower than pure Ag2O (A0). Moreover, the fluorescence intensity of A3 was lesser than A2.
Photoluminescence (PL) emission is directly associated with the recombination of photo-excited
holes and electrons. Hence, lower PL intensity demonstrates a delay in recombination and, thus,
better photocatalytic activity [24, 28-29]. It seems that doping Ag2O with Zn2+ ions causes the
formation of surface trapping sites due to the difference in metal ion charges. Such trap sites
selectively capture photo-excited electrons or holes and reduce photoluminescence intensity by
preventing recombination. Higher doping percentages induce more such trap sites that prevent
recombination.

Fig. 8. Photoluminescence spectra of samples A0, A2, and A3
3.8. Photocatalytic activity
The degradation of the typical water pollutants, methyl orange (MO) and Rhodamine-B
(RhB) under visible light irradiation was followed to evaluate the photocatalytic activity and
reusability of the prepared samples.

Fig. 9. a) Photocatalytic MO degradation of A3 b) Comparison of photocatalytic performance of
the different photocatalysts c) Recyclability of A3 d) Result of active species trapping
experiments for A3 catalyst in the presence of various scavenger molecules.
Fig. 9a displays the UV-visible absorbance spectra for aerobic MO degradation (in its
aqueous solution) and Fig. S2 (supporting information) shows the UV-visible absorption spectra
for aerobic RhB degradation in the presence of A3 photocatalyst. In the absence of catalysts,
there is no degradation of dyes. Supporting information in Fig. S1 indicates no degradation of

MO in the absence of catalysts. The photocatalyst degrades MO almost entirely in a short period
of ten minutes. Fig. 9b compares the photocatalytic performance of pure Ag2O and different
doped Ag2O photocatalysts. All considered samples degrade MO by zero-order kinetics. The rate
constant increases with doping, and photocatalyst A3 exhibits the best kinetics of degradation.
Surprisingly, MO degradation in the presence of pure Ag2O is faster than by samples A1 and A2.
Hence, the initial effect of doping is that it decreases their photocatalytic efficiency in
comparison to pure Ag2O. But on increasing the doping percentage to 5%, the photocatalytic
activity becomes better than pure Ag2O. The visible light degradation of RhB The trend is similar
for (Fig. S3 in supporting information). But in this case, the kinetics of RhB degradation is
nearly the same in the presence of A0 and A2, while it is again quickest for A3. Supporting
information in Table S1 and S2 gives details of the corresponding turnover frequency values and
rate constants for MO degradation and RhB degradation, respectively.
We carried out the active species trapping experiments using photocatalyst A3 to
understand the mechanism of photocatalytic reactions. Reactive species like OH., O2.- and h+ play
an essential role in the aerobic photocatalytic degradation of several organic pollutants. The
molecule p-benzoquinone (PBQ) was used to scavenge O2.- radical, potassium iodide (KI) was
the hole scavenger, and isopropyl alcohol (IPA) consumed the OH. radicals generated during
aerobic MO degradation reaction. Fig. 9d represents the results of the trapping experiments for
A3. The experimental results showed that the presence of KI inhibited the degradation of MO
more than other scavengers (Fig. 9d). It indicates that holes are the most generated reactive
species during the reaction. The superoxide scavenger, PBQ, also affects the photocatalytic
activity. Its effect is second only to KI. The order of activity of the reactive species for the
catalyst is h+ > O2.- > OH..

Visible light irradiation photo-excites the doped Ag2O, causing the generation of holes at
the VB and electrons at the CB. The main driving force for photocatalytic degradation of MO is
the production of holes (the reactive species). Thus, MO gets oxidized at the VB, resulting in the
transfer of its electrons to the photo-generated holes. Concurrently, the photo-excited electron
reduces the dissolved oxygen present in water to superoxide radicals, which then transform to
hydroxyl radicals (through well-known routes) to oxidize MO molecules. Since there is only
limited amount of oxygen in water, therefore, superoxide production does not dominate the MO
degradation process.
While the fluorescence spectrum intensity decreases with doping, the photocatalytic
activities for aerobic degradation of MO and RhB do not follow the same order. As mentioned
earlier, this implies that the surface trap sites increase with Zn2+ doping resulting in better charge
separation and, consequently, less intense fluorescence spectrums. Nevertheless, the
photocatalytic activity of undoped Ag2O (A0) is nearly the same as A2. Only A3 displays better
photocatalytic activity than A0. Photocatalytic activity is determined not only by charge
separation but also by the adsorption of the substrate on the catalyst surface. The present
photocatalytic reaction follows a photo-excited hole dominated substrate (MO or RhB) oxidation
mechanism. A vital step of such a mechanism is the adsorption of the substrate on to the surface
of the catalyst [30]. It seems that doping with Zn (up to 1.25-mole percent) weakens the surface
adsorption behavior of the catalyst towards these molecules. On further increase in doping, the
adsorption behavior becomes better than that of A0, and hence A3 displays the best aerobic
photocatalytic activity towards these dye molecules.

4. Conclusions
A hydrothermal procedure was used to dope Zn in Ag2O crystal lattice for widening the
bandgap of this semiconductor. The crystallite size of the samples decreased with an increase in
doping because of the disruption of lattice symmetry. XRD pattern analysis shows that the unit
cell parameters of Ag2O expand with Zn doping. DFT calculation results agree with this
conclusion. The formation energy of interstitially Zn-doped Ag2O is lesser than with Zn
substituting an Ag. DFT calculations also show Ag2O lattice expansion on interstitial Zn doping.
The bandgap of 5-mole percent Zn-doped Ag2O widens to 1.65 eV. Photoluminescence
spectroscopy points to increased charge separation with doping. The doped photocatalysts show
aerobic photocatalytic MO and RhB degradation. But, the photocatalytic activity exceeds that of
undoped Ag2O only after reaching the 5-mole percent doping level. The best-doped photocatalyst
also demonstrates excellent recyclability in photocatalytic efficiency. Reactive species trapping
experiments with individual scavenger molecules showed that the photocatalysis proceeds by a
photo-excited hole dominated mechanism. It appears that doping affects the substrate adsorption
behavior of the catalyst.
Acknowledgments
Arup Kumar De and Shaili Pal acknowledge financial support (SRF) received from IIT
(BHU). Authors thank Prof. Rajiv Prakash (School of Material Science and Technology) for the
measurement of solid-state UV-visible spectrum of the samples and Dr. Manoj Kumar
(Department of Chemical Engineering) for the fluorescence spectrum measurement of the
samples.
References
[1] J. Liu, H. Zhao, M. Wu, B. V. Schueren, Y. Li, O. Deparis, J. Ye, G. A. Ozin, T. Hasan, B.Su, Slow Photons for Photocatalysis and Photovoltaics, Adv. Mater. 29 (2017) 1605349.
[2] R. Janisch, P. Gopal, and N. A. Spaldin, Transition metal-doped TiO2 and ZnO—presentstatus of the field, J.Phys.:Condens. Matter 17 (2005) R657–R689.
[3] T. Lin, T. Chen, C. Cheng, and H. Lin, Y. Chen, Selectively enhanced band gap emissionin ZnO/Ag2O nanocomposites Opt. Express 17 (2009) 4342–4347.
[4] L. Ma, X. Ai, and X. Wu, Effect of substrate and Zn doping on the structural, optical andelectrical properties of CdS thin films prepared by CBD method, J. Alloys Compd. 691(2017) 399–406.
[5] F. Yang, N. Yan, S. Huang, Q. Sun, L. Zhang, and Y. Yu, Zn-Doped CdSNanoarchitectures Prepared by Hydrothermal Synthesis: Mechanism for EnhancedPhotocatalytic Activity and Stability under Visible Light, J. Phys. Chem. C 116 (2012)9078–9084.
[6] A. Ohtomo, M. Kawasaki, T. Koida, K. Masubuchi, and H. Koinuma, MgxZn1-xO as a II–VI widegap semiconductor alloy, Appl. Phys. Lett. 72 (1998) 19.
[7] S. Choopun, R. D. Vispute, W. Yang, R. P. Sharma, and T. Venkatesan, Realization of bandgap above 5.0 eV in metastable cubic-phase MgxZn1-xO alloy films, Appl. Phys. Lett. 80(2002) 9.
[8] A. Xie, D. Yang, X. Li, and H. Zeng, Lattice restraint induced ultra-large bandgapwidening of ZnO nanoparticles, J. Mater. Chem. C 7 (2019) 8969–8974.
[9] J. Campos-delgado, I. O. Maciel, D. A. Cullen, D. J. Smith, A. Jorio, M. A. Pimenta, H.Terrones, M. Terrones, Chemical Vapor Deposition Synthesis of N-, P-, and Si-DopedSingle-Walled Carbon Nanotubes, ACS NANO 4 (2010) 1696–1702.
[10] T. K. Pathak, R. E. Kroon, and H. C. Swart, Photocatalytic and biological applications ofAg and Au doped ZnO nanomaterial synthesized by combustion, Vacuum, 157 (2018)508–513.
[11] S. G. Kwon, S. Chattopadhyay, B. Koo, P. C. S. Claro, T. Shibata, F. G. Requejo, L. J.Giovanetti, Y. Liu, C. Johnson, V. Prakapenka, B. Lee, E. V. Shevchenko, OxidationInduced Doping of Nanoparticles Revealed by in Situ X-ray Absorption Studies, Nano.Lett. 16 (2016) 3738–3747.

[12] L. Guo, F. Chen, N. Xie, C. Wang, X. Kou, Y. Sun, J. Ma, X Liang, Y Gao, G Lu, Metal–organic frameworks derived tin-doped cobalt oxide yolk-shell nanostructures and their gassensing properties, J. Colloid Interface Sci. 528 (2018) 53–62.
[13] A. L. Patterson, The Scherrer Formula for X-Ray Particle Size Determination, Phys. Rev.56 (1939) 978–982.
[14] L. Alexander, H. P. Klug, Determination of Crystallite Size with the X-Ray Spectrometer,J. Appl. Phys. 21 (1950) 137.
[15] J. P. Perdew, K. Burke, and M. Ernzerhof, Generalized Gradient Approximation MadeSimple, Phys. Rev. Lett. 77 (1996) 3865–3868.
[16] J. P. Perdew and Y. Wang, Accurate and simple analytic representation of the electron-gascorrelation energy, Phys. Rev. B 45 (1992) 244–249.
[17] K. Matsunaga, First-principles calculations of intrinsic defects in Al2O3, Phys. Rev. B 68(2003) 085110.
[18] S. B. Zhang, S. Wei, and A. Zunger, Intrinsic n-type versus p-type doping asymmetry andthe defect physics of ZnO, Phys. Rev. B 63 (2001) 075205.
[19] J. A. Wasastjerna, Ionic radius, Comm. Phys.-Math., Soc. Sci. Fenn. 38 (1923) 1–25.
[20] Q. Li, H. Meng, P. Zhou, Y. Zheng, J Wang, J. Yu, J. Gong, Zn1−xCdxS Solid Solutions withControlled Bandgap and Enhanced Visible-Light Photocatalytic H2-Production Activity,ACS Catal., 3 (2013) 882–889.
[21] N. R. Yogamalar and A. C. Bose, Burstein–Moss shift and room temperature near-band-edge luminescence in lithium-doped zinc oxide, Appl. Phys. A 103 (2011) 33–42.
[22] I. Martina, R. Wiesinger, D. Jembrih-Simburger, and M. Schreiner, Micro-ramancharacterization of silver corrosion products: Instrumental set up and reference database,e-PS, 9 (2012) 1–8.
[23] V. P. Pham and G. Y. Yeom, Recent Advances in Doping of Molybdenum Disulfide:Industrial Applications and Future Prospects, Adv. Mater. 28 (2016) 9024–9059.
[24] Q. Wang, H. Jiang, S. Zang, J. Li, and Q. Wang, Gd, C, N and P quaternary doped anatase-TiO2 nano-photocatalyst for enhanced photocatalytic degradation of 4-chlorophenol undersimulated sunlight irradiation, J. Alloys Compd. 586 (2014) 411–419.
[25] J. Low, C. Jiang, B. Cheng, S. Wageh, A. A. Al-ghamdi, and J. Yu, A Review of Direct Z-Scheme Photocatalysts, Small Methods, 1 (2017) 1700080.

[26] X. Wang, S. Li, H. Yu, J. Yu, and S. Liu, Ag2O as a New Visible-Light Photocatalyst: Self-Stability and High Photocatalytic Activity, Chem. Eur. J. 17 (2011) 7777–7780.
[27] C. Yu, G. Li, S. Kumar, K. Yang, and R. Jin, Phase Transformation Synthesis of NovelAg2O/Ag2CO3 Heterostructures with High Visible Light Efficiency in PhotocatalyticDegradation of Pollutants, Adv. Mater. 26 (2014) 892–898.
[28] K. Gupta, R. P. Singh, A. Pandey, and A. Pandey, Photocatalytic antibacterial performanceof TiO2 and Ag-doped TiO2 against S. aureus. P. aeruginosa and E. coli, Beilstein J.Nanotechnol. 4 (2013) 345–351.
[29] V. Kumar, J. Prakash, J. P. Singh, K. H. Chae, C. Swart, O. M. Ntwaeaborwa, H. C. Swart,V. Dutta, Role of silver doping on the defects related photoluminescence and antibacterialbehaviour of zinc oxide nanoparticles, Colloids Surfaces B: Biointerfaces, 159 (2017)191–199.
[30] J. Yan, G. Wu, N. Guan, L. Li, Z. Li, X. Cao, Understanding the effect of surface/bulkdefects on the photocatalytic activity of TiO2: anatase versus rutile, Phys. Chem. Chem.Phys. 15 (2013) 10978–10988.

Supporting Information
The rate constant is not a suitable parameter for comparing the photocatalytic activity of
two different materials when the order of the reaction is not the same. Also, the rate constant
calculation does not take into account the catalyst quantity. Turnover frequency (TOF) is better
for measuring the catalyst[44-46] activity. The following expression gives the calculation of TOF.
Turn Over Frequency ………………..(1)
Table S1. A comparison of turnover frequencies (TOF) of the visible light aerobic degradation of
MO on the prepared doped Ag2O photocatalysts.
Photocatalyst Light source The apparent rate
constant (min-1)
TOF (moles g-1min-1)
A0 (0 % dopant) Cool white LED
(0.1470 W/cm2,
visible range)
0.0763 2.54 x 10⁻⁵
A1 (1.25 % dopant) Same 0.0254 8.01 x 10⁻⁶
A2 (2.5 % dopant) Same 0.0488 1.60 x 10⁻⁵
A3 (5 % dopant) Same 0.1099 2.72 x 10⁻⁵
Table S2. A comparison of turnover frequencies (TOF) of the visible light aerobic degradation of
MO on the prepared doped Ag2O photocatalysts.

Photocatalyst Light source The apparent rate
constant (min-1)
TOF (moles g-1min-1)
A0 (0 % dopant) Cool white LED
(0.1470 W/cm2,
visible range)
0.0491 1.85 x 10⁻⁵
A1 (1.25 % dopant) Same 0.0244 5.68 x 10⁻⁶
A2 (2.5 % dopant) Same 0.0475 1.21 x 10⁻⁵
A3 (5 % dopant) Same 0.0635 1.99 x 10⁻⁵
Fig. S1 UV-visible of an aqueous solution of MO under cool white LED visible light irradiation
(without photocatalyst). In the absence of photocatalyst, there is no change in the intensity of the
MO UV-visible absorbance under light.

Fig. S2 Change in the UV-visible spectrum of RhB (showing its degradation) on visible light
irradiation with time in the presence of A3 photocatalyst sample
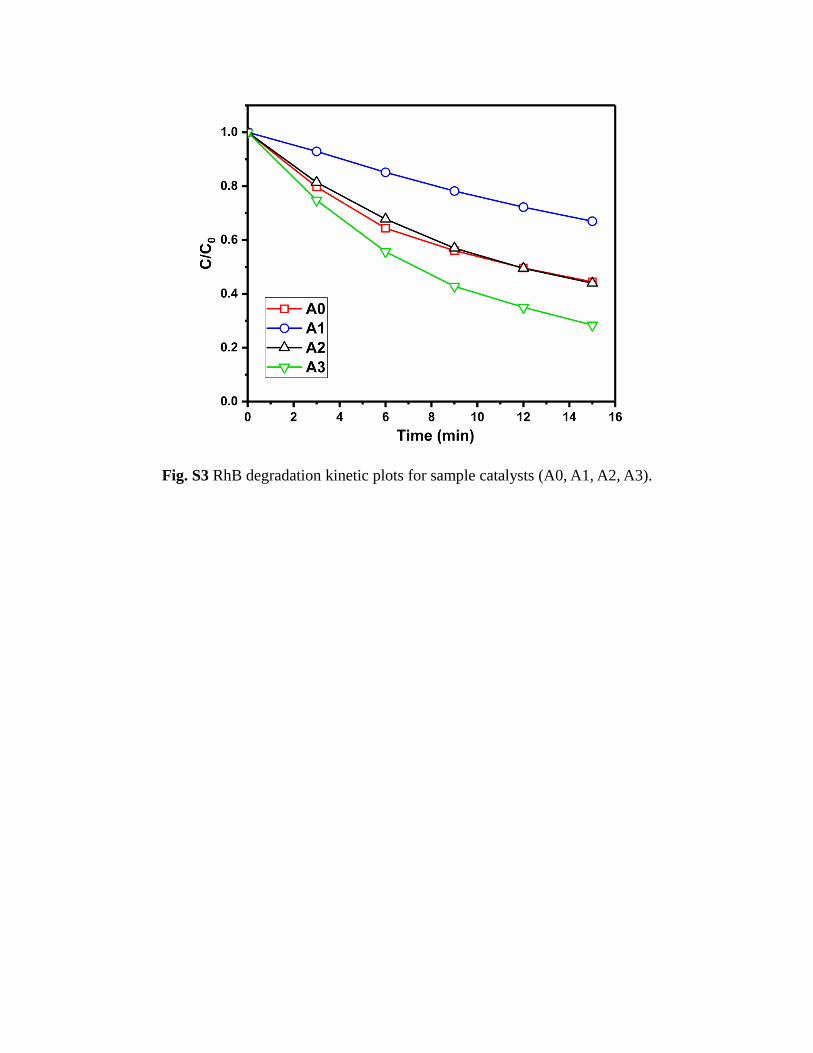
Fig. S3 RhB degradation kinetic plots for sample catalysts (A0, A1, A2, A3).

download fileview on ChemRxivPAPER ARUP_261119.doc (3.75 MiB)