Embed Size (px)
Citation preview

Zinc oxalate nanorods: a convenient precursor to uniform nanoparticles of ZnO
This article has been downloaded from IOPscience. Please scroll down to see the full text article.
2006 Nanotechnology 17 1236
(http://iopscience.iop.org/0957-4484/17/5/012)
Download details:
IP Address: 132.236.27.111
The article was downloaded on 26/05/2012 at 05:20
Please note that terms and conditions apply.
View the table of contents for this issue, or go to the journal homepage for more
Home Search Collections Journals About Contact us My IOPscience
INSTITUTE OF PHYSICS PUBLISHING NANOTECHNOLOGY
Nanotechnology 17 (2006) 1236–1240 doi:10.1088/0957-4484/17/5/012
Zinc oxalate nanorods: a convenientprecursor to uniform nanoparticles of ZnOTokeer Ahmad1, Sonalika Vaidya1, Niladri Sarkar2,Subhasis Ghosh2 and Ashok K Ganguli1,3
1 Department of Chemistry, Indian Institute of Technology, Hauz Khas, New Delhi 110016,India2 School of Physical Sciences, Jawaharlal Nehru University, New Delhi 110067, India
E-mail: [email protected]
Received 18 October 2005Published 7 February 2006Online at stacks.iop.org/Nano/17/1236
AbstractNanorods of zinc oxalate dihydrate have been synthesized using the reversemicellar route. These nanorods were decomposed at 450 ◦C in air to obtainnanoparticles of zinc oxide. Transmission electron microscopy shows thenanorods to be 120 nm in diameter and 600 nm in length. The ZnOnanoparticles are 55 nm in diameter. The photoluminescence studies showtwo peaks at 370 and 403 nm which can be ascribed to free excitonictransition and donor–acceptor pair transition respectively. The temperaturedependent PL intensity shows an anomalous non-monotonous temperaturedependence probably due to two different optical processes.
(Some figures in this article are in colour only in the electronic version)
1. Introduction
Nanomaterials have been fascinating the world of science inthe last ten years. Several oxide nanoparticles are predictedto have tremendous applications in the future. Among themZnO is considered one of the best oxides to be exploited atnano-dimensions. Zinc oxide has the wurtzite structure atroom temperature which transforms to the rock salt structureat high pressure. X-ray diffraction [1, 2] and optical studies [3]indicate that ZnO transforms from hexagonal to cubic structureat pressures of 100–125 kbar at 300 K. The dependence of theproperties on the size of particles has led to many interestingapplications of these nanomaterials [4] especially by tuning theband gap of semiconductors [5, 6]. ZnO is a wide band gapII–VI semiconductor. This property renders it as a phosphorin field emissive displays [7, 8] and in cathodoluminescentdevices [9]. The large band gap of ZnO is utilized in dyesensitized solar cells (DSSCs). The material used in DSSCsis transparent to certain solar radiations and this property ofZnO (large band gap) is utilized as an alternative material toTiO2 for solar cell applications [10]. ZnO also finds a widevariety of applications in varistors [11]. A number of syntheticroutes have been employed to synthesize ZnO nanoparticles,
3 Author to whom any correspondence should be addressed.
such as sol–gel chemistry [12–16], spray pyrolysis [17],metal–organic chemical vapour deposition [18, 19], cathodicelectrodeposition [20, 21] and plasma pyrolysis [22].
An important route to synthesize nanoparticles is usingmicroemulsions. A microemulsion system, which consists ofan oil phase, a surfactant phase and an aqueous phase, is athermodynamically stable isotropic dispersion of the aqueousphase in the continuous oil phase [23, 24]. The size ofthe aqueous droplets is in the range of 5–20 nm, renderingthe microemulsion systems optically transparent. Chemicalreactions, such as precipitation and co-precipitation, will takeplace when droplets containing the desirable reactants collidewith each other. Each of these aqueous droplets in the twomicroemulsion systems will thus be acting as a nanosizedreactor for forming nanosized precursor particles [25, 26].The reverse micellar route is of special importance since itprovides homogeneous and mono-disperse nanoparticles. It ispossible to control not only the size but also the morphologyof the nanoparticles by proper choice of the compositionof the microemulsion system. Apart from the benefit ofthe low temperature of the reverse micellar technique, ourmethodology using reverse micelles results in highly uniformrods of the metal oxalates [27], whereas the direct chemicalreaction of metal salt and oxalic acid lead to nanoparticlesand not nanorods [28, 29]. The qualitative explanation for the
0957-4484/06/051236+05$30.00 © 2006 IOP Publishing Ltd Printed in the UK 1236
Zinc oxalate nanorods: a convenient precursor to uniform nanoparticles of ZnO
formation of nanorods is discussed elsewhere [27], where theassembly of surfactant molecules on the linear structure of themetal oxalates [30, 31] leads to the formation of nanorods.
There have been reports on the synthesis of metal oxidesthrough the reverse micellar route of oxides [32–36]. Severalimportant nanorods of oxalates and nanoparticles of oxide(magnetic and dielectric) powders have also been successfullyprepared by us [27, 37–41] and others [42–44] from water-in-oil microemulsions. It has been shown that the microemulsion-derived nanorods and nanoparticles of oxide powders are finerin particle size, narrower in particle size distribution, higher insinterability and more homogeneous in composition.
In this paper we report the synthesis of zinc oxalatenanorods and zinc oxide nanoparticles using the reverse micel-lar route. These nanorods and nanoparticles have been charac-terized using powder x-ray diffraction (PXRD), thermogravi-metric and differential thermal analysis (TGA/DTA), trans-mission electron microscopy (TEM), atomic force microscopy(AFM) and dynamic light scattering (DLS) studies. The opticalproperties of ZnO have been studied as a function of tempera-ture in the range of 20–300 K.
2. Experimental details
Zinc oxalate precursor was prepared using the reverse micellarroute. Microemulsions with cetyltrimethyl ammoniumbromide (CTAB) as the surfactant, 1-butanol as the co-surfactant, isooctane as the non-polar phase and 0.1 M aqueoussolutions of Zn2+ and C2O2−
4 were prepared. MicroemulsionI contained 0.1 M zinc nitrate solution while microemulsionII contained 0.1 M ammonium oxalate solution. The weightfraction of various constituents in the microemulsion was16.76% of CTAB, 13.9% of n-butanol, 59.29% of isooctaneand 10.05% of aqueous phase. The two microemulsions wereslowly mixed and stirred overnight on a magnetic stirrer. Theprecursor was separated from the surfactant and non-polarphase by centrifugation. The precursor was then washed with a1:1 chloroform/methanol mixture to remove the surfactant andother impurities if present and dried in an oven at 120 ◦C for1 h. The precursor was calcined at 450 ◦C for 6 h to obtainnanoparticles of ZnO.
Powder x-ray diffraction studies (PXRD) were carriedout on a Bruker D8 Advance diffractometer using Ni filteredCu Kα radiation. Normal scans were recorded with a stepsize of 0.02◦ and step time of 1 s. Raw data was subjectedto background corrections and Kα2-lines were stripped off.The grain size was calculated using the Scherrer’s formula [45](t = 0.9λ/B cos θ) where t is the diameter of the grain, λ isthe wavelength of the radiation (λ for Cu Kα is 1.5418 A) andB is the line broadening which is measured from the broadenpeak at full width at half maxima (FWHM) and calculated bythe Warren’s formula [46, 47]; B2 = (B2
M–B2S) where BM is
the full width at half maxima of the sample and BS is the fullwidth at half maximum of the standard quartz with a grain sizeof around 2 µm. The cell parameters were determined using aleast square fitting procedure on all reflections using quartz asthe external standard.
TGA/DTA experiments were carried out on Perkin ElmerTGA/DTA system on well ground samples in flowing nitrogenatmosphere with a heating rate of 5 ◦C min−1. The results
obtained from the TGA/DTA analysis were used to obtain thecalcination temperature of the oxalate precursor (450 ◦C).
DLS experiments were performed on a particle-sizeanalyzer, model Nano ZS90 (Malvern Instruments, UK). AHe–Ne laser with a power of 4 mW was used as a light source.All the measurements were carried out at a scattering angleof 90◦ and a temperature of 25 ◦C, which was controlled bya thermostat. A dilute sample was prepared by dispersing thepowder in water followed by ultrasonic treatment for 10 min.
TEM studies were carried out using a JEOL JEM 200CXelectron microscope operated at 200 kV. TEM specimens wereprepared by dispersing the powder in acetone by ultrasonictreatment. A few drops were poured onto a porous carbon filmsupported on a copper grid, then dried in air. Contact modeAFM studies were carried out using a Digital Instruments,Nanoscope III-A electron microscope. AFM specimens wereprepared by dispersing the powder in acetone by ultrasonictreatment, dropping onto a silicon substrate film, and thendrying in air.
The samples were housed in an optical cryostat withfront surface excitation and emitted radiation was collectedfor photoluminescence (PL) spectroscopy. The samples werekept in a closed-cycle He refrigerator and excited with 325 nmline of a He–Cd laser. The PL signal was collected into a0.46 m Jobin-Yvon grating monochromator in the wavelengthregion of 340–900 nm and detected with a UV-enhancedSi detector. The PL data were processed using a lock-intechnique. The spectral response of the system was calibratedusing a blackbody source.
3. Result and discussion
The colourless transparent microemulsions of Zn2+ andC2O2−
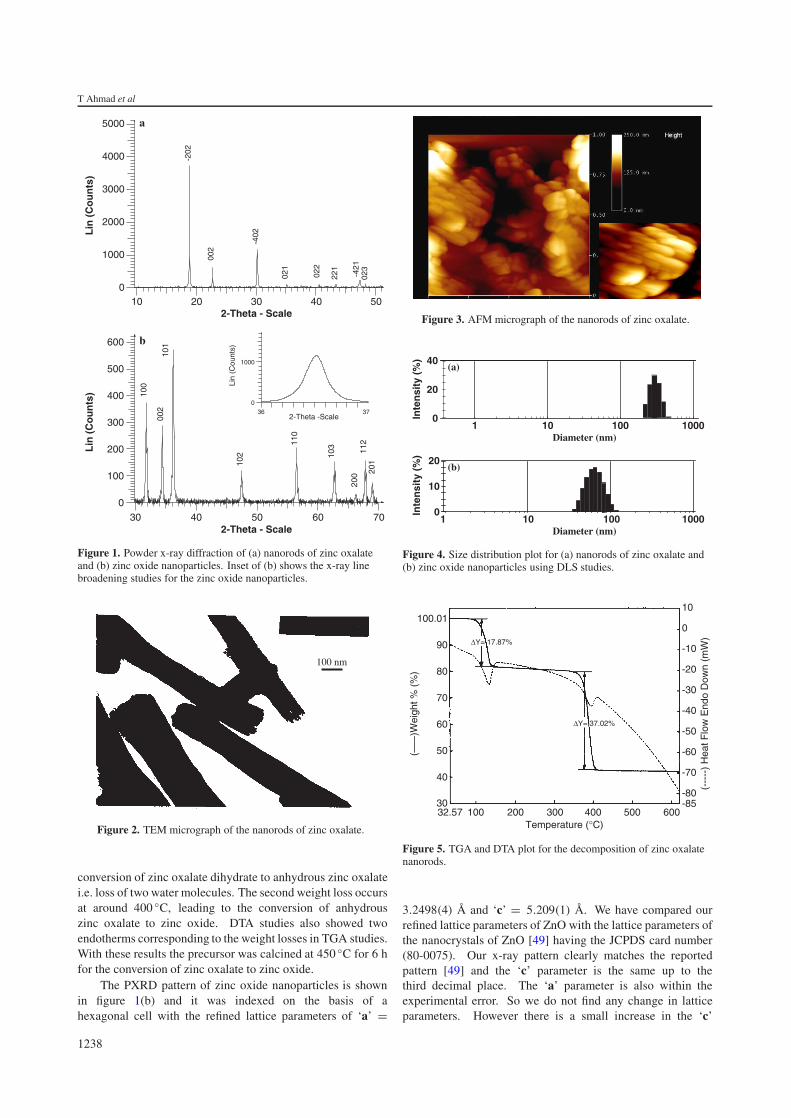
4 were slowly mixed and the resulting colour of themicroemulsions becomes white. After the centrifugation,washing and drying process we obtained pure zinc oxalatedihydrate, which is shown by the XRD pattern (figure 1(a)).All the reflections in the pattern could be indexed on thebasis of a monoclinic cell reported for zinc oxalate dihydrate(JCPDS # 25-1029). TEM studies showed the formation ofnanorods of zinc oxalate dihydrate (figure 2). The averagedimensions of the nanorods were 120 nm in diameter and600 nm in length. This aspect ratio of 5:1 in our nanorodsis close to that normally observed in other reports of 4:1 forcopper oxalate nanorods [27] and 5:1 for ZnS nanorods [48].The aspect ratio of nanorods may be larger (25:1) as is knownfor manganese oxalate nanorods [37]. Figure 3 shows theAFM micrograph of zinc oxalate dihydrate nanorods whichcorroborates the TEM results. From the AFM micrograph, therods appear to be bunched together. The DLS studies of zincoxalate nanorods have been shown in figure 4(a). The averagesize obtained by the size distribution plot was ∼375 nm whichsupports the TEM studies. Zinc oxalate nanorods show a sizedistribution in the range of 200–500 nm. It is known that theDLS technique averages out the dimensions in the form of anequivalent sphere and hence does not give us the distributionof lengths or widths of the nanorods.
TGA of the oxalate precursor obtained using the reversemicellar route, showed two weight losses (figure 5). Thefirst weight loss occurs at 120 ◦C, which corresponds to the
1237
T Ahmad et alL
in (
Co
un
ts)
Lin
(C
ou
nts
)
-202
002
-402
021
022
221
-421
023
100
002
101
102
110
103
200
112
201
Lin
(Cou
nts)
3736
10 20 30 40 500
1000
2000
3000
4000
5000
2-Theta - Scale
2-Theta - Scale
0
100
200
300
400
500
600
30 40 50 60 70
2-Theta -Scale
0
1000
a
b
Figure 1. Powder x-ray diffraction of (a) nanorods of zinc oxalateand (b) zinc oxide nanoparticles. Inset of (b) shows the x-ray linebroadening studies for the zinc oxide nanoparticles.
100 nm
Figure 2. TEM micrograph of the nanorods of zinc oxalate.
conversion of zinc oxalate dihydrate to anhydrous zinc oxalatei.e. loss of two water molecules. The second weight loss occursat around 400 ◦C, leading to the conversion of anhydrouszinc oxalate to zinc oxide. DTA studies also showed twoendotherms corresponding to the weight losses in TGA studies.With these results the precursor was calcined at 450 ◦C for 6 hfor the conversion of zinc oxalate to zinc oxide.
The PXRD pattern of zinc oxide nanoparticles is shownin figure 1(b) and it was indexed on the basis of ahexagonal cell with the refined lattice parameters of ‘a’ =
Figure 3. AFM micrograph of the nanorods of zinc oxalate.
Inte
nsi
ty (
%)
Inte
nsi
ty (
%)
Diameter (nm)1 10 100 1000
Diameter (nm)1 10 100 1000
0
20
40
0
10
20
(a)
(b)
Figure 4. Size distribution plot for (a) nanorods of zinc oxalate and(b) zinc oxide nanoparticles using DLS studies.
100.01
90
80
70
60
50
40
30
10
-10
0
-20
-30
-40
-50
-60
-70
-85-80
32.57 100 200 300Temperature (°C)
(–––
)Wei
ght %
(%
)
(---
--)
Hea
t Flo
w E
ndo
Dow
n (m
W)
∆Y= 37.02%
∆Y= 17.87%
400 500 600
Figure 5. TGA and DTA plot for the decomposition of zinc oxalatenanorods.
3.2498(4) A and ‘c’ = 5.209(1) A. We have compared ourrefined lattice parameters of ZnO with the lattice parameters ofthe nanocrystals of ZnO [49] having the JCPDS card number(80-0075). Our x-ray pattern clearly matches the reportedpattern [49] and the ‘c’ parameter is the same up to thethird decimal place. The ‘a’ parameter is also within theexperimental error. So we do not find any change in latticeparameters. However there is a small increase in the ‘c’
1238

Zinc oxalate nanorods: a convenient precursor to uniform nanoparticles of ZnO
100 nm
Figure 6. TEM micrograph of zinc oxide nanoparticles.
0
0.0002
0.0004
0.0006
2.0 2.5 3.0 3.5 4.0Energy(eV)
PL
Inte
nsi
ty(a
rb. u
nit
)
Figure 7. PL spectra at 20 K (empty circles). Three deconvolutedGaussian peaks centred at 3.34, 3.04 and 2.78 eV are also shown.
parameter of our nanocrystalline ZnO compared to the bulkvalue [50]. This may be explained due to the size effect onthe lattice parameters. The decrease in the grain size cancause lattice expansion [51, 52]. This has been explained bythe increase in number of surface atoms of the nanoparticlesleading to atomic disorder and reduced coordination of thesurface atoms causing the lattice expansion.
The grain size was evaluated from x-ray line broadeningstudies (inset of figure 1(b)) and it was found to be 48 nm.The value of grain size from line broadening studies is inclose agreement with the TEM studies. Transmission electronmicroscopy (figure 6) showed spherical particles with anaverage grain size of 55 nm. A uniform size distribution ofZnO nanoparticles is obtained from DLS studies (figure 4(b)).The average size obtained was 60 nm with a range of sizes(40–100 nm) which supports the TEM studies.
Figure 7 shows the photoluminescence (PL) spectra ofnanocrystalline ZnO. The PL spectra has been deconvolutedand it is clear that there are three band edge transitions at3.34, 3.04 and 2.78 eV. The peak at 3.34 eV is due to the freeexcitonic transition in ZnO. The other peaks at 3.04 eV and2.78 eV are due to free-to-bound (FB) and donor–acceptor pair(DAP), respectively [53]. A weak peak at 2.5 eV is due to thechromium present in the quartz substrate. The strong peak ofthe PL intensity suggests excellent sample quality. Howeverthere is no quantum confinement effect as is normally present
0.04
0.05
0.06
0.07
0 100 200 300Temperature(K)
Inte
gra
ted
PL
Inte
nsi
ty(a
rb. u
nit
)
Figure 8. Integrated PL intensity plot versus temperature. Theconnecting line is a guide for the eyes.
in 2–3 nm sized nanoparticles [54, 55]. This is not unexpectedbecause the particle size of ZnO in this study is much larger(∼55 nm).
Figure 8 shows the temperature dependence of the PLspectra. The observed non-monotonic temperature dependenceof the excitonic spectra is not anticipated, because PLintensity should decrease with increasing temperature due tothermal quenching of free excitons. Similar dependence hasbeen observed in porous silicon [56]. This non-monotonictemperature dependence of PL intensity can be described byexchange splitting of the excitonic level between three-folddegenerate triplet state and the higher singlet state. At lowtemperature only the lower lying triplet state is occupied andthe radiative decay rate is small, because the optical transitionfrom a pure triplet state is forbidden, but, due to spin–orbit interaction (mixes triplet and singlet states) the opticaltransition becomes allowed with very low quantum yield. Asthe temperature increases, the higher singlet state is occupiedand quantum yield of the optical transition increases and attainsa maximum, but, further increase in temperature leads tothermal quenching of the bound states resulting in a decreaseof PL intensity.
4. Conclusion
Nanorods of zinc oxalate dihydrate have been synthesizedusing the reverse micellar method involving CTAB as thesurfactant. Zinc oxide nanoparticles have been obtained bythermal decomposition of oxalate nanorods at 450 ◦C in air.The grain size of ZnO was in the range of 50–55 nm asdetermined from the x-ray, TEM and DLS studies. PL studiesshow the good quality of ZnO nanoparticles and also show ananomalous non-monotonous behaviour which is probably dueto two mechanisms.
Acknowledgments
AKG thanks the Department of Science & Technology, Indiafor financial support. TA and SV thank CSIR, Govt of Indiafor a fellowship.
1239
T Ahmad et al
References
[1] Class W, Iannucci A and Nesor H 1966 Norelco Report. 13 87[2] Bates C H, White W B and Roy R 1962 Science 137 993[3] Edwards A L, Slykhouse T E and Drickamer H G 1959 J. Phys.
Chem. Solids 11 140[4] Andres R P et al 1989 J. Mater. Res. 4 704[5] Wang Y and Herron N 1990 Phys. Rev. B 42 7253[6] Johanson K R, McLendon G and Marchetti A P 1991 Chem.
Phys. Lett. 179 321[7] Vanheusden K, Saeger C H, Warren W L, Tallant D R and
Voight J A 1996 Appl. Phys. Lett. 68 403[8] Vanheusden K, Warren W L, Saeger C H, Tallant D R and
Voight J A 1996 J. Appl. Phys. 79 7983[9] Bachir S, Sandouly C, Kossanyi J and Ronfard-Haret J C 1996
J. Phys. Chem. Solids 57 1869[10] Burnside S D 2000 J. Mater. Sci. 11 355[11] Gupta T K 1990 J. Am. Ceram. Soc. 73 1817[12] Hoyer P and Wellar H 1994 Chem. Phys. Lett. 221 379[13] Bahnemann D W, Kormann C and Hoffmann M R 1987
J. Phys. Chem. 91 3789[14] Haase M, Wqeller H and Henglein A 1988 J. Phys. Chem.
92 482[15] Sakohara S, Tickanen L D and Anderson M A 1992 J. Phys.
Chem. 96 11086[16] Spanhel L and Anderson M A 1991 J. Am. Chem. Soc.
113 2826[17] De Merchant J and Cocivera M 1995 Chem. Mater. 7 1742[18] Roth A P and Williams D F 1981 J. Appl. Phys. 52 6685[19] Maruyama T and Shionoya J 1992 J. Mater. Sci. Lett.
11 170[20] Izaki M and Omi T 1996 Appl. Phys. Lett. 68 2439[21] Peulon S and Lincot D 1996 Adv. Mater. 8 166[22] Lin Y, Tang Z and Zhang Z 2000 J. Am. Ceram. Soc.
83 2869[23] Chieng T H, Gan L M, Chew C H and Ng S C 1995 Polymer
36 1941[24] Fang J, Wang J, Ng S C, Chew C H and Gan L M 1997
Nanostruct. Mater. 8 499[25] Luisi P L and Straub B E 1984 Reverse Micelles (New York:
Plenum)[26] Kuiry S C and Seal S 2004 Encyclopedia of Nanoscience and
Nanotechnology ed H S Nalwa (California, USA: AmericanScientific Publishers) p 369
[27] Ahmad T, Chopra R, Ramanujachary K V, Lofland S E andGanguli A K 2005 J. Nanosci. Nanotechnol. 5 1840
[28] Xu C, Liu Y, Xu G and Wang G 2002 Mater. Res. Bull.37 2365
[29] Xu C, Xu G, Liu Y and Wang G 2002 Solid State Commun.122 175
[30] Song S Y, Ma J F, Yang J, Cao M H and Li K C 2005 Inorg.Chem. 44 2140
[31] Michalowicz A, Girerd J J and Goulon J 1979 Inorg. Chem.18 3004
[32] Singhal M, Chhabra V, Kang P and Shah D O 1997 Mater. Res.Bull. 32 239
[33] Pillai V, Kumar P, Hou M J, Ayyub P and Shah D O 1995 Adv.Colloid Interface Sci. 55 241
[34] Chhabra V, Lal M, Maitra A N and Ayyub P 1995 ColloidPolymer Sci. 273 939
[35] Osseo-Asare K 1999 Handbook of Microemulsion Science andTechnology ed P Kumar and K L Mittal (New York: Dekker)p 549
[36] Han D Y, Yang H Y, Shen C B, Zhou X and Wang F H 2004Powder Technol. 147 113
[37] Ahmad T, Ramanujachary K V, Lofland S E andGanguli A K 2004 J. Mater. Chem. 14 3406
[38] Ahmad T and Ganguli A K 2004 J. Mater. Res. 19 2905[39] Ahmad T, Kavitha G, Narayana C and Ganguli A K 2005 J.
Mater. Res. 20 1415[40] Ahmad T, Chopra R, Ramanujachary K V, Lofland S E and
Ganguli A K 2005 Solid State Sci. 7 891[41] Ahmad T and Ganguli A K 2005 J. Am. Ceram. Soc. at press[42] Gan L M, Zhang L H, Chan H S O, Chew C H and
Loo B H 1996 J. Mater. Sci. 31 1071[43] Lim G K, Wang J, Ng S C and Gan L M 1996 Mater. Lett.
28 431[44] Gan L M, Chan H S O, Zhang L H, Chew C H and
Loo B H 1994 Mater. Chem. Phys. 37 263[45] Birks L S and Friedman H 1946 J. Appl. Phys. 17 687[46] Warren B E and Averbach B L 1950 J. Appl. Phys. 21 595[47] Warren B E and Averbach B L 1952 J. Appl. Phys. 23 497[48] Pradhan N and Efrima S 2004 J. Phys. Chem. B 108 11964[49] Martinez O G, Rojas R M, Vila E and de Vidales J L M 1993
Solid State Ion. 63 442[50] Reeber R R 1970 J. Appl. Phys. 41 5063[51] Duan Y W, Kou X L and Li J G 2005 Physica B 355 250[52] Banerjee R, Sperling E A, Thompson G B, Fraser H L,
Bose S and Ayyub P 2003 Appl. Phys. Lett. 82 4250[53] Srikant V and Clarke D R 1998 J. Appl. Phys. 83 5447[54] Haase M, Weller H and Henglwin A 1988 J. Phys. Chem.
92 482[55] Guo L, Yang S, Yang C, Yu P, Wang J, Ge W and
Wong G K L 2000 Appl. Phys. Lett. 76 2901[56] Calcott P D J, Nash K J, Canham L T, Kane M J and
Brumhead D 1993 J. Phys.: Condens. Matter 5 L91
1240