Embed Size (px)
Citation preview
BSc(Hons) Forensic Investigation
Honours Project
School of Engineering and Built EnvironmentGlasgow Caledonian University
Cowcaddens RoadGlasgow G4 0BA
Contents
Section PageAbstract iList of Figures
List of Tables
ii
Chapter 1 – Introduction
1.1 – Aims and Objectives
1.2 – The Chemistry of Aromatic Compounds
1.2.1 – The Structure of Benzene
1
1.2.2 – Substitution Effects 41.2.2 – Substitution Effects 5
1.4 – Chemistry and Applications of Benzocaine 8
1.5 – Multi-step synthesis of Benzocaine
1.5.1 – Acetylation
10
1.5.2 – Oxidation 111.5.3 - Hydrolysis 121.5.4 – Fischer Esterification 131.6 – Instrumental Analysis
1.6.1 – Fourier Transform Infra-Red Spectroscopy
14
1.6.2 – Chromatography 161.6.2.1 – Thin Layer Chromatography 171.6.2.2 – High Performance Liquid Chromatography (HPLC) 18Chapter 2 – Experimental
2.1 – Equipment and Chemicals
22
2.2 – Acetylation of p-toluidine to p-methylacetanilide 242.2 – Oxidation of p-methylacetanilide to p-acetamidobenzoic acid
2.3 – Hydrolysis of p-acetamidobenzoic acid to PABA
25
2.4 – Fischer Esterification of PABA to Benzocaine 26Chapter 3 – Results
3.1 Acetylation
28
3.2 – Oxidation 333.3 – Hydrolysis 363.4 – Fischer Esterification 40Chapter 4 – Conclusion
4.1 – Discussion
46
4.2 – Further Work 48Appendix 1 – Table of mobile phases used for TLC
Appendix 2 – Table of solvent polarity parameters (P’)
50
Acknowledgments 51Bibliography 52
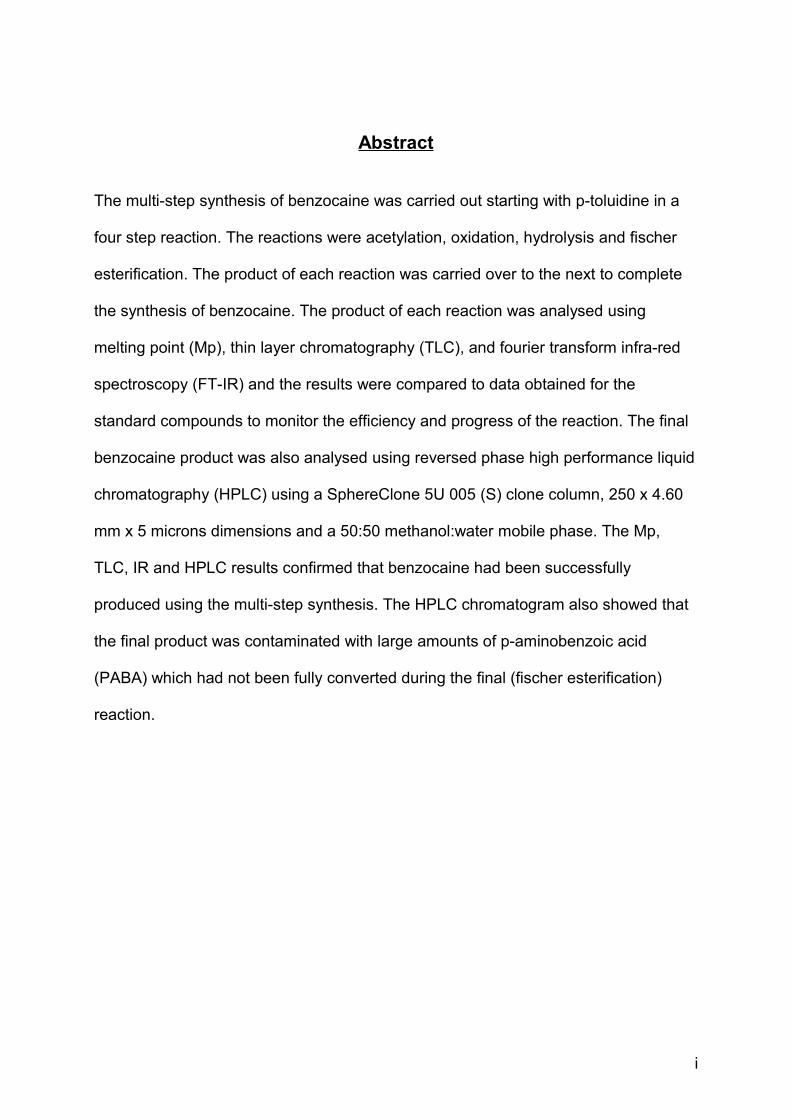
Abstract
The multi-step synthesis of benzocaine was carried out starting with p-toluidine in a
four step reaction. The reactions were acetylation, oxidation, hydrolysis and fischer
esterification. The product of each reaction was carried over to the next to complete
the synthesis of benzocaine. The product of each reaction was analysed using
melting point (Mp), thin layer chromatography (TLC), and fourier transform infra-red
spectroscopy (FT-IR) and the results were compared to data obtained for the
standard compounds to monitor the efficiency and progress of the reaction. The final
benzocaine product was also analysed using reversed phase high performance liquid
chromatography (HPLC) using a SphereClone 5U 005 (S) clone column, 250 x 4.60
mm x 5 microns dimensions and a 50:50 methanol:water mobile phase. The Mp,
TLC, IR and HPLC results confirmed that benzocaine had been successfully
produced using the multi-step synthesis. The HPLC chromatogram also showed that
the final product was contaminated with large amounts of p-aminobenzoic acid
(PABA) which had not been fully converted during the final (fischer esterification)
reaction.
i
List of Figures
Figure 1: Bromobenzene (C6H5BR) – note 6 membered ring of benzene illustrated using Kekule’s line
representationFigure 2: Top – Kekule’s resonance structures of benzene, Bottom –New benzene model displaying delocalised
electron cloud in between both resonance forms Figure 3: General structure of a local anaestheticFigure 4: Benzocaine (C9H11NO2)Figure 5: Acetylation of p-Toluidine to p-Methylacetanilide [7]
Figure 6: Oxidation of p-Mehtylacetanilide to p-Acetamidobenzoic Acid [7]
Figure 7: Hydrolysis of p-Acetamidobenzoic Acid to p-Aminobenzoic Acid (PABA) [7]
Figure 8: Esterification of p-Acetamidobenzoic Acid to Benzocaine [7]
Figure 9: HPLC schematicFigure 10: Top left going clockwise: Jasco 6100 FT-IR spectrometer, std. mp apparatus, UV lamp stand 9607-00,
Jasco HPLC instrumentFigure 11: p-Methylacetanilide ProductFigure12: TLC Plate 1 UV 254 nm: A) p-toluidine, B) p-methylacetanilide control, C) p-methylacetanilide productFigure13: p-Toluidine IR spectrumFigure 14: p-Methylacetanilide IR spectrum: top – control, bottom – productFigure 15: TLC Plate 2 UV 254 nm: A) p-methylacetamidobenzoic acid control, B) p-methylacetamidobenzoic acid
productFigure 16: p-Methylacetamidobenzoic acid IR spectrum: top – control, bottom – productFigure 17: Top – PABA 1 product, Bottom – PABA 2 productFigure 18: TLC plates 3 and 4 UV 254 nm: left – PABA 1, right – PABA 2Figure 19: PABA control IR spectrumFigure 20: Top – PABA 1 IR spectrum, bottom – PABA 2 IR spectrumFigure 21: Benzocaine productFigure 22: TLC plate 5 UV 254 nm – A) benzocaine control, B) benzocaine productFigure 23: Benzocaine IR spectrum: top – control, bottom – productFigure 24: Benzocaine HPLC Chromatogram 50:50 MeOH:H2O: top – control, bottom – product
List of Tables
Table 1: Hydrolysis reaction 1 and 2Table 2: Product results
ii

Chapter 1 – Introduction
1.1 – Aims and Objectives
• To successfully carry out the multi-step synthesis of benzocaine using the self-
designed method.
• To determine the efficiency of the process using Mp, TLC, IR and reversed
phase HPLC.
1.2 – The Chemistry of Aromatic Compounds
1.2.1 – The Structure of Benzene
An aromatic chemical is a substance which exhibits a fragrant smell, such as those
arising from fruits and spices. Common examples of aromatic compounds include
benzaldehyde, which is found in fruits (cherries, peaches, almonds); toluene found in
balsam resins, and benzene, the main petrochemical found in coal distillate [1].
In the early years, spices were important international commodities, however there
was an element of danger surrounding the spice trade as most of the products were
either pirated or destroyed in conflict. Eventually there was a growing need to extract
these chemicals from their plant sources and determine their structure so they could
be effectively synthesised at home. Large industrial quantities could then be
produced at a lower cost without the added risks associated with overseas trading [2].
1

In 1825, Michael Faraday was the first person to isolate benzene, the most common
and simple of the aromatics. Nowadays, benzene is isolated from petroleum by
cracking gasoline fractions and is used in the production of important industrial
chemicals such as styrene, phenol, acetone and cyclohexane. Aromatic compounds
are commonly found in many drugs, especially those used as painkillers and
anaesthetics. They can be found bounded to various side chains and functional
groups. Benzocaine in particular contains an aromatic ring attached to an ester group
(naturally occurring, fragrant compounds obtained from fruits and flowers). Other
important biological compounds are also aromatic in parts of their molecular structure
e.g. estrone hormone [2], [1].
Aromatic compounds can be identified from their structure. Benzene is the most
basic aromatic compound on the planet. The benzene molecule takes the form of a
six-membered-ring. The ring is effectively a hydrocarbon molecule composed of six
carbon atoms bonded together in a flat, planar, hexagonal shape. Each carbon is
bonded to one hydrogen atom giving the molecular formula C6H6. According to the
structure proposed by the famous German chemist, Friedrich August Kekule, the six-
membered ring formation of benzene also contains three alternating double bonds.
The presence of these double bonds would suggest that benzene is an unsaturated
highly reactive compound. Later, it was found this was not entirely true [1].
By the mid 1800s it was found that the double bonds in benzene did not break as
easily and it was unable to undergo the basic electrophilic addition reactions
observed in alkenes. It was found that benzene reacts with bromine in the presence
of iron to produce the substituted product, bromobenzene (C6H5Br), rather than the
addition product, C6H6Br2 (ref to “Figure 1”). In bromobenzene one of the hydrogen
atoms was replaced by one bromine atom. This was unusual as it was expected that
one of the carbon to carbon double bonds would break and each carbon atom would
bond to one of the bromine atoms. This was due to the stability of the benzene
molecule.
2
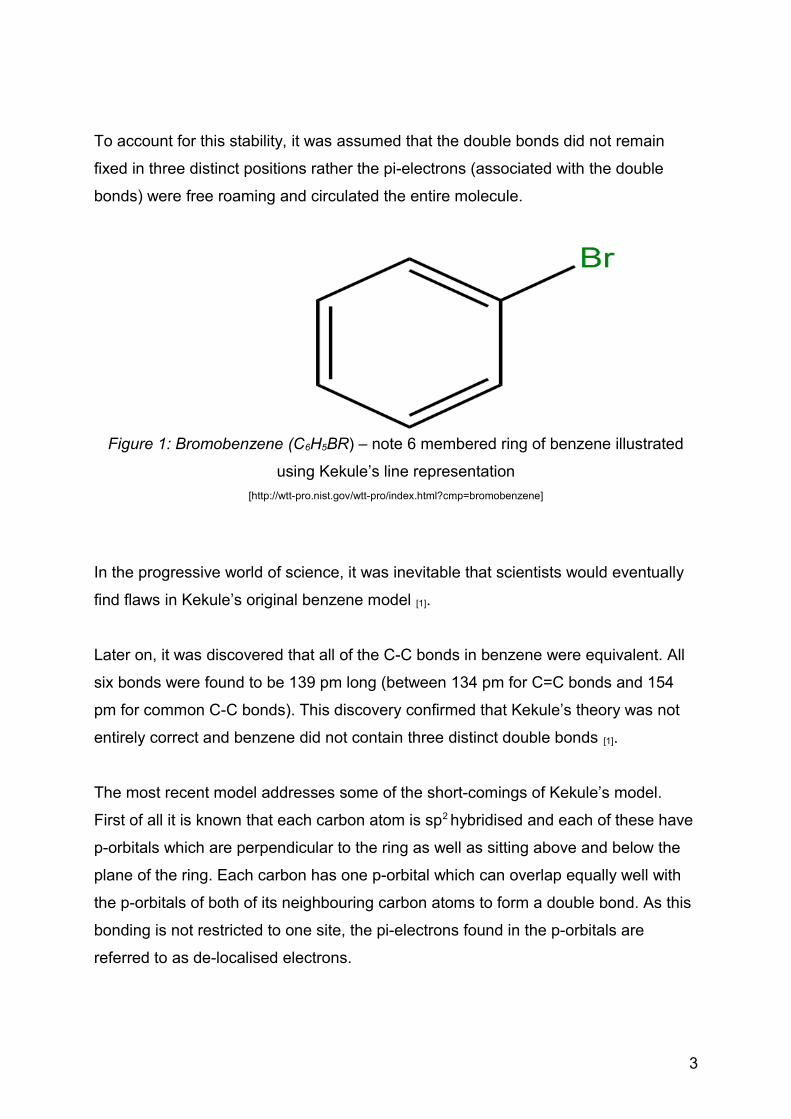
To account for this stability, it was assumed that the double bonds did not remain
fixed in three distinct positions rather the pi-electrons (associated with the double
bonds) were free roaming and circulated the entire molecule.
Figure 1: Bromobenzene (C6H5BR) – note 6 membered ring of benzene illustrated
using Kekule’s line representation
[http://wtt-pro.nist.gov/wtt-pro/index.html?cmp=bromobenzene]
In the progressive world of science, it was inevitable that scientists would eventually
find flaws in Kekule’s original benzene model [1].
Later on, it was discovered that all of the C-C bonds in benzene were equivalent. All
six bonds were found to be 139 pm long (between 134 pm for C=C bonds and 154
pm for common C-C bonds). This discovery confirmed that Kekule’s theory was not
entirely correct and benzene did not contain three distinct double bonds [1].
The most recent model addresses some of the short-comings of Kekule’s model.
First of all it is known that each carbon atom is sp2 hybridised and each of these have
p-orbitals which are perpendicular to the ring as well as sitting above and below the
plane of the ring. Each carbon has one p-orbital which can overlap equally well with
the p-orbitals of both of its neighbouring carbon atoms to form a double bond. As this
bonding is not restricted to one site, the pi-electrons found in the p-orbitals are
referred to as de-localised electrons.
3
The de-localised electrons are shared around the ring in a cloud form making it
impossible to pinpoint three distinct localised pi-bonds. This is the main reason as to
why the new benzene model is widely accepted over the Kekule proposal [1].
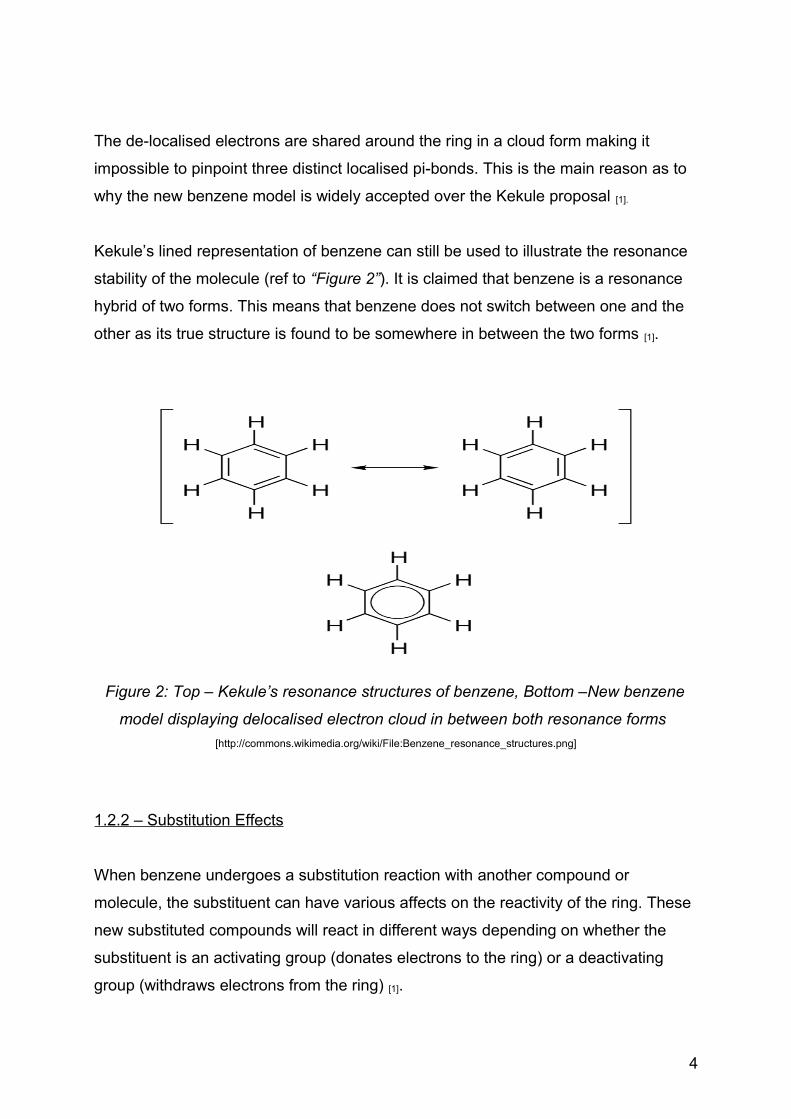
Kekule’s lined representation of benzene can still be used to illustrate the resonance
stability of the molecule (ref to “Figure 2”). It is claimed that benzene is a resonance
hybrid of two forms. This means that benzene does not switch between one and the
other as its true structure is found to be somewhere in between the two forms [1].
Figure 2: Top – Kekule’s resonance structures of benzene, Bottom –New benzene
model displaying delocalised electron cloud in between both resonance forms
[http://commons.wikimedia.org/wiki/File:Benzene_resonance_structures.png]
1.2.2 – Substitution Effects
When benzene undergoes a substitution reaction with another compound or
molecule, the substituent can have various affects on the reactivity of the ring. These
new substituted compounds will react in different ways depending on whether the
substituent is an activating group (donates electrons to the ring) or a deactivating
group (withdraws electrons from the ring) [1].
4
For example, -OH reacts with benzene to produce phenol (C6H5OH). The hydroxyl
group is an activating group which makes phenol one thousand times more reactive
towards another substance by providing an electron rich environment. On the other
end, the nitration of benzene produces nitrobenzene (C6H5NO2). The NO2 group is a
deactivating group which makes nitrobenzene less reactive towards another
substance (electrons are removed from the ring). These phenomena can arise from
either the difference in electronegativity between the ring and the substituent
(inductive effect) or from the overlap of the ring orbital with the substituent orbital
(resonance effect) [1].
These groups are also classified according to how they orientate the ring structure
towards the reagent. They can be termed either ortho, para or meta. Common ortho
and para activators include -OCH3, -NH2, -CH3 and -OH. Common ortho and para
deactivators include the halides. At present there are no known meta activators.
Common meta deactivators include -NO2, -COOH, -COCH3 and -CN [1].
1.3 – History of Local Anaesthetics
In the present day, the ‘Class A’ drug known as cocaine is associated with negative
connotations. It is abused by drug addicts for its stimulant effects and is an important
commodity utilised by the criminal underworld. Common household/medical
substances such a baking soda and lidocaine can also be added to pure cocaine to
produce synthetic derivatives commonly known as “crack” cocaine however, pure
cocaine is still a naturally occurring chemical which, like many illegal drugs, is
isolated from plants.
The purest form of cocaine exists as an alkaloid substance derived from the leaves of
the coca shrub (Erythoxylon coca). This plant grows in the Andes Mountains of Peru
at about 1500 - 1600 feet above sea level. Excavations of pre-Inca burial urns found
that the leaves of the coca shrub were placed inside.
5

Many believe that the ancient Peruvian natives would release the cocaine by
smearing the leaves with lime. The natives would then roll the leaves and chew them
to experience the stimulation provided by the chemicals [3].
In the world of science and medicine cocaine was first isolated in 1860 by German
chemist Albert Niemann who noted its unpleasant and bitter taste. He also found that
cocaine led to a numbing sensation on the tongue. In 1880, Vassily Von Anrep found
that subcutaneous injection of cocaine produced a similar numbing sensation on the
skin. He found that the user was unable to feel any pain at the site of injection [3].
By 1884 the famous neurologist, Sigmund Freud, utilised cocaine for his studies on
addiction. He attempted to wean patients off of their morphine addictions but found
that cocaine had greater addictive properties and those who stopped using the
former became addicted to latter. Freud’s assistant, Karl Koller, later found that
adding a few drops of cocaine to the eyeball would stop involuntary movements
during surgery. This test concluded that cocaine could deaden the reflexes and block
signal to nerve conduction. Koller’s tests led to the widespread use of cocaine as a
local anaesthetic to numb specific nerves during operations. During 1884 -1885 it
was commonly used as an anaesthetic in the fields of surgery and dentistry [3].
There were major disadvantages to the use of cocaine in the medicinal sector. It was
found that overindulgence of cocaine could easily lead to mental and physical
deterioration which could eventually result in acute death. The reason for this was
because cocaine was highly toxic as well as being highly addictive. The lethal dose of
cocaine was also too close to that of the therapeutic dose meaning that the risks
associated with cocaine use were far greater than the reward. This led to a wide
scale production of cocaine derivatives which were less toxic in order to find
something more suitable for everyday use [3], [4].
6

The first cocaine substitute was eucaine. Eucaine was not habit forming and did not
produce mydriasis (pupil dilation). Eucaine however, was still very toxic when
compared to piperocaine which was found to be one third less toxic than cocaine.
The most successful of these substances was procaine which was also known by its
trade name ‘novocaine’. ‘Novocaine’ was used for many years. It was the fourth less
toxic derivative and non-habit forming. The toxic dose of novocaine was and still is
almost ten times the effective amount. The difference between the therapeutic and
toxic dose increases the margin of safety for its use as an anaesthetic [3].
The reason to how these drugs act on the nervous system to relieve pain is not fully
understood. It is speculated that their main site of action is at the nerve membrane,
where their molecules appear to compete with calcium at an undefined receptor site.
Somehow the drugs can alter the permeability of the membrane so it stops
responding to electrical impulses – reduces signal conduction [3].
The general structure of a local anaesthetic includes a substituted aromatic ring
bonded to an ester group which in turn is bonded to a central carbon chain, the end
of which contains either a secondary or tertiary amine group (ref to “Figure 3”) . It is
claimed that the tertiary amine groups are important in order to enhance solubility of
the molecule in the injection solvent. Most of these compounds can react with
hydrochloric acid (HCl) to produce their hydrochloride salt forms – leads to greater
polarity, easily dissolved in water, suitable for injections. The ester groups are
important for detoxification of the drugs once they have entered the system. This is
achieved through hydrolysis of the ester linkage in the blood stream. Compounds
without the ester group are known to be longer lasting and are generally more toxic [3].
7

Figure 3: General structure of a local anaesthetic
[http://www.gpattutor.com/SampleContent/SampleContent2.aspx]
Hundreds of new anaesthetics have been synthesised and tested however, there is
still the need to find that “one” compound which provides the lowest risks and the
greatest benefits from its use in medicine.
1.4 – Chemistry and Applications of Benzocaine
Benzocaine (C9H11NO2) is a local anaesthetic also known by its trade names,
‘anaesthesin’ and ‘americaine’. Its can be named chemically as ethyl-4-amino
benzoate or 4-amino benzoic acid-ethyl ester and has a molecular weight of
165.19 g [5], [6], [7].
Unlike the drugs mentioned in “section 1.3” benzocaine is not used as an intravenous
anaesthetic. This is because benzocaine lacks the tertiary amino group at the end of
the molecule (ref to “Figure 4”). This means that it remains insoluble in water and
therefore cannot be administered via syringe. Benzocaine is still used in ointments for
topical pain relief e.g. sunscreen formulations. It can also be found in throat lozenges,
teething gels and sprays for pharyngeal and dermal anaesthesia and rectal
suppositories. Benzocaine abuse can induce methemglobinemia resulting in weak
oxygen delivery to the tissues. The decrease in oxygen carrying capacity may
eventually lead to atherosclerotic vascular disease, restrictive/obstructive pulmonary
disease, sepsis and trauma [3], [4], [8].
8
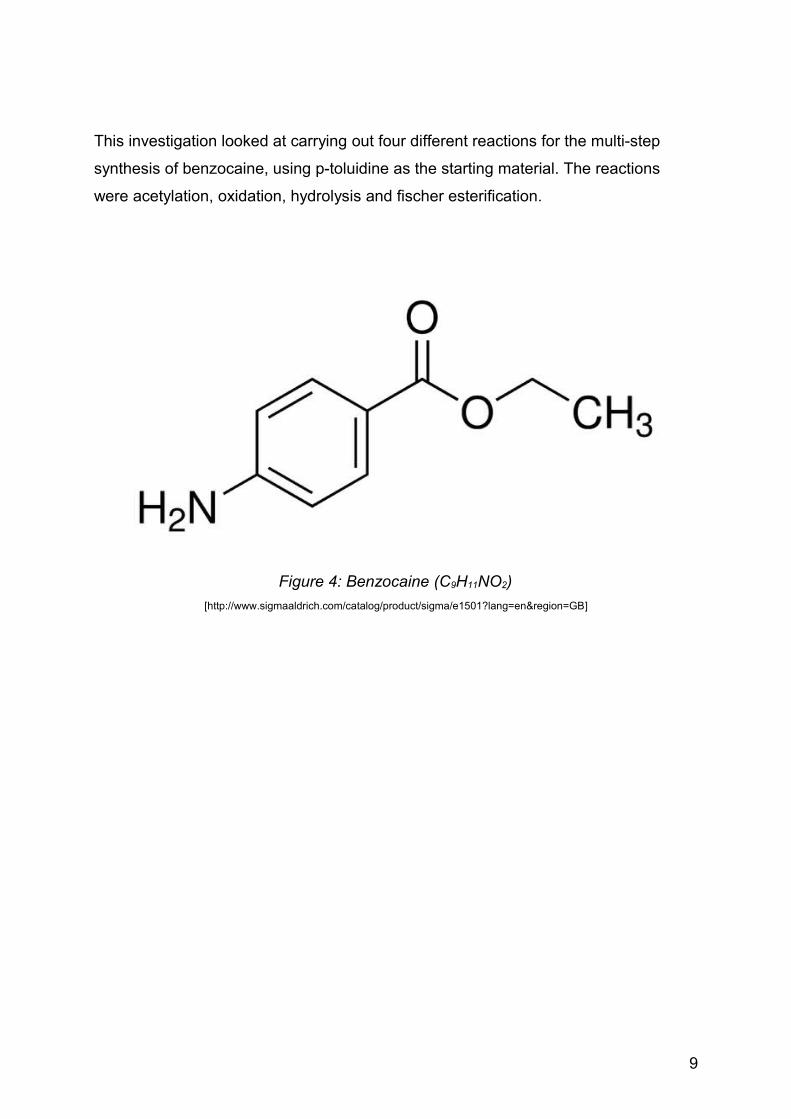
This investigation looked at carrying out four different reactions for the multi-step
synthesis of benzocaine, using p-toluidine as the starting material. The reactions
were acetylation, oxidation, hydrolysis and fischer esterification.
Figure 4: Benzocaine (C9H11NO2)
[http://www.sigmaaldrich.com/catalog/product/sigma/e1501?lang=en®ion=GB]
9
1.5 – Multi-step synthesis of Benzocaine
1.5.1 – Acetylation
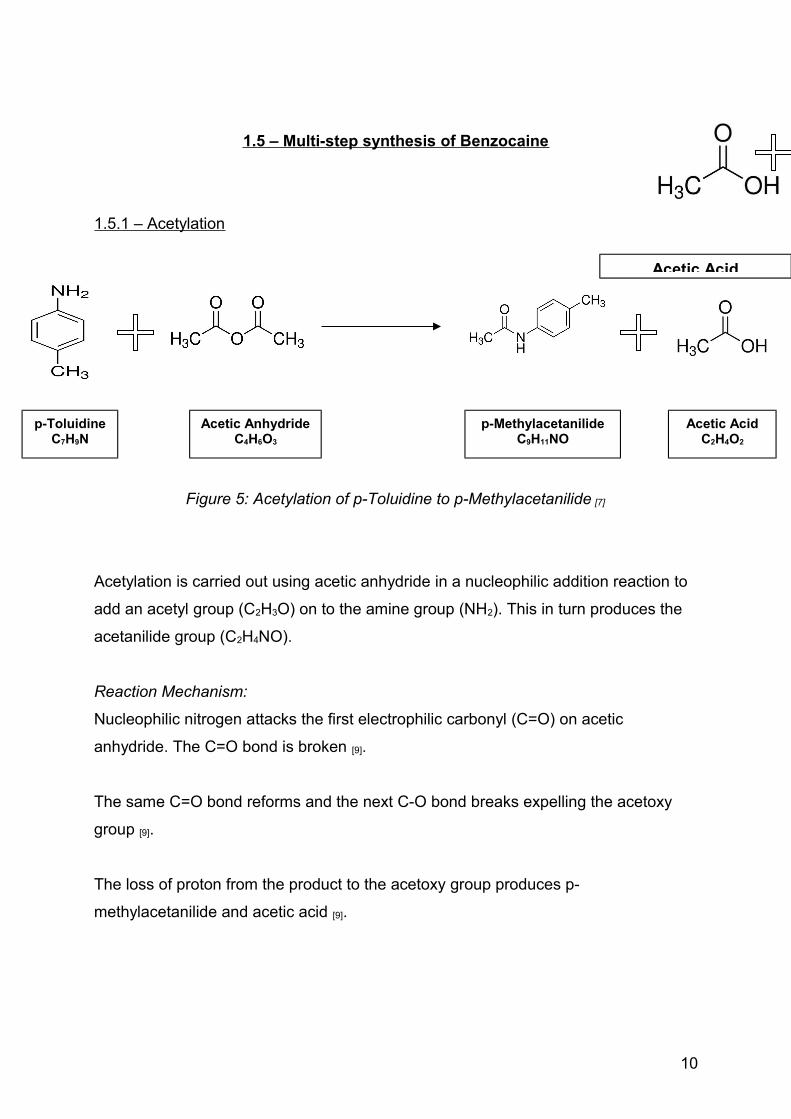
Figure 5: Acetylation of p-Toluidine to p-Methylacetanilide [7]
Acetylation is carried out using acetic anhydride in a nucleophilic addition reaction to
add an acetyl group (C2H3O) on to the amine group (NH2). This in turn produces the
acetanilide group (C2H4NO).
Reaction Mechanism:
Nucleophilic nitrogen attacks the first electrophilic carbonyl (C=O) on acetic
anhydride. The C=O bond is broken [9].
The same C=O bond reforms and the next C-O bond breaks expelling the acetoxy
group [9].
The loss of proton from the product to the acetoxy group produces p-
methylacetanilide and acetic acid [9].
p-ToluidineC7H9N
Acetic AnhydrideC4H6O3
p-MethylacetanilideC9H11NO
Acetic Acid
Acetic AcidC2H4O2
10
1.5.2 – Oxidation
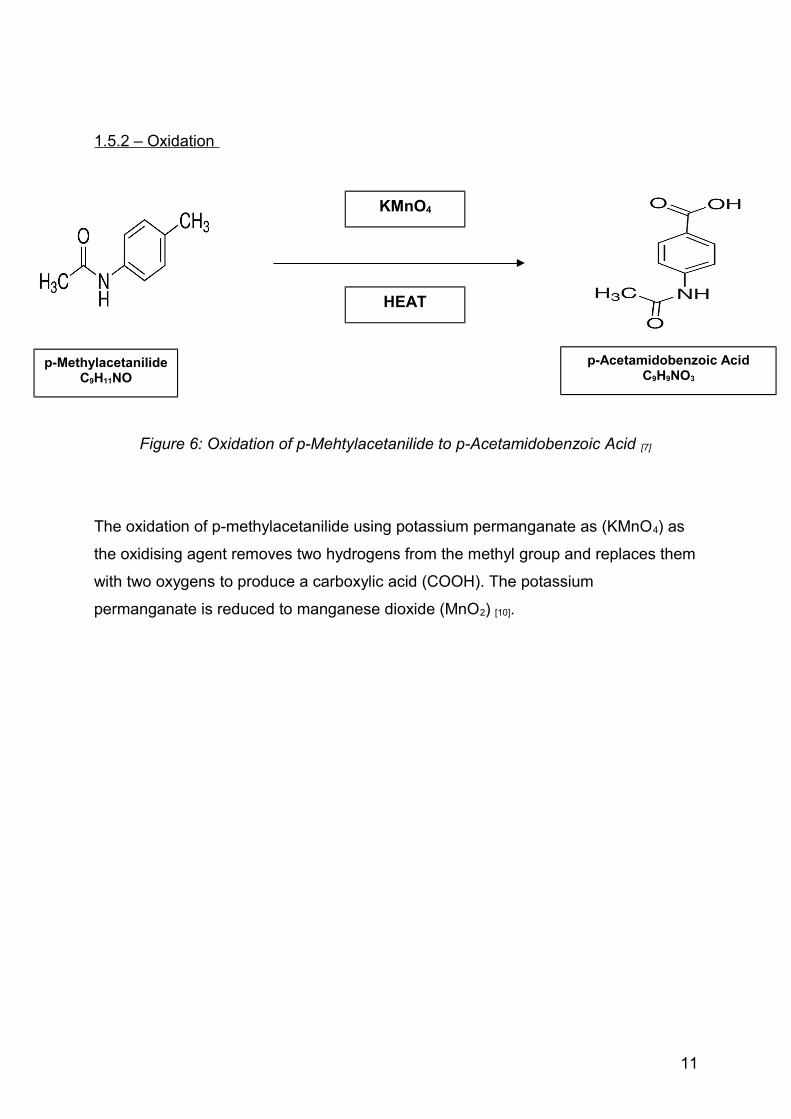
Figure 6: Oxidation of p-Mehtylacetanilide to p-Acetamidobenzoic Acid [7]
The oxidation of p-methylacetanilide using potassium permanganate as (KMnO4) as
the oxidising agent removes two hydrogens from the methyl group and replaces them
with two oxygens to produce a carboxylic acid (COOH). The potassium
permanganate is reduced to manganese dioxide (MnO2) [10].
p-MethylacetanilideC9H11NO
KMnO4
HEAT
p-Acetamidobenzoic AcidC9H9NO3
11
1.5.3 - Hydrolysis
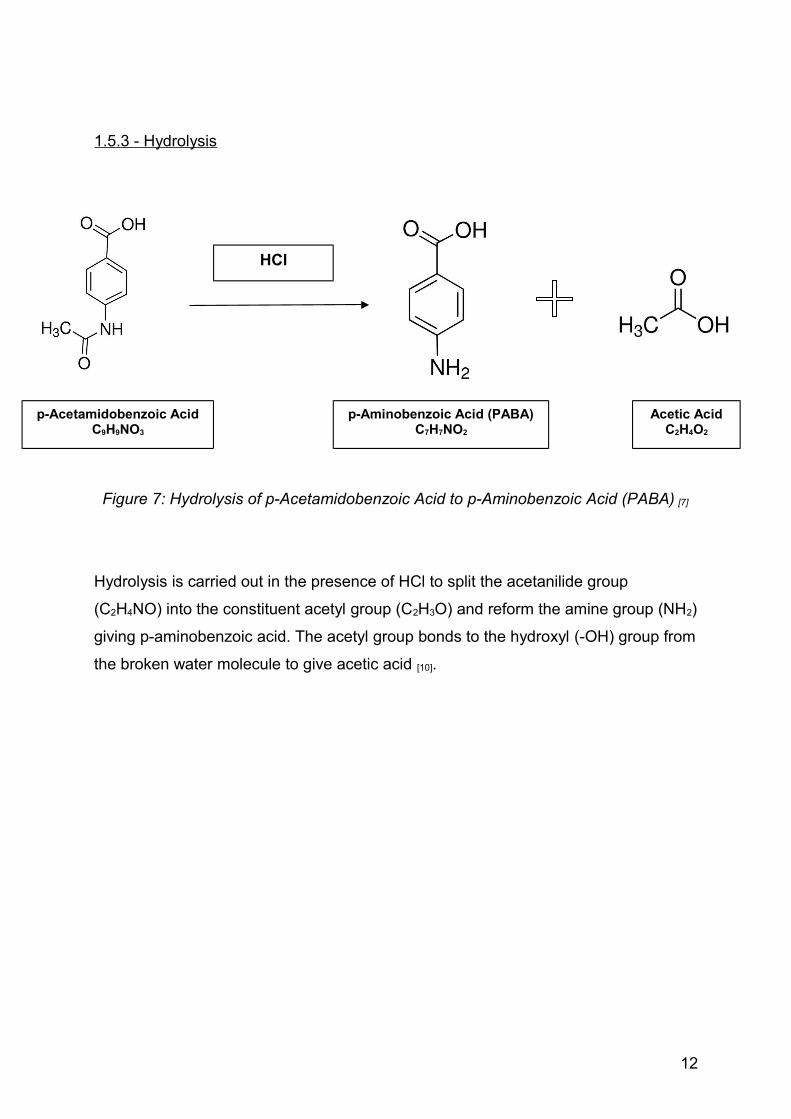
Figure 7: Hydrolysis of p-Acetamidobenzoic Acid to p-Aminobenzoic Acid (PABA) [7]
Hydrolysis is carried out in the presence of HCl to split the acetanilide group
(C2H4NO) into the constituent acetyl group (C2H3O) and reform the amine group (NH2)
giving p-aminobenzoic acid. The acetyl group bonds to the hydroxyl (-OH) group from
the broken water molecule to give acetic acid [10].
p-Acetamidobenzoic AcidC9H9NO3
p-Aminobenzoic Acid (PABA)C7H7NO2
Acetic AcidC2H4O2
HCl
12
1.5.4 – Fischer Esterification
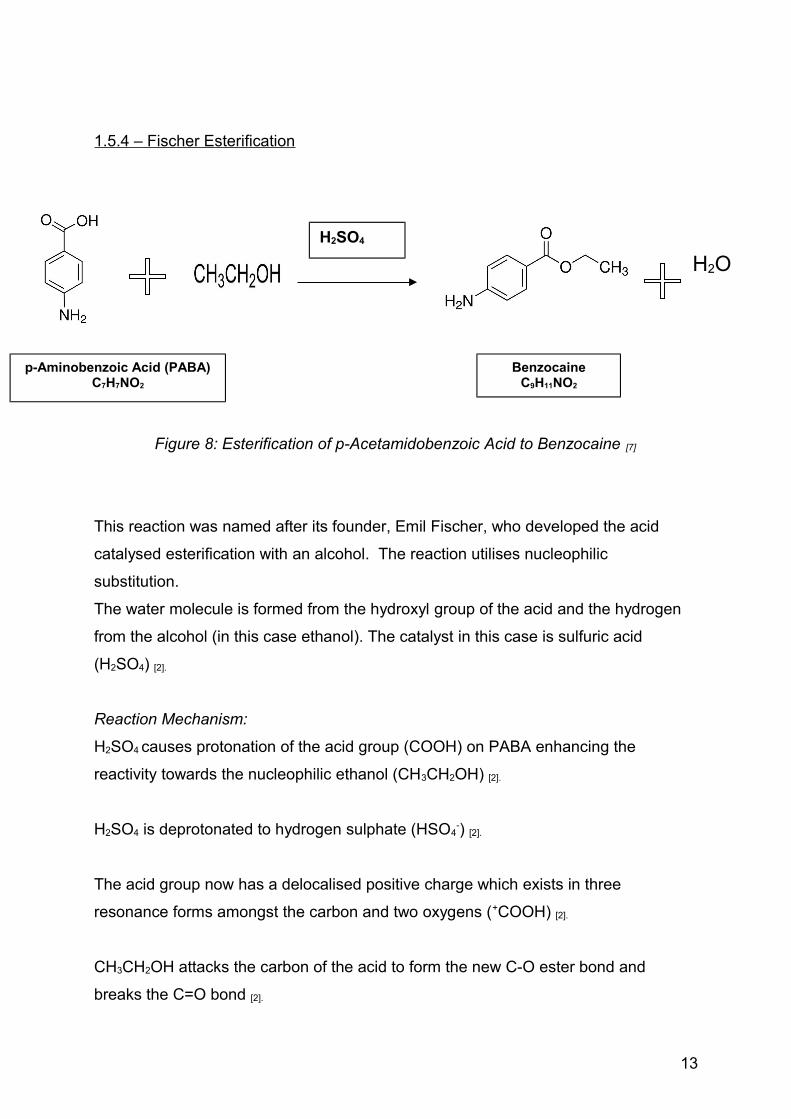
Figure 8: Esterification of p-Acetamidobenzoic Acid to Benzocaine [7]
This reaction was named after its founder, Emil Fischer, who developed the acid
catalysed esterification with an alcohol. The reaction utilises nucleophilic
substitution.
The water molecule is formed from the hydroxyl group of the acid and the hydrogen
from the alcohol (in this case ethanol). The catalyst in this case is sulfuric acid
(H2SO4) [2].
Reaction Mechanism:
H2SO4 causes protonation of the acid group (COOH) on PABA enhancing the
reactivity towards the nucleophilic ethanol (CH3CH2OH) [2].
H2SO4 is deprotonated to hydrogen sulphate (HSO4-) [2].
The acid group now has a delocalised positive charge which exists in three
resonance forms amongst the carbon and two oxygens (+COOH) [2].
CH3CH2OH attacks the carbon of the acid to form the new C-O ester bond and
breaks the C=O bond [2].
H2SO4
BenzocaineC9H11NO2
p-Aminobenzoic Acid (PABA)C7H7NO2
H2O
13
The oxygen of the broken C=O bond is now protonated to a second -OH. The acid
now possesses two hydroxyl groups [2].
The H+ from the -OH on the alcohol is expelled from the molecule. This H+ is free-
flowing and moves to bond with the first -OH on the acid forming H2O. The H2O is
expelled from the molecule [2].
HSO4- from the deprotonated catalyst regenerates into H2SO4 by binding to the final
H+ on the second -OH. The C=O bond reforms and the reaction is complete.
Benzocaine and water is formed and the catalyst has been regenerated [2].
1.6 – Instrumental Analysis
1.6.1 – Fourier Transform Infra-Red Spectroscopy
Fourier transform infra-red spectroscopy (FT-IR) is a technique used to identify the
functional groups present within a molecule. This can give structural information
about the compound present within a sample. The technique is based on the
interaction of molecules with IR radiation. Different organic compounds can absorb
energy at specific wavelengths of light while transmitting others [1].
The visible region of the electromagnetic spectrum ranges from 3.8 x 10⁻⁷ m – 7.8 x
10-7 m (380-780 nm). The IR region of the spectrum runs from 7.8 x 10⁻⁷ m to
approximately 7.8 x 10⁻⁴ m. In IR spectroscopy, we are only interested in the midpoint
of the IR region. This region covers 2.5 x 10⁻⁵ – 2.5 x 10⁻⁶ cm [1].
All organic molecules possess a certain amount of energy from the transitions
between vibrational levels which causes their bonds to stretch and contract in a
spring-like connection. These bonds are constantly vibrating (stretching/compressing)
at specific frequencies.
14
When a molecule is irradiated, it will absorb the incoming energy if the frequency of
the incident wave matches the frequency of the bond vibration. The bonds of the
known functional groups absorb light at characteristic frequencies [1], [11].
The absorption of light by the functional groups is processed into an IR spectrum.
The spectrum displays a series of downward spikes which indicate an absorption
band at a specific frequency. Frequency runs across the x-axis and is given in
wavenumber (1/λ cm-1) ranging from 400 – 4000 cm-1. Transmittance (%) runs along
the y-axis and generally ranges from 0 – 100 [1].
In modern spectrometers, a single beam of light is passed through the sample. The
spectrum for the sample is obtained and stored in a digital form. In a single run, the
spectrum for the background signal is obtained then the spectrum for the sample
coupled with the background signal is obtained and stored. The instrument software
then subtracts the background signal to give the spectrum for the sample reading
using the fourier transform mathematical process [11].
Sample preparation is dependant on the state. Liquid samples can be examined as
films formed when one drop of sample is placed between two sodium chloride plates
to hold the sample in place. The plates are transparent to the IR region of use. Solid
samples can be examined as solutions, nujol mulls and potassium bromide discs
(KBr). Solutions are examined in a sodium chloride cell, 1mm thick, which is
transparent to the IR region of use. Samples in nujol mulls are prepared by adding
one drop of nujol (liquid hydrocarbon) to around 1 mg powdered sample. This method
suffers from unwanted C-H absorption peaks arising from the nujol as well as some
compounds being insoluble in nujol. One way to avoid the presence of interfering
peaks is by adding ~1 mg powdered sample to dry KBr and pressing it down into a
thin disc via hydraulic press. A vacuum pump is also connected to the system to
remove all of the water from the sample to greatly reduce background signal. This
method is the most time consuming but can also provide some good clear spectrums
[11].
15

Functional groups have characteristic peaks which occur within specific wavenumber
ranges. For example a peak representing absorption by the carbon to carbon triple
bond can be seen in the wavenumber range of 2500 – 2000 cm-1. The carbon to
hydrogen absorption can be seen in the 3100 – 3000 cm-1 range and the peak
representative of the C=O ester bond can be observed at a wavenumber of
1735 cm-1. The section below 1500 cm-1 is termed the fingerprint region and the
peaks in this region are considered unique to the molecule in question [1].
By analysing the IR spectrum and comparing the distribution of peaks to an IR
correlation chart, the analyst can identify what functional groups are present in the
molecule, what type of bond is causing the absorption and what is the molecular
motion of the bond. The pattern analysis helps to identify the structures of the
molecules. In an unknown sample, the use of IR can help to identify the types of
compounds present in the material [1].
It is also sometimes helpful to identify the peaks which are not present as this would
give an indication to molecules that are not present in the sample. The absence of
peaks indicates 100% transmittance and alludes to the absence of a particular
compound. This type of analysis may be especially suited to check the progress of a
reaction where the expected spectrum for the product is already known [1].
1.6.2 – Chromatography
Chromatography is a wide-spread laboratory technique that can be utilised for drug
analysis. The principles of any chromatographic technique are based on the theory
that a mixture of different compounds can be separated out into its individual
components. The separation occurs due to the difference in polarities between the
molecules of each individual compound which make up the mixture [12].
16
Chromatography is carried out by dissolving the sample in an organic solvent which
has a certain level of polarity. This solvent is termed the mobile phase. The mobile
phase is passed through a solid support (usually a column) which is bonded to a
chemical substance which has the opposing polarity of the mobile phase. This
chemical is termed the stationary phase. As the mobile phase passes through the
column, the molecules will interact in specific ways with both the mobile phase and
stationary phase. If the mobile phase is highly polar, then the components which are
the most polar will remain in the solution and be the first to reach the end of the
column. The less polar components will have a higher affinity for the stationary phase
than the mobile phase and find it harder to dissolve back into solution. The least polar
components will therefore be eluted last [12].
1.6.2.1 – Thin Layer Chromatography
Thin layer chromatography (TLC) is a simple separation method that can be used for
qualitative and semi-quantitative analysis. It can also be used to optimise HPLC
conditions and is used in many cases as a presumptive test before HPLC is carried
out [13].
The technique is based on the same separation theory that underpins
chromatography. TLC uses a thin solid support in the form of glass, metal or plastic
coated with a sorbent material e.g. silica or alumina which is the stationary phase. A
pencil is used to draw a line across the plate, ~1 cm from the bottom. A small aliquot
of sample is transferred on to the line and then left to dry. The marked end of the
plate is then placed into a shallow bath of mobile phase inside a closed chamber to
stop the solvent from evaporating. The internal atmosphere of the chamber is left to
saturate with the solvent vapour. The mobile phase rises up the plate and separation
of the sample mixture is achieved due to the varying degrees of affinity of each
component with the mobile phase and stationary phase [13].
17

When the mobile phase has reached the appropriate distance the plate is removed
and analysed for the presence and number of coloured spots. The point at which the
mobile phase has stopped is marked and is termed the solvent front. The presence of
a row of individual spots running along the plate indicates that separation of the
mixture has been achieved [13].
TLC can also be used to compare a number of different samples on the one plate. In
the case of synthesis experiments, a control substance can be added along with the
product of the reaction. Comparison of the resolution and migration distances of both
spots can provide an indication of whether or not the synthesis has been successful
[13].
Semi-quantitative analysis can be carried out by measuring the retention factor (Rf)
of the sample. The Rf is a measure of the migration distances of the sample from the
starting point and is calculated as a ratio:
Rf = distance travelled by component/distance travelled by solvent
The Rf value lies between 0 to 1 with 0 indicating that the component has not moved
at all and 1 indicating that the component has run off the edge of the plate with the
solvent i.e. polarity needs to be reduced [13].
Most commercial TLC plates also contain fluorescence indicators which can be used
to observe spots under UV illumination [13].
1.6.2.2 – High Performance Liquid Chromatography (HPLC)
HPLC is a separation technique used for high molecular weight, thermally unstable
compounds. In HPLC the sample is dissolved in an organic solvent and run through a
long narrow column.
18

The column feeds into a detector system which analyses the separation and, using
the appropriate software, processes this information into a chromatogram which
displays distinct peaks for each component (ref to “Figure 9”). There are several
HPLC modes which include normal phase, reversed phase, ion exchange and size
exclusion separation. This investigation used reversed phase HPLC for sample
analysis [12].
The stationary phase can be in a solid or liquid form which is immobilised on the
inside of the column. In normal phase HPLC the stationary phase is polar and is
based on silica gel which contains free hydroxyl groups (-OH). In reversed phase
(most common) the silica gel is bonded to an organochlorosilane to produce a non-
polar stationary phase. The most common stationary phases include octadecylsilane
(ODS, C18) and octylsilane (C8). Both of these molecules contain long hydrocarbon
chains which are aligned perpendicular to the support particle to give a bristle like
structure. The functional groups of the stationary phase can also be varied to include
phenyl, C6, C4, C2, NH2 and NO2, each of which can be chosen to vary the polarity of
the stationary phase to suit a specific application [12].
The mobile phase for reversed phase HPLC is a highly polar organic solvent as
oppose to normal phase where the solvent can range from being non-polar to
moderately polar. In normal phase the least polar component of a mixture is eluted
first while the most polar component is eluted last due to stronger intermolecular
forces occurring between the polar component and the polar stationary phase. In
reversed phase the most polar component is eluted first while the least polar
component is eluted last due to the interaction between polar component and polar
mobile phase i.e. component remains in liquid and travels further [12].
The selection of mobile phase composition is important in controlling the separation.
Comparing solvent strength using the solvent polarity parameter (P’) is a good
indication of mobile phase polarity. The lower the P’ value the longer it will take the
solvent to elute.
19

Water is generally used as the base solvent and is mixed with the appropriate solvent
(organic modifier) to increase polarity. Reducing the proportion of water in the
composition will decrease the polarity [12].
The set-up of a HPLC instrument includes one or more reservoir bottles which house
the mobile phase which can also be fixed to degassing system to remove dissolved
gases. The reservoir is attached to a pump for delivery of high output pressures and
constant pulse free flow rates [12].
An injection valve is placed before the column for sample introduction via syringe.
The column itself is usually made from stainless steel and is between 2.5 - 25 cm
long with an internal diameter of around 5 mm and 2 mm for small bore columns [12].
Guard columns can also be used to protect and prolong the lifetime of the analytical
column. The guard columns are packed with the same stationary phase and remove
and retain substances from the sample which can stick to the analytical column
decreasing separation efficiency [12].
Figure 9: HPLC schematic
[http://arycho.wordpress.com/tag/hplc/]
20
A variety of detectors can be used with HPLC. These include Refractive Index (RI)
detectors which can detect almost all analytes. The most commonly used is the UV
detector. These detectors are used to identify organic molecules that can absorb light
in the UV range of the spectrum (190 – 880 nm). Absorption of light is proportional to
chemical concentration according to Beer’s Law:
Beer’s Law: A= έCl
A is the absorbance, έ is the molar absorptivity, C is concentration (mol/L) and l is the
path length (cm) [12].
The UV detector works by shining a light from a tungsten lamp through a
monochromator to select the appropriate wavelength. The light then goes through a
beam splitter which passes half of the incident beam through a sample flow cell
which is measured for transmitted radiation by the photodetector. The other half
passes through a reference detector which senses variation in the beam from the
source. Signal processors then ratio the two signals and the output displayed in the
form a chromatogram [12].
The chromatogram displays a series of peaks and is plotted as signal vs. time (min).
Each of the eluted components will form discrete bands or peaks when processed
through the appropriate software. Each of these peaks will be associated with a
specific retention time (the time taken for the analyte to pass through the column).
The number of different peaks should be indicative of the number of compounds
found in the mixture. The height of each peak corresponds to the concentration of
each compound in that mixture [12].
21
Chapter 2 – Experimental
2.1 – Equipment and Chemicals
• Standard chemicals for each reaction supplied by Sigma Aldrich™ Co. LLC.
(used as controls)
• Standard melting point apparatus
• Scales
• Reverse Phase HPLC – ‘SphereClone’ 5U 005 (S) clone column, 250 x 4.60
mm x 5 microns dimensions with UV Detector and 50:50 MeOH:H2O mobile
phase
• Pre-coated TLC sheets ‘Alugram’, Silica, G/UV254 with Fluorescence/UV
indicator
• UV light (254 nm)
• ‘Jasco 6100’ FT-IR Spectrometer
• Celite filter agent
This experiment was initially designed as a 6-step synthesis. There were two
previous steps that were to be performed before the acetylation reaction. Using
toluene as the starting material, a nitration reaction was to be carried out to produce
p-nitrotoluene. The p-nitrotoluene was then to be reduced using tin as the reducing
agent into p-toluidine.
It was found that nitration of toluene could produce three isomers in varying ratios.
These were 2-nitrotoluene, 3-nitrotoluene and 4-nitrotoluene (aka p-nitrotoluene).
There is also a possibility that di-nitrotoluene and tri-nitrotoluene (TNT) could also
have been produced [14].
22
Due to the volatile and explosive nature of trinitrotoluene, the nitration and reduction
steps were abandoned and the experiment began with the acetylation step using p-
toluidine as the starting material.
The products of each reaction were weighed, analysed by IR, TLC and melting point
and the data was compared with the control substances to check the progress and
efficiency of the reactions. The melting point standards were obtained from Sigma
Aldrich™ material safety data sheets. The PABA and benzocaine controls were
analysed using HPLC for standard chromatograms. The final benzocaine product
was analysed using HPLC and the chromatogram was compared to the control to
confirm if the synthesis had worked.
23

Figure 10: Top left going clockwise: ‘Jasco 6100’ FT-IR spectrometer, std. mp
apparatus, UV lamp stand 9607-00, ‘Jasco’ HPLC instrument
[http://www.coleparmer.com/buy/product/44830-uv-lamp-stand-18-0063-01.html] [http://mcf.nd.edu/instruments-and-
capabilities/] [http://www.coleparmer.com/buy/product/44830-uv-lamp-stand-18-0063-01.html]
2.2 – Acetylation of p-toluidine to p-methylacetanilide
Starting with p-toluidine, 5.3156 g was weighed out and added to a 250 ml
Erlenmeyer flask. A small amount of water was added and the solid flask was swirled
to dissolve the reactant. Using a Pasteur pipette, 5ml acetic anhydride was added
dropwise while swirling the liquid. The solution was left to react at room temperature
for ~5 min and then kept on a hot plate to dissolve any residual solid.
24
The solution was then cooled in an ice bath to recrystallise the product. The product
was collected using vacuum filtration. TLC was carried out using a 30:70
acetonitrile:water mobile phase.
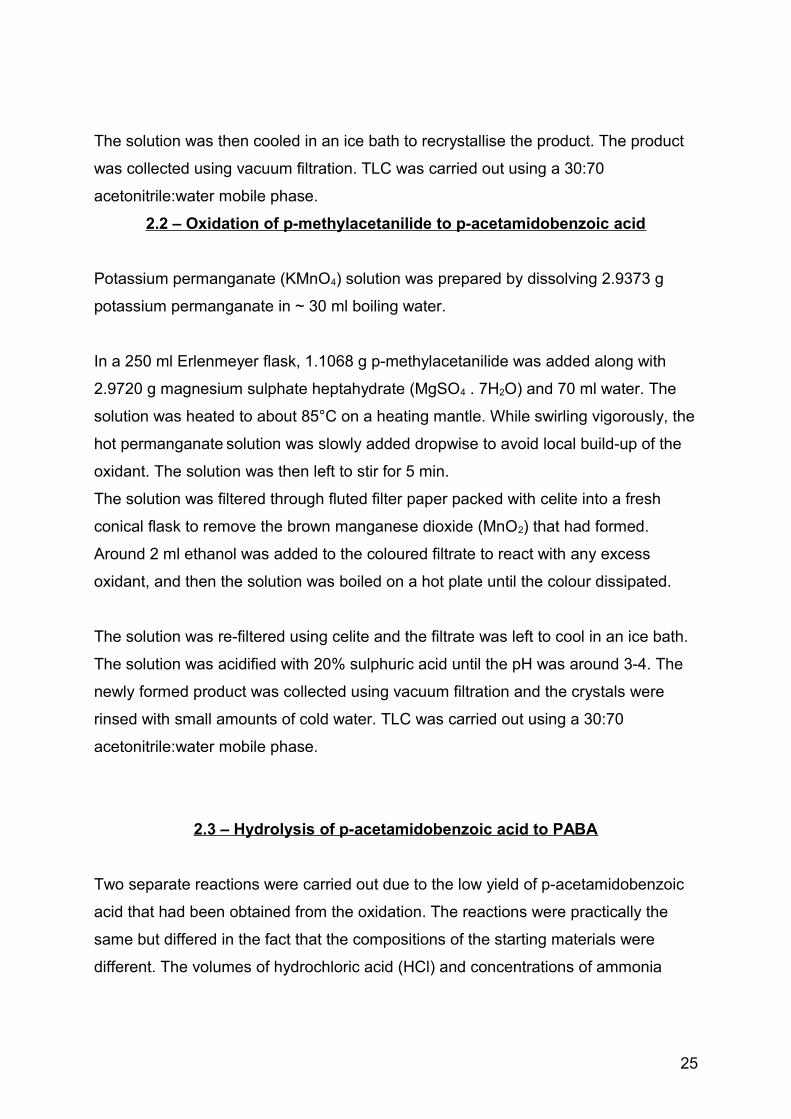
2.2 – Oxidation of p-methylacetanilide to p-acetamidobenzoic acid
Potassium permanganate (KMnO4) solution was prepared by dissolving 2.9373 g
potassium permanganate in ~ 30 ml boiling water.
In a 250 ml Erlenmeyer flask, 1.1068 g p-methylacetanilide was added along with
2.9720 g magnesium sulphate heptahydrate (MgSO4 . 7H2O) and 70 ml water. The
solution was heated to about 85°C on a heating mantle. While swirling vigorously, the
hot permanganate solution was slowly added dropwise to avoid local build-up of the
oxidant. The solution was then left to stir for 5 min.
The solution was filtered through fluted filter paper packed with celite into a fresh
conical flask to remove the brown manganese dioxide (MnO2) that had formed.
Around 2 ml ethanol was added to the coloured filtrate to react with any excess
oxidant, and then the solution was boiled on a hot plate until the colour dissipated.
The solution was re-filtered using celite and the filtrate was left to cool in an ice bath.
The solution was acidified with 20% sulphuric acid until the pH was around 3-4. The
newly formed product was collected using vacuum filtration and the crystals were
rinsed with small amounts of cold water. TLC was carried out using a 30:70
acetonitrile:water mobile phase.
2.3 – Hydrolysis of p-acetamidobenzoic acid to PABA
Two separate reactions were carried out due to the low yield of p-acetamidobenzoic
acid that had been obtained from the oxidation. The reactions were practically the
same but differed in the fact that the compositions of the starting materials were
different. The volumes of hydrochloric acid (HCl) and concentrations of ammonia
25

solution (NH4) used in the reactions were also different to accommodate the reactant
yields (ref to “Table 1”).
Table 1: Hydrolysis reaction 1 and 2
Hydrochloric acid was added to a 250 ml round-bottom flask containing p-
acetamidobenzoic acid. The solution was set to reflux gently for 30 min until a yellow
solid had formed. The solution was left to cool at room temperature and 2.5 ml cold
water was added to the flask.
The solution was transferred to a fresh Erlenmeyer flask and aqueous ammonia
solution was added dropwise until the pH reached 7-8. A further 0.5 ml glacial acetic
acid was added and the solution was stirred vigorously. The solution was kept on ice
and crystallisation was induced using a seed crystal. The product was collected by
vacuum filtration. TLC analysis was carried out on both products using a 30:70
acetontrile:water mobile phase mixed with a few drops of acetic acid to improve
resolution of samples.
2.4 – Fischer Esterification of PABA to Benzocaine
The reaction used a PABA 1 and PABA 2 mixture as the starting material, the total
weight of which was 1.7885 g. A microscale esterification was carried out due to the
reduced yield. The volumes for all reagents were divided accordingly.
Reaction Starting material Product Vol of HCl
(ml)
[NH4]
1 1.0172 g p-Acetamidobenzoic Acid control PABA 1 5 4 M2 2.0267 g p-Acetamidobenzoic Acid control
and product mixed together
PABA 2 10 6 M
26
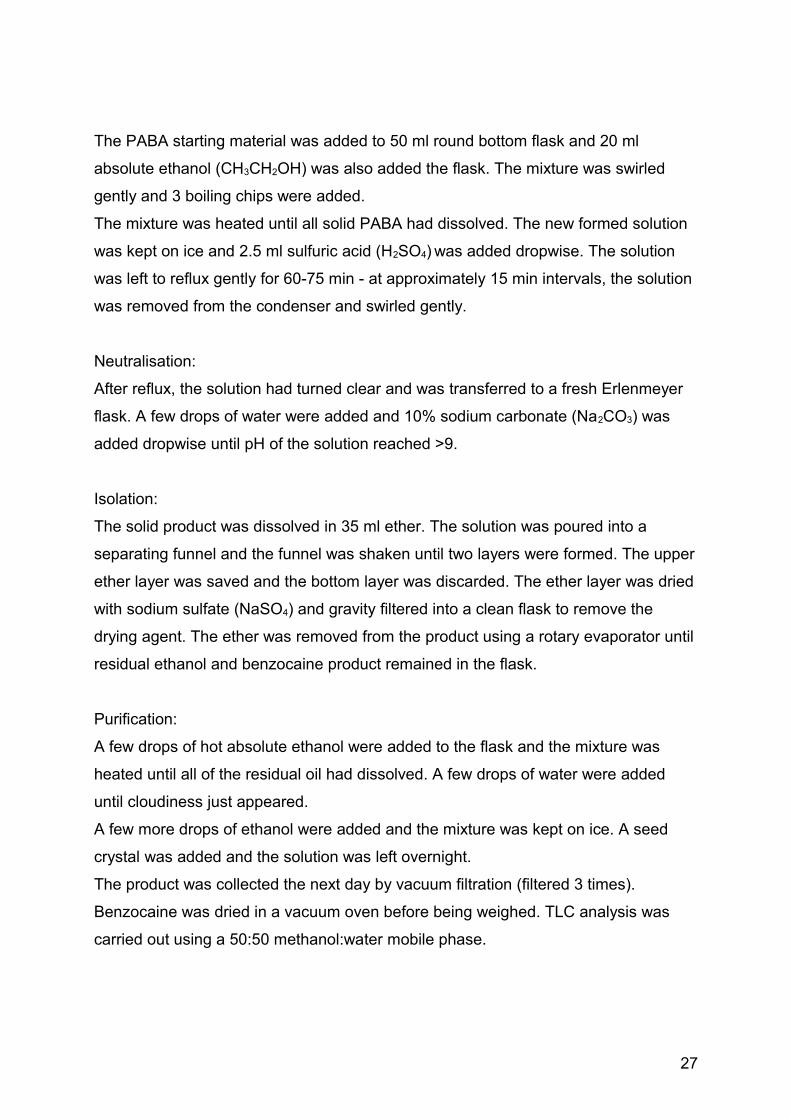
The PABA starting material was added to 50 ml round bottom flask and 20 ml
absolute ethanol (CH3CH2OH) was also added the flask. The mixture was swirled
gently and 3 boiling chips were added.
The mixture was heated until all solid PABA had dissolved. The new formed solution
was kept on ice and 2.5 ml sulfuric acid (H2SO4) was added dropwise. The solution
was left to reflux gently for 60-75 min - at approximately 15 min intervals, the solution
was removed from the condenser and swirled gently.
Neutralisation:
After reflux, the solution had turned clear and was transferred to a fresh Erlenmeyer
flask. A few drops of water were added and 10% sodium carbonate (Na2CO3) was
added dropwise until pH of the solution reached >9.
Isolation:
The solid product was dissolved in 35 ml ether. The solution was poured into a
separating funnel and the funnel was shaken until two layers were formed. The upper
ether layer was saved and the bottom layer was discarded. The ether layer was dried
with sodium sulfate (NaSO4) and gravity filtered into a clean flask to remove the
drying agent. The ether was removed from the product using a rotary evaporator until
residual ethanol and benzocaine product remained in the flask.
Purification:
A few drops of hot absolute ethanol were added to the flask and the mixture was
heated until all of the residual oil had dissolved. A few drops of water were added
until cloudiness just appeared.
A few more drops of ethanol were added and the mixture was kept on ice. A seed
crystal was added and the solution was left overnight.
The product was collected the next day by vacuum filtration (filtered 3 times).
Benzocaine was dried in a vacuum oven before being weighed. TLC analysis was
carried out using a 50:50 methanol:water mobile phase.
27

Chapter 3 – Results
Table 2: Product results
3.1 Acetylation
Figure 11: p-Methylacetanilide Product
Product Yield (g) Melting Point Range
Control(°C)
(sigma aldrich ™ MSDS)
Melting Point
Product (°C)
Rf Control Rf Product
p-Methylacetanilide 5.7010 149-151 151 0.84 0.82p-Methylacetamidobenzoic
acid
0.3034 259-262 >264 0.84 0.81
PABA 1 0.4010 187-189 >260 0.88 0.88PABA 2 1.3875 187-189 >260 0.88 0.88
Benzocaine 0.0739 88-90 81 1.62 1.62
28
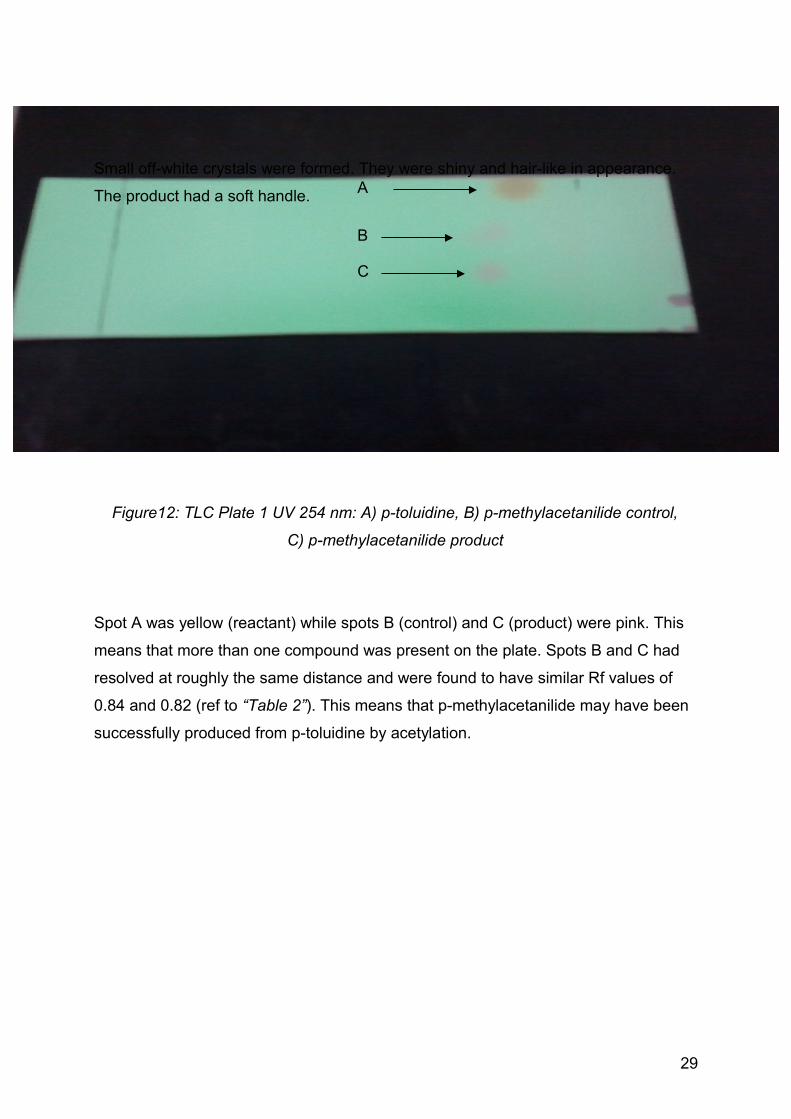
Small off-white crystals were formed. They were shiny and hair-like in appearance.
The product had a soft handle.
Figure12: TLC Plate 1 UV 254 nm: A) p-toluidine, B) p-methylacetanilide control,
C) p-methylacetanilide product
Spot A was yellow (reactant) while spots B (control) and C (product) were pink. This
means that more than one compound was present on the plate. Spots B and C had
resolved at roughly the same distance and were found to have similar Rf values of
0.84 and 0.82 (ref to “Table 2”). This means that p-methylacetanilide may have been
successfully produced from p-toluidine by acetylation.
C
B
A
29
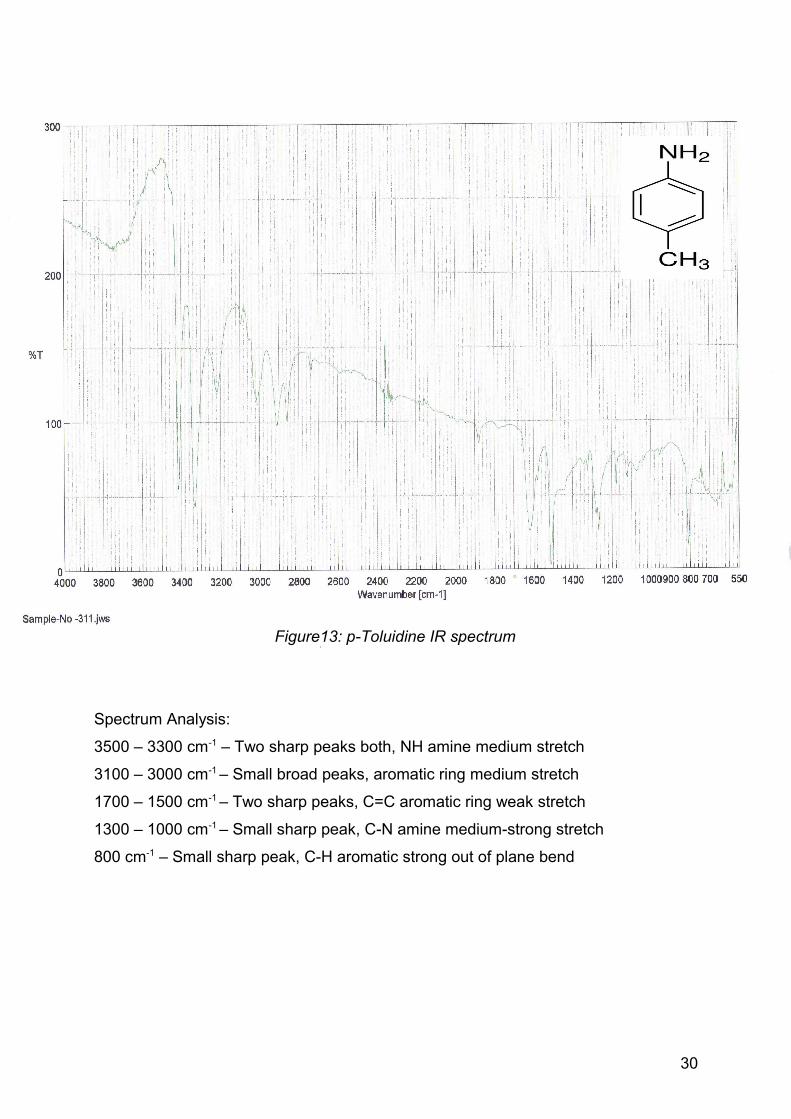
Figure13: p-Toluidine IR spectrum
Spectrum Analysis:
3500 – 3300 cm-1 – Two sharp peaks both, NH amine medium stretch
3100 – 3000 cm-1 – Small broad peaks, aromatic ring medium stretch
1700 – 1500 cm-1 – Two sharp peaks, C=C aromatic ring weak stretch
1300 – 1000 cm-1 – Small sharp peak, C-N amine medium-strong stretch
800 cm-1 – Small sharp peak, C-H aromatic strong out of plane bend
30
31

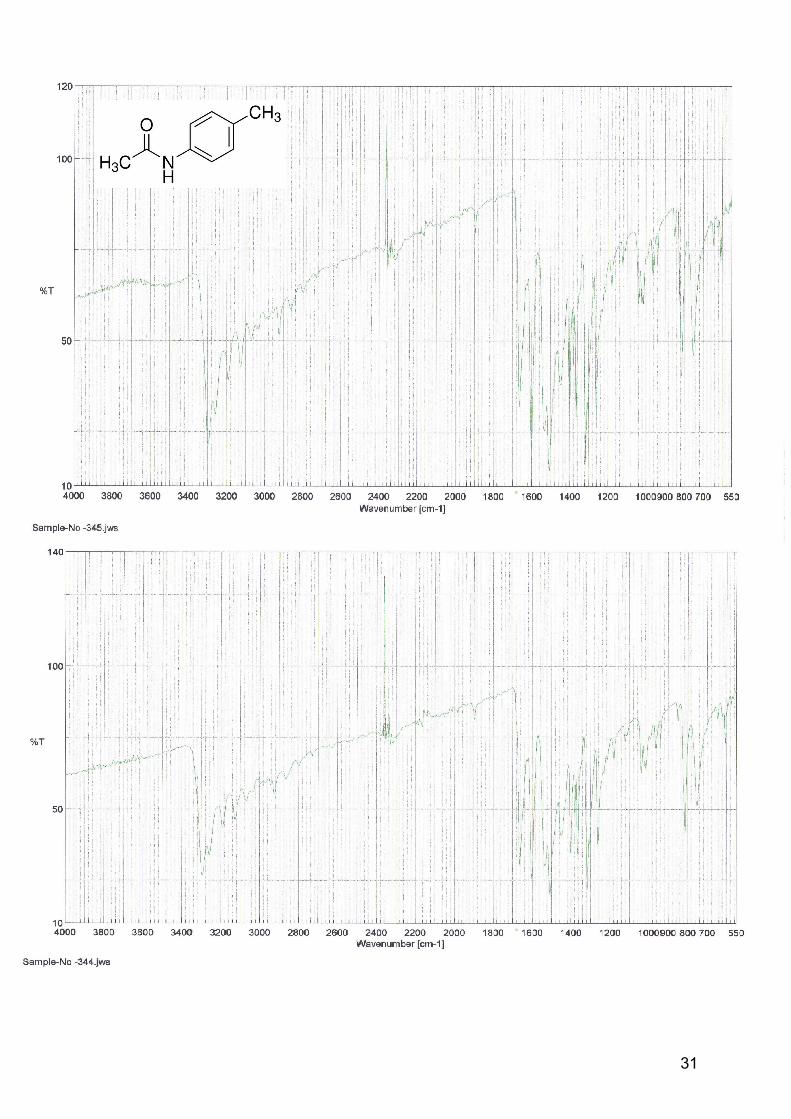
Figure 14: p-Methylacetanilide IR spectrum: top – control, bottom – product
Product spectrum from “Figure 14” displays a different pattern than the p-toluidine
spectrum. This confirms that both compounds are indeed different. Product spectrum
from “Figure 14” is similar to control spectrum. This means that: 1) Conversion of p-
toluidine had definitely taken place and 2) the acetylation reaction had worked and p-
methylacetanilide was produced as the product spectrum matched the control
spectrum.
Spectra Analysis:
3300 – 3200 cm-1 – Broad doublet peak, possibly N-H amine medium stretch
1700 – 1600 cm-1 – One sharp peak, C=O ketone strong stretch arising from
acetanilide group
1600 cm-1 – One sharp peak, C=C aromatic ring weak stretch
1400 – 1300 cm-1 – Three sharp peaks, possibly –CH3 medium bend arising from
methyl group at acetanilide end
800 – 700 cm-1 – Two sharp peaks, possible C-H aromatic out of plane strong bend
32
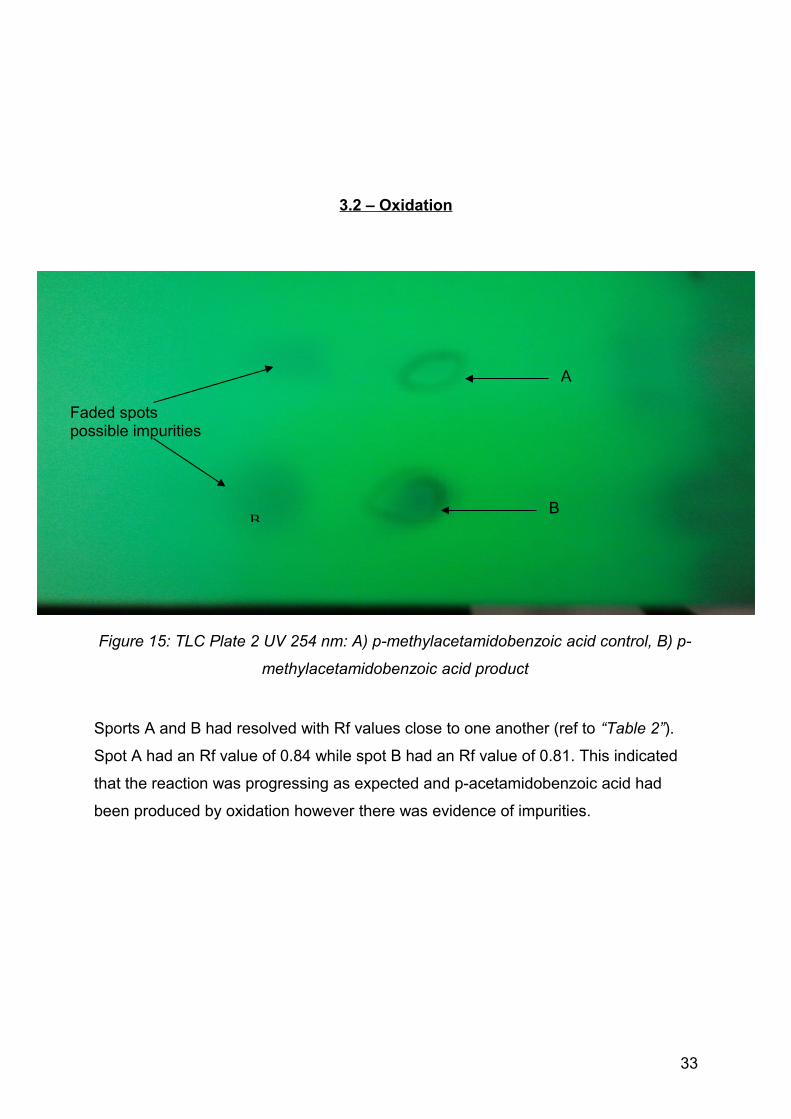
3.2 – Oxidation
Figure 15: TLC Plate 2 UV 254 nm: A) p-methylacetamidobenzoic acid control, B) p-
methylacetamidobenzoic acid product
Sports A and B had resolved with Rf values close to one another (ref to “Table 2”).
Spot A had an Rf value of 0.84 while spot B had an Rf value of 0.81. This indicated
that the reaction was progressing as expected and p-acetamidobenzoic acid had
been produced by oxidation however there was evidence of impurities.
B
A
B
Faded spots possible impurities
33

34

Figure 16: p-Methylacetamidobenzoic acid IR spectrum: top – control, bottom –
product
Product spectrum from “Figure 16” is similar to control spectrum. This means that: 1)
Conversion of p-methylacetanilide had definitely taken place and 2) the oxidation
reaction had worked and p-acetamidobenzoic acid had been produced as the product
spectrum matched the control spectrum.
Spectra Analysis:
3000 cm-1 – Sharp peak, NH amine medium stretch
3000 – 2500 cm-1 – Small broad peak, OH carboxylic acid broad stretch
1700 – 1600 cm-1 – Sharp peak, C=O ketone strong stretch arising from acetanilide
group
1600 cm-1 – One sharp peak, C=C aromatic ring weak stretch, present again at
around 1500 cm-1
1300 – 1200 cm-1 – Sharp triple peak, possibly C-O carboxylic acid strong stretch
900 – 700 cm-1 – Individual peak difficult to see, possible presence of C-H aromatic
strong out of plane bend
35
3.3 – Hydrolysis
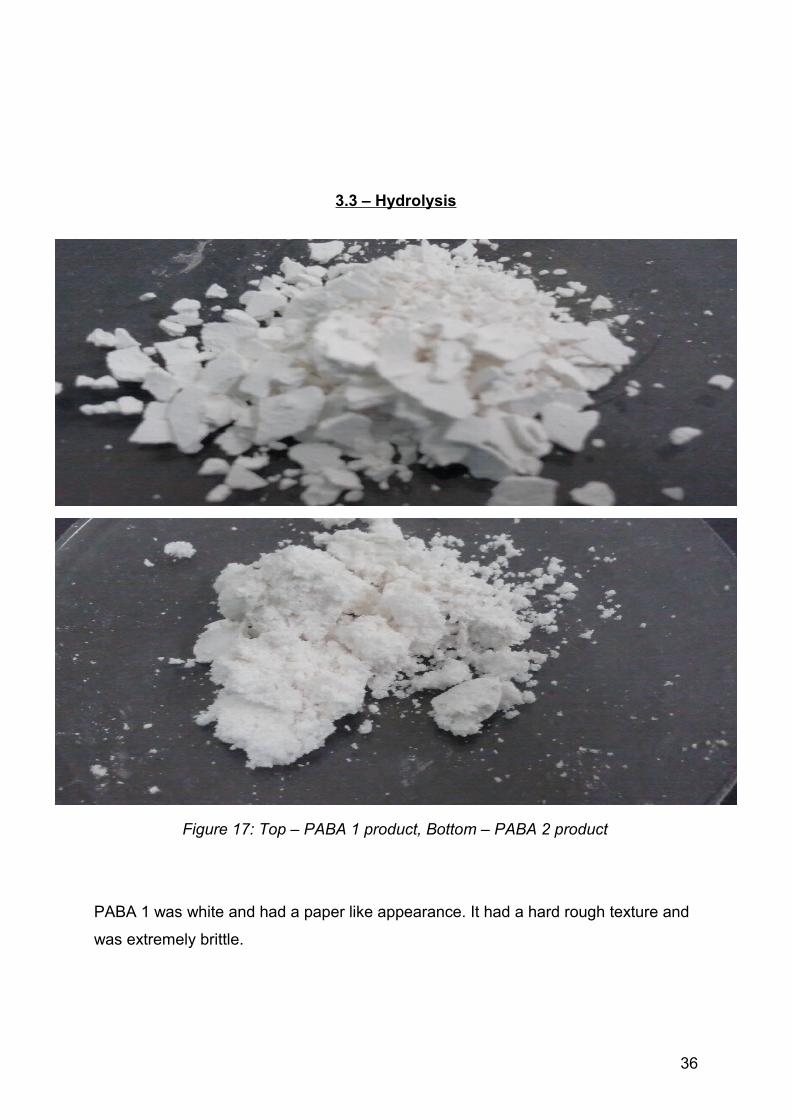
Figure 17: Top – PABA 1 product, Bottom – PABA 2 product
PABA 1 was white and had a paper like appearance. It had a hard rough texture and
was extremely brittle.
36
PABA 2 was white, crumbled and fairly soft. PABA 2 would stick to the surface of the
watch glass and had an almost clay-like handle.
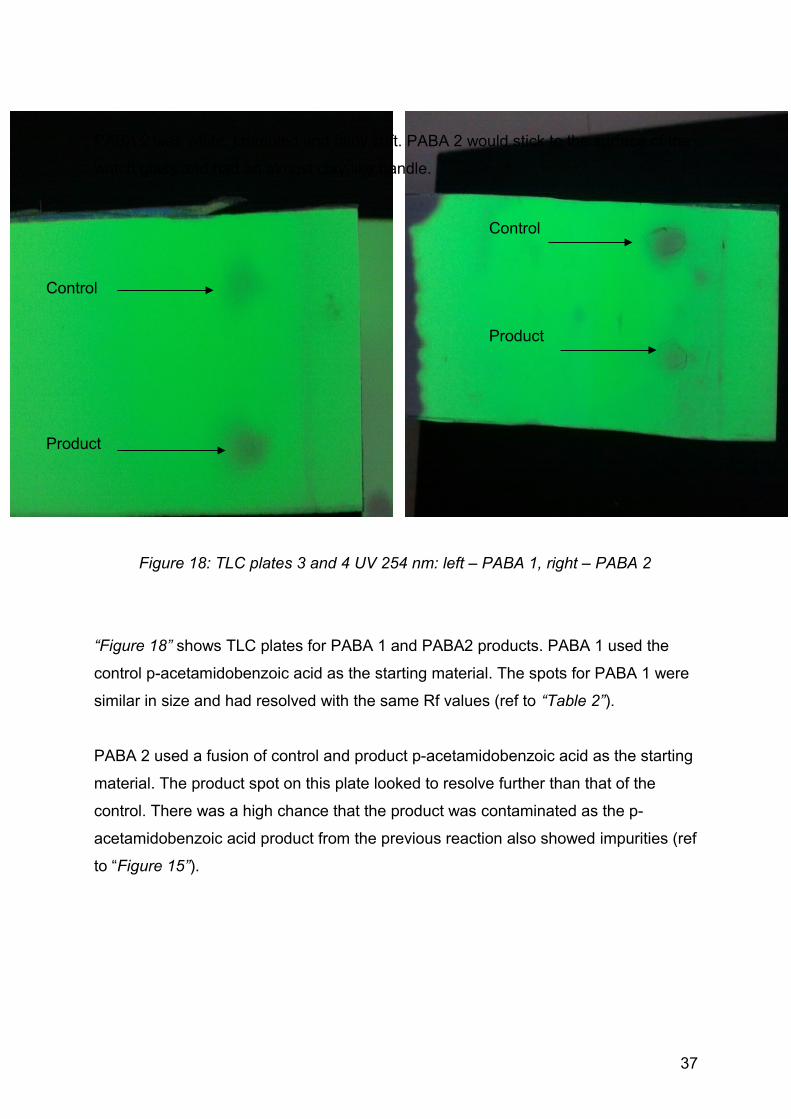
Figure 18: TLC plates 3 and 4 UV 254 nm: left – PABA 1, right – PABA 2
“Figure 18” shows TLC plates for PABA 1 and PABA2 products. PABA 1 used the
control p-acetamidobenzoic acid as the starting material. The spots for PABA 1 were
similar in size and had resolved with the same Rf values (ref to “Table 2”).
PABA 2 used a fusion of control and product p-acetamidobenzoic acid as the starting
material. The product spot on this plate looked to resolve further than that of the
control. There was a high chance that the product was contaminated as the p-
acetamidobenzoic acid product from the previous reaction also showed impurities (ref
to “Figure 15”).
Control
Product
Product
Control
37

Figure 19: PABA control IR spectrum
Spectrum analysis:
3500 - 3400 cm-1 – One sharp peak, NH amine medium stretch
3400 – 3300 cm-1 – One sharp peak, OH- carboxylic acid broad stretch
1700-1600 cm-1 – Small sharp peak, C=O carboxylic acid strong stretch
1600 cm-1 – One small sharp peak, C=C aromatic ring weak stretch
900 – 700 cm-1 – Two sharp peaks, both possibly indicative of C-H aromatic out of
plane bend
38
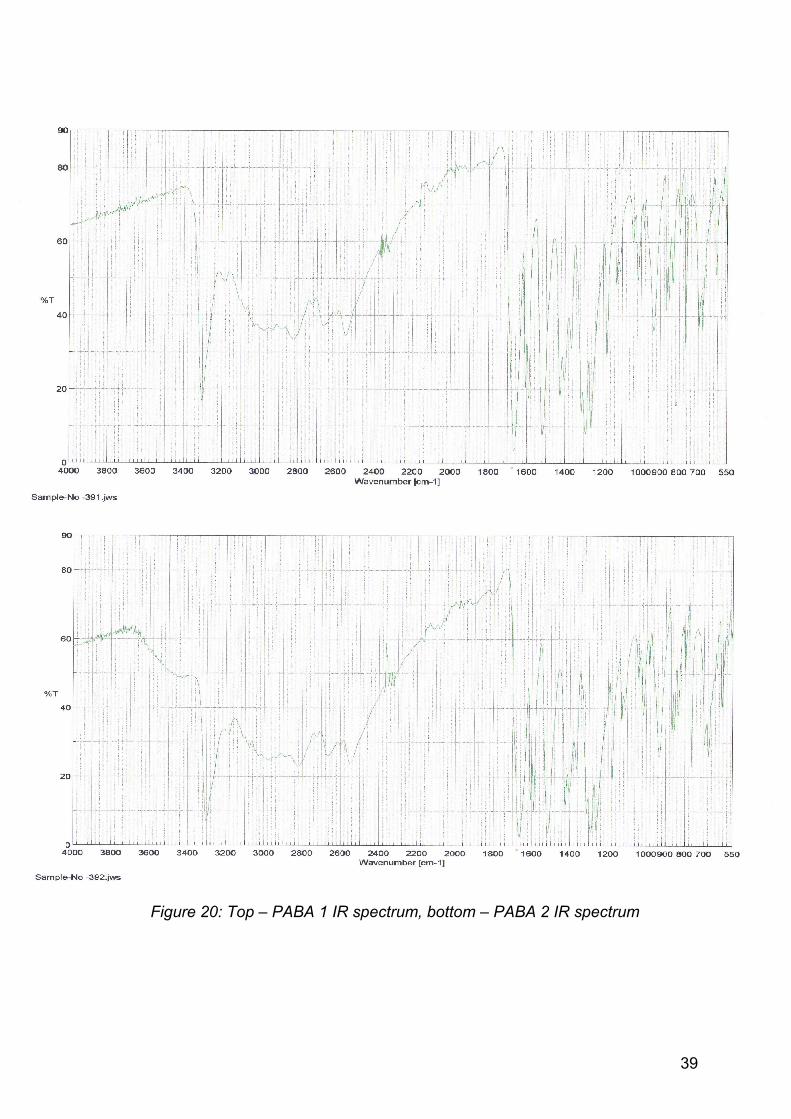
Figure 20: Top – PABA 1 IR spectrum, bottom – PABA 2 IR spectrum
39

PABA 1 and PABA 2 IR spectra were similar. There were slight differences between
the products and the control spectra. Most notable was the absence of the NH amine
absorption at 3500 – 3400 cm-1 range on both product spectra.
3.4 – Fischer Esterification
Figure 21: Benzocaine product
The benzocaine product was off-white as expected. The product had a powdered
appearance composed of some larger granules. The product could easily be broken
apart and it had a soft handle.
40
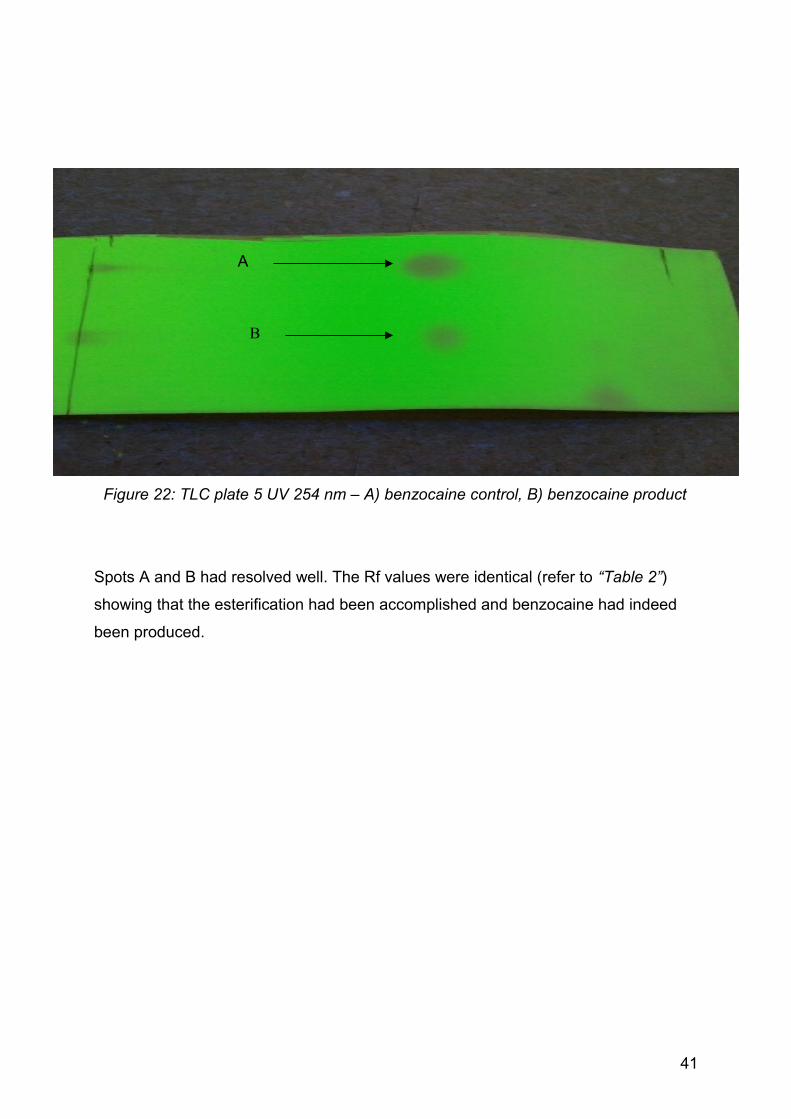
Figure 22: TLC plate 5 UV 254 nm – A) benzocaine control, B) benzocaine product
Spots A and B had resolved well. The Rf values were identical (refer to “Table 2”)
showing that the esterification had been accomplished and benzocaine had indeed
been produced.
B
A
41

Figure 23: Benzocaine IR spectrum: top – control, bottom – product
42
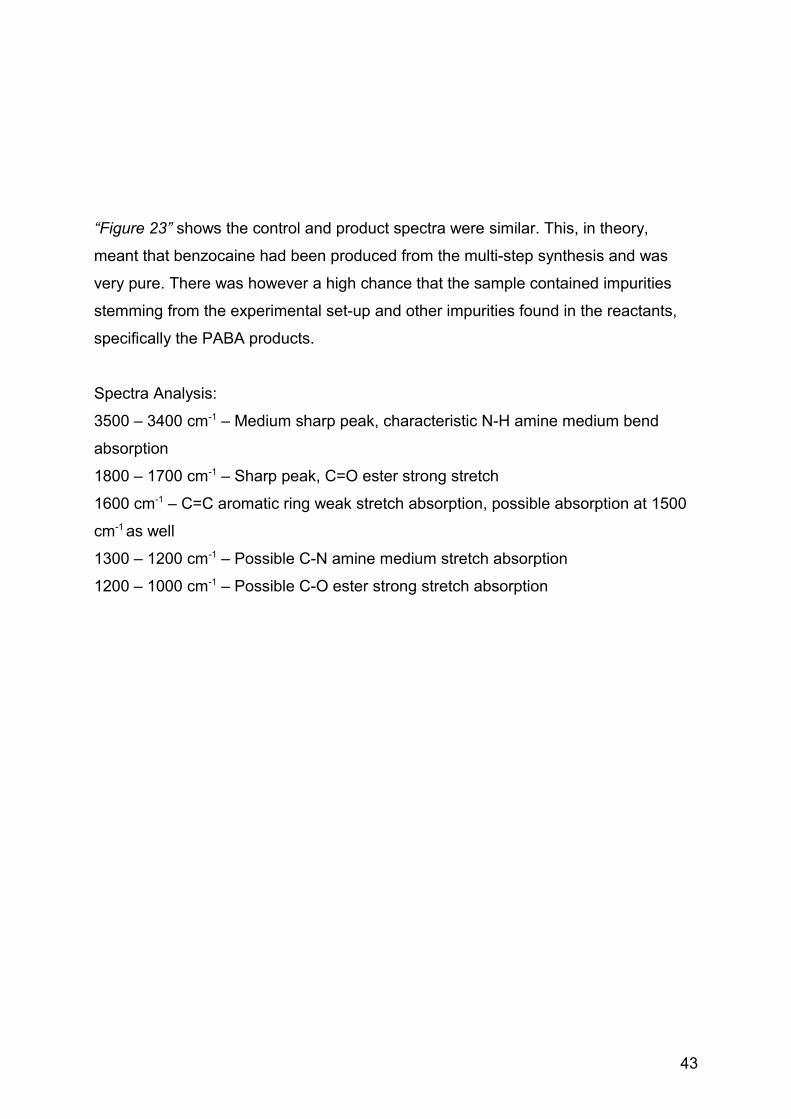
“Figure 23” shows the control and product spectra were similar. This, in theory,
meant that benzocaine had been produced from the multi-step synthesis and was
very pure. There was however a high chance that the sample contained impurities
stemming from the experimental set-up and other impurities found in the reactants,
specifically the PABA products.
Spectra Analysis:
3500 – 3400 cm-1 – Medium sharp peak, characteristic N-H amine medium bend
absorption
1800 – 1700 cm-1 – Sharp peak, C=O ester strong stretch
1600 cm-1 – C=C aromatic ring weak stretch absorption, possible absorption at 1500
cm-1 as well
1300 – 1200 cm-1 – Possible C-N amine medium stretch absorption
1200 – 1000 cm-1 – Possible C-O ester strong stretch absorption
43
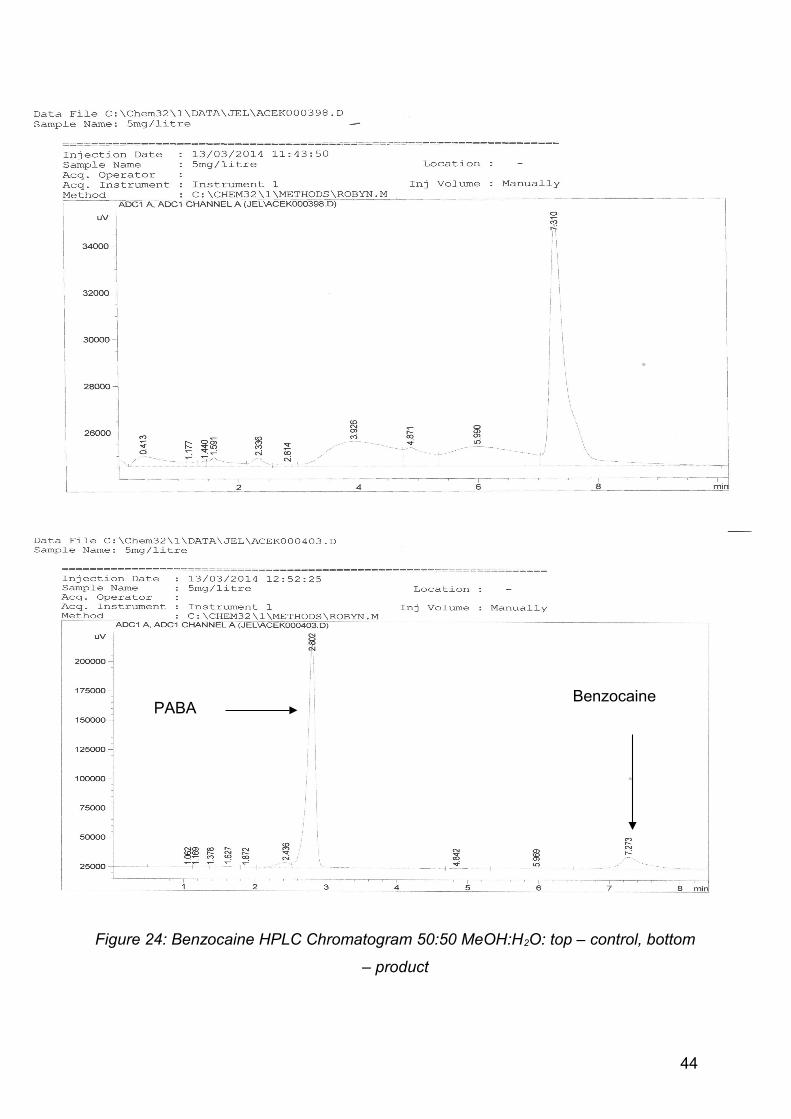
Figure 24: Benzocaine HPLC Chromatogram 50:50 MeOH:H2O: top – control, bottom
– product
PABABenzocaine
44

“Figure 24” displays the HPLC chromatogram for the benzocaine control and
benzocaine product. The control chromatogram showed that benzocaine had a
retention time of 7.310 min.
The product resolved at 7.273 min with a substantially smaller peak. As the retention
times were similar this product peak was taken to confirm that benzocaine had been
produced and the multi-step synthesis had worked to an extent.
The peak at 2.802 min on the product chromatogram was found to be PABA that had
not been fully converted during fischer esterification. This was confirmed by running a
standard PABA sample through the HPLC.
45

Chapter 4 – Conclusion
4.1 – Discussion
From “Table 2” it can be seen that the mp for the p-methylacetanilide product was in
the standard mp range obtained from the MSDS (151°C). The mp for p-acetamido
benzoic acid was over the standard range (>262°C) as were the values obtained for
the two PABA products (>189°C). These values alluded to the possibility that these
products were not 100% pure however confirmation of this could not have been
made on mp results alone as mp was known to be highly variable through out
different commercial and university laboratories. The mp results did however
corroborate later findings that did confirm the imperfections in the synthesis.
The Rf values were also similar for products and controls meaning that the reactions
had progressed and some form of reactant conversion had taken place at each step.
The TLC plate obtained for p-acetamidobenzoic acid (“Figure 15”) also showed extra
spots along with the control and product spots. They were noted as contamination
but it was unclear from where they had arisen from. The contamination could have
more than likely come from external factors when preparing the plates as one of
these spots resolved before the control spot, which was thought of as being a highly
pure compound.
The 30:70 acetonitrile water mobile phase was sufficient for adequate resolution of
products. Addition of two drops of acetic/HCl acid helped to aid resolution for the p-
acetamidobenzoic acid product and the two PABA products so the spots could be
easily visible along side the controls. A 50:50 methanol:water mobile phase provided
the best results for the TLC of benzocaine. The spots obtained from this mobile
46
phase were clear, regular shaped and streaking was greatly reduced (ref to “Figure
22”). The same mobile phase was chosen for the HPLC analysis due to these results.
The yield obtained after the oxidation reaction was substantially low however only
1.1068 g p-methylacetanilide from a possible 5.3156 g was carried over and used for
this reaction. Another reason for the low yield may have been because some of the
product may have adsorbed to manganese dioxide during the oxidation reaction.
Loss of product coupled with reduced amount of starting material may have resulted
in less PABA being produced.
The IR spectrum for the PABA 1 and PABA 2 products were also similar. These
results may have shown the limitations of IR as it failed to pick up any impurities
associated with PABA 2 (mixture of compounds).
The spectrum for the benzocaine product was similar to the control and all of the
relevant peaks were observed. There was however a high chance that the product
contained impurities due to the experimental set-up. Again they may not have been
detected due to limitations with the IR spectrometer. For confirmatory analysis the
final product was analysed using HPLC and it was found that benzocaine had been
produced with a retention time (7.273 min) similar to the control (7.310 min). Another
peak was found to appear at the 2 min mark (2.802). This peak was speculated as
being PABA which had not been fully converted during the esterification.
One reason as to the reduced conversion rate of PABA to benzocaine may have
been due to the reflux of the mixture during esterification. The heating mantle may
not have provided adequate heating of the mixture. Benzocaine yield may also have
been reduced due to loss of solvent as condensation during the reflux.
Multistep synthesis had been carried out for the production of benzocaine starting
with p-toluidine. The practical aspects of the method did work in that benzocaine had
been produced from a series of four different reactions starting with p-toluidine. This
showed that the conversion potential of reactants to products using the designed
process was indeed possible, and in this case the experiment was a success.
47
The final yield was low and the product was found to be contaminated with significant
amounts of PABA and other possible impurities.
4.2 – Further Work
Further work would look at optimising the reaction conditions to reduce the presence
of impurities and to increase the product yield. One way to increase product yield
would be to use more reactant. Loss of product during the experiment should also be
avoided.
HPLC analyses could be carried out after each stage in the synthesis to help monitor
the progress of the reaction and identify the quality of the products earlier on. Further
confirmatory analyses could employ the use of both IR spectroscopy followed up by
Nuclear Magnetic Resonance (NMR) to obtain high quality structural information. The
proton NMR spectrum of benzocaine would produce 5 distinct peaks. The NMR
peaks could be easily differentiated than compared with the apparent cluster of IR
peaks. This would also provide the added ability to highlight distinct compounds that
have contaminated the product. Both NMR and IR could still be used together in
order to provide reliable data.
Improvements to the IR analysis may include a sample preparation step using the
KBr discs. This method would ensure that all water has been removed from the
sample and greatly improve the signal to noise ratio. A clear spectrum should be
produced following this procedure.
The use of mass spectrometry (MS) coupled with HPLC would also provide
characteristic retention time data along with mass spectral fingerprint data of the
sample.
48
The fragmentation pattern of the sample could help to aid in the identification of any
impurities. LC-MS could be used after each reaction to help monitor the progress of
the reaction however, if impurities were found then this would increase the chances
of back-tracking and depending on time constraints, this could be a disadvantage.
The use of fluorescence and amperometric detectors may also be beneficial to the
analysis as these detectors have been found to be more sensitive than the commonly
used UV/Vis detectors in HPLC [12].
49

Appendix 1 – Table of mobile phases used for TLC
Solvent 1 Solvent 2 Acid RatioMethanol Water - 50:50Ethanol Water HCl 50:50
Acetonitrile Water Acetic Acid/HCl 30:70Acetonitrile - - 100
Cyclohexane - - 100Toluene - - 100Acetone - - 100
Appendix 2 – Table of solvent polarity parameters (P’)
Solvent P’Water 10.2
Acetonitrile 5.8Acetone 5.1Methanol 5.1Ethanol 4.3
[12]
Acknowledgments
Dr. Jim Neagle – Project Supervisor
Dr. Ray Ansell – Project Co-ordinator
50

School of Engineering and Built Environment
Forensics/Chemistry Academic Staff -
Provided guidance and information throughout the course
Colin Russell (Senior Chemistry Lab Technician) and the Laboratory Staff -
Provided the chemicals for the experiment, the instruments/glassware, and guidance
on methodology
Bibliography
51
1) McMurray, J., 2003, “Fundamentals of Organic Chemistry”, 5th ed., Brooks/Cole
Pub. Co. pp. Chapter 5: Aromatic Compounds, Chapter 13: Structure Determination
(IR Spectroscopy) ISBN: 0-5343-9573-2.
2) Hart, H., Craine, L. E., Hart, D., J., 2003, “Organic Chemistry; A Short Course”,
11th ed., Houghton Mifflin Co. pp. Chapter 4: Aromatic Compounds, ISBN: 0-6182-
1536-0.
3) Adapted by Minard, R. Revised: 16/10/2000, Experiment 86: The Preparation of
Local Anesthetic, Benzocaine, by an Esterification Reaction, pdf [online],
http://courses.chem.psu.edu/chem36/Experiments/Exp86.pdf, Pennsylvania State
University: Introduction to Organic Laboratory Techniques: A Microscale Approach,
[accessed 14/10/2003].
4) Experiment 4: Reactions of Carboxylic Acids & Their Derivatives, 2004, Chem
2OB3 Lab Manual, pdf [online],
http://www.chemistry.mcmaster.ca/~chem2ob3/20b3_summer2004_exp4.pdf,
McMaster University, [accessed 14/10/2013].
5) ChemSpider, 2013, compound database - Benzocaine CSID:13854242 [online],
http://www.chemspider.com/Chemical-Structure.13854242.html, Royal Society of
Chemistry, [accessed 14/10/2013].
6) PubChem, 2013, compound summary for benzocaine CID: 2337 [online],
http://pubchem.ncbi.nlm.nih.gov/summary/summary.cgi?cid=2337, National Center
52

for Biotechnology Information, U.S. National Library of Medicine, [accessed
14/10/2013].
7) SigmaAldrich, 2013, compound database for E1501 sigma benzocaine CAS: 94-
09-07 [online], http://www.sigmaaldrich.com/catalog/product/sigma/e1501?
lang=en®ion=GB, SigmaAldrich Co. LLC., [accessed 13/04/2014]
8) Guertler, A.T. & Pearce, W.A. 1994, "A prospective evaluation of benzocaine-
associated methemoglobinemia in human beings", Annals of Emergency
Medicine, Vol. 24, no. 4, pp. 626-630, ISSN: 0196-0644.
9) UNCW Department of Chemistry and Biochemistry, 2013, Experiment 16:
Synthesis of p-Methylacetanilide, powerpoint [online],
www.uncw.edu/chem/Courses/Chml212/.../amide%20synthesis.ppt, University of
North Carolina Wilmington, [accessed 14/10/203].
10) Yee, L., 2014, 21 Multistep Preparations lab manual, pdf [online],
http://ccchemteach.com/wp-content/uploads/2013/01/Lab7MulStepSunscreen.pdf,
ccChemTeach.com, [accessed 12/02/2014].
11) Anderson, R.J., Bendell, D.J.Groundwater, P.W. Organic spectroscopic analysis,
Royal Society of Chemistry
12) Dr. McNaughtan, M., “Chromatography Lecture Notes and Tutorials”, 2012,
School of Engineering and Built Environment, Glasgow Caledonian University.
13) Amresh, J., Fried, B., 2003, “Handbook of Thin-Layer Chromatography”, 3rd ed.,
CRC Press LLC., pp. Chapter 1: Basic TLC Techniques, Materials, and Apparatus,
53
Chapter 2: Theory and Mechanism of Thin-Layer Chromatography, eBook ISBN: 0-
203-91243-8.
14) Clark, J., 2004, Nitration of Benzene and Methylbenzene, Chemguide [online],
http://www.chemguide.co.uk/organicprops/arenes/nitration.html, Chemguide,
modified September 2013, [accessed 28/01/2014].
54