Embed Size (px)
Citation preview

ZHIQI YAO COMPARISON OF STRUCTURES AND PROPERTIES OF ARC-MELTED AND INDUCTION-MELTED HIGH ENTROPY ALLOYS
Master of Science thesis
Examiner: Associate. Prof. PASI PEURA Dr. Tech. MIKKO HOKKA Examiner and topic approved by the Faculty Council of the Faculty of Materials Science on 17th August 2016
ii
ABSTRACT
ZHIQI YAO: Comparison of structures and properties of arc-melted and induction-melted high entropy alloys Tampere University of technology Master of Science Thesis, 54 pages August 2016 Master’s Degree Programme in Materials Engineering Major: Material Science Examiner: Associate Professor Pasi Peura, University Lecturer Mikko Hokka Keywords: High entropy alloys, casting methods, microstructures, mechanical properties. High entropy alloys contains five to thirteen different kinds of metallic elements which
have different mechanical properties compared to the conventional alloys. Generally,
high entropy alloys are manufactured firstly by melting the requested metals by arc-
melting or induction-melting and then casting in different atmospheres. It is interesting
to know whether the HEAs manufactured in different methods show similar structures
and properties.
In this master’s thesis, the arc-melted Al0.5CrFeCoNiCu is chosen as the reference sample.
Meanwhile, induction-melted Al0.5CrFeCoNiCuMo0.25 and Al0.5CrFeCoNiCu which
casted in air and vacuum condition are studied also for finding out whether
Al0.5CrFeCoNiCu HEAs with desired properties can be manufactured by this way. The
microstructures of HEA samples were observed with optical microscope and scanning
electron microscope while the crystalline structure was studied by X-ray diffraction.
Afterwards, the compression test was carried out to obtain mechanical properties of
HEAs.
By SEM, it could be seen that HEA samples had similar composition distribution.
However, dark spots which contains sulfur inclusion could be found in induction-melted
samples. The induction-melted Al0.5CrFeCoNiCu HEAs had a bcc+fcc structure and
showed more brittle. By contrast, the induction-melted Al0.5CrFeCoNiCuMo0.25 HEAs
had a fcc crystalline structures and showed good ductility. In summary, the induction-
melted Al0.5CrFeCoNiCu HEAs samples showed relatively poor mechanical properties
compared to reference samples. In order to alter this condition, since the mechanical
properties are related to the cooling rate and impurities, it is recommended to control the
cooling rate and reduce the amount of impurities.
iii
PREFACE
This study represents a big step towards my following life. I would like to appreciate
everyone who provided help to me during this time.
I would like to thank Mr. Pasi Peura who has been extremely professional on guiding me
during the whole project. He provided excellent ideas about dealing with the specific
problems during the project. Mr. Mikko Hokka also helped me with compression test and
X-ray diffraction part. I also want to thank Mr. Madan Patnamsetty who helped me a lot
during the experiments. He has a deep understanding about the knowledge we need and
he is a skillful operator when doing the sample testings. Also, I want to thank the other
staff and students for their patience and help.
The reference samples are provided by Assistant Professor Sheng Guo from Chalmers
University of Technology. I would like to thank him for his contribution to this work.
The most important thing I got from this project is that the ability to overcome the
diffculties when facing the unknown hinder and alter the plan. It is not a easy thing for
me but at least I learnt a lot during this project.
Tampere, 01.11.2016
Zhiqi Yao

iv
LIST OF SYMBOLS AND ABBREVIATIONS
HEAs High entropy alloys
BCC Body Centered Cubic
FCC Face Centered Cubic
S Entropy
H Enthalpy
G Gibbs free energy
R Gas constant
NA Avogadro’s number
n Total number of principle elements
C Number of components
F Degree of freedom
P Number of Phases
SEM Scanning electron microscopy
DAS Dendrite arm spacing
XRD X-ray diffraction
VEC Valence electron concentration
DSC Differential scanning calorimetry
EDS Energy-dispersive X-ray spectroscopy
EHT Electron high tension
AsB Angle selective backscatter
e Engineering strain
ε True strain
σe Engineering stress
σtrue Engineering stress
v
Table of Content
1. INTRODUCTION ................................................................................................................ 1
2. STRUCTURE AND PROPERTIES OF HIGH ENTROPY ALLOYS ........................... 3
2.1 Core effect ................................................................................................................... 3
2.1.1 High entropy effect ............................................................................................. 3
2.1.2 Severe lattice distortion effect .......................................................................... 5
2.1.3 Sluggish diffusion effect .................................................................................... 6
2.1.4 Cocktail effect ..................................................................................................... 7
2.2 Manufacture of HEAs ................................................................................................. 8
2.2.1 Arc melting ........................................................................................................... 8
2.2.2 Induction melting ................................................................................................ 9
2.2.3 Soild-state powder processing ....................................................................... 10
2.2.4 Magnetron sputtering ....................................................................................... 11
2.3 Structure of HEAs ..................................................................................................... 12
2.3.1 Crystalline structure of HEAs .......................................................................... 12
2.3.2 Microstructure of HEAs .................................................................................... 15
2.4 Mechanical properties of HEAs .............................................................................. 18
2.5 Other properties ........................................................................................................ 20
2.6 Applications of HEAs ............................................................................................... 25
3 EXPERIMENTS METHODS ........................................................................................... 26
3.1 HEA Samples ............................................................................................................ 26
3.2 Testing methods ....................................................................................................... 27
3.2.1 Optical microscopy and scanning electron microscopy ............................. 27
3.2.2 X-ray diffraction ................................................................................................. 28
3.2.3 Hardness testing ............................................................................................... 29
3.2.4 Compression testing ........................................................................................ 30
4 RESULTS AND DISCUSSION ....................................................................................... 32
4.1 Optical microscopy images ..................................................................................... 32
4.2 SEM images .............................................................................................................. 33
4.3 EDS mapping ............................................................................................................ 37
4.4 X-ray diffraction ......................................................................................................... 41
4.5 Hardness test ............................................................................................................ 44
4.6 Compression tests ................................................................................................... 46
5 CONCLUSION .................................................................................................................. 53

vi
6 REFERENCES ................................................................................................................. 55

1
1. INTRODUCTION
Currently, high entropy alloys (HEAs) are interested because of their special structures and
high performance in mechanical properties. High entropy alloys are the alloys which consists
at least five different principal elements. The atomic percents of each element are in equal or
near equal. Normally, high entropy alloys behave higher mechanical properties and also have
good corrosion and oxidation resistance compared to conventional alloys. Although the idea
of HEAs was published before 2004, the research was accelerated after 2010. Therefore,
HEAs are a kind of new material which has flexible composition and adjustment properties.
It is also insteresting to see how the properties change by adding the different additional
elements into basic metals (aluminum or iron) during manufacturing of HEAs. As the Fig.1.1
shows, as the increasing of n, total number of equiatomic compositions experience a dramatic
increasing. When n reached to 16, almost 104 of equiatomic compositions can be found.
Therefore, it brings a large amount of posibilities to the researchers who study HEAs.
Fig.1.1. The relationship between total number of equiatomic compositions and total
number of principal elements. [1]
The structures and properties of high entropy alloys are influenced by a large amount of
parameters. For instance, casting atomosphere, composition of different elements during

2
melting and heat treatments after manufacturing all have impacts on structures and properties
of high entropy alloys. Generally, high entropy alloys are manufactured by arc-melting or
induction-melting casting. The obtained products may have different structures and
mechanical properties. Arc-melting has a high vacuum level which is benificial to avoid of
impurities while induction-melting is easy to control and can prevent alloying loss to some
extend. In this project, the main aim is to compare the structures and mechanical properties
of HEAs melted by arc-melting and induction-melting. In this work, different kinds of
samples are chosen: arc-melted Al0.5CrFeCoNiCu HEA, induction-melted Al0.5CrFeCoNiCu
HEA and induction-melted Al0.5CrFeCoNiCuMo0.25 HEA are studied.
In this study, the microstructures of HEAs are observed and analyzed by optical microscope
and scanning eletron microscope while the crystalline structures are determined by X-ray
diffraction. After that, hardness and compression tests are applied to find out the mechanical
properties of HEAs. By combining the microstructures and mechanical properties, the
conclusion can beobtained. It is also interesting to see whether the induction-melted
Al0.5CrFeCoNiCu HEA shows similar microstructures and properties when compared to arc-
melted Al0.5CrFeCoNiCu HEA. If not, it is important to see what happened to the final
products and what should be done to alter this condition. As for Al0.5CrFeCoNiCuMo0.25
HEA samples, it is desired to know whether the addition of molybdenum change the
mechanical properties of HEAs.

3
2. STRUCTURE AND PROPERTIES OF HIGH
ENTROPY ALLOYS
This chapter will describe the structures and properties of high entropy alloys. The
description is beginning with four core effects of HEAs: high entropy effect, severe lattice
distortion effect, sluggish diffusion effect and cocktail effect as well. Then it lays out some
basic methods of manufacture of HEAs, among which the arc-melting and induction-melting
are the most vital processings to the whole project. Afterwards, both the crystalline structures
and microstructures are discussed according to the previous published literature. Next, the
mechanical properties of HEAs are also introduced as it is important to find out the specific
mechanical property before applications. Genarally, HEAs have higher mechanical
properties and corrosion resistance compared to traditional alloys. Finally, some mordern
applications about HEAs are figured out.
2.1 Core effect
Compared to conventional alloys, HEAs have four core effect: high entropy effect, severe
lattice distortion effect, sluggish diffusion effect and cocktail effect.
2.1.1 High entropy effect
According to Gibb’s phase rule, the Gibbs free energy of HEAs can be calculated by the
following equations: [2]
∆𝐺𝑚𝑖𝑥 = ∆𝐻𝑚𝑖𝑥 − 𝑇∆𝑆𝑚𝑖𝑥 (2-1)
∆𝑆𝑚𝑖𝑥 = −𝑅∑ 𝑐𝑖𝑁𝑖=1 𝑙𝑛𝑐𝑖 (2-2)
∆𝐻𝑚𝑖𝑥 = ∑ 4∆𝐻𝐴𝐵𝑚𝑖𝑥𝑐𝑖𝑐𝑗
𝑁𝑖=1,𝑖≠𝑗 (2-3)
N is the number of component, R is the ideal gas constant. The c refers to atomic fraction.
Alloys that contain several different metallic elements tend to form brittle and complex
structures. Gibbs phase rule describes the number of phases (P) in the known alloy at constant
pressure in equilibrium system as: [2]
P = C + 1 – F (2-4)
4
Where C is the number of metallic elements and F is the maximum number of thermodynamic
degrees of freedom in the given system. [2] When pose a 5-component system as an example,
the possible number of equilibrium phases is six accrodding to the equation. However, high
entropy alloys consist of only a few solid solution phases surprisely which is far lower than
the maximum value given by Gibbs phase rule. This situation can be explained as the high
mixing entropy existed in HEAs enhances the solubility among elements and hinder the
possible separation from phase to intermetallic phases. As a result, high entropy alloys tend
to form high entropy phases instead of intermetallic phases.
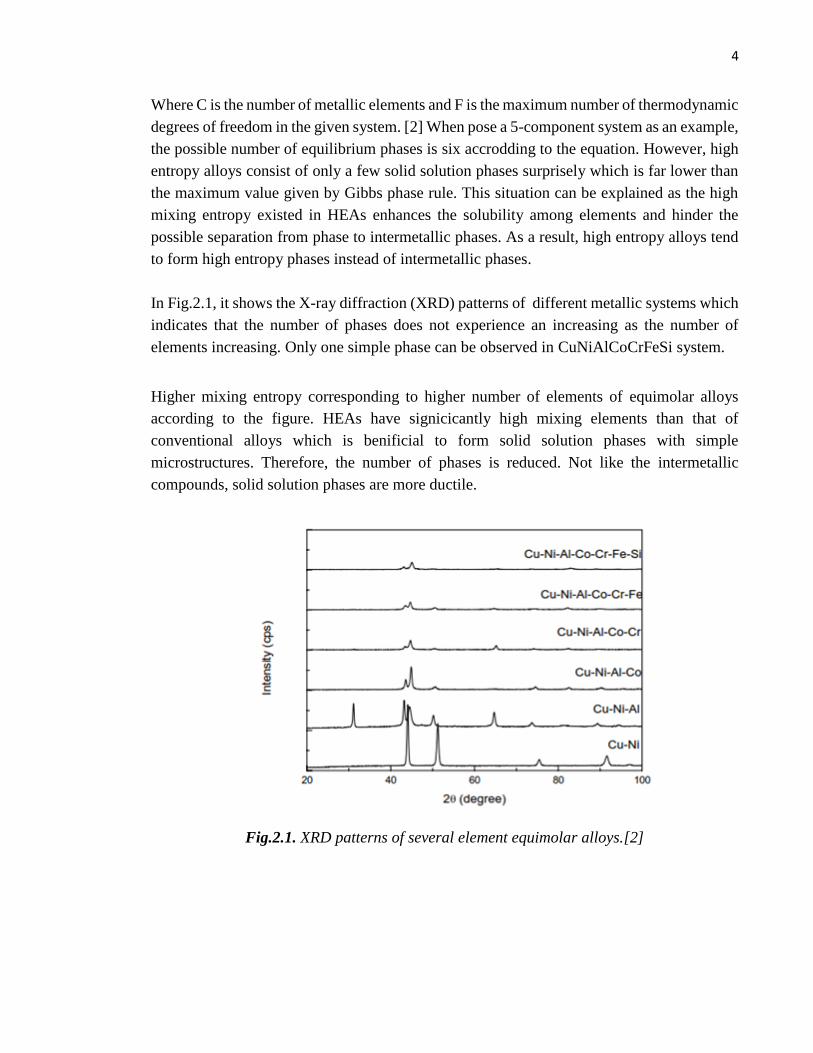
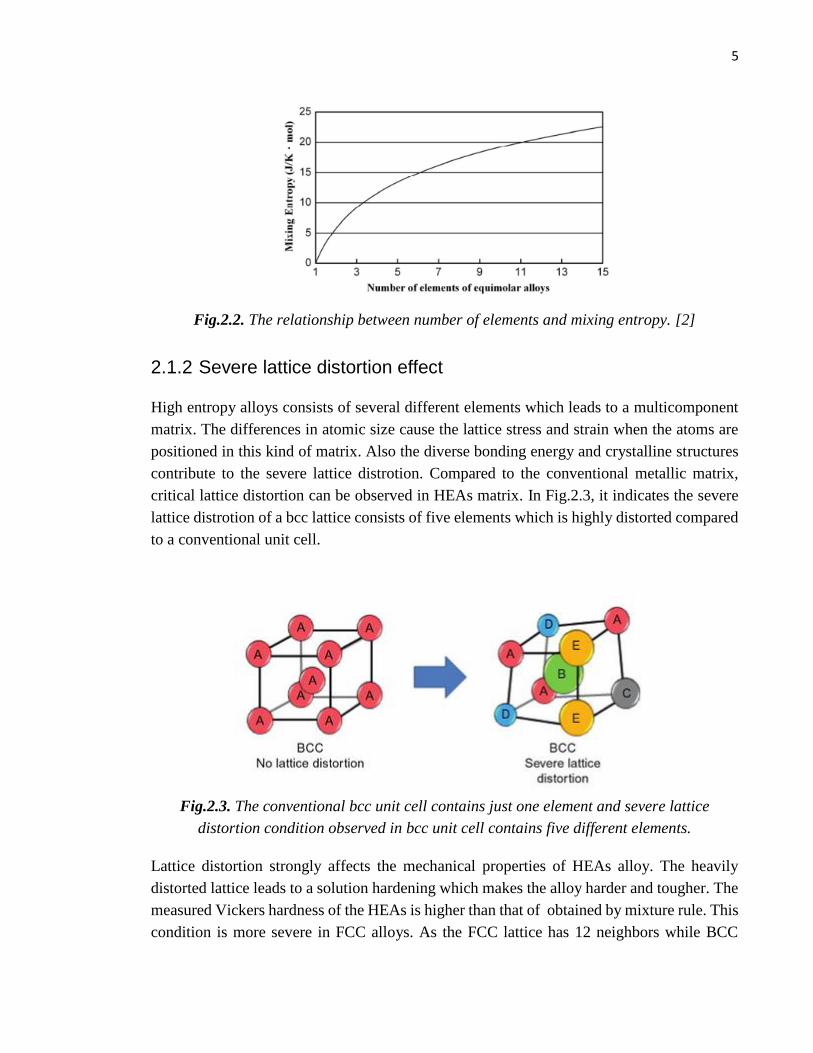
In Fig.2.1, it shows the X-ray diffraction (XRD) patterns of different metallic systems which
indicates that the number of phases does not experience an increasing as the number of
elements increasing. Only one simple phase can be observed in CuNiAlCoCrFeSi system.
Higher mixing entropy corresponding to higher number of elements of equimolar alloys
according to the figure. HEAs have signicicantly high mixing elements than that of
conventional alloys which is benificial to form solid solution phases with simple
microstructures. Therefore, the number of phases is reduced. Not like the intermetallic
compounds, solid solution phases are more ductile.
Fig.2.1. XRD patterns of several element equimolar alloys.[2]
5
Fig.2.2. The relationship between number of elements and mixing entropy. [2]
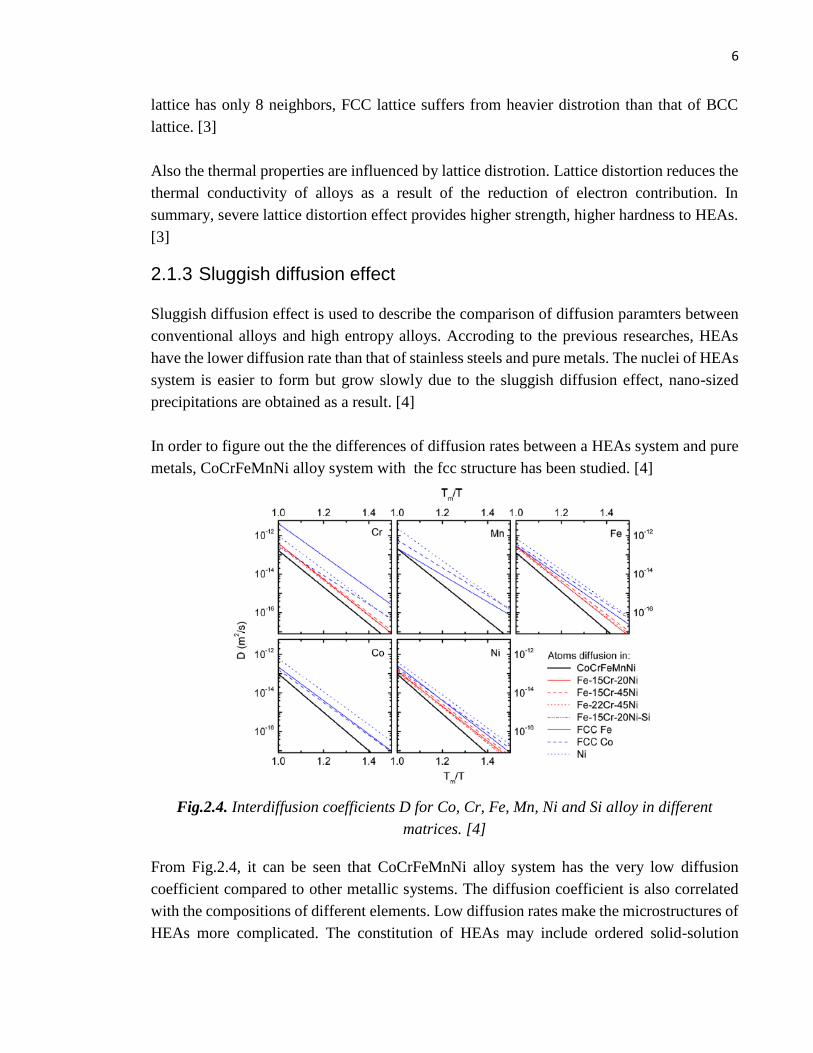
2.1.2 Severe lattice distortion effect
High entropy alloys consists of several different elements which leads to a multicomponent
matrix. The differences in atomic size cause the lattice stress and strain when the atoms are
positioned in this kind of matrix. Also the diverse bonding energy and crystalline structures
contribute to the severe lattice distrotion. Compared to the conventional metallic matrix,
critical lattice distortion can be observed in HEAs matrix. In Fig.2.3, it indicates the severe
lattice distrotion of a bcc lattice consists of five elements which is highly distorted compared
to a conventional unit cell.
Fig.2.3. The conventional bcc unit cell contains just one element and severe lattice
distortion condition observed in bcc unit cell contains five different elements.
Lattice distortion strongly affects the mechanical properties of HEAs alloy. The heavily
distorted lattice leads to a solution hardening which makes the alloy harder and tougher. The
measured Vickers hardness of the HEAs is higher than that of obtained by mixture rule. This
condition is more severe in FCC alloys. As the FCC lattice has 12 neighbors while BCC
6
lattice has only 8 neighbors, FCC lattice suffers from heavier distrotion than that of BCC
lattice. [3]
Also the thermal properties are influenced by lattice distrotion. Lattice distortion reduces the
thermal conductivity of alloys as a result of the reduction of electron contribution. In
summary, severe lattice distortion effect provides higher strength, higher hardness to HEAs.
[3]
2.1.3 Sluggish diffusion effect
Sluggish diffusion effect is used to describe the comparison of diffusion paramters between
conventional alloys and high entropy alloys. Accroding to the previous researches, HEAs
have the lower diffusion rate than that of stainless steels and pure metals. The nuclei of HEAs
system is easier to form but grow slowly due to the sluggish diffusion effect, nano-sized
precipitations are obtained as a result. [4]
In order to figure out the the differences of diffusion rates between a HEAs system and pure
metals, CoCrFeMnNi alloy system with the fcc structure has been studied. [4]
Fig.2.4. Interdiffusion coefficients D for Co, Cr, Fe, Mn, Ni and Si alloy in different
matrices. [4]
From Fig.2.4, it can be seen that CoCrFeMnNi alloy system has the very low diffusion
coefficient compared to other metallic systems. The diffusion coefficient is also correlated
with the compositions of different elements. Low diffusion rates make the microstructures of
HEAs more complicated. The constitution of HEAs may include ordered solid-solution

7
phases, disordered solid-solution phases, amorphous phases and also nano-sized precipitates.
With SEM and TEM, the size of the final particles can be measured which helps to find out
the nano-sized precipitates. The fine precipitation could increase the toughness and strength
of HEAs. Also the creep resistance can be improved to achieve a longer life time of alloy
products. [4]
2.1.4 Cocktail effect
Cocktail effect can be described as an enhancement of the mechanical properties of HEAs by
their constituents. High entropy alloys have ideal hardness and toughness properties
compared to the conventional alloys. Moreover, some unexpected properties can also be
obtained by mixing different elements, which could not be observed in the individual element.
Fig.2.5. HEAs show an excellent combination of yield strength and fracture toughness as
the result of cocktail effect. [5]
From Fig.2.5, it can be concluded that the HEAs have the high fracture toughnesss and high
yield strength among the mentioned materials. In addition to the high strength properties,
other enforced parameters such as a wide range of Young’ modulus are reported also.
Moreover, high electrical resistance and low coercivity can also be brought to HEAs due to
cocktail effect. The enhancement of the properties offers a wide range of applications for
HEAs. [5]

8
2.2 Manufacture of HEAs
Most high entropy alloys are manufactured by vacuum arc melting, induction melting.
2.2.1 Arc melting
Vacuum arc melting is the method in which an electric arc is used to melt the metallic
materials within the vacuum container.
Fig.2.6. The equipment of vacuum arc melting. [6]
Fig.2.6 shows the equipment of vacuum arc melting processing. The electric arc contact with
the tip of the starting ingot. Then the ingot is melted within a vacuum furnace. As the melted
electrode drops into the bottom of that container, the residual gases such as nitrogen and
oxygen are removed from the surface of the ingot drops. Thus the properties of the final
alloys can be improved significantly. The high ductility and ideal resistance to fatigue can be
observed in products when melting in this way. A large amount of steels and metals can be
processed by arc melting, such as 9310 steel, Ti-6Al-4V and nickel superalloys. When
processing metallic materials in arc melting, it is vital to control the consistency of the
melting as the complex thermal transfer may influence the properties of the alloys. [6]
Arc remelting is a processing which is used to refine the structure and minimize the impurities
contents of ingot. The continuous remelting of ingot is carried out by arc in a vacuum level.
As the products manufactured by induction-melting may have rough structure and defects,
arc remelting can be applied to improve the cleanliness. However, the unmelted residues of
electrode and the splattering of arc may implant in the ingot which induces the white spots
9
in the final products. These white spots have significant influence on mechanical properties
of HEAs. [6]
2.2.2 Induction melting
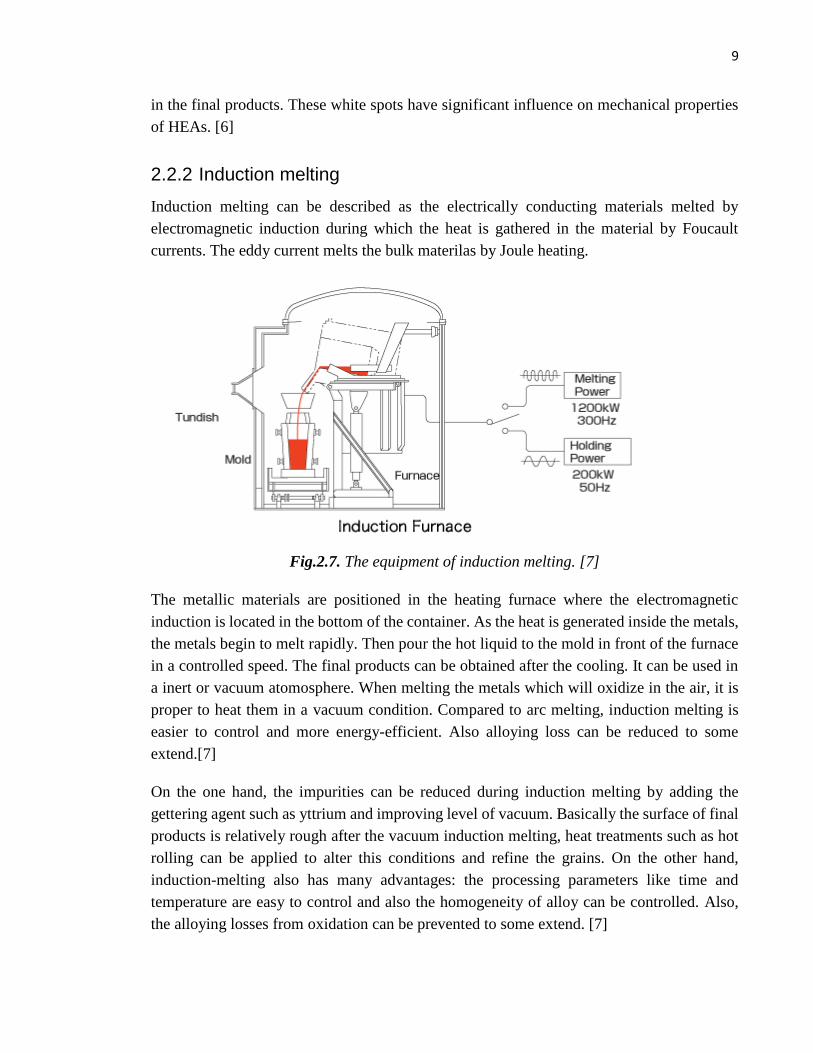
Induction melting can be described as the electrically conducting materials melted by
electromagnetic induction during which the heat is gathered in the material by Foucault
currents. The eddy current melts the bulk materilas by Joule heating.
Fig.2.7. The equipment of induction melting. [7]
The metallic materials are positioned in the heating furnace where the electromagnetic
induction is located in the bottom of the container. As the heat is generated inside the metals,
the metals begin to melt rapidly. Then pour the hot liquid to the mold in front of the furnace
in a controlled speed. The final products can be obtained after the cooling. It can be used in
a inert or vacuum atomosphere. When melting the metals which will oxidize in the air, it is
proper to heat them in a vacuum condition. Compared to arc melting, induction melting is
easier to control and more energy-efficient. Also alloying loss can be reduced to some
extend.[7]
On the one hand, the impurities can be reduced during induction melting by adding the
gettering agent such as yttrium and improving level of vacuum. Basically the surface of final
products is relatively rough after the vacuum induction melting, heat treatments such as hot
rolling can be applied to alter this conditions and refine the grains. On the other hand,
induction-melting also has many advantages: the processing parameters like time and
temperature are easy to control and also the homogeneity of alloy can be controlled. Also,
the alloying losses from oxidation can be prevented to some extend. [7]
10
2.2.3 Soild-state powder processing
Soild-state powder processing can be used to produce powder particals in a high energy ball
mill. Many HEAs are produced by arc melting or casting, however, these methods are not
optimal for industrial processing sine the dimension of final metallic productions are
restricted. By contrast, mechanical alloying provides a more economic way to fabricate
HEAs.
Normally, mechanical alloying involves three seperated stages. The first stage is crushing,
metallic elements materials are crushed into fine powders by a ball mill. After that, the fine
powder particles are cold welded. The metallic powders are then heated until the sintering
occurs and thus the molecular bonds are formed. In this way, HEAs can be obtained without
a melting.
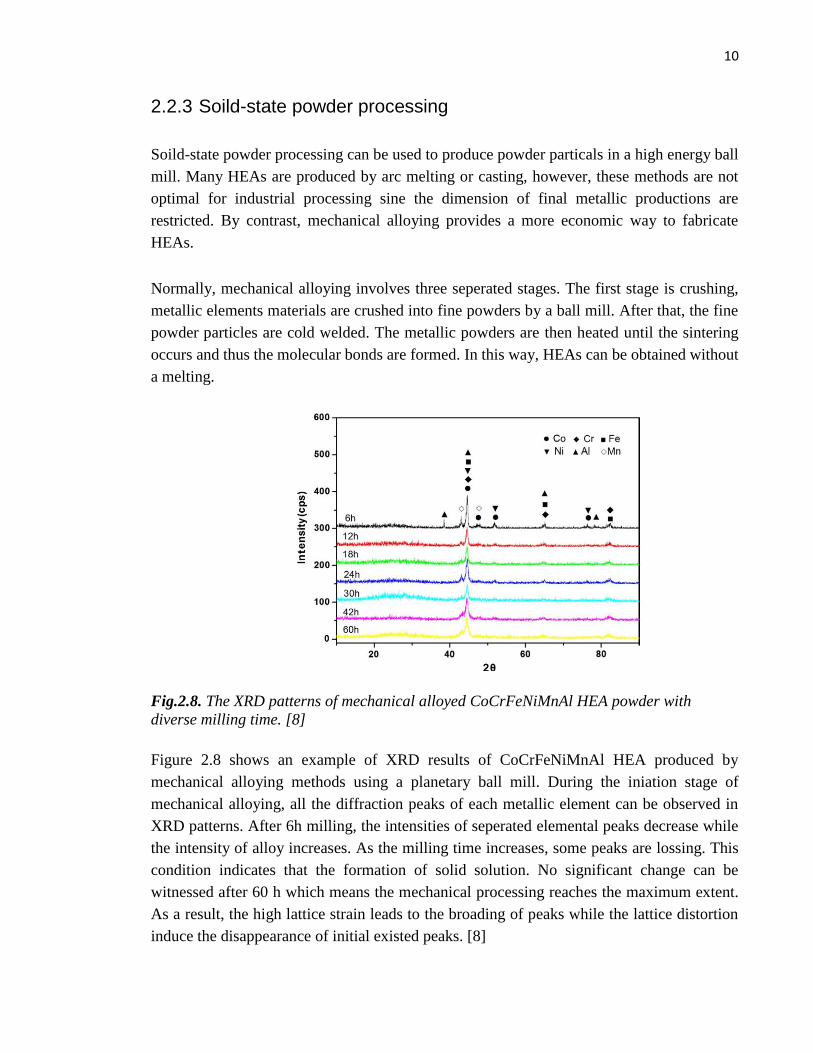
Fig.2.8. The XRD patterns of mechanical alloyed CoCrFeNiMnAl HEA powder with
diverse milling time. [8]
Figure 2.8 shows an example of XRD results of CoCrFeNiMnAl HEA produced by
mechanical alloying methods using a planetary ball mill. During the iniation stage of
mechanical alloying, all the diffraction peaks of each metallic element can be observed in
XRD patterns. After 6h milling, the intensities of seperated elemental peaks decrease while
the intensity of alloy increases. As the milling time increases, some peaks are lossing. This
condition indicates that the formation of solid solution. No significant change can be
witnessed after 60 h which means the mechanical processing reaches the maximum extent.
As a result, the high lattice strain leads to the broading of peaks while the lattice distortion
induce the disappearance of initial existed peaks. [8]
11
2.2.4 Magnetron sputtering
High entropy alloy thin film can be deposited from an alloy target or a mosaic target.
Magnetron sputtering is a method which can reduce the compositional error in high numbers
of metallic elements alloys. It provides a way for ejected atoms from metallic materials to be
cooled in high vacuum and condense on substance thus form a thin film upon the material.
Thus, a tightly bound atomic layer can be formed. In order to enhance the sputtering
processing, a magnetron is used to produce a magnetic field around targeted area.
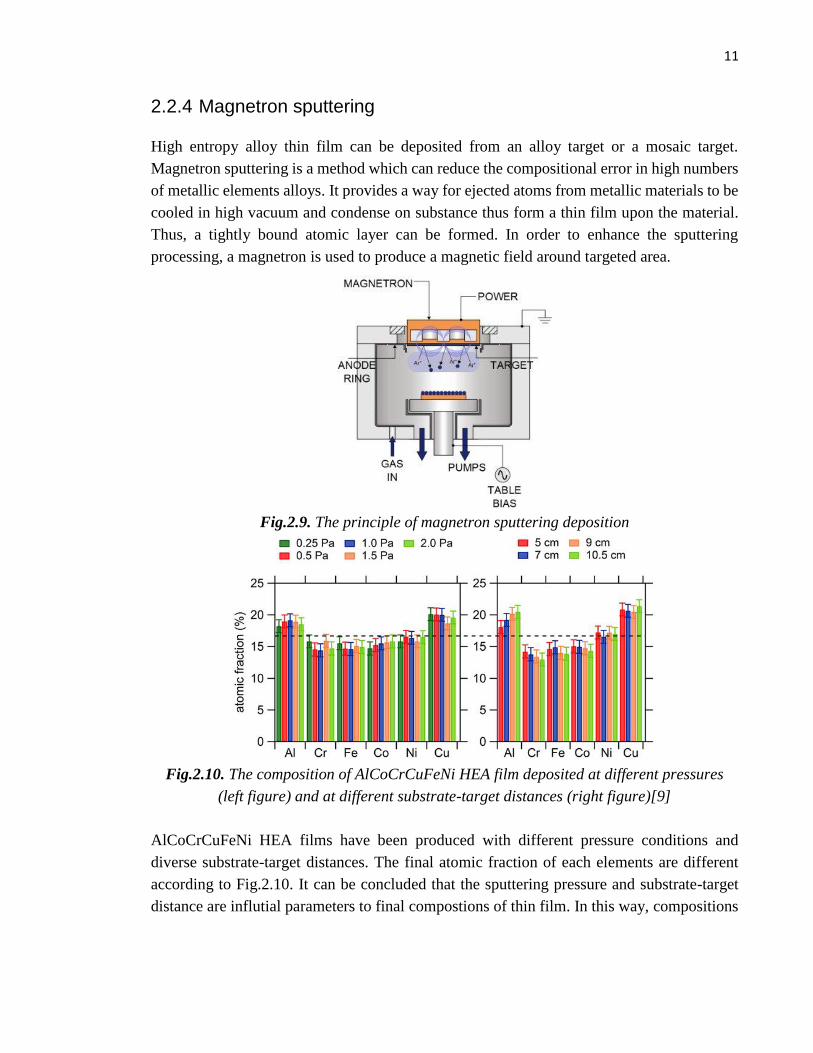
Fig.2.9. The principle of magnetron sputtering deposition
Fig.2.10. The composition of AlCoCrCuFeNi HEA film deposited at different pressures
(left figure) and at different substrate-target distances (right figure)[9]
AlCoCrCuFeNi HEA films have been produced with different pressure conditions and
diverse substrate-target distances. The final atomic fraction of each elements are different
according to Fig.2.10. It can be concluded that the sputtering pressure and substrate-target
distance are influtial parameters to final compostions of thin film. In this way, compositions
12
of HEAs can be controlled by altering the deposition pressure and substrate-target distances.
[9]
2.3 Structure of HEAs
2.3.1 Crystalline structure of HEAs
HEAs normally consist of minimum five different metallic elements in equal or almost equal
atomic percent (at.%). Most HEAs have the crystalline structures as body-centered cubic (bcc)
or face-centered cubic (fcc) structure. Although HEAs with a hexagonal close-packed (hcp)
structure are seldom reported, it is also possible to observe hcp structure in HEAs. Figure 4.1
gives the example for a hexagonal close-packed structure found in YGdTbDyLu and
GdTbDyTmLu alloys. [10]
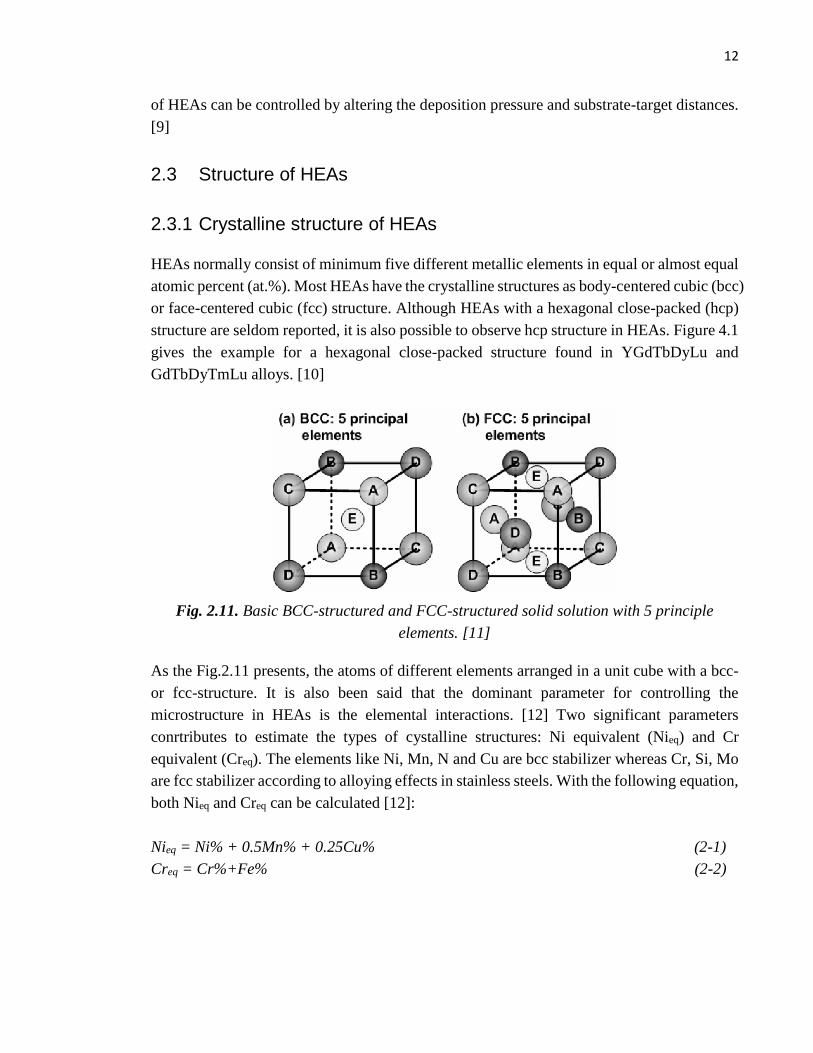
Fig. 2.11. Basic BCC-structured and FCC-structured solid solution with 5 principle
elements. [11]
As the Fig.2.11 presents, the atoms of different elements arranged in a unit cube with a bcc-
or fcc-structure. It is also been said that the dominant parameter for controlling the
microstructure in HEAs is the elemental interactions. [12] Two significant parameters
conrtributes to estimate the types of cystalline structures: Ni equivalent (Nieq) and Cr
equivalent (Creq). The elements like Ni, Mn, N and Cu are bcc stabilizer whereas Cr, Si, Mo
are fcc stabilizer according to alloying effects in stainless steels. With the following equation,
both Nieq and Creq can be calculated [12]:
Nieq = Ni% + 0.5Mn% + 0.25Cu% (2-1)
Creq = Cr%+Fe% (2-2)

13
Where the Ni%, Mn%, Cu%, Cr% and Fe% refers to the atomic percent of each element. In
HEAs, the higher the Nieq, the higher the possibility to get a fcc structure. By contrast, higher
Creq value indicates the tendency to obtain a bcc structure.
Moreover, the valence electron concentration (VEC) also contributes to the estimation of the
crystalline structures of HEAs. Valence electron is an electron that preticipates the formation
of a chemical bond and it is associated with atoms. VEC describes the number of all valence
electrons per number of atoms in the alloy. VEC influence the structures and properties of
HEAs. VEC can be obtained by the following equation [13]:
VEC = ∑Ci(VECi) (2-3)
Where (VECi) is the VEC for the individual element. With the VEC value, phase stability
for bcc and fcc can be predicted in HEAs. For HEAs with the VEC value which is higher
than 8.0, only fcc phase exists. Conversely, bcc phase becomes the dominant phase once the
VEC is lower than 6.8. When the VEC is in a interval between 6.87 and 8.0, a mix phase of
bcc- and fcc-structured can be observed.
Fig.2.12. The relationship between VEC and phase stability for HEAs. (The symbols with
an empty center refer to bcc phases whereas symbols with fully filled center stand for fcc
phases. The intermediate symbols are representation of a mixed phase of bcc and fcc.)[13]
The Fig.2.12 gives examples of the relationship between VEC and phase stability for HEAs
which also provides evidence for the former explanations. Also, sole fcc phase can be found
at the boundary. (VEC = 8.0) Therefore, the phase boundaries can be clearly defined by VEC
value in spite of some exceptions [13].

14
The crystalline strucutures can be characterised by X-ray diffraction (XRD). The
characteristic peaks in XRD pattern indicates different phases in HEAs.
Fig.2.13. XRD patterns of the as-cast and heat-treated CoFeNi2V0.5Nb0.75 EHEAs.[14]
Figure 2.13 shows the XRD pattern of the eutectic high entropy alloy named
CoFeNi2V0.5Nb0.75. The curves refer to the as-cast and quenched EHEAs (Eutectic HEAs).
The Bragg peaks of the bulk and quenched samples can be indexed to be fcc-structured solid
solution phase and also Fe2Nb-type Laves phase. [14]
The content of some specific elements influences the crystalline structures of HEAs. For
instance, the content of aluminium is a dominant role in controlling the structures of
AlxCoCrFeMo0.5Ni.

15
Fig.2.14. Hardness and total crack length of AlxCoCrFeMo0.5Ni alloys as a function
of Al content. [15]
When the atomic content value of aluminium is lower than 0.75, the phases are tend to be fcc
phases and σ phases. As the atomic content value lies between 0.75 and 1.75, it is more easier
to get bcc1 phases and σ phases. The σ phase disappears when the value is higher than 1.75.
The bcc2 phases replaces σ phases to be the new composition.
Normally, the cooling rate may have an effect on the final crystalline structures of alloys.
The higher cooling rate leads to smaller grain size and simple structures. [16]
2.3.2 Microstructure of HEAs
The microstructure of HEAs can be analysed with scanning electron microscopy (SEM).
With SEM images, the microstructures of HEAs surface and elemental distribution and be
examined.
Normally, the surface of HEA contains dendritic (DR) and interdendritic (ID) regions.
Precipitates with plate shapes or spherical shapes and nanostructured phases are often found
in DR regions. Also, in casted HEAs, elements like copper and aluminum are tend to
segregate in ID regions.
Fig.2.16. Microstructures of CoCrFeMnNbNi HEA surface which consists dendritic and
interdendritic regions. [17]
Figure 2.16 shows an SEM image of the microstructures of CoCrFeMnNbNi HEA. A
lamellar colony formed by dendritic and interdendritic regions can be seen in the image. The
dendritic regions show bright in BSI contrast whilst interdendritic regions behave dark as the

16
arrows signed. The reason for this condition is that DR and ID regions contains different
distribution of metallic elements. For DR region, it contains lighter elements like Nb. By
contrast, heavier elements like Fe, Cr are distributed in ID regions which results in a dark
contrast. [17]
The microstructures of HEAs can be affected by manufacturing condition. Figure 2.17 gives
an example of the microstructures of Al0.5CrFeNiCo0.3C0.2 HEA powders milled by
mechanical alloying with different durations. The initial granular size is smaller than 40 μm
according to Fig. 2.17 (a). After 15 h milling, smaller particles form by crushing down the
agglomerations. The average particle size reaches at around 10 μm when milling materials
for 27 h, then cold weld again the particles after 38 h milling. The crystalline size is reduced
while alloying is carried out during this period. Fig. 2.17 (f) shows the final powder after 4 h
wet milling in an alcohol milling media. The particle size I much smaller than previous one.
The crystalline structures are refined during mechanical alloying.
Fig.2.17. Microstructures of Al0.5CrFeNiCo0.3C0.2 HEA powders milled in different time. (a)
0 h, (b) 6 h, (c) 15 h, (d) 27 h, (e) 38 h, (f) 38 h with 4 h wet milled. [18]

17
Fig.2.18. Microstructures of as-casted CoCrFeNiTi0.5 HEA and annealed for 6 h at
different temperatures: (a) as-cast, (b) 600 oC, (c) 700 oC, (d) 800 oC. [19]
Figure 2.18 exhibits the microstructures of as-casted CoCrFeNiTi0.5 HEA with different
annealing temperatures. Fig 2.18 (a) shows the surface microstructures of as-cast HEA. In
BSI contrast, a large area with bright contrast which is corresponding to dendritic regions
can be seen. The arm spacing of dendrite is around 80-150 μm. By contrast, the dark region
reffers to interdendritic region which just occupy small amount of areas in the initial stage. After
annealing in 600 oC and 700 oC, the significant changes can be observed in images as the ID
regions expands whilst the DR region shrinks. The changes are attributes to the released
distorted energy and uniformly diffusion form DR region to ID region. Solid solution phases
are replaced by intermetallic phases after annealing. [19]

18
Fig.2.19. Microstructures of AlxCrFeNiTi0.25 HEAs. (a) Al0, (b) Al0.25, (c) Al0.5, (d)
Al0.75. [20]
The content of aluminum also affect the final microstructures of HEAs. Like typical cast
HEAs, DR and IR regions can be found in AlxCrFeNiTi0.25 alloy system. As the content of
aluminum raised, more dendrites are formed as a result. Aluminum and nickel mainly
segregated into dendritic regions while iron and chromium are uniformly distributed in
interdendrite regions. The equilibrium phases are dependent on aluminum content which
induce the growth of dendrites. [20]
2.4 Mechanical properties of HEAs
HEAs have high hardness, remarkable wear and corrosion resistance both at room and
elevated temperatures. Also, HEAs show high compressive strength and tensile properties.
Several parameters influence the mechanical properties of HEAs. For different HEAs with
dissimilar structures, the strength properties are not the same. As for fcc-structured HEAs,
the strength is relatively low but plasticity is high. On the other side, bcc-strucured HEAs
behave higher strength properties but lower plasticity when compared to the former one. It
can be concluded that the crystalline structure of HEAs affects the strength properties. [21]
Not only the intrinsic structure but also the heat treatment method plays a vital role in altering
mechanical properties of HEAs. It has been studied that the annealing proceesing influence
the hardness of as-cast AlCrFeNiMo0.2 HEAs. [21]
Fig.2.20. Vickers hardness of as-annealed and as-cast HEAs. [21]
The curve in Fig.2.20 shows the hardness value after annealing the HEAs at the temperature
form 550 oC to 1050 oC. (AT1 refers to 550 oC and AT2 refers to 650 oC)The inhomogeneous
structure induces a slight decrease of hardness at 650 oC (AT2) . Normally, the hardness
19
increase gradually from AT2 to AT5(950 oC). This is because the transfomation from bcc
phase to σ phase. The σ phase is an intermetallic compound (Fe-Cr-Ni compound) consists
of 30 wt.% Cr~50 wt.% Cr which behaves hard and brittle. The σ phase shows a tetragonal
structure and the precipitaion temperature is between 600 oC and 950 oC which hcan be used
to explain the increasing tendency of hardness during this temperature range. The hardness
decreases dramatically after reaching the peak at around 950 oC (AT5) which can be
explained as the disppearance of the σ phase.
Another dominant parameter for cotrolling the strength properties of HEAs is the temperature.
At room temperature, the strength is mainly influenced by the crystal structure of HEAs.
FCC-structured HEAs have a lower yield strength than that of BCC-structured HEAs. Also,
the relationship between cooling rates and strength properties of HEAs has been studied
which reported that the final products have a more uniform microstructure and a high
ductility after cooling at high rates. Moreover, the different compositions of alloys lead to
different mechanical properties.
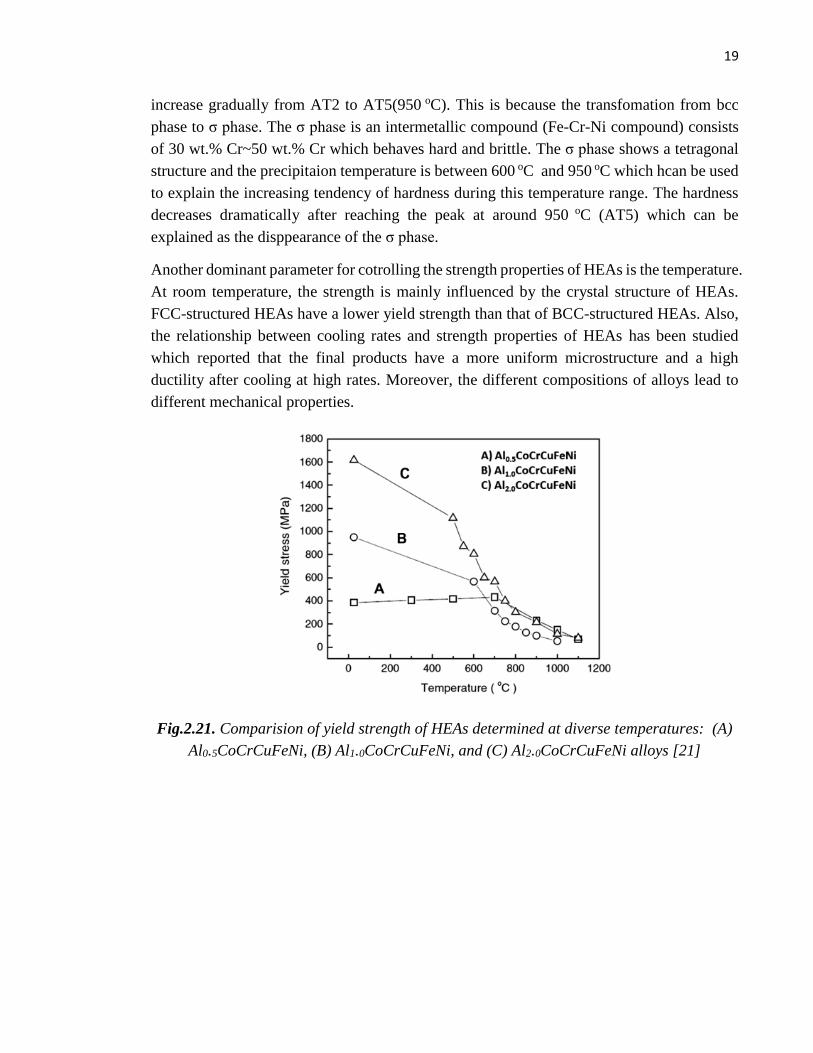
Fig.2.21. Comparision of yield strength of HEAs determined at diverse temperatures: (A)
Al0.5CoCrCuFeNi, (B) Al1.0CoCrCuFeNi, and (C) Al2.0CoCrCuFeNi alloys [21]
20
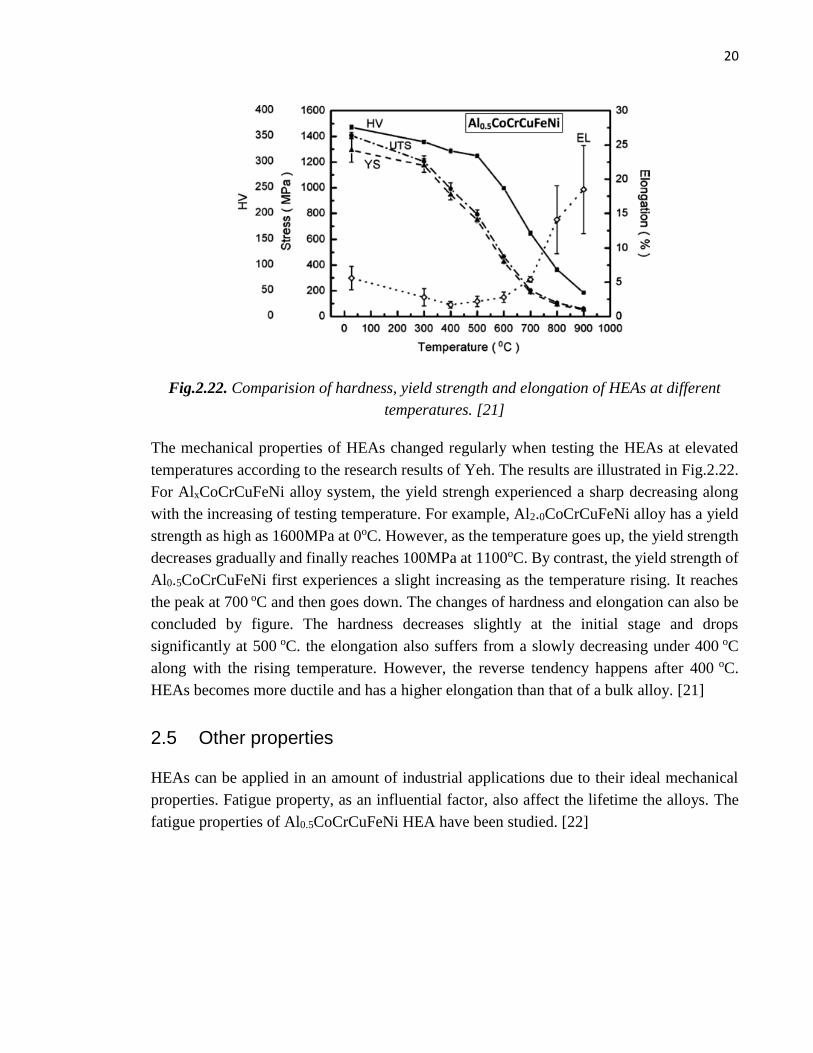
Fig.2.22. Comparision of hardness, yield strength and elongation of HEAs at different
temperatures. [21]
The mechanical properties of HEAs changed regularly when testing the HEAs at elevated
temperatures according to the research results of Yeh. The results are illustrated in Fig.2.22.
For AlxCoCrCuFeNi alloy system, the yield strengh experienced a sharp decreasing along
with the increasing of testing temperature. For example, Al2.0CoCrCuFeNi alloy has a yield
strength as high as 1600MPa at 0oC. However, as the temperature goes up, the yield strength
decreases gradually and finally reaches 100MPa at 1100oC. By contrast, the yield strength of
Al0.5CoCrCuFeNi first experiences a slight increasing as the temperature rising. It reaches
the peak at 700 oC and then goes down. The changes of hardness and elongation can also be
concluded by figure. The hardness decreases slightly at the initial stage and drops
significantly at 500 oC. the elongation also suffers from a slowly decreasing under 400 oC
along with the rising temperature. However, the reverse tendency happens after 400 oC.
HEAs becomes more ductile and has a higher elongation than that of a bulk alloy. [21]
2.5 Other properties
HEAs can be applied in an amount of industrial applications due to their ideal mechanical
properties. Fatigue property, as an influential factor, also affect the lifetime the alloys. The
fatigue properties of Al0.5CoCrCuFeNi HEA have been studied. [22]

21
Fig.2.23. S-N curves of Al0.5CoCrCuFeNi HEA and other metallic materials. [22]
In Fig.2.23, the relationship between faliure cycles and stress range / fatigue ratio of HEAs
and other conventional alloys is revealed. In certain cycle before failure, HEAs endure more
tensile stress before failure and also have higher fatigue ratio than that of bulk metallic glasses
and widely-used steels. The good performance of HEAs can be attributed to their high tensile
strength and simple microstructures. The defects can hardly be observed in the internal
structures in HEAs as a result of its high mixing entropy. In summary, HEAs can endure
more stress and have excellent fatigue resistance when compared to conventional alloys. This
provides a chance for HEAs to be applied in aerospace applications due to its longer lifetime
and resistance to fatigue.
Wear resistance is a significant parameter in tribological properties of HEAs especially in
the conditions where HEAs come into contact with other rough-surface materials. The
improved wear resistance has been found in Co1.5CrFeNi1.5Ti and Al0.2Co1.5CrFeNi1.5Ti
HEAs. Also, the wear resistance can be enhanced by formation of a smooth wear surface and
debris of high hardness. The adhesion wear properties of AlxCoCrCuFeNi HEAs have been
studied. The worn surface is smooth and lay out more fine debris when the content of
aluminum is high, which improves the wear resistance as a result. The high hardness of the
HEA surface helps to resist the plastic deformation and also contributes to the formation of
oxide film. Moreover, the wear behavior of the refractory Mo20Ta20W20Nb20V20 HEA has

22
been studied by sliding the alumina and steel balls on Inconel 718 and Mo20Ta20W20Nb20V20
surface respectively. The figure 2.25 shows the results. [23]
Fig.2.25. Comparison of the volume loss as a function of the sliding distance and the wear
rates for Mo20Ta20W20Nb20V20 and Inconel 718. [23]
Mo20Ta20W20Nb20V20 have been reported to have better wear resistance than that of Inconel
718 both with an alumina ball and a steel ball. The volume loss of Mo20Ta20W20Nb20V20 is
lower than 20% after a long sliding distance (1000m). Thus, it can be concluded that HEAs
have better wear resistance than that of some conventional alloys.
Due to high number of alloying elements exist, it is hard to define the melting temperature
from literatures. Hence, thermal analysis are carried out to define the melting temperature
and thermal expansion coefficient of HEAs. With defined melting temperature, it is easier to
select heat treatment methods for HEAs which help to refine the structures and alter the
mechanical properties . Usually, the melting temperature of HEAs can be determined by DSC
or DTA.
DSC, differential scanning calorimetry, is a widely used method to figure out the
thermodynamic properties of materials. DSC can be applied in organic and inorganic samples.
In this method, two items named sample and reference are positioned in the same condition
as the temperature rising up throughout the procedure. In order to get the reliable results, the
reference should equip with a well-defined heat capacity in the scanned temperature range
while the temperature of sample holder response linearly to the heating time.
Normally, there are two main types of DSC: Power compensated DSC which has the constant
power supply and Heatflux DSC which has the constant heat flux. The results of DSC can be
plotted in a DSC curve which reveals the relationship between heat flux and temperature.
With DSC curve, the parameters such as glass transition temperature of polymers, melting
23
temperature can be obtained. For HEAs, the melting temperature can be determined by the
endothermic peaks of cooling curve and heating curve. Also, the exothermic peak indicated
the solidification of HEAs during the temperature changes. With DSC, the melting
temperature and solidification temperature of different phases can be obtained. In this case,
DSC can be a sufficient method to limit a temperature range for heat treatments. [24]
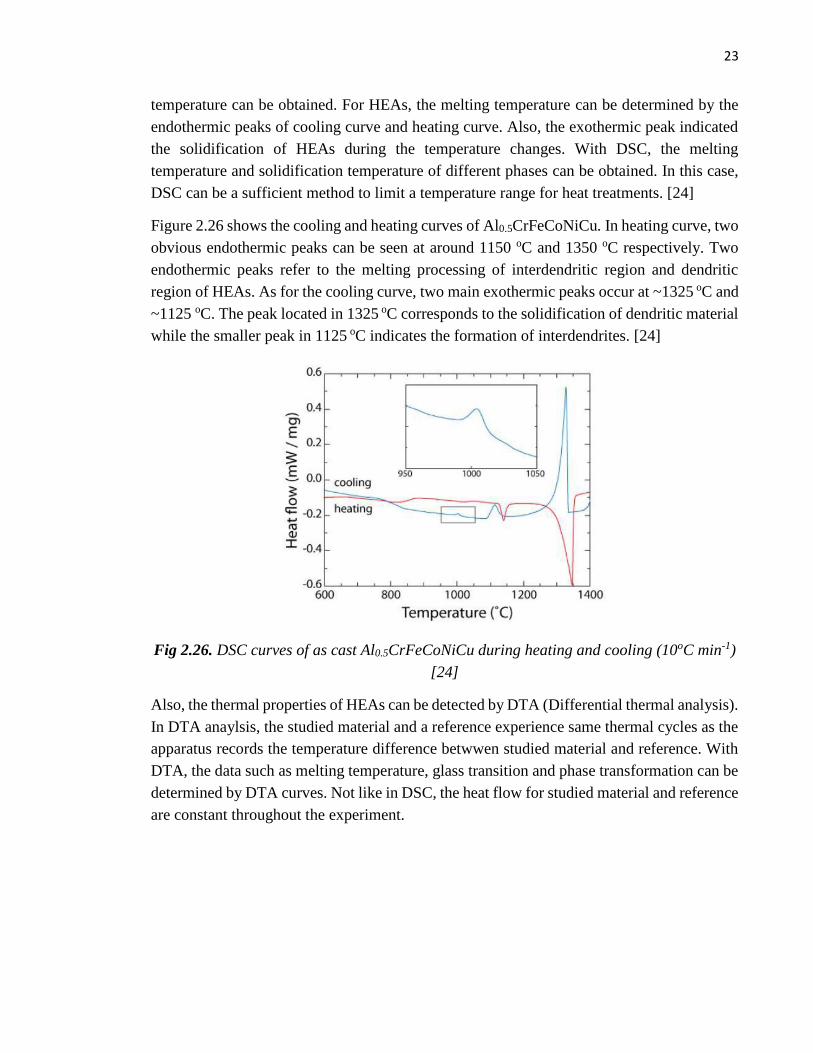
Figure 2.26 shows the cooling and heating curves of Al0.5CrFeCoNiCu. In heating curve, two
obvious endothermic peaks can be seen at around 1150 oC and 1350 oC respectively. Two
endothermic peaks refer to the melting processing of interdendritic region and dendritic
region of HEAs. As for the cooling curve, two main exothermic peaks occur at ~1325 oC and
~1125 oC. The peak located in 1325 oC corresponds to the solidification of dendritic material
while the smaller peak in 1125 oC indicates the formation of interdendrites. [24]
Fig 2.26. DSC curves of as cast Al0.5CrFeCoNiCu during heating and cooling (10oC min-1)
[24]
Also, the thermal properties of HEAs can be detected by DTA (Differential thermal analysis).
In DTA anaylsis, the studied material and a reference experience same thermal cycles as the
apparatus records the temperature difference betwwen studied material and reference. With
DTA, the data such as melting temperature, glass transition and phase transformation can be
determined by DTA curves. Not like in DSC, the heat flow for studied material and reference
are constant throughout the experiment.
24
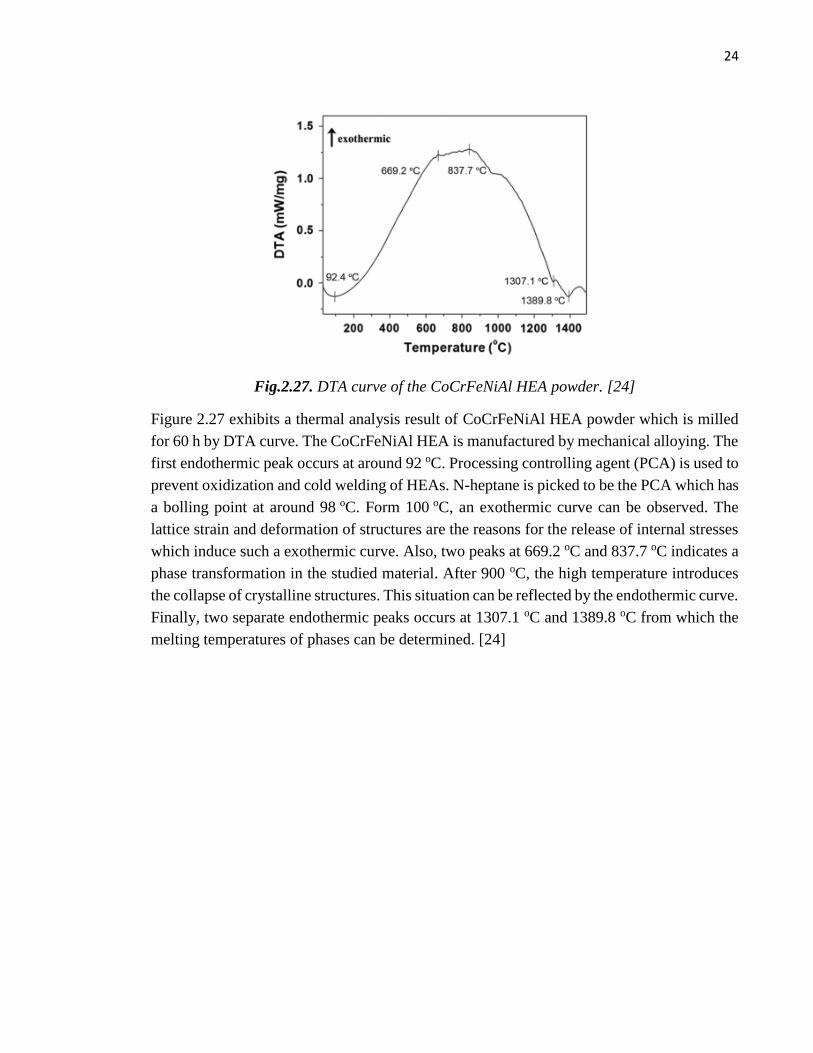
Fig.2.27. DTA curve of the CoCrFeNiAl HEA powder. [24]
Figure 2.27 exhibits a thermal analysis result of CoCrFeNiAl HEA powder which is milled
for 60 h by DTA curve. The CoCrFeNiAl HEA is manufactured by mechanical alloying. The
first endothermic peak occurs at around 92 oC. Processing controlling agent (PCA) is used to
prevent oxidization and cold welding of HEAs. N-heptane is picked to be the PCA which has
a bolling point at around 98 oC. Form 100 oC, an exothermic curve can be observed. The
lattice strain and deformation of structures are the reasons for the release of internal stresses
which induce such a exothermic curve. Also, two peaks at 669.2 oC and 837.7 oC indicates a
phase transformation in the studied material. After 900 oC, the high temperature introduces
the collapse of crystalline structures. This situation can be reflected by the endothermic curve.
Finally, two separate endothermic peaks occurs at 1307.1 oC and 1389.8 oC from which the
melting temperatures of phases can be determined. [24]

25
2.6 Applications of HEAs
HEAs can be applied in a large amount of applications due to their remarkable properties.
Some conventional alloys are replaced by HEAs in many areas in recent years. Although
several issues also need to be studied, such as how to reduce the comsumption by
manufacturing the HEAs, HEAs can be utilized in the following promising fields:
(1) HEAs can be applied as wear-resistance coatings since their wear resistance and
fatigue ratio are higher than those of conventional metallic materials. Such wear-
resistance coatings can be utilized on the surface of bearings and jet engine to prevent
possible fatigue cracking and abrasive wear during their usages. [25]
(2) HEAs can be utilized as structural materials as they exhibit excellent mechanical
properties, like high hardness, high yield strength and high tensile strength. Ideal
mechanical properties bring HEAs to certain industrial areas where the requirements
of such properties are critical. Nickel alloys and conventional steels can be replaced
by HEAs in modern factories and job locations. [25]
(3) In marine engineering, HEAs also play a vital role in resistance to corrosion due to
its high corrosion resistance. For example, Cu0.5NiAlCoCrFeSi HEA has higher
corrosion resistance than that of 304-stainless steel. Tempering processing can
improve the corrosion resistance of HEAs.
(4) Ca20Mg20Zn20Sr20Yb20 has been studied as the biodegradable high entropy alloys.
After the implantaion, Ca20Mg20Zn20Sr20Yb20 can promote the formation of new
bone and will not degrade in a certain duration. In this way, high entropy alloy can
be used in biomedical area.
(5) With the concept of high entropy, the fission process of neclear reactors can be
simulated. As the nuclear reaction happens, the types of elements increases. Also the
potential in resisting irradiation and corrosion makes HEAs the valuable materials in
nuclear industries. HEAs can be designed as the protection shell of nuclear
equipments. [25]
(6) HEAs can be used as refractory skeleton of buildings due to their high impact
resistance and thermostability.
(7) HEAs can be applied in high frequency transformer, coreplane and soft magnetic
films.
(8) HEAs provide high wear resistance for a turbine blade. [25]

26
3 EXPERIMENTS METHODS
In this work, different HEAs were studied to fing out whether the casting methods and
manufacturing paramters effect the final microstructures and mechanical properties of HEAs.
This project is accomplished by comparing the structures and properties of different high
entropy alloys which melted and manufactured in different methods and atomosphere. The
reference Al0.5CrFeCoNiCu HEAs were casted after arc-melting for several times. It was
provided by Assistant Professor Sheng Guo from Chalmers University of Technology.
Meanwhile, the Al0.5CrFeCoNiCuMo0.25 and Al0.5CrFeCoNiCu HEAs were casted by
induction-melting. After the manufacturing, the samples were cut into small pieces for the
follow-on experiments. The microstructures of HEAs were observed by SEM after polishing
the samples which fixed in exopy resins. After that, the crystalline structures were
characteristized by X-ray diffraction. Finally, the hardness test and compression test were
done to evaluate the mechanical properties of HEAs.
3.1 HEA Samples
The arc-melted Al0.5CrFeCoNiCu HEA is chosen as the reference. Also, induction-melted
Al0.5CrFeCoNiCuMo0.25 and Al0.5CrFeCoNiCu HEAs are casted both in vacuum and air
condition. In melting and casting processing of Al0.5CrFeCoNiCuMo0.25, molybdenum are
added since the molybdenum provides high wear resistance. The final mechanical properties
and microstructures are interested since whether the addition of molybdenum will alter the
relative properties is under estimated. With the reference sample arc-melted
Al0.5CrFeCoNiCu HEA and induction melted Al0.5CrFeCoNiCu HEA, comparison between
their final properties will also provides some ideas about how to choose a proper melting
methods when facing specific issue. For reference material and induction-melted
Al0.5CrFeCoNiCu, the composition is same which can be seen in Table.3.1.1. Meanwhile,
7.3 wt.% molybdenum is added in melting processing before the casting of
Al0.5CrFeCoNiCuMo0.25.
Table 3.1.1. Composition of HEA samples during casting.
Compositions Al (wt.%)
Co (wt.%)
Cr (wt.%)
Cu (wt.%)
Fe (wt.%)
Ni (wt.%)
Mo (wt.%)
Ref. Al0.5CrFeCoNiCu 4.5 19.5 17.2 21.0 18.5 19.4 0.0
Al0.5CrFeCoNiCu 4.5 19.5 17.2 21.0 18.5 19.4 0.0
Al0.5CrFeCoNiCuMo0.25 4.1 18.1 15.9 19.5 17.1 18.0 7.3
27
3.2 Testing methods
To evaluate the structures and mechanical properties of HEAs, the following experiments
were carried out. The microstructures of HEAs could be observed firstly by optical
microscope and then spotted in details by SEM. Also, with SEM and EDS, the composition
distribution could be estimated. In order to verify the crystalline structures, X-ray diffraction
was applied. As for the mechanical properties, the hardness test helped to point out the
Vickers hardness value while the compression test contributed to the calculation of yield
strength of HEAs.
3.2.1 Optical microscopy and scanning electron microscopy
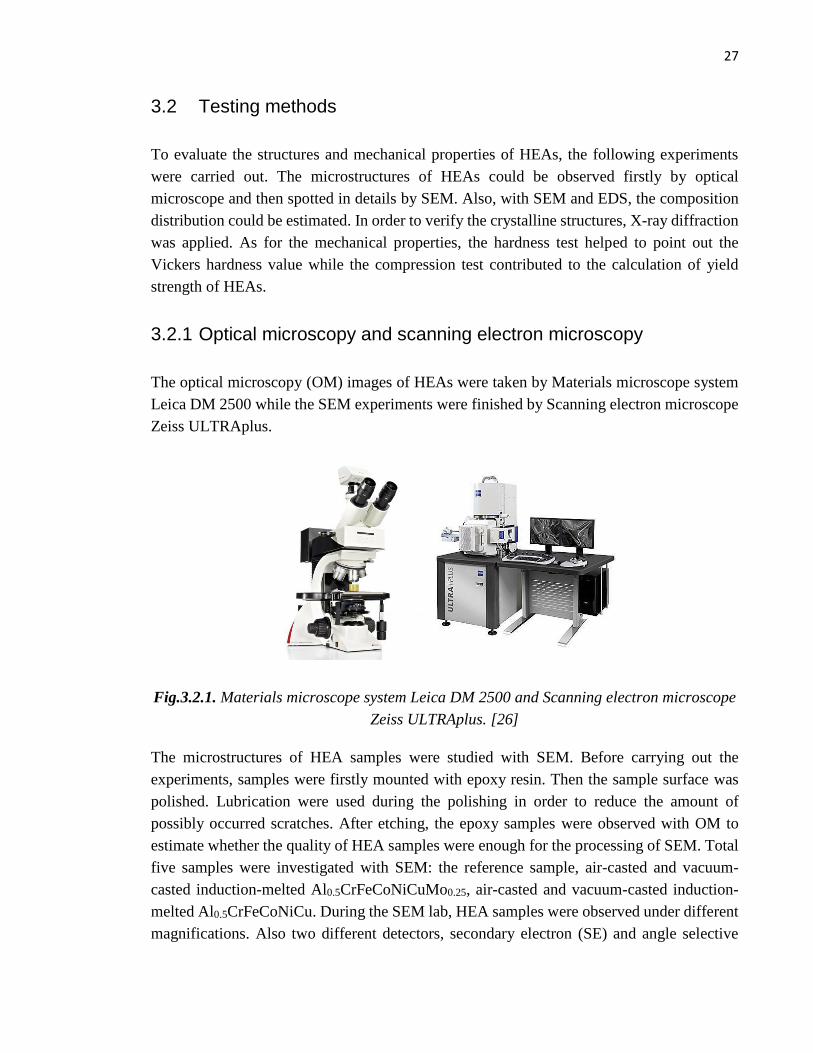
The optical microscopy (OM) images of HEAs were taken by Materials microscope system
Leica DM 2500 while the SEM experiments were finished by Scanning electron microscope
Zeiss ULTRAplus.
Fig.3.2.1. Materials microscope system Leica DM 2500 and Scanning electron microscope
Zeiss ULTRAplus. [26]
The microstructures of HEA samples were studied with SEM. Before carrying out the
experiments, samples were firstly mounted with epoxy resin. Then the sample surface was
polished. Lubrication were used during the polishing in order to reduce the amount of
possibly occurred scratches. After etching, the epoxy samples were observed with OM to
estimate whether the quality of HEA samples were enough for the processing of SEM. Total
five samples were investigated with SEM: the reference sample, air-casted and vacuum-
casted induction-melted Al0.5CrFeCoNiCuMo0.25, air-casted and vacuum-casted induction-
melted Al0.5CrFeCoNiCu. During the SEM lab, HEA samples were observed under different
magnifications. Also two different detectors, secondary electron (SE) and angle selective

28
backscatter (AsB) were utilized to show different contrast. The accelerating voltage was 20
kV (As the figure shows EHT = 20 kV, where EHT refers to electron high tension).
Meanwhile the working distance was at arount 8.5 mm.
During the SEM processing, magnification, brightness and contrast need to be adjusted to
obtain high contrast images. After imaging the HEA samples, EDS-mapping (Energy-
dispersive X-ray spectroscopy mapping) can be obtained using INCA program. EDS
(Energy-dispersive X-ray spectroscopy) elemental mapping is a useful tool for determining
the elemental distribution in the microstructures of HEAs. The interation between X-ray and
sample contributes to the EDS analysis. The electrons of inner shell of sample can be excited
by incident beam and the ejected. The outer electons fill in the elctron hell created by the
ejection of inner electrons. Thus an X-ray released due to the energy difference between inner
shell and outer shell. With energy-dispersive spectrometer, the emitted X-rays can be
collected and measured. Since the energies of X-rays are characteristic, different elements
can be determined by observing and indexing the positions of peaks from EDS spectrum.
Also, an EDS mapping contains different elements can be obtained during this procedure.
The obtained 2D picture shows the spatial distribution of each elements in a sample. Different
colors refers to different elements in the same focused area which help to distinguish diverse
elements.
3.2.2 X-ray diffraction
The X-ray diffraction patterns of each sample was determined by PANalytical Empyrean
Multipurpose Diffractometer (PANalytical X-ray diffractometers). It could be applied in
qualitative and quantitative phase analysis of HEAs. Before the XRD experiment, the
samples were polished and etched to expose smooth flats.
Fig.3.2.2. PANalytical Empyrean Multipurpose Diffractometer [27]
29
In XRD processing, the sample was positioned in a sample holder while the detector moved
in a circle around the sample. The sample holder was Chi-Phiz stage.The angle 2theta refered
to the positions of detector. As to obtain the accurate results, the samples were positioned in
a specific height which could be alterd by holder leg with different length. The positions of
peaks were measured between 20 to 120 (°2θ). During the processing, the X-rays reached to
the sample surface and the diffracted beams were collected by detector. The diffraction
fullfills the Bragg’s law. Since each diffracted beam is characteristic, distinct phases and
crystalline structures could be determined by X-ray diffraction.
3.2.3 Hardness testing
Mechanical properties of HEAs were also interested since these parameters help to evaluate
whether a specific type of HEA could be applied in industrial areas or not.
For hardness test of HEAs, the widely used method is Vickers hardness test. In this work,
Vickers hardness ISP 6507 standard was used. A pyramidal diamond indentor was used as
well. This method had a reliable result for very hard materials as the diamond indentor would
not deform even at a high loads exerted by a simple weighted lever. After the indenter
penatrated into the surface of the sample, an impression square formed. By measuring the
length of impression diagonals, the hardness value could be obtained by convertion and
calculation. Since the machine automatically deal with these values, a final hardness report
could be printed easily. However, some errors induced by surface finish and flatness may
happen during the hardness tests. Also, the thickness of sample should be considered since
the specimen table may influence the final result when the sample is too thin. [28] In this
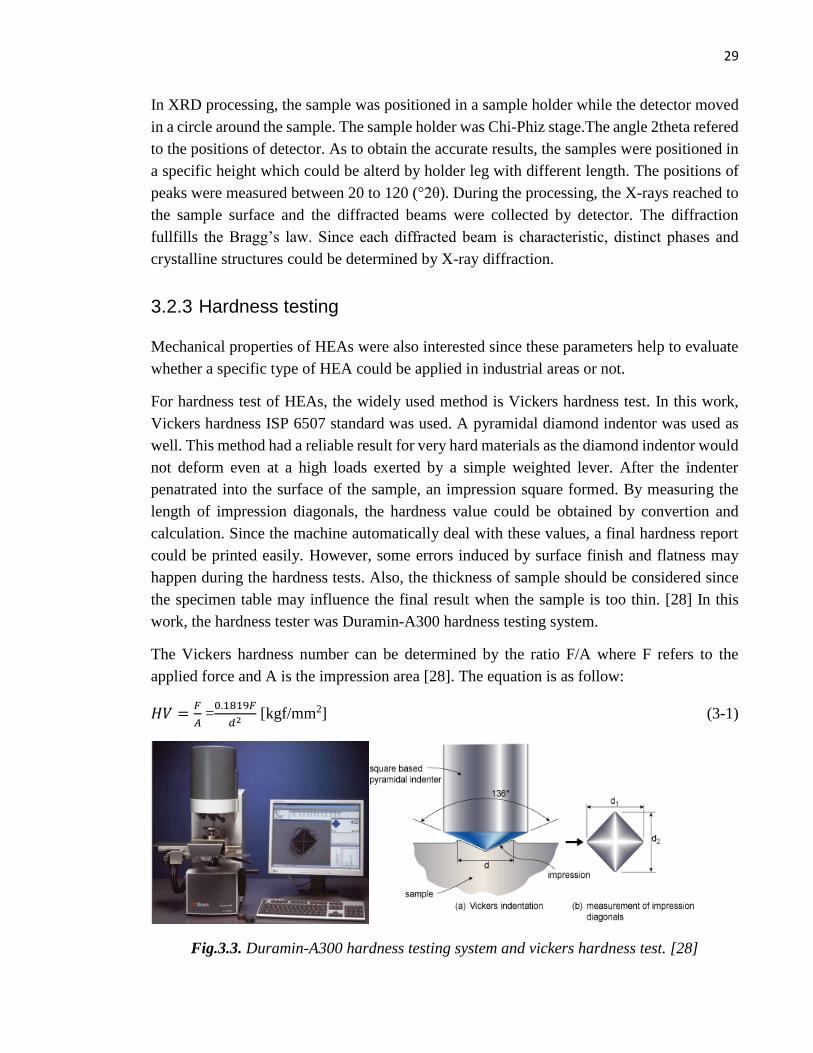
work, the hardness tester was Duramin-A300 hardness testing system.
The Vickers hardness number can be determined by the ratio F/A where F refers to the
applied force and A is the impression area [28]. The equation is as follow:
𝐻𝑉 =𝐹
𝐴 =0.1819𝐹
𝑑2 [kgf/mm2] (3-1)
Fig.3.3. Duramin-A300 hardness testing system and vickers hardness test. [28]

30
3.2.4 Compression testing
Compression testing was applied to evaluate the mechanical properties of HEAs and to
determine whether the mechanical properties. Both yield strength of ductile material and
ultimate strength of brittle material could be determined by this method.
The compression testing was accomplished by Servohydraulic materials testing machine
Instron 8800. First of all, the dimension and diameters of samples should be recorded as the
length change and area needed to be taken into account when calculating the mechanical
properties. After that, the samples were positioned carefully between two sensors to ensure
concetric loading. During the experiment, both positions of upper sensor and applied force
were recorded. With the obtained data, mechanical parameters could be calculated by the
following equations.
Engineering strain: 𝑒 =∆𝐿
𝐿 =
𝑙−𝐿
𝐿 (3-2)
True strain: ε = ln (1 + e) (3-3)
Engineering stress: σe =𝑃
𝐴 (3-4)
True stress: σtrue = (1 + ε) (σe) (3-5)
Where L is the length of the cylinder specimen, A refers to the cross-section area of specimen.
[29]
Fig.3.4. Instron 8800. [29]
The limit of Instron 8800 was 200 kN. For ductile materials, yield points or yield strength
could be determined. The yield strength is determined by 0.2% offset point in some cases.
But in this experiment, the sensor were not so accurate since the diameters of specimen were

31
relatively small. As to get the accurate results, the yield strength was determined by 5% offset
points. Before yield points, the materials deformed elastically and had the ability to go back
to their original shapes after removing the applied force. By contrast, as the compression
continued after yield points, the materials deformed plastically and endured irreversible
deformation. For brittle materials, an uniaxial compression strength could be evaluated.
Some brittle materials broke sharply with few deformation or even no deformation. [29]
32
4 RESULTS AND DISCUSSION
With optical microscope and scanning electron microscope, microstructures of HEAs could
be observed. Both dendrite and interdendrite regions could be seen with different
magnifications. Also EDS maps were used to evaluate the composition distribution of HEAs.
After that, X-ray diffraction was applied to characterize the crystalline structures of HEAs.
With that, it could be defined that whether the HEA was in bcc or fcc structure. Finally,
hardness test and compression test were carried out to test the mechanical properties of HEAs.
4.1 Optical microscopy images
Optical micrographs could be used to observe microstructure of HEAs. With different
magnifications, both overview and details of microstructures could be observed by optical
microscope.
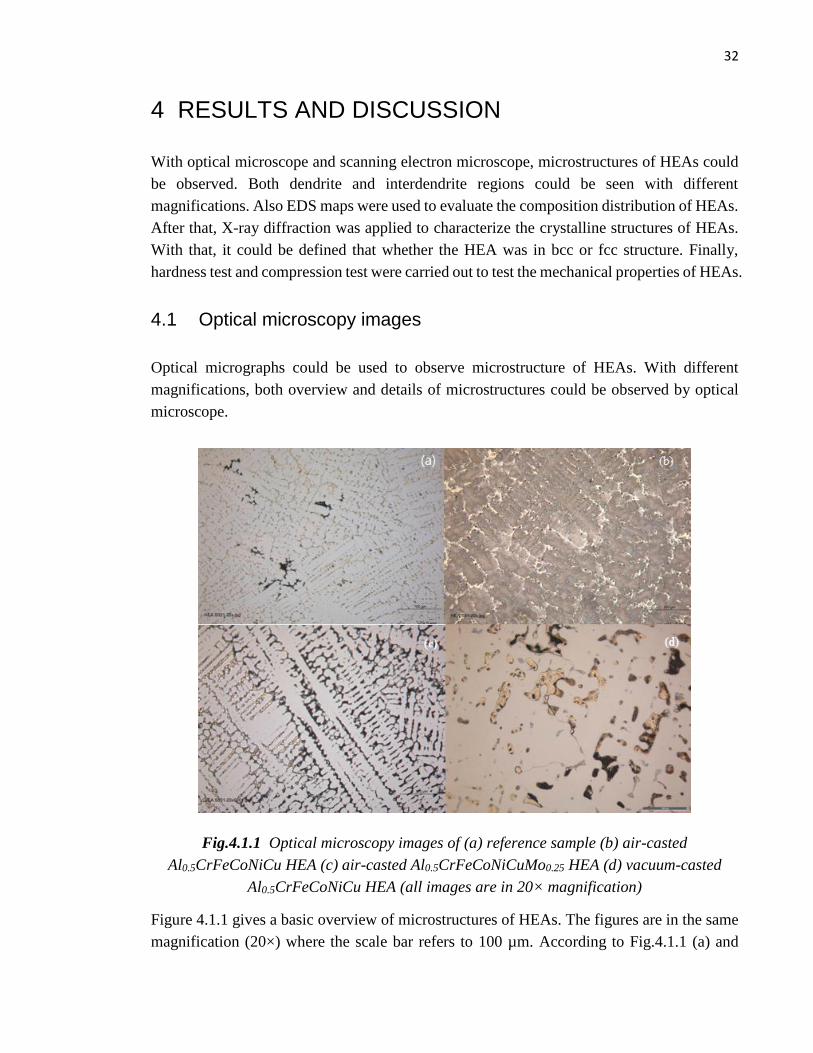
Fig.4.1.1 Optical microscopy images of (a) reference sample (b) air-casted
Al0.5CrFeCoNiCu HEA (c) air-casted Al0.5CrFeCoNiCuMo0.25 HEA (d) vacuum-casted
Al0.5CrFeCoNiCu HEA (all images are in 20× magnification)
Figure 4.1.1 gives a basic overview of microstructures of HEAs. The figures are in the same
magnification (20×) where the scale bar refers to 100 µm. According to Fig.4.1.1 (a) and

33
Fig.4.1.1 (a), reference samples and air-casted Al0.5CrFeCoNiCuMo0.25 have similar
microstructures. The grains are dendrite-like and oriented in all directions. Whitin these two
images, bright area represents the dendrite regions while the dark area refers to interdendrite
regions. Fig.4.1.1 (b) and Fig.4.1.1 (d) shows the microstructures of Al0.5CrFeCoNiCu which
are different from previous described one. The grains are dendrite-like and have larger grain
size compared to the size of air-casted Al0.5CrFeCoNiCuMo0.25. Also the interdendrite regions
are not so uniform. Futher discussion about microstructures will given by the following SEM
images.
4.2 SEM images
During the SEM lab, HEA samples are observed under different magnifications, the scale bar
are indicated in the following SEM images. The SEM images of reference material are shown
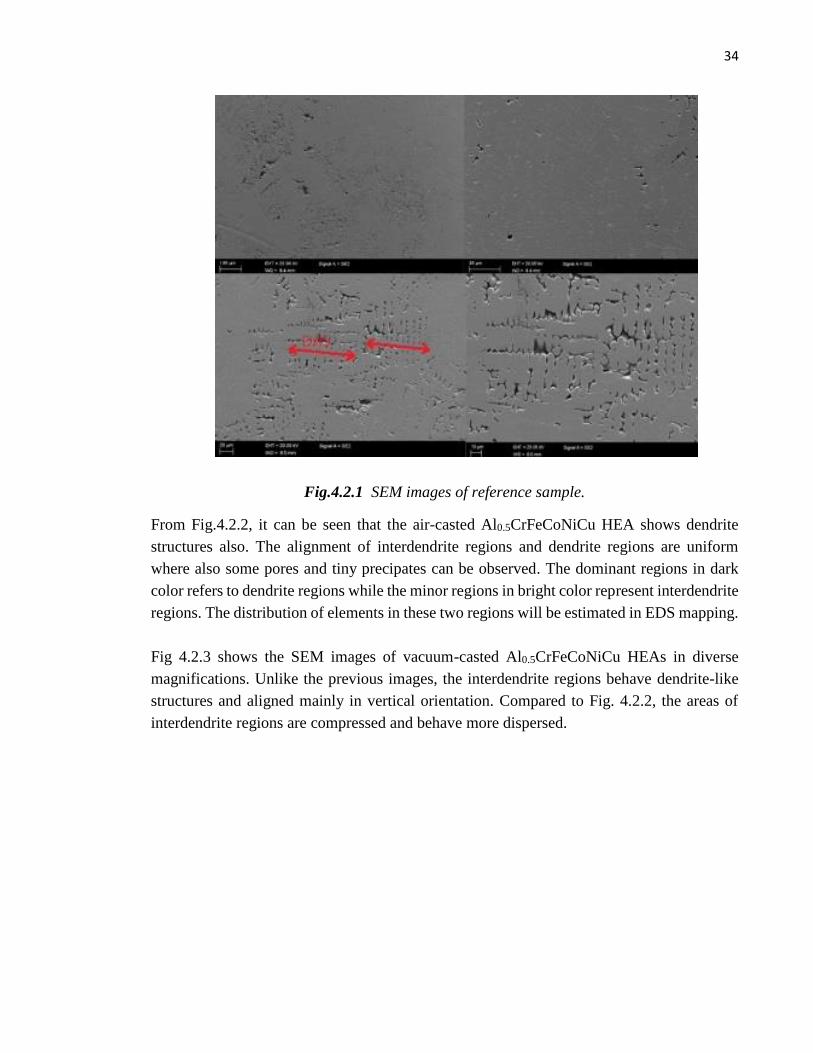
in Fig.4.2.1 with different magnification. The uniform dendrite structures can be observed
on the surface while the grains are aligned in different orientation. In Fig.4.2.1, significant
contrast of different areas refers to different regions. The pale grey areas refers to dendritic
regions. By contrast, the deep color areas represent the interdentritic regions. The dendrite
arm sapcing is at around 100 µm. Dendrite arm spacing is the distance between dendrites
secondary arms which is also called DAS. Measuring the DAS within SEM images help to
explain the mechanical properties of HEAs. Basically, the higher DAS leads to lower yield
strength and ultimate tensile strength but has little influence on elongation and hardness of
HEAs.
34
Fig.4.2.1 SEM images of reference sample.
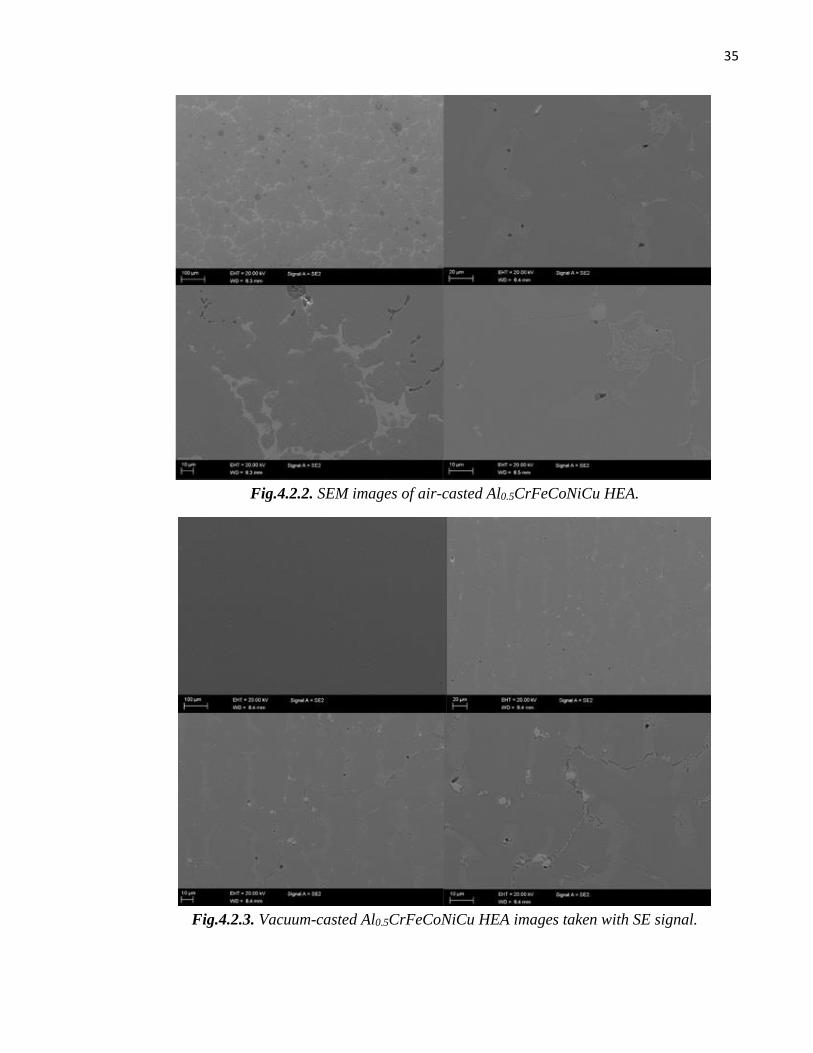
From Fig.4.2.2, it can be seen that the air-casted Al0.5CrFeCoNiCu HEA shows dendrite
structures also. The alignment of interdendrite regions and dendrite regions are uniform
where also some pores and tiny precipates can be observed. The dominant regions in dark
color refers to dendrite regions while the minor regions in bright color represent interdendrite
regions. The distribution of elements in these two regions will be estimated in EDS mapping.
Fig 4.2.3 shows the SEM images of vacuum-casted Al0.5CrFeCoNiCu HEAs in diverse
magnifications. Unlike the previous images, the interdendrite regions behave dendrite-like
structures and aligned mainly in vertical orientation. Compared to Fig. 4.2.2, the areas of
interdendrite regions are compressed and behave more dispersed.
35
Fig.4.2.2. SEM images of air-casted Al0.5CrFeCoNiCu HEA.
Fig.4.2.3. Vacuum-casted Al0.5CrFeCoNiCu HEA images taken with SE signal.
36
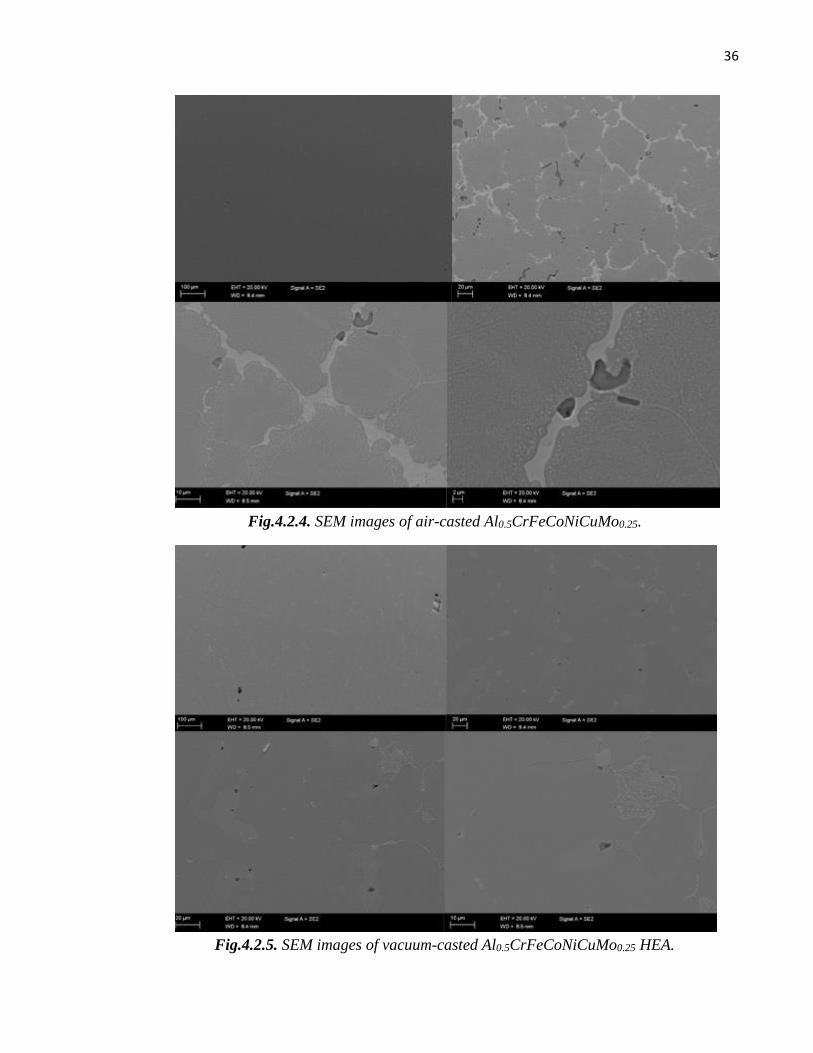
Fig.4.2.4. SEM images of air-casted Al0.5CrFeCoNiCuMo0.25.
Fig.4.2.5. SEM images of vacuum-casted Al0.5CrFeCoNiCuMo0.25 HEA.

37
Fig.4.2.6. Comparison of air-casted (left image) and vacuum-casted (right image)
Al0.5CrFeCoNiCuMo0.25 HEA images taken with AsB signal.
The air-casted and the vacuum-casted Al0.5CrFeCoNiCuMo0.25 samples both show dendrite-
like structures. While the larger area of interdendrite regions are found in air-casted sample.
The high vacuum level helps to refine the structure and contributes to the formation of small
grain sizes. In both SEM images, dark spots are observed in dendrite regions and
interdendrite regions which refer to the molybdenum containing phases and sulfur impurities.
4.3 EDS mapping
EDS mapping gives information about the distribution of a alloy sample elements. Fig.4.3.1
presents the EDS map of reference sample. From the EDS map, the cobalt, chromium and
iron are mainly located in the dendrite regions. By contrast, copper mainly gathered in the
interdendrite regions. Meanwhile, alumnium and nickel have the uniform distribution among
these two regions. The data in Table.4.3.1 also gives the ideas that the interdendrite regions
mainly consists of copper containing substance (approximately 50 wt.% Cu) On the opposite
side, the dendrite regions contains a large amount of nickel, chromium, cobalt and iron
cotaining phases and a small amount of alumnium containing phase. As for the air-casted and
vacuum casted Al0.5CrFeCoNiCu samples, the distribution of each elements in different
regions is no significant diffenerce to that of reference one except for the size of dendrite
regions.

38
Fig.4.3.1. EDS mapping of reference sample.
Fig.4.3.2. EDS mapping of reference sample.

39
Table 4.3.1. Alloying element measured in Fig.4.3.2.
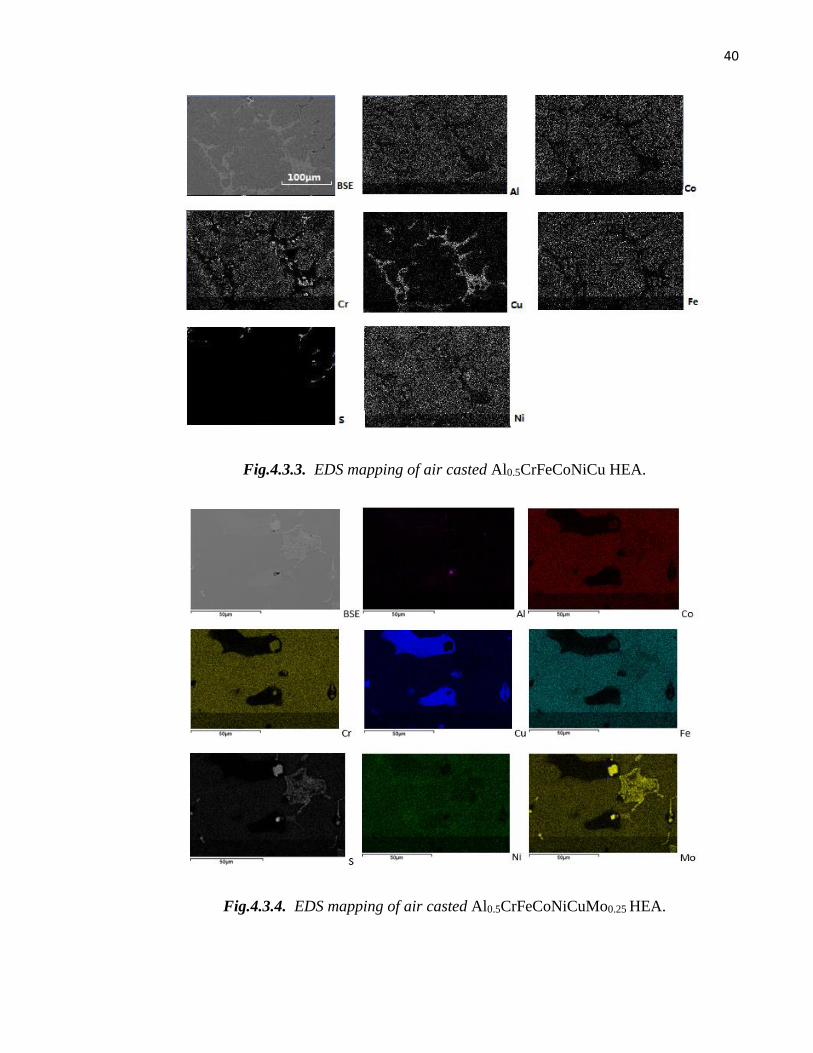
In the EDS mapping of Al0.5CrFeCoNiCu (Fig.4.3.3), the dendrite regions have larger area
compared to the reference sample. Meanwhile, apart form the basic metallic elements, a
contamination of sulfur is also found in EDS mapping which is mainly located in dendrite
region. In Fig.4.3.3, cobalt, iron and chromium phases gather in dendrite regions while
copper mainly locates in interdendrite regions. There is no significant difference of
composition distribution between induction-melted Al0.5CrFeCoNiCu and reference one
apart from the sulfur impurity.
Since the Al0.5CrFeCoNiCuMo0.25 sample contains molybdenum also, the EDS maps are also
plotted to observe the location of molybdenum phases by Fig.4.3.4. Similar to previous cases,
cobalt, iron and chromium mainly exist in dendrite regions while copper locates in
interdendrite regions. Besides, a new regions which is indicated in the right upper part of
Fig.4.3.4 occurs. The molybdenum containing phase and sulfur contamitation are obseserved
in this region. Besides, molybdenum can also be seen in the dendrite regions. However, the
aluminum only exists in a small spot in EDS mapping which may reflect the loss of aluminum
during the air-casting. The loss of aluminum is a consequence of oxidation reaction.
Spectrum Al (wt.%)
Cr (wt.%)
Fe (wt.%)
Co (wt.%)
Ni (wt.%)
Cu (wt.%)
Spectrum 1 6.4 8.7 9.3 14.4 17.6 43.6
Spectrum 1 6.5 7.9 6.9 6.8 13.9 58.0
Spectrum 1 4.9 17.8 17.6 26.7 19.2 13.8
Spectrum 1 3.0 19.8 20.5 31.1 16.1 9.4
Spectrum 1 2.9 20.1 21.0 31.4 15,7 9.0
40
Fig.4.3.3. EDS mapping of air casted Al0.5CrFeCoNiCu HEA.
Fig.4.3.4. EDS mapping of air casted Al0.5CrFeCoNiCuMo0.25 HEA.
41
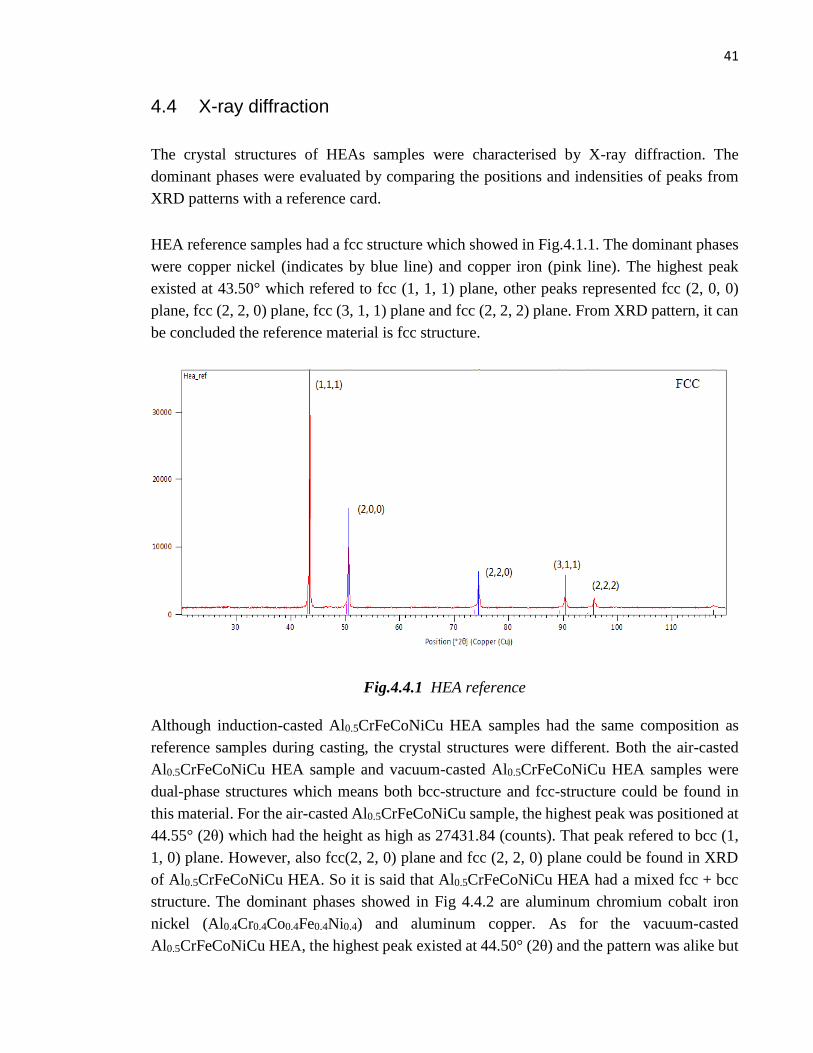
4.4 X-ray diffraction
The crystal structures of HEAs samples were characterised by X-ray diffraction. The
dominant phases were evaluated by comparing the positions and indensities of peaks from
XRD patterns with a reference card.
HEA reference samples had a fcc structure which showed in Fig.4.1.1. The dominant phases
were copper nickel (indicates by blue line) and copper iron (pink line). The highest peak
existed at 43.50° which refered to fcc (1, 1, 1) plane, other peaks represented fcc (2, 0, 0)
plane, fcc (2, 2, 0) plane, fcc (3, 1, 1) plane and fcc (2, 2, 2) plane. From XRD pattern, it can
be concluded the reference material is fcc structure.
Fig.4.4.1 HEA reference
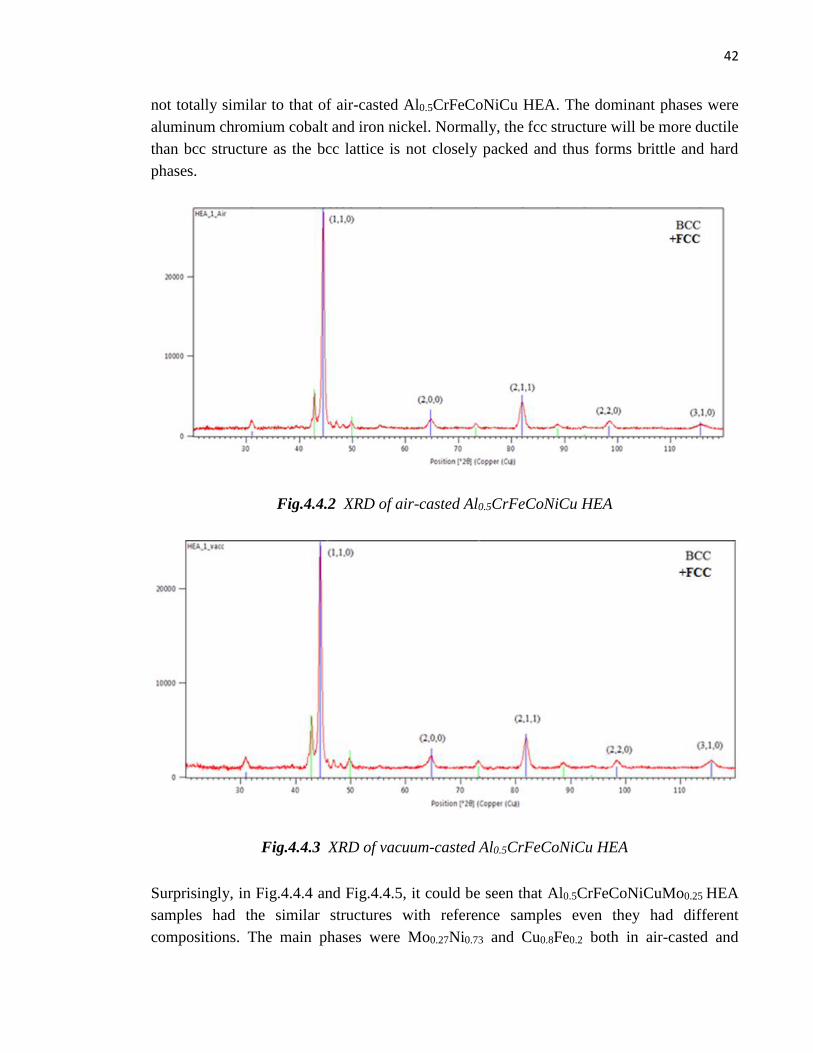
Although induction-casted Al0.5CrFeCoNiCu HEA samples had the same composition as
reference samples during casting, the crystal structures were different. Both the air-casted
Al0.5CrFeCoNiCu HEA sample and vacuum-casted Al0.5CrFeCoNiCu HEA samples were
dual-phase structures which means both bcc-structure and fcc-structure could be found in
this material. For the air-casted Al0.5CrFeCoNiCu sample, the highest peak was positioned at
44.55° (2θ) which had the height as high as 27431.84 (counts). That peak refered to bcc (1,
1, 0) plane. However, also fcc(2, 2, 0) plane and fcc (2, 2, 0) plane could be found in XRD
of Al0.5CrFeCoNiCu HEA. So it is said that Al0.5CrFeCoNiCu HEA had a mixed fcc + bcc
structure. The dominant phases showed in Fig 4.4.2 are aluminum chromium cobalt iron
nickel (Al0.4Cr0.4Co0.4Fe0.4Ni0.4) and aluminum copper. As for the vacuum-casted
Al0.5CrFeCoNiCu HEA, the highest peak existed at 44.50° (2θ) and the pattern was alike but
42
not totally similar to that of air-casted Al0.5CrFeCoNiCu HEA. The dominant phases were
aluminum chromium cobalt and iron nickel. Normally, the fcc structure will be more ductile
than bcc structure as the bcc lattice is not closely packed and thus forms brittle and hard
phases.
Fig.4.4.2 XRD of air-casted Al0.5CrFeCoNiCu HEA
Fig.4.4.3 XRD of vacuum-casted Al0.5CrFeCoNiCu HEA
Surprisingly, in Fig.4.4.4 and Fig.4.4.5, it could be seen that Al0.5CrFeCoNiCuMo0.25 HEA
samples had the similar structures with reference samples even they had different
compositions. The main phases were Mo0.27Ni0.73 and Cu0.8Fe0.2 both in air-casted and
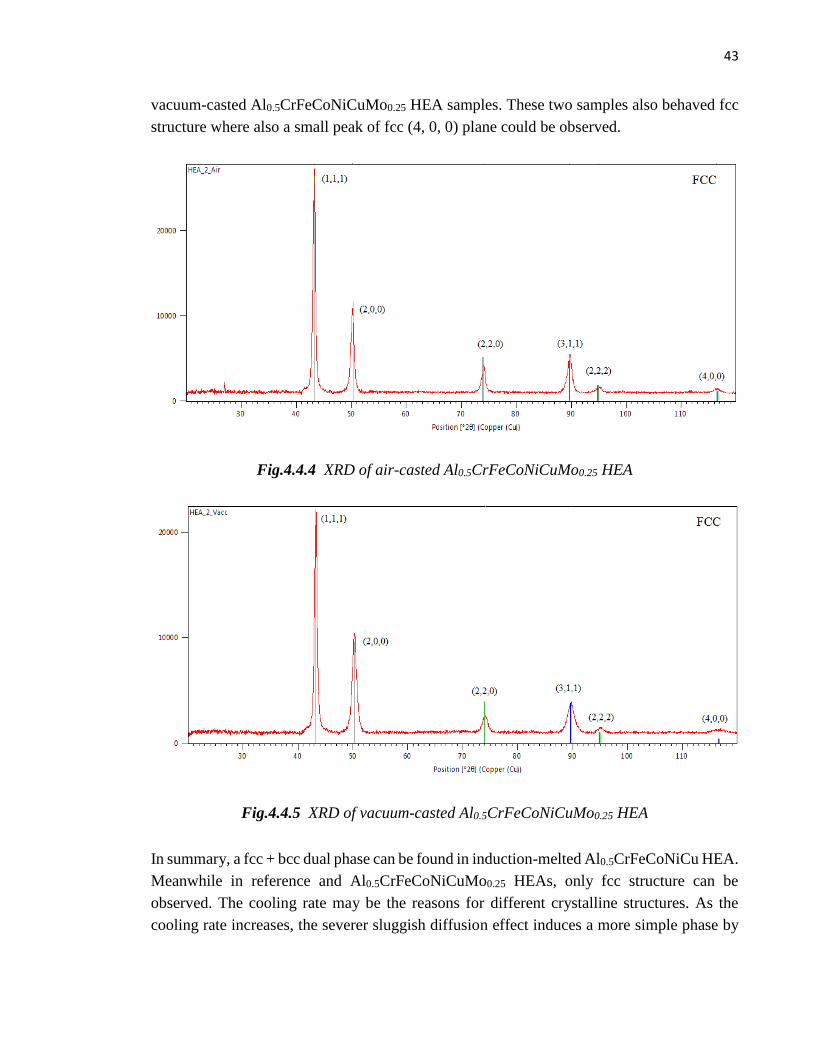
43
vacuum-casted Al0.5CrFeCoNiCuMo0.25 HEA samples. These two samples also behaved fcc
structure where also a small peak of fcc (4, 0, 0) plane could be observed.
Fig.4.4.4 XRD of air-casted Al0.5CrFeCoNiCuMo0.25 HEA
Fig.4.4.5 XRD of vacuum-casted Al0.5CrFeCoNiCuMo0.25 HEA
In summary, a fcc + bcc dual phase can be found in induction-melted Al0.5CrFeCoNiCu HEA.
Meanwhile in reference and Al0.5CrFeCoNiCuMo0.25 HEAs, only fcc structure can be
observed. The cooling rate may be the reasons for different crystalline structures. As the
cooling rate increases, the severer sluggish diffusion effect induces a more simple phase by
44
limiting the growing space of grains, thus it prefers to form bcc or fcc structure respectively
instead of a dual phase consists of fcc + bcc structure.
4.5 Hardness test
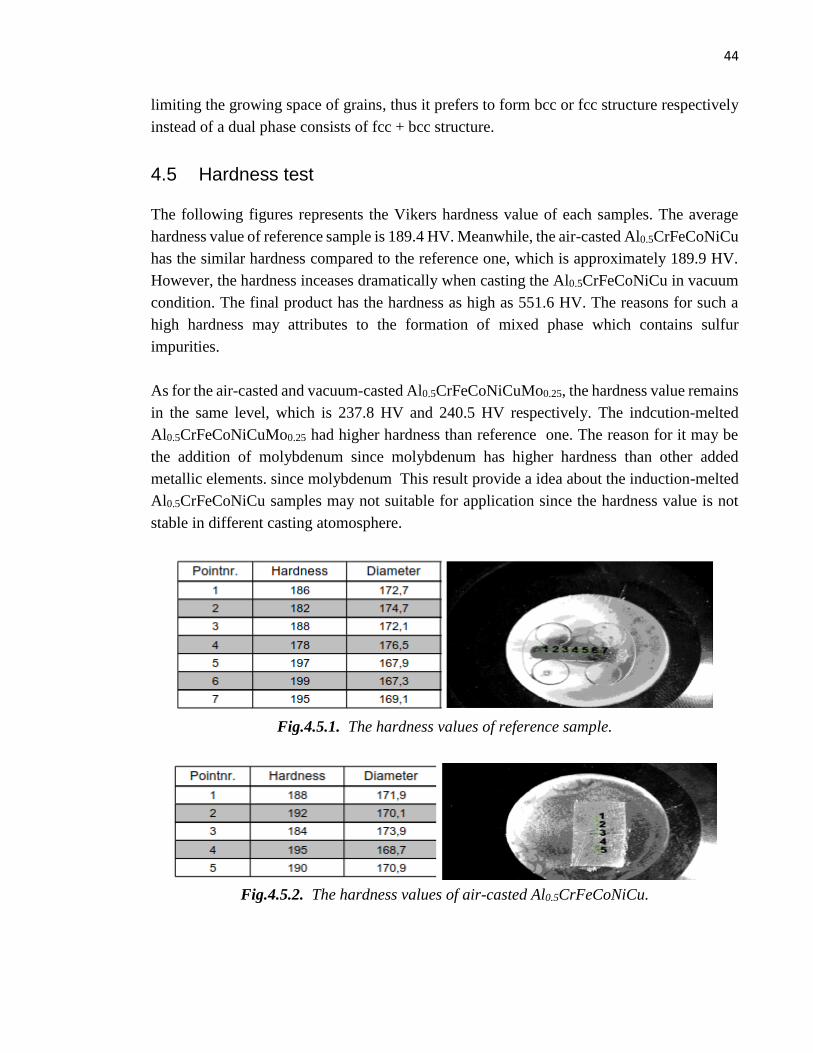
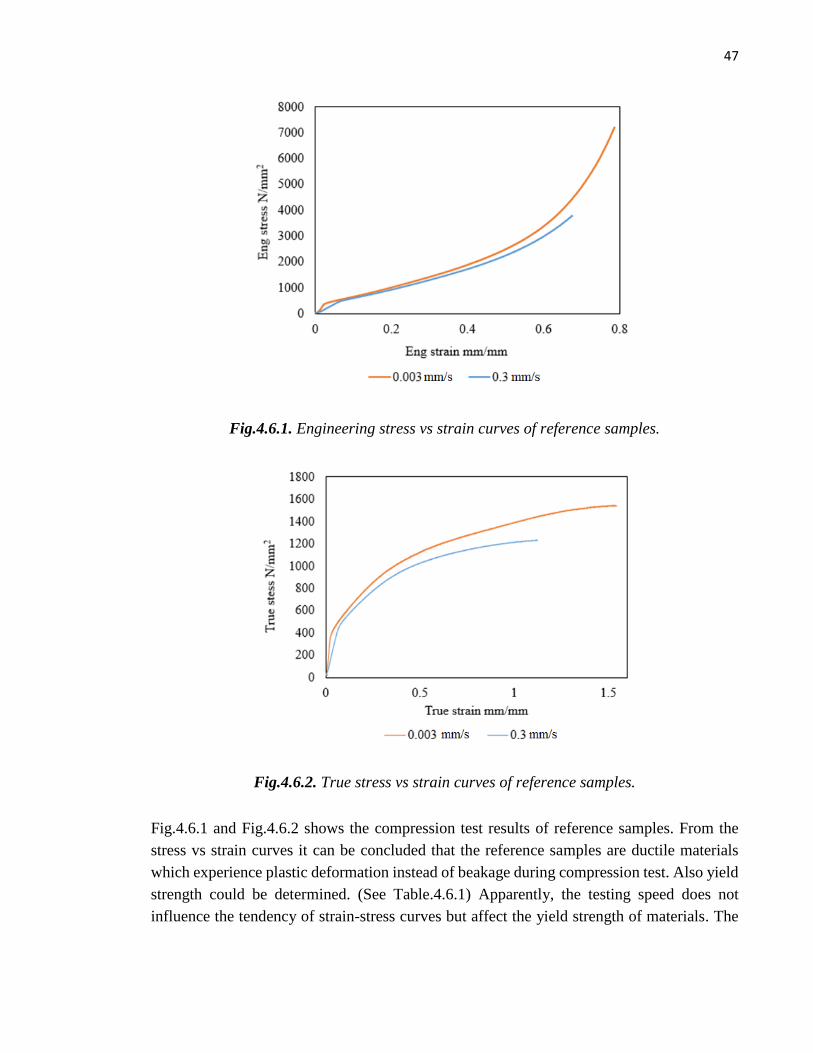
The following figures represents the Vikers hardness value of each samples. The average
hardness value of reference sample is 189.4 HV. Meanwhile, the air-casted Al0.5CrFeCoNiCu
has the similar hardness compared to the reference one, which is approximately 189.9 HV.
However, the hardness inceases dramatically when casting the Al0.5CrFeCoNiCu in vacuum
condition. The final product has the hardness as high as 551.6 HV. The reasons for such a
high hardness may attributes to the formation of mixed phase which contains sulfur
impurities.
As for the air-casted and vacuum-casted Al0.5CrFeCoNiCuMo0.25, the hardness value remains
in the same level, which is 237.8 HV and 240.5 HV respectively. The indcution-melted
Al0.5CrFeCoNiCuMo0.25 had higher hardness than reference one. The reason for it may be
the addition of molybdenum since molybdenum has higher hardness than other added
metallic elements. since molybdenum This result provide a idea about the induction-melted
Al0.5CrFeCoNiCu samples may not suitable for application since the hardness value is not
stable in different casting atomosphere.
Fig.4.5.1. The hardness values of reference sample.
Fig.4.5.2. The hardness values of air-casted Al0.5CrFeCoNiCu.

45
Fig.4.5.3. The hardness values of air-casted Al0.5CrFeCoNiCuMo0.25.
Fig.4.5.4. The hardness values of vacuum-casted Al0.5CrFeCoNiCu.
Fig.4.5.5. The hardness values of vacuum-casted Al0.5CrFeCoNiCuMo0.25.

46
Fig.4.5.6. Comparison of hardness of different samples.
4.6 Compression tests
The compression test of HEAs samples were carried out with different testing speeds. For
reference samples, since the diameter and length was relatively small (the diameters of each
sample are presented in Table.4.6), the tesing speeds were selected as 0.3 mm/s and 0.003
mm/s. Meanwhile, the testing speeds for induction-melted samples were 0.8 mm/s and 0.008
mm/s. In first step, the sample was compressed with a testing speed as 0.003 mm/s and the
maximum load was 20 kN. After the sample was compressed into small plate, removed it and
put another refernce sample in the test fixture and compressed it with a testing speed as 0.3
mm/s. These two steps were set up to see whether the testing speed influences the mechanical
behaviours of HEAs. The results were plotted in Fig.4.6.1 and Fig.4.6.2.
47
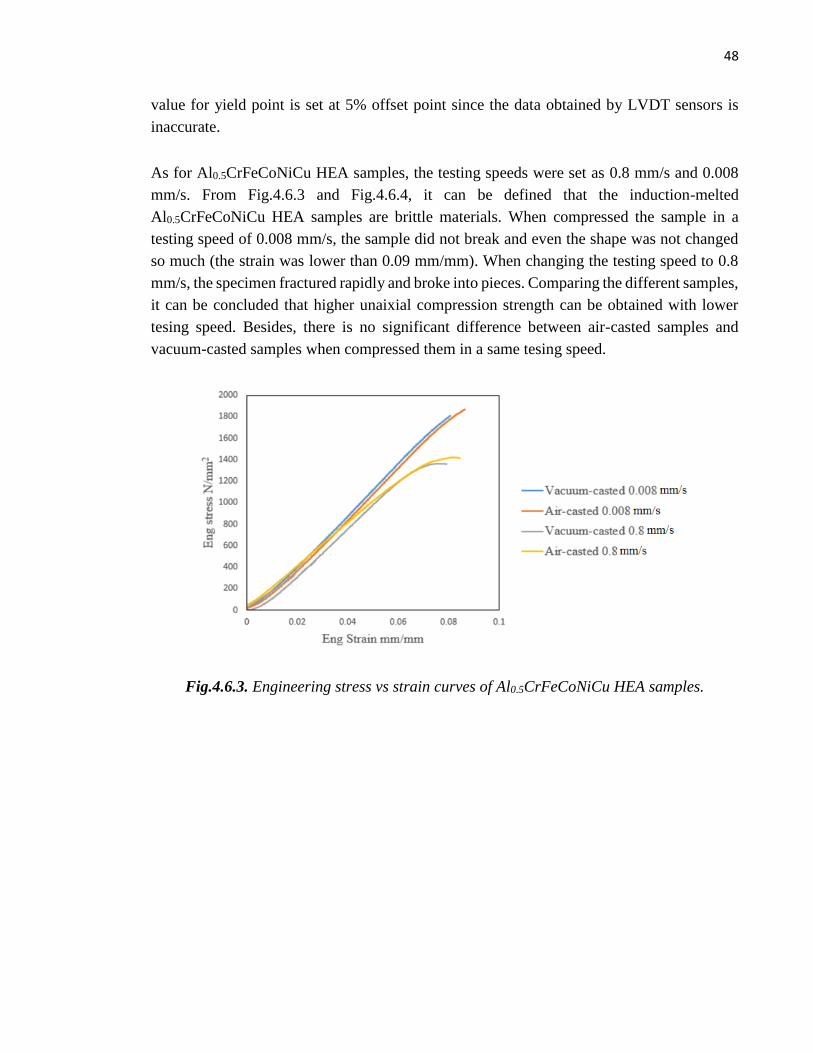
Fig.4.6.1. Engineering stress vs strain curves of reference samples.
Fig.4.6.2. True stress vs strain curves of reference samples.
Fig.4.6.1 and Fig.4.6.2 shows the compression test results of reference samples. From the
stress vs strain curves it can be concluded that the reference samples are ductile materials
which experience plastic deformation instead of beakage during compression test. Also yield
strength could be determined. (See Table.4.6.1) Apparently, the testing speed does not
influence the tendency of strain-stress curves but affect the yield strength of materials. The
48
value for yield point is set at 5% offset point since the data obtained by LVDT sensors is
inaccurate.
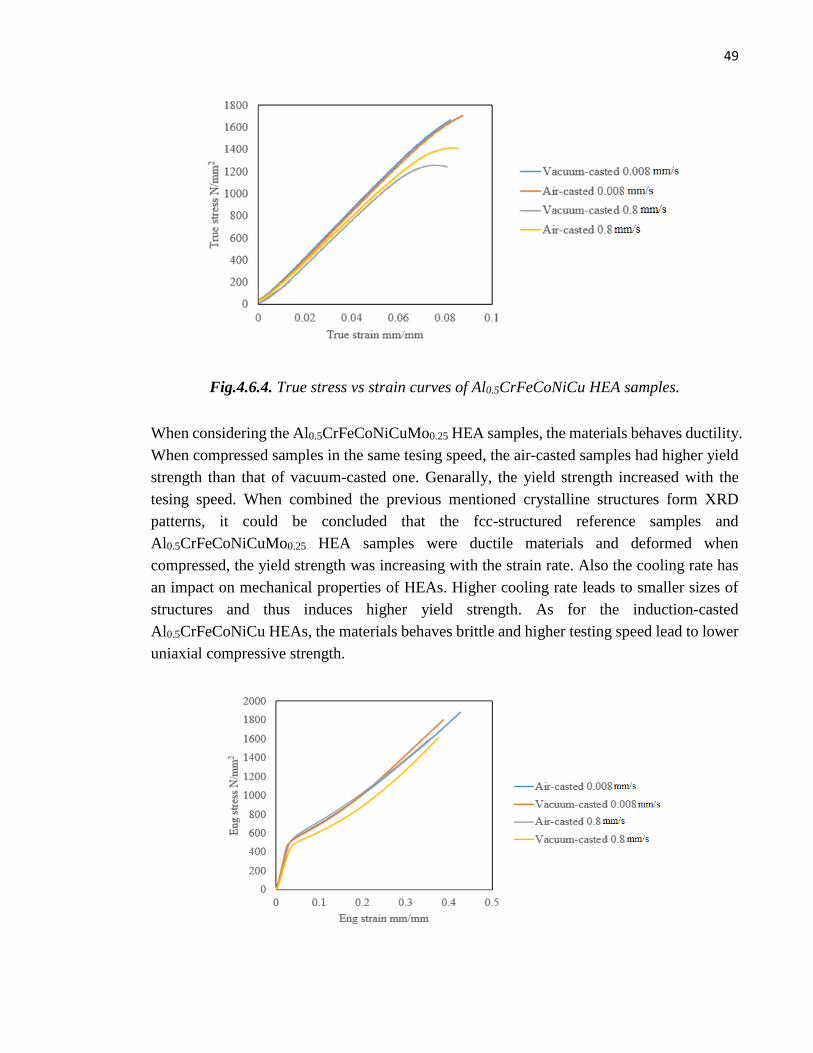
As for Al0.5CrFeCoNiCu HEA samples, the testing speeds were set as 0.8 mm/s and 0.008
mm/s. From Fig.4.6.3 and Fig.4.6.4, it can be defined that the induction-melted
Al0.5CrFeCoNiCu HEA samples are brittle materials. When compressed the sample in a
testing speed of 0.008 mm/s, the sample did not break and even the shape was not changed
so much (the strain was lower than 0.09 mm/mm). When changing the testing speed to 0.8
mm/s, the specimen fractured rapidly and broke into pieces. Comparing the different samples,
it can be concluded that higher unaixial compression strength can be obtained with lower
tesing speed. Besides, there is no significant difference between air-casted samples and
vacuum-casted samples when compressed them in a same tesing speed.
Fig.4.6.3. Engineering stress vs strain curves of Al0.5CrFeCoNiCu HEA samples.
49
Fig.4.6.4. True stress vs strain curves of Al0.5CrFeCoNiCu HEA samples.
When considering the Al0.5CrFeCoNiCuMo0.25 HEA samples, the materials behaves ductility.
When compressed samples in the same tesing speed, the air-casted samples had higher yield
strength than that of vacuum-casted one. Genarally, the yield strength increased with the
tesing speed. When combined the previous mentioned crystalline structures form XRD
patterns, it could be concluded that the fcc-structured reference samples and
Al0.5CrFeCoNiCuMo0.25 HEA samples were ductile materials and deformed when
compressed, the yield strength was increasing with the strain rate. Also the cooling rate has
an impact on mechanical properties of HEAs. Higher cooling rate leads to smaller sizes of
structures and thus induces higher yield strength. As for the induction-casted
Al0.5CrFeCoNiCu HEAs, the materials behaves brittle and higher testing speed lead to lower
uniaxial compressive strength.

50
Fig.4.6.5. Engineering stress vs strain curves of Al0.5CrFeCoNiCuMo0.25 HEA samples.
Fig.4.6.6. True stress vs strain curves of Al0.5CrFeCoNiCuMo0.25 HEA samples.
Table.4.6. Compression mechanical properties of HEAs
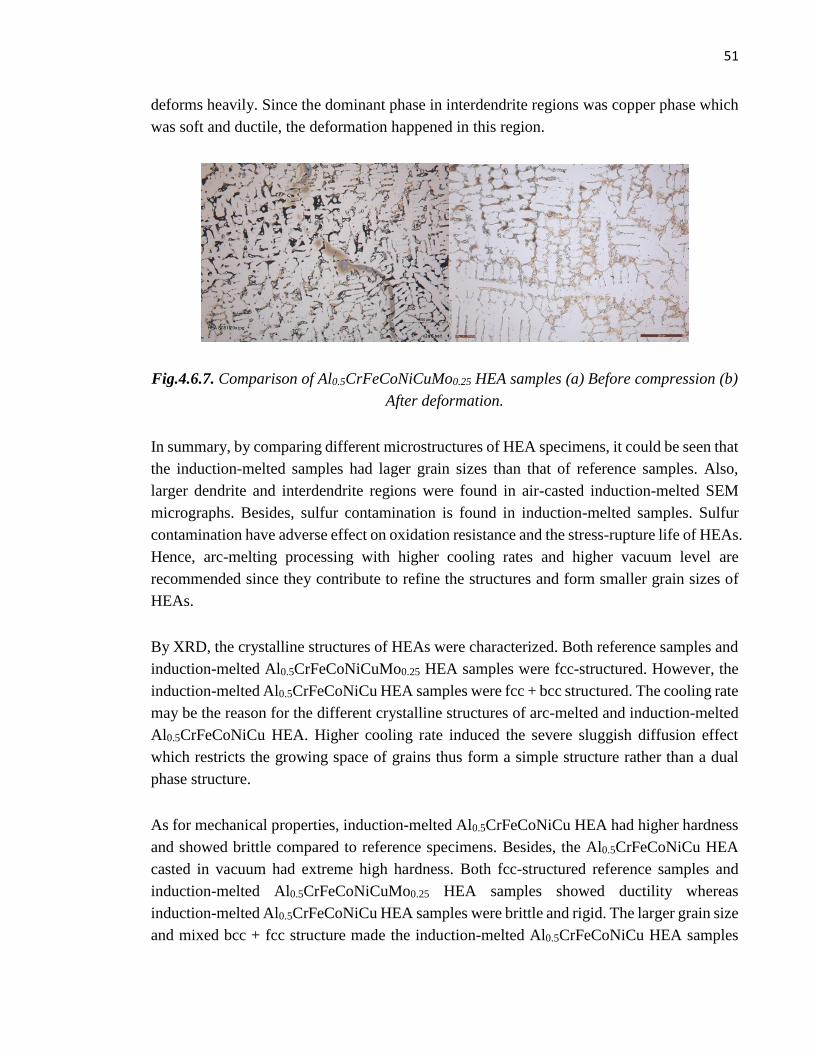
After the compression test, air-casted Al0.5CrFeCoNiCuMo0.25 HEA samples were
investigated by optical microscope. Fig.4.6.7 compared the microstructures of air-casted
Al0.5CrFeCoNiCuMo0.25 HEA before and after the compression. The optical microscopy
images were taken in the same magnification. It could be seen that the interdendrite regions
Sample Length (mm)
Diameter (mm)
Area (mm2)
Testing speed
(mm/s)
Yield strength
(MPa)
Uniaxial compressive
strength (MPa)
HEA_ref_10-1 3.00 2.78 6.01 0.3 654.20 -
HEA_ref_10-3 3.15 2.76 5.98 0.003 380.90 -
HEA1_air_10-1 7.85 7.99 50.13 0.8 - 1414.95
HEA1_air_10-3 7.79 7.94 49.51 0.008 - 1705.72
HEA1_vac_10-1 7.84 7.99 50.13 0.8 - 1259.95
HEA1_vac_10-3 7.90 7.96 49.76 0.008 - 1565.14
HEA2_air_10-1 8.02 7.97 49.89 0.8 607.83 -
HEA2_air_10-3 8.07 7.98 50.01 0.008 601.80 -
HEA2_vac_10-1 8.00 7.97 49.89 0.8 525.56 -
HEA2_vac_10-3 7.99 7.98 50.01 0.008 574.79 -
51
deforms heavily. Since the dominant phase in interdendrite regions was copper phase which
was soft and ductile, the deformation happened in this region.
Fig.4.6.7. Comparison of Al0.5CrFeCoNiCuMo0.25 HEA samples (a) Before compression (b)
After deformation.
In summary, by comparing different microstructures of HEA specimens, it could be seen that
the induction-melted samples had lager grain sizes than that of reference samples. Also,
larger dendrite and interdendrite regions were found in air-casted induction-melted SEM
micrographs. Besides, sulfur contamination is found in induction-melted samples. Sulfur
contamination have adverse effect on oxidation resistance and the stress-rupture life of HEAs.
Hence, arc-melting processing with higher cooling rates and higher vacuum level are
recommended since they contribute to refine the structures and form smaller grain sizes of
HEAs.
By XRD, the crystalline structures of HEAs were characterized. Both reference samples and
induction-melted Al0.5CrFeCoNiCuMo0.25 HEA samples were fcc-structured. However, the
induction-melted Al0.5CrFeCoNiCu HEA samples were fcc + bcc structured. The cooling rate
may be the reason for the different crystalline structures of arc-melted and induction-melted
Al0.5CrFeCoNiCu HEA. Higher cooling rate induced the severe sluggish diffusion effect
which restricts the growing space of grains thus form a simple structure rather than a dual
phase structure.
As for mechanical properties, induction-melted Al0.5CrFeCoNiCu HEA had higher hardness
and showed brittle compared to reference specimens. Besides, the Al0.5CrFeCoNiCu HEA
casted in vacuum had extreme high hardness. Both fcc-structured reference samples and
induction-melted Al0.5CrFeCoNiCuMo0.25 HEA samples showed ductility whereas
induction-melted Al0.5CrFeCoNiCu HEA samples were brittle and rigid. The larger grain size
and mixed bcc + fcc structure made the induction-melted Al0.5CrFeCoNiCu HEA samples

52
hard and brittle. By contrast, smaller grain sizes and fcc structure induced by higher cooling
rate and arc-melting processing made the reference samples soft and ductile. In order to get
fine and uniform structure and high mechanical performance, it is recommended to apply
arc-melting with a high cooling rate.
53
5 CONCLUSION
In this work, the main aim to determine whether induction-melted HEAs show similar
structures and mechanical properties compared to the arc-melted reference samples.
Genarally, arc-melted processing has a higher vacuum level than induction-melted
processing which is benificial to reduce the impurities. Also the remelting for several time
can help to reduce the contaminations. The obtained samples showed different structures and
mechanical properties. With SEM micrographs, it could be seen that the surface structure of
arc-melted Al0.5CrFeCoNiCu samples were dendrite-like and alligned in all orientations. By
contrast, the induction-melted samples were dendrite-like and had larger grain sizes. Also a
sulfur contamination was found in Al0.5CrFeCoNiCu samples by EDS map. However, the
distribution of metallic phases was similar. Chromium, cobalt and iron phases were mainly
located in dendrite regions while copper phases gathered in interdendrite regions.
With X-ray diffraction, arc-melted samples showed fcc-structured while induction-melted
samples showed dual-phase structures which contained fcc and bcc structures. By combining
the structures and mechanical properties of these two samples, hard and brittle materials
found in induction-melted samples. On the contrary, arc-melted samples behaved ductile.
The addition of molybdenum also had an imapct on the structures and mechanical properties
of HEAs. Even though Al0.5CrFeCoNiCu HEA and Al0.5CrFeCoNiCuMo0.25 HEA were
casted in the same conditions, the crystalline structures were totally different.
Al0.5CrFeCoNiCu HEA had a mixed structures and behaves brittle whereas
Al0.5CrFeCoNiCuMo0.25 HEA had bcc and shows ductility. Molybdenum containing phase
mainly occured in dendrite regions. Also dark spots consisted of molybdenum and sulfur
contaminations were observed in SEM images. After compression test, the interdendrite
regions deformed heavily since the copper phases were ductile and experienced a significant
deformation during the compression test.
Induction-melted Al0.5CrFeCoNiCuMo0.25 HEA had lower yield strength compared to the
reference one when compressed them in a high strain rate. And induction-melted
Al0.5CrFeCoNiCu HEAs even showed extreme brittleness which meant the products were
not suitable for industrial applications. It could be concluded that the induction-melted
Al0.5CrFeCoNiCu samples showed poor mechanical properties and even some sulfur
impurites occured. The sulfur impurities had a harmful influence on mechanical properties
of HEAs since sulfur could react with other metallic elements and formed sulphides
inclusions. In order to improve the cleanliness and refine the structures of HEAs, the ingot
54
should be remelted in a high vacuum level before casting. Although induction-melting is easy
to control and can prevent alloying loss to some extend, it is better to melt the ingot by arc
melting for several times during casting.
The cooling rate also influence the microstructures and properties of HEAs. Higher cooling
rate induce severer sluggish diffusion effect which leads to smaller grain sizes by limiting
the growing space of grains. Also the dendrite size is compressed with high cooling rate.
High cooling rate also contributes to form simple phases instead of dual-phases. High
hardness and yield strength can be obtained with high cooling rates.
For further study, it is also interesting to know how to get rid of sulfur impurities when casting
HEAs after induction-melting. The possible methods are remelting the ingot for several times
and improve the vacuum level during casting. Since the origin of sulfur contamination is
unknown, it it recommaned to clean the furnace before using. Also, if simple structures and
small grain sizes are desired, the high cooling rate is suitable for manufacturing processing.
Thus, higher hardness and yield strength can be obtained. Besides, the thermal properties of
HEAs can be studied in the future since the melting temperature and DTA curves obtained
with different heating and cooling rate are also helpful factors when choosing the parameters
of heat treatments of HEAs. Heat treatments is benificial to refine and alter the structures of
HEA thus improve the mechanical properties.

55
6 REFERENCES
[1] Yang X, Zhang Y. Prediction of high-entropy stabilized solid solution in multi-
component alloys. Mater Phys Chem 2012;132(2–3):233–8.
[2] Y.F. Ye, Q. Wang, J. Lu, High-entropy alloy: challenges and prospects, Materialstoday,
July–August 2016, Pages 349–362
[3] Lin C, Tsai H, Bor H. Effect of aging treatment on microstructure and properties of high-
entropy Cu0.5CoCrFeNi alloy. Intermetallics 2010;18:1244–50.
[4] Yeh JW, Chen SK, Lin SJ, Gan JY, Chin TS, Shun TT, et al. Nanostructured high-entropy
alloys with multiple principal elements: novel alloy design concepts and outcomes. Adv Eng
Mater 2004;6(5):299–303.
[5] Yeh JW. Recent progress in high-entropy alloys. Presentation at Changsha meeting; 2011.
[6] K.B. Zhang, Z.Y. Fu, J.Y. Zhang, J. Shi, W.M. Wang, H. Wang, Y.C. Wang, and Q.J.
Zhang, J. Alloy. Compd. 502, 295, 2010.
[7] P.D. Jablonski and J.A. Hawk, Proceedings of the 2013 International Symposium on
Liquid Metal Processing and Casting, ed. M.J.M. Krane, A. Jardy, R.L. Williamson and J.J.
Beaman (Wiley, Hoboken, 2013), pp. 329–332.
[8] Chao Wang, Wei Ji, Zhengyi Fu. Mechanical alloying and spark plasma sintering of
CoCrFeNiMnAl high-entropy alloy. Advanced Powder Technology 25 (2014).
[9] B.R. Braeckman, F. Boydens, H. Hidalgo, et al. High entropy alloy thin films deposited
by magnetron sputtering of powder targets. Thin Solid Films 580 (2015) 71–76
[10] Akira T, Kenji A, Takeshi W, Kunio Y, Wei Zhang et al. High-Entropy Alloys with a
Hexagonal Close-Packed Structure Designed by Equi-Atomic Alloy Strategy and Binary
Phase Diagrams. Volume 66, 2014 , pp 1984-1992.
[11] Yeh JW, Lin SJ, Chin TS, Gan JY, Chen SK, Shun TT, et al. Formation of simple crystal
structures in Cu–Co–Ni–Cr–Al–Fe–Ti–V alloys with multiprincipal metallic elements.
Metall Mater Trans A 2004;35(8):2533–6.
[12] Ren B, Liu ZX, Li DM, Shi L, Cai B, Wang MX. Effect of elemental interaction on
microstructure of CuCrFeNiMn high entropy alloy system. J Alloy Compd 2010;493:148–
53.
[13] Guo S, Ng C, Lu J, Liu CT. Effect of valence electron concentration on stability of fcc
or bcc phase in high entropy alloys. J Appl Phys 2011;109:103505.
[14] Li J, Yiping L, Wei W, Zhiqiang C, et al. Microstructure and Mechanical Properties of
a CoFeNi2V0.5Nb0.75 Eutectic High Entropy Alloy in As-cast and Heat-treated Conditions.
No. 32, 2016, pp. 245-220.
56
[15] Chin-You H, Chien-Chang J, et al. Effect of Aluminum Content on Microstructure and
Mechanical Properties of AlxCoCrFeMo0.5Ni High-Entropy Alloys. JOM, Vol. 65, No. 12,
2013.
[16] Andrew M, Christopher C.B, Mitchell L,S, et al. Plasma-Sprayed High Entropy Alloys:
Microstructure and Properties of AlCoCrFeNi and MnCoCrFeNi. 2014.
[17] Wen-yi Huo, Hai-fang Shi, Xin Ren, and Jing-yuan Zhang. Microstructure and Wear
Behavior of CoCrFeMnNbNi High-Entropy Alloy Coating by TIG Cladding. Advances in
Materials Science and Engineering. Volume 2015 (2015), Article ID 64735.
[18] Sicong Fang, Weiping Chen, Zhiqiang Fu. Microstructure and mechanical properties of
twinned Al0.5CrFeNiCo0.3C0.2 high entropy alloy processed by mechanical alloying and spark
plasma sintering Materials and Design 54 (2014) 973–979.
[19] Li Jiang, Yiping Lu, Yong Dong, et al. Annealing effects on the microstructure and
properties of bulk high-entropy CoCrFeNiTi0.5 alloy casting ingot Intermetallics 44 (2014)
37e43.
[20] S. Liu, M.C. Gao, P.K. Liaw, et al. Microstructures and mechanical properties of
AlxCrFeNiTi0.25 alloys. Journal of Alloys and Compounds 619 (2015) 610–615.
[21] Tsai CW, Tsai MH, Yeh JW, Yang CC. Effect of temperature on mechanical properties
of Al0.5CoCrCuFeNi wrought alloy. J Alloy Compd 2010;490(1–2):160–5.
[22] Hemphill MA, Yuan T, Wang GY, Yeh JW, Tsai CW, Chuang A, et al. Fatigue behavior
of Al0.5CoCrCuFeNi high-entropy alloys. Acta Mater 2012;60(16):5723–34.
[23] Ma SG, Zhang Y, Liaw PK. Damping behaviors of AlxCoCrFeNi high-entropy alloys
by a dynamic mechanical analyzer, J Alloy Compd, in preparation.
[24] N. G. Jones, K. A. Christofidou and H. J. Stone. Rapid precipitation in an
Al0.5CrFeCoNiCu high entropy alloy. 2015.
[25] Yeh JW. Recent progress in high-entropy alloys. Presentation at Changsha meeting;
2011.
[26] Yong Zhang, Tingting Zuo, et al. High-entropy Alloys with High Saturation
Magnetization, Electrical Resistivity, and Malleability. Scientific Reports 3,
Article number: 1455 (2013)
[27] B. Zhang, M.C.Gao, Y.Zhang, et al. Senary refractory high-entropy alloy
CrxMoNbTaVW. ComputerCouplingofPhaseDiagramsandThermochemistry51(2015)193–
201.
[28] The Vickers Hardness Testing Machine. Ukcalibrations.co.uk. Retrieved on 2016-06-
03.
[29] Wei Ji, Zhengyi Fu, Weimin Wang, et al. Mechanical alloying synthesis and spark
plasma sintering consolidation of CoCrFeNiAl high-entropy alloy. Journal of Alloys and
Compounds 589 (2014) 61–66.
[30] Zhang Y, Yang X, Liaw PK. Alloy design and properties optimization of high-entropy
alloys. JOM 2012;64(7):830–8.
[31] Yeh JW. Recent progress in high-entropy alloys. Ann Chim Sci Mater 2006;31(6):633–
48.

57
[32] Yong Zhang, Ting Ting Zuo, Zhi Tang, Michael c. Gao, Krin A. Dahmen, et al. Progress
in Materials Science. No.61, 2014, pp. 1-93.


