Embed Size (px)
Citation preview

Zero-Emission Bus Evaluation Results: Orange County Transportation Authority
Fuel Cell Electric Bus
FTA Report No. 0134 Federal Transit Administration
PREPARED BY
Leslie Eudy Matthew Post
National Renewable Energy Laboratory
MAY 2018

COVER PHOTO Fuel cell electric bus operated by Orange County Transportation Authority in Orange County, California. Photo by Leslie Eudy, NREL.
DISCLAIMER This document is disseminated under the sponsorship of the U.S. Department of Transportation in the interest of information exchange. The United States Government assumes no liability for its contents or use thereof. The United States Government does not endorse products of manufacturers. Trade or manufacturers’ names appear herein solely because they are considered essential to the objective of this report.

FEDERAL TRANSIT ADMINISTRATION i
MAY 2018FTA Report No. 0134
PREPARED BY
Leslie Eudy and Matthew PostNational Renewable Energy Laboratory15013 Denver West Parkway Golden, CO 80401
SPONSORED BY
Federal Transit AdministrationOffice of Research, Demonstration and Innovation U.S. Department of Transportation1200 New Jersey Avenue, SEWashington, DC 20590
AVAILABLE ONLINE
https://www.transit.dot.gov/about/research-innovation
Zero-Emission Bus Evaluation Results: Orange County Transportation Authority Fuel Cell Electric Bus

FEDERAL TRANSIT ADMINISTRATION iv
Metric Conversion Table
SYMBOL WHEN YOU KNOW MULTIPLY BY TO FIND SYMBOL
LENGTH
in inches 25.4 millimeters mm
ft feet 0.305 meters m
yd yards 0.914 meters m
mi miles 1.61 kilometers km
VOLUME
fl oz fluid ounces 29.57 milliliters mL
gal gallons 3.785 liters L
ft3 cubic feet 0.028 cubic meters m3
yd3 cubic yards 0.765 cubic meters m3
NOTE: volumes greater than 1000 L shall be shown in m3
MASS
oz ounces 28.35 grams g
lb pounds 0.454 kilograms kg
T short tons (2000 lb) 0.907 megagrams
(or "metric ton") Mg (or "t")
TEMPERATURE (exact degrees)
oF Fahrenheit 5 (F-32)/9
or (F-32)/1.8 Celsius oC
FEDERAL TRANSIT ADMINISTRATION ii
Metric Conversion TableMetric Conversion Table

FEDERAL TRANSIT ADMINISTRATION v
REPORT DOCUMENTATION PAGE Form ApprovedOMB No. 0704-0188
1. AGENCY USE ONLY 2. REPORT DATE May 2018
3. REPORT TYPE AND DATES COVERED June 2017–May 2018
Public reporting burden for this collection of information is estimated to average 1 hour per response, including the time for reviewing instruc-tions, searching existing data sources, gathering and maintaining the data needed, and completing and reviewing the collection of information. Send comments regarding this burden estimate or any other aspect of this collection of information, including suggestions for reducing this burden, to Washington Headquarters Services, Directorate for Information Operations and Reports, 1215 Jefferson Davis Highway, Suite 1204, Arlington, VA 22202-4302, and to the Office of Management and Budget, Paperwork Reduction Project (0704-0188), Washington, DC 20503.
4. TITLE AND SUBTITLE Zero-Emission Bus Evaluation Results: Orange County Transportation Authority Fuel Cell Electric Bus
5. FUNDING NUMBERS
6. AUTHOR(S) Leslie Eudy, Matthew Post
7. PERFORMING ORGANIZATION NAME(S) AND ADDRESS(ES)National Renewable Energy Laboratory 15013 Denver West Parkway Golden, CO 80401
8. PERFORMING ORGANIZATION REPORT NUMBER
FTA Report No. 0134
9. SPONSORING/MONITORING AGENCY NAME(S) AND ADDRESS(ES) U.S. Department of Transportation Federal Transit Administration Office of Research, Demonstration and Innovation East Building 1200 New Jersey Avenue, SE Washington, DC 20590
10. SPONSORING/MONITORING AGENCY REPORT NUMBER
FTA Report No. 0134
11. SUPPLEMENTARY NOTES [https://www.transit.dot.gov/about/research-innovation]
12A. DISTRIBUTION/AVAILABILITY STATEMENT Available from: National Technical Information Service (NTIS), Springfield, VA 22161. Phone 703.605.6000, Fax 703.605.6900, email [[email protected]]
12B. DISTRIBUTION CODE
TRI-30
13. ABSTRACTThis report summarizes the experience and results from a demonstration of a fuel cell electric bus (FCEB) operated by the Orange County Transportation Authority (OCTA). OCTA, based in Santa Ana, California has been operating an FCEB developed through FTA’s National Fuel Cell Bus Program and built by El Dorado National-California with a BAE Systems electric propulsion system and a Ballard fuel cell. The Federal Transit Administration (FTA) is collaborating with the U.S. Department of Energy and DOE’s National Renewable Energy Laboratory to conduct in-service evaluations of advanced technology buses developed under its programs. This report presents evaluation results for the FCEB in comparison to baseline buses in similar service. The focus of the analysis is on the most recent year of service for the demonstration.
14. SUBJECT TERMSFederal Transit Administration; Office of Research, Demonstration, and Innovation; Transit Investments for Greenhouse Gas and Energy Reduction (TIGGER); National Fuel Cell Bus Program
15. NUMBER OF PAGES 48
16. PRICE CODE
17. SECURITY CLASSIFICATION OF REPORT Unclassified
18. SECURITY CLASSIFICATION OF THIS PAGE Unclassified
19. SECURITY CLASSIFICATION OF ABSTRACT Unclassified
20. LIMITATION OF ABSTRACT None

FEDERAL TRANSIT ADMINISTRATION vi
1 Executive Summary
4 Section 1: Introduction
6 Section 2: OCTA FCEB Evaluation Results 6 FleetProfile–OCTA 8 BusTechnologyDescriptions 9 MaintenanceFacilitiesandFueling 10 In-ServiceOperationsEvaluationResults 22 SummaryofAchievementsandChallenges
24 Section 3: OCTA Fleet Summary Statistics 29 FleetSummaryStatistics–SIUnits
30 Appendix: Evaluation Protocol
37 Acronyms and Abbreviations
38 Glossary
7 Figure 2-1: OCTAServiceArea 8 Figure 2-2: OCTAFuelCellElectricBus 9 Figure 2-3: OCTACNGBus 10 Figure 2-4: CumulativeMilesandHoursforFuelCellBus 11 Figure 2-5: AverageMonthlyMilesforFCEBandCNGFleets 12 Figure 2-6: MonthlyAvailabilityandReasonsforUnavailabilityforFCEB 13 Figure 2-7: OverallAvailabilityforFCEBduringEvaluationPeriod 14 Figure 2-8: MonthlyFuelEconomyforFCEBandCNGBuses 15 Figure 2-9: CumulativeBusMBRCandPropulsion-RelatedMBRC 17 Figure 2-10: MonthlyScheduledandUnscheduledMaintenanceCostperMile 18 Figure 2-11: MonthlyMaintenanceCostperMilebySystemforFCEB 19 Figure 2-12: MonthlyMaintenanceCostperMilebySystemforCNGBusFleet
1 Table ES-1: SummaryofOCTAEvaluationResults 5 Table 1-1: SelectedEvaluationProjects 8 Table 2-1: SystemDescriptionsforFCEBandCNGBuses 11 Table 2-2: AverageMonthlyMileage(EvaluationPeriod) 13 Table 2-3: SummaryofAvailabilityandUnavailabilitybyCategory 14 Table 2-4: Mileage,FuelUse,andFuelEconomy 15 Table 2-5: RoadcallsandMBRC 16 Table 2-6: TotalWorkOrderMaintenanceCosts
TABLE OF CONTENTS
LIST OF FIGURES
LIST OF TABLES

FEDERAL TRANSIT ADMINISTRATION vii
18 Table 2-7: Work Order Maintenance Cost per Mile by System 20 Table 2-8: Propulsion-Related Work Order Maintenance Costs by System 22 Table 2-9: Overall Operations (Maintenance and Fuel) Cost per Mile 24 Table 3-1: OCTA – Fleet Operations and Economics 24 Table 3-2: OCTA – Maintenance Costs 25 Table 3-3: OCTA – Breakdown of Maintenance Costs by System 29 Table 3-4: OCTA – Fleet Operations and Economics (SI) 29 Table 3-5: OCTA – Maintenance Costs (SI) 30 Table A-1: DOE/FTA Performance, Cost, and Durability Targets for FCEBs

FEDERAL TRANSIT ADMINISTRATION viii
AcknowledgmentsThis report could not have been possible without the cooperation of the transit agencies, manufacturer partners, and others. Transit agency staff provided data on the zero-emission and baseline buses, reviewed analyses and reports, and participated in meetings to discuss the agency’s overall experience. Manufacturers provided selected data, reviewed reports, and provided feedback. The U.S. Department of Transportation’s Research, Development, and Technology Office and Federal Transit Administration provided funding for the evaluations. The authors thank the following individuals:
U.S. Department of Transportation Federal Transit Administration, Office of Research, Demonstration and Innovation Sean Ricketson Mike Baltes
Ballard Daljit Bawa Tim Sasseen
BAE Systems Robert Devine Frank Macaluso
Center for Transportation and the Environment Jaimie Levin Jon Morgado Michael Tosca
ENC John Young Robert Mendoza
Orange County Transportation Authority Cliff Thorne Bill Habibe Joe Townsend Dayle Withers Sue Zuhlke

FEDERAL TRANSIT ADMINISTRATION ix
AbstractThis report summarizes the experience and results from a demonstration of one fuel cell electric bus (FCEB) operated by the Orange County Transportation Authority (OCTA). OCTA, based in Santa Ana, California, has been operating an FCEB that was developed through FTA’s National Fuel Cell Bus Program and built by ElDorado National-California with a BAE Systems electric propulsion system and a Ballard fuel cell. The Federal Transit Administration (FTA) is collaborating with the U.S. Department of Energy (DOE) and DOE’s National Renewable Energy Laboratory to conduct in-service evaluations of advanced technology buses developed under its programs. This report presents evaluation results for the FCEB in comparison to baseline buses in similar service. The focus of the analysis is on the most recent year of service, from June 2017 through May 2018.

EXECUTIVE SUMMARY
FEDERAL TRANSIT ADMINISTRATION 1
The U.S. Department of Transportation’s (USDOT’s) Federal Transit Administration (FTA) supports the research, development, and demonstration of low- and zero-emission technology for transit buses. FTA funds research projects with a goal of facilitating commercialization of advanced technologies for transit buses that will increase efficiency and improve transit operations. FTA is collaborating with the U.S. Department of Energy (DOE) and DOE’s National Renewable Energy Laboratory (NREL) to conduct in-service evaluations of advanced technology buses developed under its programs. NREL uses a standard evaluation protocol for evaluating the advanced technologies deployed under the FTA programs.
FTA seeks to provide results from new technologies being adopted by transit agencies. The eight evaluations selected to date include battery electric buses (BEBs) and fuel cell electric buses (FCEBs) from different manufacturers operating in fleets located in both cold and hot climates. The purpose of this report is to present the results from an evaluation of one FCEB operated by the Orange County Transportation Authority (OCTA) in Santa Ana, California. NREL’s evaluation of the OCTA FCEB was funded by FTA.
OCTA is responsible for planning, financing, and coordinating Orange County’s freeway, street, and rail development, as well as managing countywide bus and paratransit service, rail service, and the 91 Express Lanes. OCTA is investigating zero-emission bus (ZEB) technologies to address future requirements under the California Air Resources Board transit regulations. The agency considers FCEBs a good option for its service. To gain experience with the technology, OCTA agreed to demonstrate an FCEB, a 40-foot ElDorado National-California (ENC) bus with a BAE Systems hybrid electric propulsion system powered by Ballard’s FCvelocity-HD6 150-kW fuel cell. NREL is collecting data on a fleet of 10 New Flyer compressed natural gas (CNG) buses as baseline comparison. Table ES-1 provides a summary of the results for the FCEB and CNG buses.
Table ES-1Summary of OCTA Evaluation Results
Data Item FCEB CNG
Number of buses 1 10
Total mileage in data period 20,979 426,746
Average monthly mileage per bus 1,748 3,556
Availability (85% target) 70 86
Fuel economy (kg/mile or ggea/mile) 6.46 3.51
Fuel economy (mpdgeb) 7.30 3.92
Average speed, including stops (mph)c 13.6 14.8
Miles between roadcalls (MBRC) – busd 2,338 14,967
MBRC – fuel-cell-system onlyd 35,070 —
Total maintenance cost ($/mile)e 0.47 0.34
Maintenance cost – propulsion system only ($/mile) 0.14 0.10a Gasoline gallon equivalent b Miles per diesel gallon equivalent c Based on scheduled revenue service d MBRC data cumulative through May 2018 e Work order maintenance cost

FEDERAL TRANSIT ADMINISTRATION 2
EXECUTIVE SUMMARY
OCTA has operated the FCEB on several routes similar in duty cycle to the CNG bus routes. The average speed for the FCEB is 13.6 mph compared to the CNG buses at 14.8 mph. The fuel economy for both the FCEB and CNG bus fleet was consistent throughout the data period. At an average of 7.3 miles per diesel gas equivalent (mpdge), the FCEB has a fuel economy that is 1.9 times higher than the CNG fleet fuel economy of 3.9 mpdge.
OCTA reports that the average availability of its CNG bus fleet is 86%; during the data period, the FCEB had an availability of 70%. In June and July 2017, the bus developed an issue with the fuel cell system and was sent back to the original equipment manufacturer for diagnosis and repair. Since returning to service, the bus has averaged 80% availability and the fuel cell system has averaged 99% availability.
During the data period, the maintenance cost for the FCEB was 41% higher than that of the CNG buses. The metric of cost per mile is highly sensitive to the number of buses in a fleet; if 1 bus out of a 10-bus fleet has a major issue, it has less of an effect than if the issue occurred with a smaller fleet, as the cost for that repair is spread out over the accumulated miles of the larger fleet. Because OCTA has only one FCEB, an issue that takes the bus out of service results in lower miles accumulated and, therefore, a higher per-mile cost.
Issues and lessons learned for OCTA include the following:
• Fuel supply – Access to inexpensive hydrogen fuel remains a significant challenge for transit agencies deploying FCEBs. This has especially been a challenge for OCTA. In the early stage of the demonstration, OCTA partnered with the University of California, Irvine (UCI) to use its hydrogen station located about five miles from the OCTA facility. The cost for hydrogen at that station averaged around $13/kg. When the agreement between UCI and OCTA ended in May 2018, UCI elected to discontinue servicing the OCTA bus. OCTA has had to search for other solutions to fuel the bus. Although there are other retail stations in the area, current retail prices are very high – $17/kg; the average fuel costs for other transit agencies with their own hydrogen stations are closer to $7/kg. In addition to the higher fuel cost, OCTA incurs labor costs to fuel and drive the bus to and from the station, which has added significant costs to the project. The agency is moving forward with a new project to procure 10 more buses and build its own fueling station, which will eliminate the need to fuel outside the facility. Agencies considering FCEBs need to plan ahead to avoid this type of early deployment issue.
• Fuel cell issues – Early in the demonstration, OCTA experienced issues with the fuel cell cooling system. While the bus was in service, the operator would see a warning light on the dash and would request a replacement bus. Because the issue was intermittent, maintenance could not always duplicate

FEDERAL TRANSIT ADMINISTRATION 3
EXECUTIVE SUMMARY
the problem to determine the root cause. The situation occurred often during the first months of the demonstration, and troubleshooting the issue took time and effort from all the project partners. The cause was eventually traced to an intermittent digital communication failure between a system controller and pump controller in the fuel cell stack cooling loop. The team corrected the issue by modifying the method by which the system controller commands the pump controller.
• Bus range – OCTA reports that it has experienced some range issues with the FCEB, and some problems have been traced to not getting a full fill at the hydrogen station. The agency typically assigns the bus to blocks of work that are under 225 miles to avoid any issues with the bus having to be replaced on route for low fuel.
OCTA is committed to an environmentally-friendly fleet and has entered into a contract with New Flyer for 10 FCEBs. Under the contract, New Flyer will build 20 FCEBs – 10 buses for OCTA and 10 that will be operated by AC Transit in Oakland, California.

SECTION
1
FEDERAL TRANSIT ADMINISTRATION 4
Introduction
The U.S. Department of Transportation’s (USDOT’s) Federal Transit Administration (FTA) supports the research, development, and demonstration of low- and zero-emission technology for transit buses. FTA funds a number of research projects with a goal of facilitating commercialization of advanced technologies for transit buses that will increase efficiency and improve transit operations. These programs include the following:
• National Fuel Cell Bus Program (NFCBP) – a $180 million, multi-year, cost-share research program for developing and demonstrating commercially-viable fuel cell technology for transit buses.
• Transit Investments for Greenhouse Gas and Energy Reduction (TIGGER) – $225 million for capital investments that would reduce greenhouse gas emissions and/or lower the energy use of public transportation systems.
• Low or No Emission Vehicle Deployment Program (Low-No) – $271.35 million in funding (FY13–FY18) to transit agencies for capital purchases of zero-emission and low-emission transit buses that have been largely proven in testing and demonstration efforts but are not yet widely deployed.
FTA understands the need to share early experience of advanced technologies with the transit industry. FTA is funding evaluations of a selection of these projects to provide comprehensive, unbiased performance results from advanced technology bus development, operations, and implementation. These evaluations have proved useful for a variety of groups, including transit operators considering the technology for future procurements, manufacturers needing to understand the status of the technology for transit applications, and government agencies making policy decisions or determining future research needs. The evaluations include economic, performance, and safety factors. Data are collected on the operation, maintenance, and performance of each advanced technology fleet and a comparable baseline fleet operating at the same site (if available).
FTA is collaborating with the U.S. Department of Energy (DOE) and DOE’s National Renewable Energy Laboratory (NREL) to conduct in-service evaluations of advanced technology buses. For more than a decade, NREL has been evaluating advanced technology transit buses using a standard data collection and analysis protocol originally developed for DOE heavy-duty vehicle evaluations. Funding for these evaluations has come from several agencies, including FTA, DOE, and the California Air Resources Board. NREL has evaluated fuel cell

SECTION 1: INTRODUCTION
FEDERAL TRANSIT ADMINISTRATION 5
electric buses (FCEBs) and battery electric buses (BEBs) following this standard protocol.
NREL uses a set of criteria to prioritize the available projects for selection, including number of buses deployed, record-keeping practices of the transit agency, commitment level of the bus original equipment manufacturer (OEM), and the availability of appropriate baseline buses for comparison. The criteria are not intended to be rigid; however, the determination of priority is based on how many criteria are met. In consultation with FTA, NREL has selected several projects that are in the highest priority category. Other projects will be chosen as more information becomes available. Table 1-1 lists the projects selected for evaluation as of the publication date of this report.
Table 1-1 Selected Evaluation
Projects
Site #
Transit Agency and Location Project Description Evaluation
Status
1King County Metro, Seattle, WA
3 Proterra 40-ft Catalyst buses and 1 fast-charge station
Completed
2Long Beach Transit, Long Beach, CA
10 BYD 40-ft BEBs, overnight charging with 1 inductive charger on route
Initiated April 2017
3Central Contra Costa Transit Authority, Concord, CA
4 Gillig/BAE Systems 29-ft BEBs, overnight charging with 1 inductive charger on route
Completed
4Orange County Transportation Authority, Santa Ana, CA
1 American Fuel Cell Bus (AFCB): BAE Systems, Ballard Power Systems, and ENC
Completed
5Stark Area Regional Transit Authority, Canton, OH
7 AFCBsInitiated August
2017
6Massachusetts Bay Transportation Authority, Boston, MA
1 AFCB with Nuvera PowerTap system fueling infrastructure
Completed
7 Duluth Transit, Duluth, MN 6 Proterra 40-ft Catalyst E2 BEBs Initiated May 2018
8Southeastern Pennsylvania Transportation Authority, Philadelphia, PA
25 Proterra 40-ft Catalyst E2 BEBs
Planned 2019
The purpose of this report is to present the results from the evaluation of one FCEB in operation at the Orange County Transportation Authority (OCTA) in Santa Ana, California. NREL’s evaluation of the OCTA FCEB was funded by FTA.

SECTION
2
FEDERAL TRANSIT ADMINISTRATION 6
OCTA FCEB Evaluation Results
OCTA first began operating its FCEB in May 2016. This section summarizes the evaluation results for the FCEB in comparison to a fleet of CNG baseline buses. The focus of the analysis is on the most recent year of data, June 2017 through May 2018.
Fleet Profile – OCTA OCTA is Orange County’s transportation agency, responsible for planning, financing and coordinating the county’s freeway, street and rail development and managing countywide bus and paratransit service, rail service, and the 91 Express Lanes.1 The agency’s 62 fixed bus routes include local, community, express, and rail-connection service. Figure 2-1 shows the service area for OCTA, which covers 34 cities and unincorporated Orange County.
OCTA is investigating ZEB technologies to address future requirements under the California Air Resources Board transit regulations. The agency considers FCEBs a good option for its service. To gain experience with the technology, OCTA agreed to demonstrate an FCEB developed under the FTA’s NFCBP but originally planned for another agency. When that agency had problems developing the needed hydrogen infrastructure, the project lead, the Center for Transportation and the Environment, began looking for another agency for the demonstration. Although OCTA did not have a hydrogen station, it is in proximity to the station at the University of California, Irvine (UCI). The university was in the process of upgrading the station for its own FCEB, which made it possible for OCTA to use the station.
1 From the OCTA website, http://www.octa.net/default.aspx.

SECTION 2: OCTA FCEB EVALUATION RESULTS
FEDERAL TRANSIT ADMINISTRATION 7
Figure 2-1 OCTA Service Area

SECTION 2: OCTA FCEB EVALUATION RESULTS
FEDERAL TRANSIT ADMINISTRATION 8
Bus Technology DescriptionsOCTA’s FCEB is a 40-foot ElDorado National-California (ENC) bus with a BAE Systems hybrid electric propulsion system powered by Ballard’s FCvelocity-HD6 150-kW fuel cell. NREL is collecting data on a fleet of 10 New Flyer CNG buses as baseline comparison. Table 2-1 provides selected specifications for each bus type. Figure 2-2 is a photo of the FCEB, and a baseline bus is pictured in Figure 2-3.
Table 2-1System Descriptions
for FCEB and CNG Buses
Vehicle System FCEB CNG
Number of buses in evaluation 1 10
Bus manufacturer ENC New Flyer
Bus year and model 2016 Axess 2016 Xcelsior
Length (ft) 40 40
GVWR (lb) 43,420 42,290
Fuel cell or engine Ballard FCvelocity2-HD6, 150 kWCummins ISL-G, 5.9L 280 hp @ 2,200 rpm
Hybrid systemBAE Systems, series hybrid
propulsion system, HDS 200, 200 kW peak
N/A
Energy storageA123, Nanophosphate
Li-ion; 200 kW, 11 kWhN/A
Accessories Electric Mechanical
Fuel capacityGaseous hydrogen, 8 Luxfer-
Dynetek cylinders, 50 kg at 350 bar
CNG, 6 Lincoln Composites tanks, 156 gge at 3,600 psi
Bus purchase cost $1.4M $580,000
2 FCvelocity is a registered trademark of Ballard Power Systems.
Figure 2-2OCTA Fuel Cell
Electric Bus

SECTION 2: OCTA FCEB EVALUATION RESULTS
FEDERAL TRANSIT ADMINISTRATION 9
Figure 2-3OCTA CNG Bus
Maintenance Facilities and FuelingOCTA deployed the FCEB at its Santa Ana facility, which is configured to operate and maintain CNG buses. To allow maintenance of a hydrogen-fueled bus, the agency needed to make minor modifications to the facility. The modifications were made to two maintenance bays and included adding hydrogen sensors and a visual and audible alarm system to notify employees and first responders in case of an accident or emergency. The existing ventilation system met the requirements for hydrogen fuel; therefore, no upgrades were necessary. The cost for design and construction was around $80,000.
OCTA does not have its own hydrogen fueling station at the facility. The agency was fortunate to have a station close by at UCI, approximately five miles from the Santa Ana facility. The station was built primarily for fueling light-duty fuel cell electric vehicles and has a high utilization rate. UCI upgraded this station to provide fuel for a FCEB operated by the University’s transit service. A typical bus fill can take 30 kg hydrogen, which requires time for the station to recover. Because of this, bus fueling had been limited to a small window of time when auto customers were not likely to fuel. As use of the station has increased, the primary function of filling light-duty fuel cell electric vehicles has limited the station’s ability to handle bus fueling. The cost for hydrogen at that station averaged around $13/kg. Fueling the bus each night requires two service staff, which adds about 1.5–3 hours labor per trip to the project costs. The agreement with UCI ended in May 2018, resulting in the need for OCTA to find another source for fuel.
As OCTA prepares for the upcoming delivery of 10 new FCEBs, the agency is building its own hydrogen station and upgrading the entire facility to handle maintenance and operation of FCEBs. The project includes upgrades to the maintenance building, bus wash, paint booth, and other buildings of the facility.
SECTION 2: OCTA FCEB EVALUATION RESULTS
FEDERAL TRANSIT ADMINISTRATION 10
The project was planned in stages such that the highest priority additions—the fueling island and hydrogen station—would be completed in time for the estimated delivery of the new FCEBs in late 2018. Construction for the entire upgrade was expected to be complete by the end of the first quarter of 2019.
In-Service Operations Evaluation ResultsThis section focuses on a full year of operation, June 2017–May 2018 (the evaluation period). OCTA put the fuel cell bus into service in March 2016, and the CNG buses were placed into service at about the same time.
Route AssignmentsOCTA does not randomly dispatch its buses as many other agencies do. Instead, operators select a specific bus and route at each of three sign-ups per year. Because of this, each bus stays on a specific route for a third of a year until the next sign-up period. The system average speed is approximately 14 mph. The FCEB has been operated on routes 150, 47, and 57 since being placed into service. Based on the hours and mileage data, the FCEB averaged 13.6 mph during the data period, which includes idle time during fueling. The CNG baseline buses have been operated on several routes out of the Santa Ana facility. OCTA reports that the scheduled on-route service speed for the CNG baseline buses is 14.8 mph, and the FCEB on-route service speed has been closer to 17 mph.
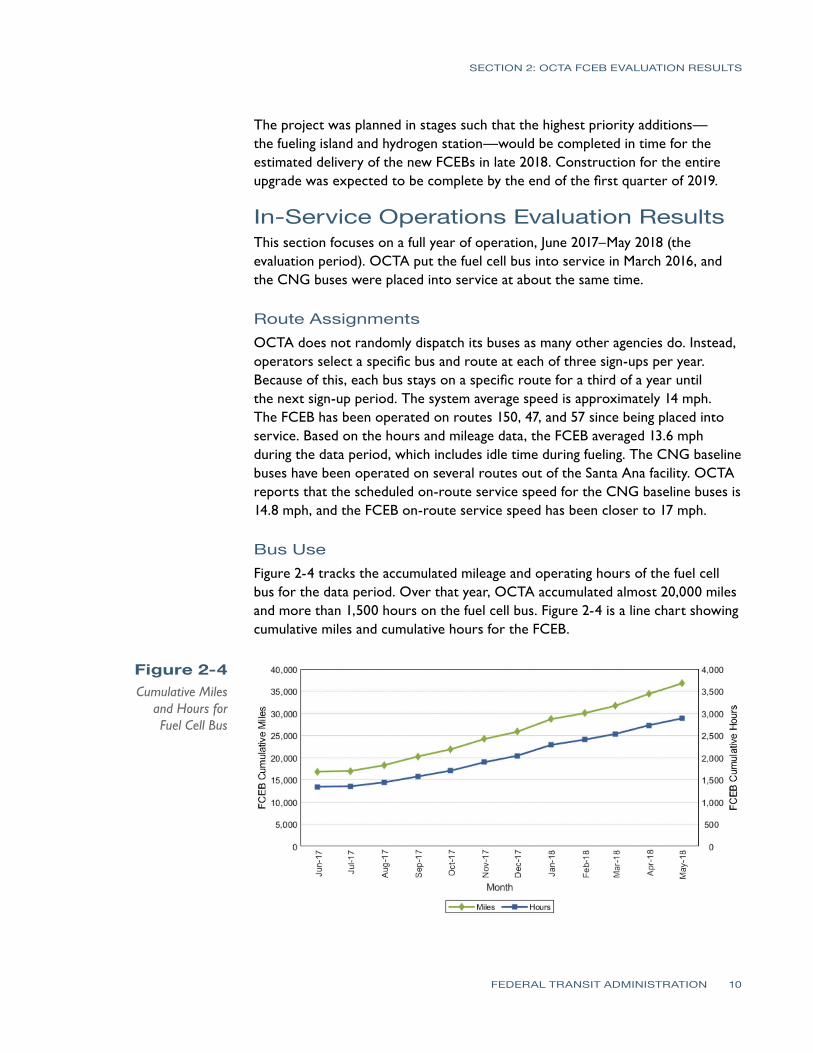
Bus Use Figure 2-4 tracks the accumulated mileage and operating hours of the fuel cell bus for the data period. Over that year, OCTA accumulated almost 20,000 miles and more than 1,500 hours on the fuel cell bus. Figure 2-4 is a line chart showing cumulative miles and cumulative hours for the FCEB.
Figure 2-4 Cumulative Miles
and Hours for Fuel Cell Bus

SECTION 2: OCTA FCEB EVALUATION RESULTS
FEDERAL TRANSIT ADMINISTRATION 11
Table 2-2 provides the data period mileage for each bus and the average monthly mileage by bus type, which is also displayed in Figure 2-5. The fuel cell bus averaged 1,748 miles per month. This is lower than the baseline CNG bus fleet average of 3,556 monthly miles per bus. Although this is the mileage accumulation as the bus is operated by OCTA, the agency reports that the FCEB range is about half that of the CNG buses in its service.
Table 2-2 Average Monthly
Mileage (Evaluation Period)
Bus # Total Mileage Months
Average Monthly Mileage
FCEB 1101 20,979 12 1,748
5801 48,534 12 4,045
5802 45,038 12 3,753
5803 40,830 12 3,403
5804 45,428 12 3,786
5805 42,450 12 3,538
5806 43,144 12 3,595
5807 40,830 12 3,403
5808 30,015 12 2,501
5811 45,393 12 3,783
5813 45,084 12 3,757
CNG fleet 426,746 120 3,556
Figure 2-5 Average Monthly
Miles for FCEB and CNG fleets
AvailabilityThe availability analysis covers 12 months of data collection and evaluation. Planned service for OCTA is seven days a week for both the FCEB and CNG bus fleet. The data presented are based on availability at morning pull-out and do

SECTION 2: OCTA FCEB EVALUATION RESULTS
FEDERAL TRANSIT ADMINISTRATION 12
not necessarily reflect all-day operation. The overall average availability for the FCEB was 74%. OCTA did not provide data that would allow NREL to calculate availability for the individual CNG buses selected as baselines; however, the agency reports that the average availability of its CNG bus fleet as a whole is 86%. Figure 2-6 tracks the monthly average availability for the FCEB as line series along the top of the chart.
Figure 2-6 Monthly
Availability and Reasons for
Unavailability for FCEB
The stacked columns in Figure 2-6 show the number of days that the FCEB was unavailable, organized into five categories. In June and July 2017, the bus developed an issue with the fuel cell system and was sent back to the OEM for diagnosis and repair. Troubleshooting the problem took some time, but it was eventually traced to a failure of the fuel cell main control panel. While the bus was at the ENC factory, the OEM upgraded the low voltage battery control system to help preserve the state of charge during long periods of the bus being turned off. Because this was a customer requested upgrade and not due to a system failure, the bus was considered not planned for service during that time. Since returning to service, the bus has averaged 80% availability and the fuel cell system has averaged 99% availability.
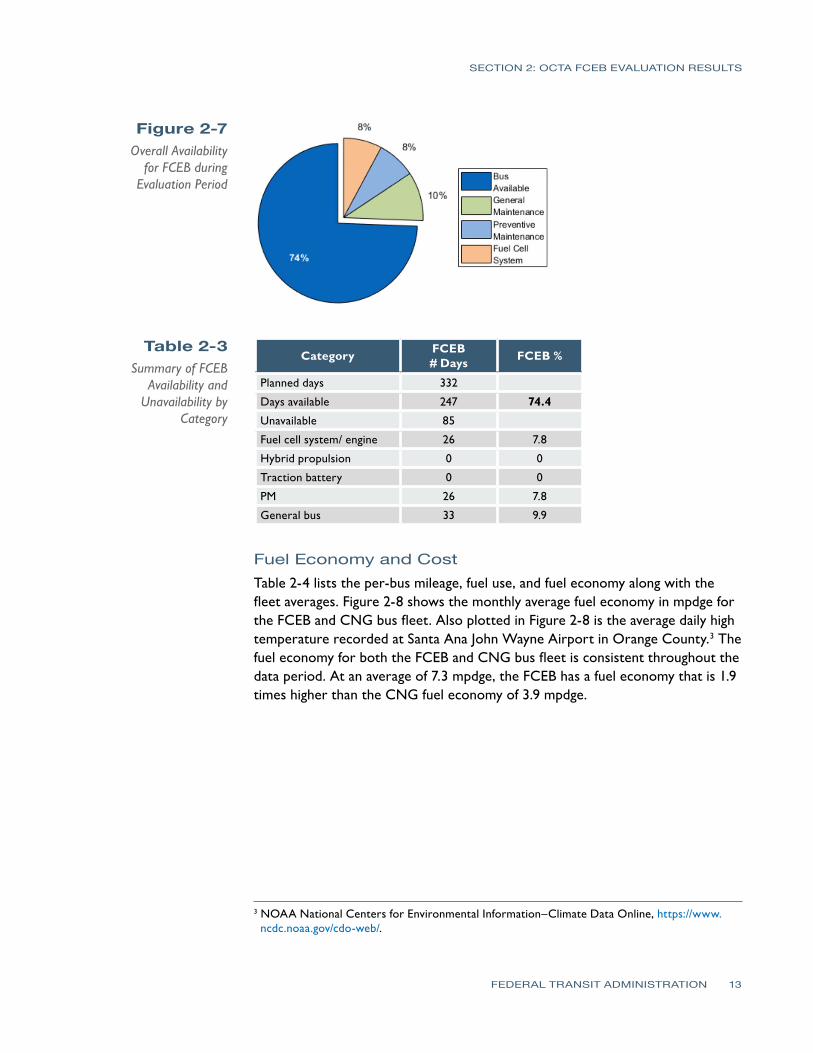
Figure 2-7 shows the overall percentage of days the FCEB was available for service, the percentage of days the bus was out of service, and the reasons for unavailability during the data period. This chart represents the availability data period of July 2017–May 2018. Table 2-3 corresponds to Figure 2-6 and provides a breakdown of the number of days and availability percentages for each category.
SECTION 2: OCTA FCEB EVALUATION RESULTS
FEDERAL TRANSIT ADMINISTRATION 13
Figure 2-7 Overall Availability
for FCEB during Evaluation Period
Table 2-3 Summary of FCEB
Availability and Unavailability by
Category
Category FCEB # Days FCEB %
Planned days 332
Days available 247 74.4
Unavailable 85
Fuel cell system/ engine 26 7.8
Hybrid propulsion 0 0
Traction battery 0 0
PM 26 7.8
General bus 33 9.9
Fuel Economy and CostTable 2-4 lists the per-bus mileage, fuel use, and fuel economy along with the fleet averages. Figure 2-8 shows the monthly average fuel economy in mpdge for the FCEB and CNG bus fleet. Also plotted in Figure 2-8 is the average daily high temperature recorded at Santa Ana John Wayne Airport in Orange County.3 The fuel economy for both the FCEB and CNG bus fleet is consistent throughout the data period. At an average of 7.3 mpdge, the FCEB has a fuel economy that is 1.9 times higher than the CNG fuel economy of 3.9 mpdge.
3 NOAA National Centers for Environmental Information–Climate Data Online, https://www.ncdc.noaa.gov/cdo-web/.

SECTION 2: OCTA FCEB EVALUATION RESULTS
FEDERAL TRANSIT ADMINISTRATION 14
Bus Mileage (fuel base)
Fuel Consumption
(kg/gge)
Fuel Consumption
(dge)
Fuel Economy (kg or gge/mi)
Fuel Economy (mpdge)
FCEB 1101 19,268 2,983.3 2,640.1 6.43 7.30
5801 48,256 13,470.0 12,055.6 3.58 4.00
5802 45,035 12,979.9 11,617.0 3.47 3.88
5803 40,383 11,865.1 10,619.2 3.40 3.80
5804 44,776 12,776.6 11,435.0 3.50 3.92
5805 41,923 12,063.8 10,797.1 3.48 3.88
5806 43,102 11,948.8 10,694.2 3.61 4.03
5807 40,477 11,674.2 10,448.4 3.47 3.87
5808 29,905 8,796.4 7,872.8 3.40 3.80
5811 45,115 12,469.4 11,160.1 3.62 4.04
5813 45,085 12,695.6 11,362.5 3.55 3.97
CNG fleet 424,057 120,739.6 108,062.0 3.51 3.92
Table 2-4Mileage, Fuel Use, and Fuel
Economy
Figure 2-8 Monthly Fuel Economy for
FCEB and CNG Buses
The fuel costs per mile for the evaluation period were $2.01/mi for the FCEB and $0.30/mi for the CNG buses. During the data period, OCTA’s average cost of hydrogen was $12.99/kg. The CNG fuel cost at $1.04/gge is much lower than the typical average cost per gallon for diesel fuel.
Roadcall AnalysisTable 2-5 provides the MBRC for the FCEB and CNG buses categorized by bus roadcalls, propulsion-related roadcalls, and fuel-cell-system-related roadcalls. The data set includes all data from the demonstration clean point of June 2016. Figure 2-9 plots the cumulative MBRC for the FCEB and CNG buses, with total

SECTION 2: OCTA FCEB EVALUATION RESULTS
FEDERAL TRANSIT ADMINISTRATION 15
bus roadcalls on the upper chart and propulsion-related roadcalls and fuel-cell-system-related roadcalls on the lower chart. Propulsion-related roadcalls are a subset of bus roadcalls for all bus fleets. Fuel cell system-related roadcalls are a subset of the propulsion-related roadcalls, specific to the fuel cell of the FCEB. The DOE/FTA targets of 4,000 overall MBRC and 20,000 fuel-cell-system-related MBRC are included in the graph as red dashed lines.
Table 2-5 Roadcalls and MBRC
FCEB CNG
Dates 6/16–5/18 6/16–5/18
Mileage 35,070 793,267
Bus roadcalls 15 53
Bus MBRC 2,338 14,967
Propulsion-related roadcalls 8 25
Propulsion-related MBRC 4,384 31,731
Fuel-cell-system-related roadcalls 1
Fuel-cell-system-related MBRC 35,070
Figure 2-9
Cumulative Bus MBRC and
Propulsion-Related MBRC
The bus MBRC for the FCEB is showing a slow but steady climb since the beginning of the demonstration with an overall bus MBRC of 2,338 at the end of the data period. The metric of MBRC is sensitive to the fleet size, where one roadcall for a small (in this case, one-bus) fleet has a significant effect on the results. The fuel-cell-system-related MBRC has shown a steady increase over time, surpassing the ultimate target of 20,000 around October 2017.

SECTION 2: OCTA FCEB EVALUATION RESULTS
FEDERAL TRANSIT ADMINISTRATION 16
Maintenance AnalysisThis section first covers total maintenance costs and then maintenance costs by bus system. NREL excludes warranty repairs from the calculations. The FCEB was under warranty support by the OEMs during the data period. The CNG buses were out of the warranty period for most systems. Any work covered under warranty was removed from the data set.
Total Work Order Maintenance CostsTable 2-6 shows maintenance costs per mile for the FCEB and CNG buses and includes total cost, scheduled cost, and unscheduled cost. Scheduled costs include PM based on OEM recommendations; all other maintenance is included in unscheduled costs. Like MBRC, the metric of cost per mile is highly sensitive to the number of buses in a fleet. If 1 bus out of a 10-bus fleet has a major issue, it has less of an effect than an issue with a bus in a smaller fleet; the cost for that repair is spread out over the accumulated miles of the larger fleet. Because OCTA has only one FCEB, an issue that takes the bus out of service results in lower miles accumulated and, therefore, a higher per-mile cost. During the data period, the maintenance cost for the FCEB was 41% higher than that of the CNG buses.
Table 2-6 Total Work Order
Maintenance Costs
Bus Fleet Mileage Parts ($) Labor Hours
Total Cost per Mile ($)
Scheduled Cost per Mile ($)
Unscheduled Cost per Mile
($)
FCEB 1101 20,979 1,943.06 160.0 0.47 0.14 0.34
5801 48,534 7,069.32 300.4 0.46 0.12 0.34
5802 45,038 4,562.66 258.8 0.39 0.12 0.27
5803 40,830 4,710.34 192.8 0.35 0.14 0.21
5804 45,428 4,556.08 197.8 0.32 0.13 0.18
5805 42,450 3,914.78 183.6 0.31 0.12 0.19
5806 43,144 3,633.13 192.9 0.31 0.11 0.20
5807 40,830 4,257.73 181.8 0.33 0.13 0.20
5808 30,015 2,764.19 147.2 0.34 0.18 0.15
5811 45,393 3,174.10 148.0 0.23 0.11 0.12
5813 45,084 3,741.71 222.3 0.33 0.14 0.19
Total CNG 426,746 42,384.04 2,025.6 0.34 0.13 0.21
The monthly scheduled and unscheduled maintenance cost per mile for the buses are shown as stacked columns in Figure 2-10. The high scheduled costs for the FCEB in August 2017, November 2017, and March 2018 were attributed to labor hours for PMs that ranged from 11 to 24 hours. OCTA reports that some of this labor was for minor repairs identified during the PM that were not split out from the scheduled service time; the data received by NREL were not detailed enough to separate the scheduled from the unscheduled labor. BAE Systems reports

SECTION 2: OCTA FCEB EVALUATION RESULTS
FEDERAL TRANSIT ADMINISTRATION 17
that a typical PM for the FCEB should take 2–6 hours to complete. Some of the higher hours could also be due to the maintenance staff learning for the new technology. The monthly scheduled labor cost for the CNG fleet is consistent over the data period. Unscheduled costs for the CNG buses included issues with brakes, fareboxes, and air compressors.
Figure 2-10
Monthly Scheduled and
Unscheduled Maintenance Cost per Mile
Work Order Maintenance Costs Categorized by SystemTable 2-7 shows maintenance costs per mile by vehicle system and bus fleet (without warranty costs). The color shading denotes the systems with the highest percentage of maintenance costs: orange for the highest, green for the second highest, and purple for the third highest. The vehicle systems shown in the table are as follows:
• Cab, body, and accessories – includes body, glass, cab and sheet metal, seats and doors, and accessory repairs such as hubodometers and radios
• Propulsion-related systems – repairs for exhaust, fuel, engine, electric motors, battery modules, propulsion control, non-lighting electrical (charging, cranking and ignition), air intake, cooling, and transmission
• PMI – labor for inspections during preventive maintenance
• Brakes – includes brake pads, disks, calipers, anti-lock braking system, and brake chambers
• Frame, steering, and suspension
• HVAC
• Lighting
• Air system (general)
• Axles, wheels, and drive shaft
• Tires

SECTION 2: OCTA FCEB EVALUATION RESULTS
FEDERAL TRANSIT ADMINISTRATION 18
Table 2-7 Work Order
Maintenance Cost per Mile by Systema
System FCEB Cost per Mile ($)
FCEB Percent of Total (%)
CNG Cost per Mile ($)
CNG Percent of Total (%)
Propulsion-related 0.139 29 0.104 31
Cab, body, and accessories 0.169 36 0.071 21
PMI 0.137 29 0.075 22
Brakes 0.000 0 0.045 14
Frame, steering, and suspension
0.000 0 0.005 2
HVAC 0.011 2 0.008 2
Lighting 0.001 0 0.000 0
General air system repairs 0.000 0 0.009 3
Axles, wheels, and drive shaft
0.017 4 0.017 5
Tires 0.001 0 0.000 0
Total 0.474 100 0.335 100a The top three categories for maintenance for each fleet are color coded as follows: orange – highest, green – second highest, and purple – third highest.
The systems with the highest percentage of maintenance costs for the FCEB were 1) cab, body, and accessories; 2) propulsion-related; and 3) PMI. The systems with the highest percentage of maintenance costs for the CNG buses were 1) propulsion-related; 2) PMI; and 3) cab, body, and accessories. Figure 2-11 shows the monthly cost per mile by system for the FCEB, and Figure 2-12 shows the monthly cost per mile by system for the CNG fleet.
Figure 2-11
Monthly Maintenance
Cost per Mile by System for FCEB

SECTION 2: OCTA FCEB EVALUATION RESULTS
FEDERAL TRANSIT ADMINISTRATION 19
Figure 2-12
Monthly Maintenance
Cost per Mile by System for CNG
Bus Fleet
Propulsion-Related Work Order Maintenance CostsPropulsion-related vehicle systems include the exhaust, fuel, engine, battery modules, electric propulsion, air intake, cooling, non-lighting electrical, transmission, and hydraulic systems. These vehicle subsystems have been separated to highlight how maintenance costs for the propulsion system are affected by the change from conventional technology (CNG) to advanced technology (FCEB). Table 2-8 shows the propulsion-related system maintenance costs by category for the two fleets during the data period. Parts for scheduled maintenance, such as filters and fluids, are included in the specific system categories. For example, oil and oil filters are included in the power plant (engine) subsystem parts costs, while air filters are included in the air intake subsystem parts costs.
• Total propulsion-related – The total propulsion-related maintenance cost for the FCEB was 37% higher than that of the CNG buses.
• Exhaust system – Costs for the FCEB and CNG buses were low or zero.
• Fuel system – Costs for this system for the CNG buses made up 38% of the total propulsions system costs. Costs for this system were zero for the FCEB.
• Power plant and electric propulsion – For the FCEB, the costs for the electric propulsion system and fuel cell power plant were low because these systems were primarily covered under warranty. Power plant repairs made up 31% of the total propulsion system costs for the CNG buses; there are no electric propulsion costs for the CNG buses.

SECTION 2: OCTA FCEB EVALUATION RESULTS
FEDERAL TRANSIT ADMINISTRATION 20
• Non-lighting electrical (charging, cranking, and ignition) – Costs for this system made up 55% of the propulsion system costs for the FCEB and 23% of the total propulsion costs for the CNG buses.
• Air intake – Costs for this system were low or zero for the FCEB and CNG buses.
• Cooling – Costs for this system for the CNG buses were low. For the FCEB, cooling system repairs made up 36% of the propulsion system costs.
• Transmission – Costs for this system were low for the CNG buses. The FCEB does not have a transmission.
• Hydraulic – Costs for this system were zero for the FCEB and CNG buses.
Table 2-8
Propulsion-Related Work Order
Maintenance Costs by System
Maintenance System Maintenance Costs FCEB CNG
Mileage 20,979 426,746
Total propulsion-related systems (roll-up)
Parts cost ($) 1,390 19,930
Labor hours 30.5 464.8
Total cost ($) 2,915 43,167
Total cost ($) per mile 0.14 0.10
Exhaust system repairs
Parts cost ($) 0 0
Labor hours 0.0 0.0
Total cost ($) 0 0
Total cost ($) per mile 0.00 0.00
Fuel system repairs
Parts cost ($) 0 3,386
Labor hours 0.0 263.0
Total cost ($) 0 16,541
Total cost ($) per mile 0.00 0.04
Powerplant system repairs
Parts cost ($) 0 5,986
Labor hours 5.0 152.5
Total cost ($) 250 13,611
Total cost ($) per mile 0.01 0.03
Electric propulsion system repairs
Parts cost ($) 0 0
Labor hours 0.5 0.0
Total cost ($) 25 0
Total cost ($) per mile 0.00 0.00
Non-lighting electrical system repairs (general electrical, charging, cranking, ignition)
Parts cost ($) 1,390 8,640
Labor hours 4.0 29.0
Total cost ($) 1,590 10,090
Total cost ($) per mile 0.08 0.02
Air intake system repairs
Parts cost ($) 0 810
Labor hours 0.0 0.0
Total cost ($) 0 810
Total cost ($) per mile 0.00 0.00

SECTION 2: OCTA FCEB EVALUATION RESULTS
FEDERAL TRANSIT ADMINISTRATION 21
Maintenance System Maintenance Costs FCEB CNG
Cooling system repairs
Parts cost ($) 0 531
Labor hours 21.0 0.0
Total cost ($) 1,050 531
Total cost ($) per mile 0.05 0.00
Transmission system repairs
Parts cost ($) 0 571
Labor hours 0.0 20.3
Total cost ($) 0 1,583
Total cost ($) per mile 0.00 0.00
Hydraulic system repairs
Parts cost ($) 0 0
Labor hours 0.0 0.0
Total cost ($) 0 0
Total cost ($) per mile 0.00 0.00
Total Project CostDuring the demonstration project, OCTA incurred additional costs that fell outside the typical maintenance costs reported above. For most agencies, buses are fueled overnight by hostlers that also empty the farebox and clean the bus to prepare it for service the next day. Because OCTA does not have its own hydrogen fueling station, maintenance staff have had to drive the bus to the nearby station, fuel, and return the bus to the facility each night. This process can take several hours for two staff. These extra labor hours show up in the data as separate work orders. Once OCTA completes construction of its on-site hydrogen station, these costs will no longer occur. Because these are considered non-recurring costs, NREL has removed them from the maintenance cost analysis. To show the total cost per mile for the project, Table 2-9 provides all the project costs including fuel, maintenance, and fueling labor. OCTA recorded more than 323 labor hours for staff to fuel the FCEB during the data period. Any transit agency interested in FCEBs should use caution when using these numbers because the experience at OCTA is not representative of that of other FCEB fleets. The high cost of hydrogen at retail stations (as high as $17/kg) and added labor costs will not be the case as the agency adds its new FCEBs later this year. Other agencies operating FCEBs have reported hydrogen costs around $7.50/kg. Using that cost to calculate the operating cost for OCTA brings down the overall cost to $1.16/mi. The future cost of fuel from OCTA’s on-site hydrogen station has yet to be determined; however, it is expected to be below the retail cost that OCTA currently pays at a nearby station.

SECTION 2: OCTA FCEB EVALUATION RESULTS
FEDERAL TRANSIT ADMINISTRATION 22
FCEB CNG
Fuel cost per mile ($/mi) 2.01 0.30
Total maintenance cost per mile ($/mi) 0.47 0.46
Total operating cost per mile ($/mi) 2.49 0.77
Total labor for off-site fueling (h) 323.3 —
Total labor cost for off-site fueling ($/mi) 0.77 —
Total operating cost including fueling labor ($/mi) 3.26 0.63
Summary of Achievements and ChallengesAs with all new technology development, lessons learned during this project could aid other agencies considering FCEB technology. OCTA reports that it has had a positive experience with the technology once the early issues were resolved. The team reports a number of successes that include the following:
• Implemented the agency’s first FCEB
• Accumulated more than 36,000 miles on the FCEB since it was first placed in service
• Introduced FCEB technology to maintenance and operations staff
• Initiated an order of 10 FCEBs and a hydrogen fueling station with funding from a California Air Resources Board Air Quality Improvement Program award
OCTA is committed to an environmentally-friendly fleet and has entered into a contract with New Flyer for 10 FCEBs. The project will field 20 FCEBs total—10 buses for OCTA and 10 that will be operated by AC Transit in Oakland, California.
Summary of ChallengesAdvanced-technology demonstrations typically experience challenges and issues that need to be resolved. Issues and lessons learned for OCTA include the following:
• Fuel supply – Access to inexpensive hydrogen fuel remains a significant challenge for transit agencies deploying FCEBs. This has especially been a challenge for OCTA, which began operating its FCEB before making the decision to build a station. In the early stage of the demonstration, OCTA partnered with UCI to use its hydrogen station. The UCI station is about five miles from the OCTA facility and has been upgraded to handle service to the university’s FCEB. The cost for hydrogen at that station averaged around $13/kg. When the agreement between UCI and OCTA ended in May 2018,
Table 2-9 Overall Operations
(Maintenance, Fuel, and Fueling Labor)
Cost per Mile

SECTION 2: OCTA FCEB EVALUATION RESULTS
FEDERAL TRANSIT ADMINISTRATION 23
UCI decided to stop servicing the OCTA bus. The station was built primarily for fueling light-duty fuel cell electric vehicles and has a high utilization rate. A typical bus fill can take 30 kg, which requires time for the station to recover. Because of this, bus fueling had been limited to a small window of time when auto customers were not likely to fuel. As use of the station has increased, the primary function of filling light-duty fuel cell electric vehicles has limited the station’s ability to handle bus fueling. OCTA has had to search for other solutions to fuel the bus. Although there are other retail stations in the area, current retail prices are very high, $17/kg; the average fuel costs for the other agencies with their own stations are closer to $7/kg. In addition to the higher fuel cost, OCTA incurs labor costs to fuel and drive the bus to and from the station. This has added significant costs to the project. The agency is moving forward with a new project to procure 10 more buses and build its own fueling station, which will eliminate the need to fuel outside the facility. Agencies considering FCEBs need to plan ahead to avoid this type of early deployment issue.
• Fuel cell issues – Early in the demonstration, OCTA experienced issues with the fuel cell cooling system. While the bus was in service, the operator would see a warning light on the dash and would request a replacement bus. Because the issue was intermittent, maintenance could not always duplicate the problem to determine the root cause. The situation occurred often during the first months of the demonstration. Troubleshooting the issue took time and effort from all the project partners. The cause was eventually traced to an intermittent digital communication failure between a system controller and pump controller in the fuel cell stack cooling loop. The team corrected the issue by modifying the method by which the system controller commands the pump controller. BAE Systems also made this correction to the FCEBs in service at other transit agencies.
• Bus range – OCTA reports that it has experienced some range issues with the FCEB. Some of the problems have been traced to not getting a full fill at the hydrogen station. The agency typically assigns the bus to blocks of work that are under 225 miles to avoid any issues with the bus having to be replaced on route for low fuel.

SECTION
3
FEDERAL TRANSIT ADMINISTRATION 24
OCTA Fleet Summary Statistics Table 3-1 OCTA – Fleet Operations and Economics
FCEB CNG
Number of vehicles 1 10
Period used for fuel and oil analysis 6/17–5/18 6/17–5/18
Total number of months in period 12 12
Fuel and oil analysis base fleet mileage 19,268 424,057
Period used for maintenance analysis 6/17–5/18 6/17–5/18
Total number of months in period 12 12
Maintenance analysis base fleet mileage 20,979 426,746
Average monthly mileage per vehicle 1,748 3,556
Availability (%) 74 864
Fleet fuel usage in kg H2 for FCEB/gge for CNG 2,983.3 120,739.6
Roadcalls 4 36
Total MBRC 5,245 11,854
Propulsion roadcalls 2 21
Propulsion MBRC 10,490 20,321
Fleet miles/kg hydrogen (1.13 kg H2/gge CNG) 6.46 3.51
Representative fleet mpg (energy equivalent) 7.30 3.92
Hydrogen cost per kg / CNG cost per gge 12.99 1.07
Fuel cost per mile 2.01 0.30
Total scheduled repair cost per mile 0.14 0.13
Total unscheduled repair cost per mile 0.34 0.21
Total maintenance cost per mile 0.47 0.34
Total operating cost per mile 2.49 0.64
Labor for fueling ($/mi) 0.77 -
Total operating cost per mile with fueling labor 3.26 0.64
Table 3-2 OCTA – Maintenance Costs
FCEB CNG
Fleet mileage 20,979 426,746
Total parts cost 1,943.06 42,384.04
Total labor hours 160.0 2,014.6
Average labor cost (@ $50.00 per hour) 8,000.00 100,729.17
Total maintenance cost 9,943.06 143,113.21
Total maintenance cost per bus 9,943.06 14,311.32
Total maintenance cost per mile 0.47 0.34
4 OCTA did not provide data that would allow NREL to calculate availability for the individual CNG buses selected as baselines; however, the agency reports that the average availability of its CNG bus fleet as a whole is 86%.

SECTION 3: OCTA FLEET SUMMARY STATISTICS
FEDERAL TRANSIT ADMINISTRATION 25
Table 3-3 OCTA – Breakdown of Maintenance Costs by System
FCEB CNG
Fleet mileage 20,979 426,746
Total Engine/Fuel-Related Systems (ATA VMRS 27, 30, 31, 32, 33, 41, 42, 43, 44, 45, 46, 65)
Parts cost 1,390.19 19,929.81
Labor hours 30.50 492.00
Average labor cost 1,525.00 24,600.00
Total cost (for system) 2,915.19 44,529.81
Total cost (for system) per bus 2,915.19 4,452.98
Total cost (for system) per mile 0.14 0.10
Exhaust System Repairs (ATA VMRS 43)
Parts cost 0.00 0.00
Labor hours 0.0 0.0
Average labor cost 0.00 0.00
Total cost (for system) 0.00 0.00
Total cost (for system) per bus 0.00 0.00
Total cost (for system) per mile 0.00 0.00
Fuel System Repairs (ATA VMRS 44)
Parts cost 0.00 3,391.34
Labor hours 0.0 263.0
Average labor cost 0.00 13,150.00
Total cost (for system) 0.00 16,541.34
Total cost (for system) per bus 0.00 1,654.13
Total cost (for system) per mile 0.00 0.04
Power Plant (Engine) Repairs (ATA VMRS 45)
Parts cost 0.00 5,986.49
Labor hours 5.0 152.5
Average labor cost 250.00 7,625.00
Total cost (for system) 250.00 13,611.49
Total cost (for system) per bus 250.00 1,361.15
Total cost (for system) per mile 0.01 0.03
Electric Propulsion Repairs (ATA VMRS 46)
Parts cost 0.00 0.00
Labor hours 0.5 0.0
Average labor cost 25.00 0.00
Total cost (for system) 25.00 0.00
Total cost (for system) per bus 25.00 0.00
Total cost (for system) per mile 0.00 0.00

SECTION 3: OCTA FLEET SUMMARY STATISTICS
FEDERAL TRANSIT ADMINISTRATION 26
FCEB CNG
Electrical System Repairs (ATA VMRS 30-Electrical General, 31-Charging, 32-Cranking, 33-Ignition)
Parts cost 1,390.19 8,639.80
Labor hours 4.0 29.0
Average labor cost 200.00 1,450.00
Total cost (for system) 1,590.19 10,089.80
Total cost (for system) per bus 1,590.19 1,008.98
Total cost (for system) per mile 0.08 0.02
Air Intake System Repairs (ATA VMRS 41)
Parts cost 0.00 810.20
Labor hours 0.0 0.0
Average labor cost 0.00 0.00
Total cost (for system) 0.00 810.20
Total cost (for system) per bus 0.00 81.02
Total cost (for system) per mile 0.00 0.00
Cooling System Repairs (ATA VMRS 42)
Parts cost 0.00 531.01
Labor hours 21.0 27.3
Average labor cost 1,050.00 1,362.50
Total cost (for system) 1,050.00 1,893.51
Total cost (for system) per bus 1,050.00 189.35
Total cost (for system) per mile 0.05 0.00
Hydraulic System Repairs (ATA VMRS 65)
Parts cost 0.00 0.00
Labor hours 0.0 0.0
Average labor cost 0.00 0.00
Total cost (for system) 0.00 0.00
Total cost (for system) per bus 0.00 0.00
Total cost (for system) per mile 0.00 0.00
General Air System Repairs (ATA VMRS 10)
Parts cost 0.00 3,634.90
Labor hours 7.0 72.0
Average labor cost 350.00 3,600.00
Total cost (for system) 350.00 7,234.90
Total cost (for system) per bus 350.00 723.49
Total cost (for system) per mile 0.02 0.02
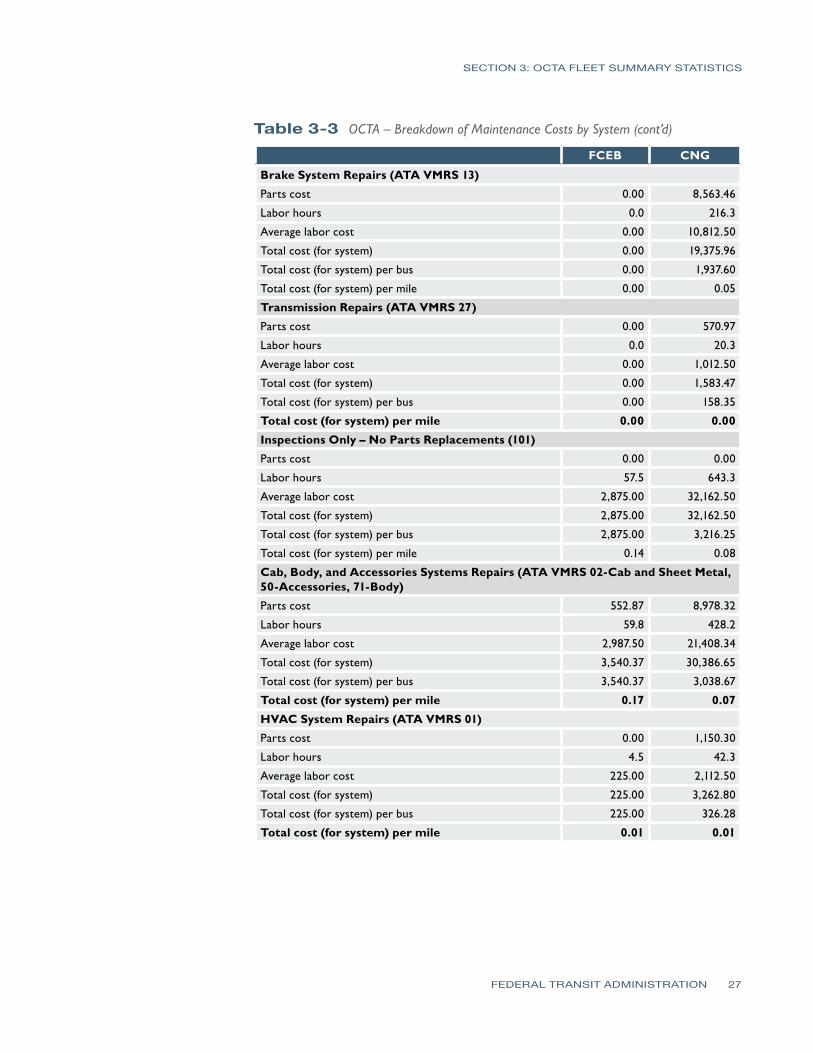
Table 3-3 OCTA – Breakdown of Maintenance Costs by System (cont’d)
SECTION 3: OCTA FLEET SUMMARY STATISTICS
FEDERAL TRANSIT ADMINISTRATION 27
Table 3-3 OCTA – Breakdown of Maintenance Costs by System (cont’d)
FCEB CNG
Brake System Repairs (ATA VMRS 13)
Parts cost 0.00 8,563.46
Labor hours 0.0 216.3
Average labor cost 0.00 10,812.50
Total cost (for system) 0.00 19,375.96
Total cost (for system) per bus 0.00 1,937.60
Total cost (for system) per mile 0.00 0.05
Transmission Repairs (ATA VMRS 27)
Parts cost 0.00 570.97
Labor hours 0.0 20.3
Average labor cost 0.00 1,012.50
Total cost (for system) 0.00 1,583.47
Total cost (for system) per bus 0.00 158.35
Total cost (for system) per mile 0.00 0.00
Inspections Only – No Parts Replacements (101)
Parts cost 0.00 0.00
Labor hours 57.5 643.3
Average labor cost 2,875.00 32,162.50
Total cost (for system) 2,875.00 32,162.50
Total cost (for system) per bus 2,875.00 3,216.25
Total cost (for system) per mile 0.14 0.08
Cab, Body, and Accessories Systems Repairs (ATA VMRS 02-Cab and Sheet Metal, 50-Accessories, 71-Body)
Parts cost 552.87 8,978.32
Labor hours 59.8 428.2
Average labor cost 2,987.50 21,408.34
Total cost (for system) 3,540.37 30,386.65
Total cost (for system) per bus 3,540.37 3,038.67
Total cost (for system) per mile 0.17 0.07
HVAC System Repairs (ATA VMRS 01)
Parts cost 0.00 1,150.30
Labor hours 4.5 42.3
Average labor cost 225.00 2,112.50
Total cost (for system) 225.00 3,262.80
Total cost (for system) per bus 225.00 326.28
Total cost (for system) per mile 0.01 0.01

SECTION 3: OCTA FLEET SUMMARY STATISTICS
FEDERAL TRANSIT ADMINISTRATION 28
Table 3-3 OCTA – Breakdown of Maintenance Costs by System (cont’d)
FCEB CNG
Lighting System Repairs (ATA VMRS 34)
Parts cost 0.00 17.50
Labor hours 0.5 0.0
Average labor cost 25.00 0.00
Total cost (for system) 25.00 17.50
Total cost (for system) per bus 25.00 1.75
Total cost (for system) per mile 0.00 0.00
Frame, Steering, and Suspension Repairs (ATA VMRS 14-Frame, 15-Steering, 16-Suspension)
Parts cost 0.00 36.24
Labor hours 0.0 42.3
Average labor cost 0.00 2,112.50
Total cost (for system) 0.00 2,148.74
Total cost (for system) per bus 0.00 214.87
Total cost (for system) per mile 0.00 0.01
Axle, Wheel, and Drive Shaft Repairs (ATA VMRS 11-Front Axle, 18-Wheels, 22-Rear Axle, 24-Drive Shaft)
Parts cost 0.00 73.51
Labor hours 0.0 78.4
Average labor cost 0.00 3,920.84
Total cost (for system) 0.00 3,994.34
Total cost (for system) per bus 0.00 399.43
Total cost (for system) per mile 0.00 0.01
Tire Repairs (ATA VMRS 17)
Parts cost 0.00 0.00
Labor hours 0.3 0.0
Average labor cost 12.50 0.00
Total cost (for system) 12.50 0.00
Total cost (for system) per bus 12.50 0.00
Total cost (for system) per mile 0.00 0.00
Fueling Labor
Parts cost 0.00 0.00
Labor hours 323.3 0.0
Average labor cost 16,162.50 0.00
Total cost (for system) 16,162.50 0.00
Total cost (for system) per bus 16,162.50 0.00
Total cost (for system) per mile 0.77 0.00

SECTION 3: OCTA FLEET SUMMARY STATISTICS
FEDERAL TRANSIT ADMINISTRATION 29
Fleet Summary Statistics – SI Units Table 3-4 OCTA – Fleet Operations and Economics (SI)
FCEB CNG
Number of vehicles 1 10
Period used for fuel and oil analysis 6/17–5/18 6/17–5/18
Total number of months in period 12 12
Fuel and oil analysis base fleet kilometers 31,008 682,435
Period used for maintenance analysis 6/17–5/18 6/17–5/18
Total number of months in period 12 12
Maintenance analysis base fleet kilometers 33,762 686,762
Average monthly kilometers per vehicle 2,813 5,723
Availability (%) 74 86
Fleet fuel usage in kg H2 / CNG liter equivalent 2,983.3 457,049.1
Roadcalls 4 36
Total KMBRC 8,440 19,077
Propulsion roadcalls 2 21
Propulsion KMBRC 16,881 32,703
Fleet kg hydrogen/100 km 9.62 -
Rep. fleet fuel consumption (L/100 km) 32.23 59.94
Hydrogen cost per kg / CNG cost per liter 12.99 0.28
Fuel cost per kilometer 1.25 0.19
Total scheduled repair cost per kilometer 0.09 0.08
Total unscheduled repair cost per kilometer 0.21 0.13
Total maintenance cost per kilometer 0.29 0.21
Total operating cost per kilometer 1.54 0.40
Labor for fueling ($/km) 0.48 -
Total operating cost per km with fueling labor 2.02 0.40
Table 3-5 OCTA – Maintenance Costs (SI)
FCEB CNG
Fleet mileage 33,762 686,762
Total parts cost 1,943.06 42,384.04
Total labor hours 160.0 2,014.6
Average labor cost (@ $50.00 per hour) 8,000.00 100,729.17
Total maintenance cost 9,943.06 143,113.21
Total maintenance cost per bus 9,943.06 14,311.32
Total maintenance cost per kilometer 0.29 0.21

APPENDIX
FEDERAL TRANSIT ADMINISTRATION 30
Evaluation Protocol
In 2012, DOE and FTA established performance and cost targets for FCEBs.5 Interim targets were set for 2016 along with ultimate targets that FCEBs would need to meet to compete with current commercial-technology buses. DOE and FTA have not established performance targets specific to BEBs, but the performance targets established for FCEBs were based on typical conventional buses and the targets could be considered appropriate for any advanced technology. Table A-1 shows a selection of these technical targets for FCEBs.
Table A-1 DOE/FTA Performance, Cost, and Durability Targets for FCEBsa
Units 2016 Target Ultimate Target
Bus lifetime years/miles 12/500,000 12/500,000
Power plant lifetimeb hours 18,000 25,000
Bus availability % 85 90
Fuel fills per day 1 (<10 min) 1 (<10 min)
Bus costc $ 1,000,000 600,000
Roadcall frequency (bus/fuel cell system)
miles between roadcalls (MBRC)
3,500/15,000 4,000/20,000
Operation timehours per day/ days per week
20/7 20/7
Scheduled and unscheduled maintenance costd $/mile 0.75 0.40
Range miles 300 300
Fuel economymiles per diesel gallon equivalent
8 8
a Cost targets for subsystems (power plant and hydrogen storage) are not included. b Power plant is defined as the fuel cell system and the battery system. c Cost is projected to a production volume of 400 systems per year. This production volume is assumed for analysis purposes only and does not represent an anticipated level of sales. d Excludes mid-life overhaul of power plant.
NREL uses a standard evaluation protocol for evaluating the advanced technologies deployed under the FTA programs. Data parameters include the following:
• Bus system descriptions
• Operations duty-cycle description
• Bus use and availability
5 Fuel Cell Technologies Program Record # 12012, September 12, 2012.

APPENDIX A: EVALUATION PROTOCOL
FEDERAL TRANSIT ADMINISTRATION 31
• Energy/fuel consumption and cost
• Maintenance cost
• Roadcalls
• Infrastructure and facility modification descriptions
• Capital costs
• Implementation experience
For each selected fleet, NREL collects all fueling/charging, cost, and maintenance data for a period of 12 to 18 months to provide a full year of operation data for the analysis. For each site, NREL collects data on conventional technology baseline buses for comparison. For most fleets, the baseline buses are diesel buses. For fleets that do not operate diesel buses, the baseline buses are usually CNG buses. Other technologies, such as diesel hybrid buses, will be included in the evaluation if they are available. The best comparisons are made between buses of the same make, model, production year, size, and route deployment. In that case, the only difference is the propulsion system. This is not always possible. NREL works with the transit agency to determine which vehicles the agency has in operation and selects the best possible baseline match for each evaluation based on what is available. The following sections outline the analysis approach for each parameter.
Bus System DescriptionsThis category of data includes general descriptions of the buses and systems. NREL provides a form that the agency fills out for both the ZEBs and baseline vehicles. The form asks for specifications of the vehicle propulsion system and subsystems as well as accessory equipment. This information documents that the baseline vehicles are similar in equipment to the advanced technology buses. NREL collects these data at the beginning of the project; however, changes may be required if major systems are altered.
Operations Duty-Cycle DescriptionNREL collects duty-cycle descriptions from the transit agency to understand how the ZEBs are used compared to the baseline buses. Data collected include descriptions of the expected routes, operating hours during a typical work day, number of days per week that the vehicle is operated, the amount of fuel and range (in miles) that are expected during a given work day and between fueling/charging, and other information on how the vehicles are used. Transit agencies typically provide these data in text format. NREL uses the data to determine an average operating speed. Occasionally, bus OEMs provide detailed Global Positioning System (GPS) data from the on-board data collection systems. In those cases, NREL will develop specific route maps showing the planned use of the ZEBs.

SECTION 2: OCTA FCEB EVALUATION RESULTS
FEDERAL TRANSIT ADMINISTRATION 32
Bus Use and AvailabilityBus use and availability are indicators of reliability. Lower bus usage may indicate downtime for maintenance or purposeful reduction of planned work for the buses. NREL expresses bus use as average miles accumulated per month. NREL uses a general target of 3,000 miles per month for this metric; however, the monthly miles for each agency will vary depending on the planned use of the buses. If a ZEB fleet does not meet this target, it does not indicate a specific limitation for the technology. NREL collects the mileage data for the ZEBs and baseline buses and calculates average monthly miles accumulated per bus.
Availability is the number of days the buses are actually available compared to the days that the buses are planned for operation, expressed as percent availability. The analysis calculates availability for morning pull-out and doesn’t necessarily reflect all-day availability. Transit agencies typically have a target of 85% availability for their fleets to allow time to handle scheduled and unscheduled maintenance. The sources for availability data vary from fleet to fleet. NREL works with each agency to determine the best source for the data. In addition to tracking the overall availability, NREL collects the reasons for unavailability. Categories for unavailability include issues related to general bus systems, preventive maintenance, electric drive, battery system, and fuel cell system. These data help indicate whether the issues are due to the advanced technology components or are problems with conventional bus systems.
Energy/Fuel ConsumptionData needed for this category include records of each fueling or charging event. For liquid- and gas-fueled buses, NREL collects individual fueling records (amount of fuel, odometer reading, hour reading, date, and fueling time) and fuel prices (each fuel, each time the fuel price changes – price and date). For the BEBs, NREL collects daily energy use (total kWh, number of charges, miles traveled) and utility bills for each charging location (in depot or on-route fast charger). NREL analyzes these data to calculate monthly fuel economy and fuel/energy cost per mile. For the BEBs, NREL uses the bus energy use and utility energy data to calculate the charging losses.
To compare the electrical energy used by the BEBs to the diesel fuel energy used by the baseline hybrid and diesel buses, the electrical energy is converted to diesel gallon equivalent (dge). The energy content of each fuel6 is used to create the conversion factor shown below:
• Lower heating value for diesel fuel = 128,488 Btu/gal
• U.S. average energy content of electricity = 3,414 Btu/kWh
• Conversion factor = 128,488 Btu/gal / 3,414 Btu/kWh = 37.64 kWh/gal
6 Alternative Fuels Data Center, fuel properties database, http://www.afdc.energy.gov/fuels/fuel_properties.php.

SECTION 2: OCTA FCEB EVALUATION RESULTS
FEDERAL TRANSIT ADMINISTRATION 33
Maintenance CostMaintenance data include each repair action, such as preventive (scheduled) maintenance, unscheduled maintenance, and roadcalls, as well as date of repair, labor hours, number of days out of service, odometer reading, parts replaced, parts cost, and descriptions of problem reported and actual repair performed. NREL also collects data and cost for any fluid addition (oil, transmission fluid, deionized water). Engine oil changes are included as part of preventive maintenance. The maintenance data are used to estimate operating costs (along with fuel and engine oil consumption costs). Because accident-related repairs are extremely variable from bus to bus, NREL eliminates those costs from the analysis for both ZEB and baseline bus fleets.
NREL also eliminates warranty cost data from the operating cost calculation because those costs are covered in the purchase price of the buses. Labor costs may be included in this analysis depending on the mechanic who performed the work (operator or manufacturer) and whether those hours were reimbursed under the warranty agreement. For consistency, NREL uses a labor cost of $50/hour. Cost per mile is calculated as follows:
Cost per mile = [(labor hours * $50/hr) + parts cost] / mileage
NREL calculates total cost per mile as well as scheduled and unscheduled cost per mile. To understand the differences between conventional and ZEB technology, NREL presents the cost per mile by vehicle system. The work orders are coded using vehicle maintenance reporting standards (VMRS) developed by the American Trucking Association to aid the industry in tracking equipment and maintenance using a common standard. The propulsion-related systems were chosen to include only those systems of the vehicles that could be affected directly by the selection of a fuel or advanced technology. NREL bases the VMRS coding on parts that were replaced. If there was no part replaced in a given repair, then NREL selects the code by the system being worked on. System categories include the following:
• Cab, body, and accessories – includes body, glass, cab and sheet metal, seats and doors, and accessory repairs such as hubodometers and radios
• Propulsion-related systems (subsystems included):
– Engine/power plant (includes fuel cell for FCEBs)
– Electric propulsion system
– Fuel system
– Exhaust
– Non-lighting electrical system – general electrical, charging, cranking, ignition

APPENDIX A: EVALUATION PROTOCOL
FEDERAL TRANSIT ADMINISTRATION 34
– Air intake
– Cooling
– Transmission
– Hydraulic
• Preventive maintenance inspection (PMI) – labor for inspections during preventive maintenance
• Brakes – includes brake pads, disks, calipers, anti-lock braking system, and brake chambers
• Frame, steering, and suspension
• HVAC
• Lighting
• Air system (general)
• Axles, wheels, and drive shaft
• Tires
RoadcallsAll roadcalls are marked in the maintenance data collected. A roadcall, or revenue vehicle system failure, is defined as a failure of an in-service bus that causes the bus to be replaced on route or causes a significant delay in schedule. If the problem with the bus can be repaired during a layover and the schedule is kept, this is not considered a roadcall. The analysis described here includes only roadcalls that were caused by “chargeable” failures. Chargeable roadcalls include systems that can physically disable the bus from operating on route, such as interlocks (doors, air system), engine, or things that are deemed to be safety issues if operation of the bus continues. They do not include roadcalls for issues with components such as radios, fareboxes, or destination signs.
The transit industry measures reliability as mean distance between failures, also documented as miles between roadcalls (MBRC). MBRC is calculated by dividing the number of miles traveled by the number of roadcalls. NREL uses the roadcall data to calculate cumulative MBRC over time. MBRC results in the report are categorized as follows:
• Bus MBRC – includes all chargeable roadcalls. This category includes propulsion-related issues as well as problems with bus-related systems such as brakes, suspension, steering, windows, doors, and tires.
• Propulsion-related MBRC – includes roadcalls that are attributed to the propulsion system and is a subset of the bus MBRC. Propulsion-related roadcalls can be caused by issues with the engine, transmission, batteries, fuel cell system, or electric drive.

SECTION 3: OCTA FLEET SUMMARY STATISTICS
FEDERAL TRANSIT ADMINISTRATION 35
• Energy storage system (ESS)-related MBRC – includes roadcalls attributed to the ESS only (specific to BEBs).
• Fuel cell system-related MBRC – includes roadcalls attributed to the fuel cell and balance of plant only (specific to FCEBs).
Transit agencies are required to report costs and specific performance data to FTA through the National Transit Database (NTD). After Congress required data reporting in 1974, FTA developed the NTD as a repository of financial, operating, and asset condition data for American transit agencies. These data are published on the NTD website.7 The vehicle maintenance reliability metrics used by the NTD are as follows:
• Major mechanical system failure – a failure of some mechanical element of the revenue vehicle that prevents the vehicle from completing a scheduled revenue trip or from starting the next scheduled revenue trip because actual movement is limited or because of safety concerns.
• Other mechanical system failure – a failure of some other mechanical element of the revenue vehicle that, because of local agency policy, prevents the revenue vehicle from completing a scheduled revenue trip or from starting the next scheduled revenue trip even though the vehicle is physically able to continue in revenue service. Examples include a malfunction in the farebox or the air conditioner.
Total revenue system failures would be a sum of the two categories. The NTD categories do not exactly match the roadcall definitions used in the standard NREL protocol. The primary difference is that NTD’s other mechanical system failures category includes failures of items such as fareboxes and destination signs. This results in the NTD total failures being higher than that of the NREL analysis. Removing these failures from the NTD data would result in higher overall industry average MBRC. In addition, the NTD major mechanical system failure category includes some roadcalls that are not for the propulsion system. The NTD has no category for power plant failures; therefore, there is no direct comparison for fuel cell system-related or ESS-related MBRC.
Infrastructure and Facility Modification DescriptionsAt the beginning of the data collection period, NREL collects details on the fleet’s operations including a description of facilities and services, maintenance and fueling practices, and any other information needed to get a complete understanding of the fleet’s experience with the ZEBs. Descriptions of facilities include fueling, charging, maintenance, and vehicle storage facilities that may be associated with the ZEBs.
7 NTD website: https://www.transit.dot.gov/ntd.

SECTION 3: OCTA FLEET SUMMARY STATISTICS
FEDERAL TRANSIT ADMINISTRATION 36
Capital Costs Data on capital costs include costs for any facility modifications that are required for operation of ZEBs. The vehicle capital costs include the costs for new vehicles and propulsion systems.
Implementation ExperienceThe experiences of a transit agency in implementing any new technology are an important part of fully understanding the current status of that technology. NREL collects data on the fleet implementation experience to document the background work needed for successful implementation of ZEBs, as well as some of the potential pitfalls and lessons learned. The types of information collected in support of this activity include:
• Documentation of the history that led to the agency’s decision to purchase ZEBs, its previous experience with alternative fuels, etc.
• Roles of important supporting organizations such as vehicle manufacturer and supplier, fuel suppliers, and federal, state, or local government agencies.
• Specific incentives for advanced technology vehicles, and regulations or disincentives for the other options that helped form the agency’s decision to purchase ZEBs.
• The driver, fleet personnel, and customer perceptions of the new technology vehicles.
• Special fleet needs such as mechanic, driver, or technician training requirements, special equipment, and safety issues.
• A description of the training implementation strategy including employee orientation, operations and maintenance personnel, and the costs of this training.
• What it took to bring these vehicles into revenue service, and what technical/non-technical hurdles were overcome.

FEDERAL TRANSIT ADMINISTRATION 37
ACRONYMS AC alternating current ATA VMRS American Trucking Association Vehicle Maintenance Reporting Standards BEB battery electric bus Btu British thermal units CNG compressed natural gas dge diesel gallon equivalent DOE U.S. Department of Energy DOT U.S. Department of Transportation ESS energy storage system FCEB fuel cell electric bus FTA Federal Transit Administration ft feet gal gallon gge gasoline gallon equivalent GPS global positioning system hp horse power HVAC heating, ventilation, and air conditioning KMBRC kilometers between roadcall kW kilowatt kWh kilowatt hour lb pound Low-No Low or No Emission Vehicle Deployment Program MBRC miles between roadcall mi mile mpdge miles per diesel gallon equivalent NFCBP National Fuel Cell Bus Program NREL National Renewable Energy Laboratory NTD National Transit Database OCTA Orange County Transportation Authority OEM original equipment manufacturer OST-R DOT’s Research, Development, and Technology Office PMI/PM preventive maintenance inspections RC roadcall rpm revolutions per minute SI International System of Units SOC state of charge TIGGER Transit Investments for Greenhouse Gas and Energy Reduction ZEB zero-emission bus
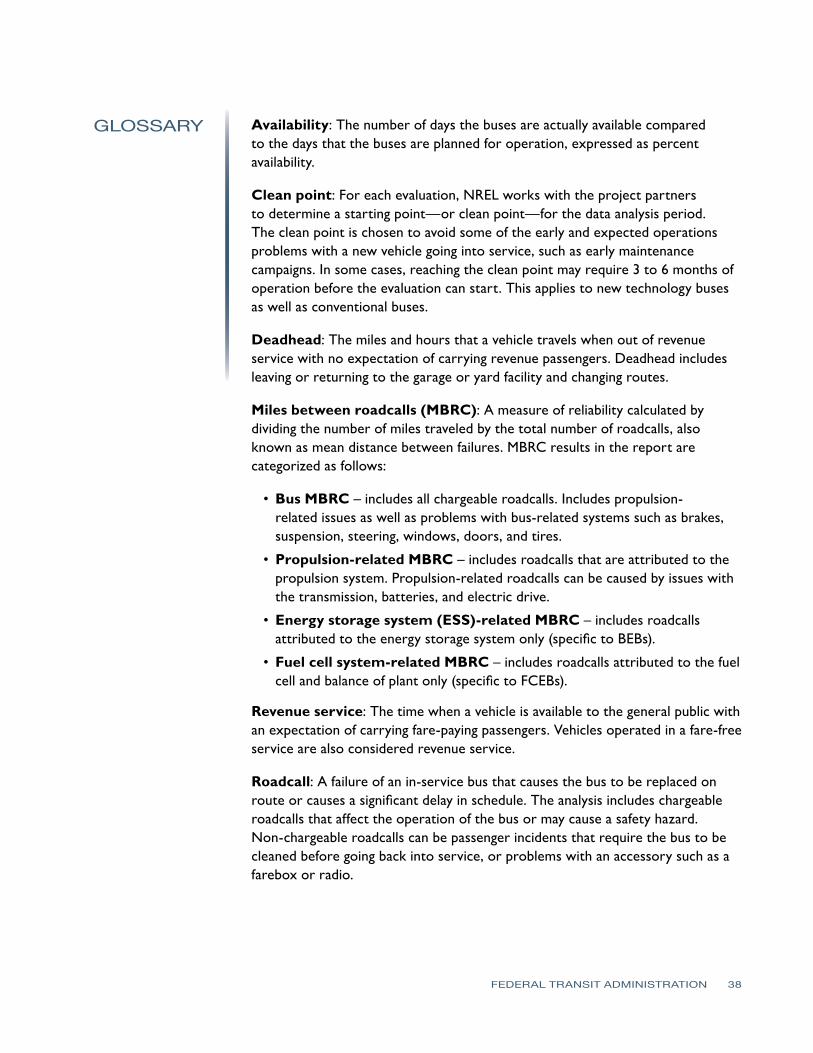
GLOSSARY
FEDERAL TRANSIT ADMINISTRATION 38
Availability: The number of days the buses are actually available compared to the days that the buses are planned for operation, expressed as percent availability.
Clean point: For each evaluation, NREL works with the project partners to determine a starting point—or clean point—for the data analysis period. The clean point is chosen to avoid some of the early and expected operations problems with a new vehicle going into service, such as early maintenance campaigns. In some cases, reaching the clean point may require 3 to 6 months of operation before the evaluation can start. This applies to new technology buses as well as conventional buses.
Deadhead: The miles and hours that a vehicle travels when out of revenue service with no expectation of carrying revenue passengers. Deadhead includes leaving or returning to the garage or yard facility and changing routes.
Miles between roadcalls (MBRC): A measure of reliability calculated by dividing the number of miles traveled by the total number of roadcalls, also known as mean distance between failures. MBRC results in the report are categorized as follows:
• Bus MBRC – includes all chargeable roadcalls. Includes propulsion-related issues as well as problems with bus-related systems such as brakes, suspension, steering, windows, doors, and tires.
• Propulsion-related MBRC – includes roadcalls that are attributed to the propulsion system. Propulsion-related roadcalls can be caused by issues with the transmission, batteries, and electric drive.
• Energy storage system (ESS)-related MBRC – includes roadcalls attributed to the energy storage system only (specific to BEBs).
• Fuel cell system-related MBRC – includes roadcalls attributed to the fuel cell and balance of plant only (specific to FCEBs).
Revenue service: The time when a vehicle is available to the general public with an expectation of carrying fare-paying passengers. Vehicles operated in a fare-free service are also considered revenue service.
Roadcall: A failure of an in-service bus that causes the bus to be replaced on route or causes a significant delay in schedule. The analysis includes chargeable roadcalls that affect the operation of the bus or may cause a safety hazard. Non-chargeable roadcalls can be passenger incidents that require the bus to be cleaned before going back into service, or problems with an accessory such as a farebox or radio.

U.S. Department of TransportationFederal Transit Administration
East Building1200 New Jersey Avenue, SE
Washington, DC 20590https://www.transit.dot.gov/about/research-innovation