Embed Size (px)
Citation preview

Determinants of Foreign Direct Investment of OECD Countries 1991-2001
by
Michael Gast*
Nr. 27, Giessen, September 2005
* Dipl. oec. troph. Michael GAST, Justus-Liebig-Universität Giessen, Zentrum für Inter-
nationale Entwicklungs- und Umweltforschung (Center for International Development and Environmental Research), Otto-Behagel-Str. 10 D, 35394 Giessen.
E-mail: [email protected]
Zentrum für internationale Entwicklungs- und Umweltforschung der Justus-Liebig-Universität Gießen
Discussion Paper

2
Abstract
Using a fixed-effects panel data approach, FDI flows of 22 OECD countries are explained by gravity equations over the period 1991-2001. It is distinguished between all available observations, Intra-EU25 observations only, and observations not belonging to the EU25 area in order to control for EU-specific effects . Regressions are repeated with exports as dependent variable in order to capture diverging influences for trade flows. Changes in total market size and relative market size are important factors that lead both FDI and exports in the same direction. However, relative market size is only significant in the FDI equation when variation between the EU25 area and other investment is taken into account, thus indicating a concentration of FDI within Western and Central Europe. Stock market booms boost FDI but not exports. Differences in significance levels/signs of coefficients of political indicators and exchange rate changes indicate that exports are demand-driven while FDI is supply-driven. Year dummies interacted with country distance show that, overall, FDI and exports tended to flow less to distant countries over the period under consideration. However, this trend is reversed for exports within the EU25 area.
Keywords: foreign direct investment and international trade; multinational firms; models with panel data.
JEL classification: F21, F23, F14, C23.
1 INTRODUCTION
The 1980s and 1990s saw an unprecedented rise in worldwide foreign direct investment
(FDI) that surpassed growth rates of world-wide GDP and trade flows. While today total FDI
stocks are larger than ever, total FDI flows broke in after 2000 and have begun to recuperate
only recently. The economic literature on the subject, however, has grown as quickly as FDI
itself. Since FDI reflects in particular long-term investment activities of multinational
enterprises, much research has been dedicated to identify motivations for a national
enterprise to establish a lasting interest in foreign markets via foreign investment. Basically,
foreign direct investment can take two forms: market-searching, horizontal FDI that
establishes production facilities or distribution networks in order to serve the target market
from within the partner country, or vertical FDI that shifts part of the production chain abroad
in order to exploit differences in factor prices. It is therefore straightforward to assume a
3
connection between FDI and trade. It is often argued that horizontal FDI substitutes for
exports while vertical FDI leads to increased trade with intermediate products.
The Ownership-Location-Internalisation-Paradigm of DUNNING (1977) states that a firm
faces three different possibilities to serve a foreign market: It might export, it might license its
production to independent firms abroad or it might establish its own subsidiaries. The more
OLI advantages there are to be exploited, the more the firm will favour market access by FDI.
Ownership advantages encompass firm-specific advantages like patent rights, strong brands
or superior management abilities which are not bound to a specific location and thus lead to
scale economies. These render certain firms more competitive than potential (foreign) rivals
and thus less willing to share internal knowledge for fear of plagiarism. Location advantages
are pull factors that draw firms towards foreign shores because of lower wages, easier
access to raw materials, a favourable tax environment or a necessary proximity to markets
and consumers. Internalisation advantages relate to the reduction of possible transaction
costs by overcoming principal-agent problems.
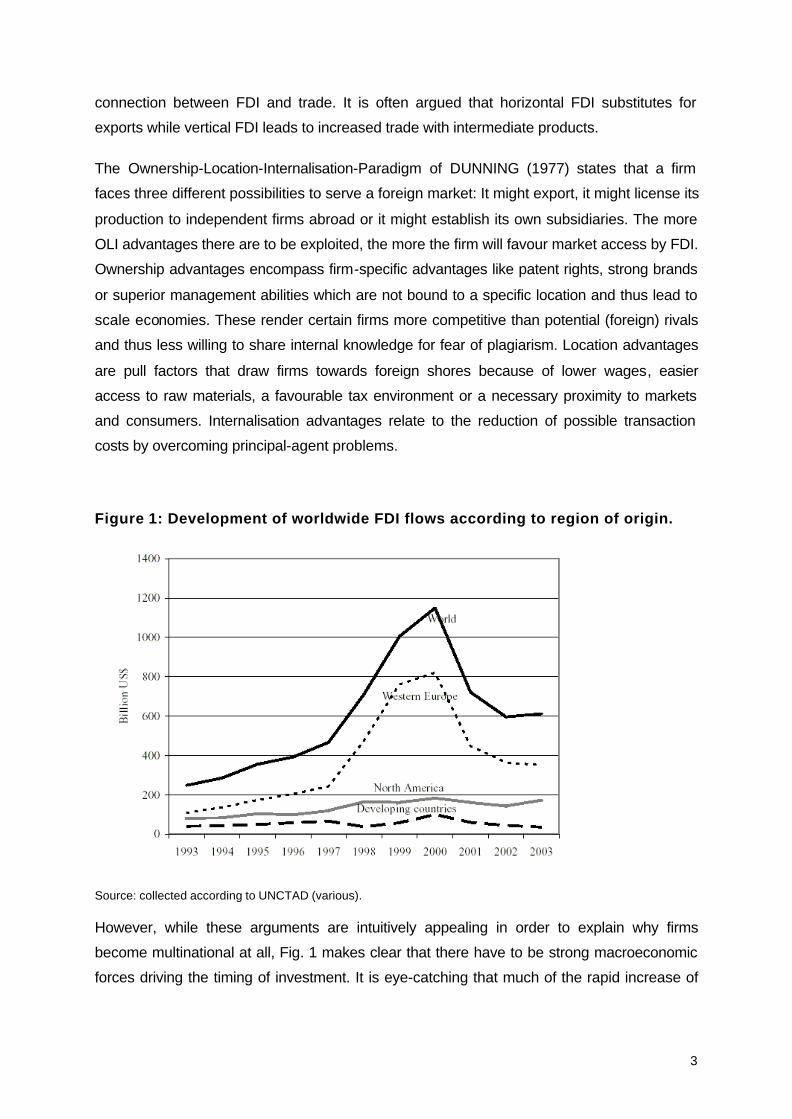
Figure 1: Development of worldwide FDI flows according to region of origin.
Source: collected according to UNCTAD (various).
However, while these arguments are intuitively appealing in order to explain why firms
become multinational at all, Fig. 1 makes clear that there have to be strong macroeconomic
forces driving the timing of investment. It is eye-catching that much of the rapid increase of

4
worldwide FDI in the second half of the 1990s can be attributed to an increase in FDI-activity
of European countries. While it is not unusual to relate the world-wide distribution of FDI
stocks or the magnitude of trade flows empirically to various country differences, most of
these studies are cross-sectional and do not account for changing influences over time; of
those that do, many are multi-period cross-section studies that raise methodological
problems of their own. The correct approach to combine cross-section and time-series
elements is to use panel data. This has been done, but mostly for US data or other single
countries as donor/recipient of FDI. In contrast, this study uses bilateral panel data for 22
OECD donor countries of FDI over the period 1991-2001 in order to answer the following
questions: Which factors led to the tremendous rise (and subsequent fall) of FDI over the
period 1991-2001? Was Europe “different” from the rest of the world? How were trade flows
affected over the same period? This study does not explicitly address the question if there
has been a direct trade-off between FDI and trade. However, it reverberates in the
discussion, where it is asked if and in how far common factors influenced FDI and exports
differently.
2 POSSIBLE MOTIVATIONS FOR NATIONAL FIRMS TO GO
MULTINATIONAL
The 1980 saw the development of several approaches to integrate the existence of
multinational companies into international trade theory, most importantly HELPMAN (1984),
HELPMAN/KRUGMAN (1985), and MARKUSEN (1984). Whereas HELPMAN and
HELPMAN/KRUGMAN focus on the development of vertical multinationals via factor-price
differences between countries, MARKUSEN is more interested in the rise of horizontal
multinationals due to trade costs. A key assumption in both models is that, in contrast to
national firms, potential multinationals are allowed to possess “headquarter services”
(roughly in the sense of DUNNING’s ownership advantages) that are modelled as fixed costs
and can be exploited through plants at home or abroad at no extra cost. This leads to
economies of scale, and thus an incentive to become multinational arises. Through the
1990s, MARKUSEN adapted and enlarged his basic model with various co-authors. In
particular, he tried to integrate the vertical HELPMAN/KRUGMAN approach into his model of
horizontal multinationals to create the “knowledge-capital” model. Its overall structure and
key findings are nicely summarised in MCCORRISTON (1999). Very condensed, the model
states that in a two-country world with a given level of trade costs (high enough to present a
barrier to entry), there will be exclusively horizontal, “market-searching” FDI as long as the
two countries are relatively similar in size (that is, GDP) and in relative endowments with

5
skilled and unskilled labour. As differences in factor endowments emerge, there are growing
incentives to undertake vertical FDI, culminating in a situation where headquarter services
are concentrated in the skilled-labour-abundant country and production taking place with
unskilled labour in the other. With equal factor endowments but a growing difference in
country size, the other corner solution appears: One market becomes so small that (with
economies of scale) production there becomes unattractive; instead, all headquarter services
and production are carried out in the large country, the small one being provided through
exports. Various mixed outcomes are possible.
It seems safe to say that the majority of observed FDI flows are caused not so much by
green-field investment but by mergers and acquisitions (UNCTAD 1997). KLEINERT (2000)
identifies three main factors for the merger waves of the 1980s and 1990s, that are
interdependent: general “globalisation”, deregulation and consolidation.
Deregulation of formerly state-controlled sectors in many western industrialised countries
was surely an import trigger for mergers and sector consolidation. State protection and
subsidies were reduced in obviously shrinking sectors like coal and steel in Europe or the US
military industry after the end of the cold war. On the other hand, deregulation as cutting of
entry-barriers lead to the appearance of new players and subsequent crowding out, for
example in telecommunications, finance and the airline carrier industry (KLEINERT 2000, pp.
48). Together with technical progress in computer industry and telecommunications (think of
mobile phones or the internet), deregulation in turn fostered globalisation, which in this
context stands for a general reduction of “distance costs” that encompass trade costs as well
as investment costs and costs for communication. Rather more vaguely, one could also
argue that globalisation led to a more acute perception of investment possibilities. It has
already been noted by KINDLEBERGER (1969) that firms tend to show a certain myopia with
regard to their geographical horizon.
Along with deregulation one might also name integration, since its manifestations in the
forming of the EU single market in 1993, its enlargement in 1994 and 2004 and the
introduction of a single currency should have facilitated intra-European investment
enormously. This is most likely an important explanation for the unprecedented rise of foreign
direct investment by EU countries for the years 1997-2001. However, it is not clear how to
integrate these effects into an empirical model apart from the use of dummy variables.
In addition, there is a possible connection between exchange rate fluctuations and FDI. This
argument was presented by FROOT/STEIN (1991), who observed that Japanese FDI into

6
the United States followed surprisingly close movements of the yen-dollar exchange rate in
the 1980s. They explained this with imperfect capital markets in which lenders with imperfect
information tend to charge premiums on credits. However, holders of the appreciating
currency experience wealth gains which allow them to finance more of an investment
internally instead of relying heavily on expensive credit markets.
BLONIGEN (1997) follows a different argumentation, proposing that foreign investors who
calculate in the appreciating currency are prepared to pose higher bids than national
competitors for a possible acquisition target, since the possible gains in form of new
intangible assets (ownership advantages) are independent of the exchange rate. As such,
the exchange rate might be a determinant not for the decision to invest itself but for the
timing of an acquisition (and thus contribute to a wavelike or cyclical pattern). BLONIGEN
also mentions a possible wealth effect along the lines of FROOT/STEIN in regard to stock
market developments where booms enrich participating companies as well. This is in line
with Tobin’s Q theory (based on TOBIN 1969) that suggests a firm should increase its capital
stock when its market value exceeds its book value. DE SANTIS et al. (2004) used this
approach in a recent paper to explain FDI for eight to nine European countries into the
United States, with Tobin’s Q proxied by fluctuations of European stock markets. They find a
significantly positive relationship between stock market developments and FDI into the
United States.
3 METHODOLOGY
As is well known, gravity equations are a very successful empirical tool to model trade flows
and, more recently, also activities of multinational companies, measured by flows or stocks of
FDI (e.g. EATON/TAMURA 1994, GRAHAM 1997, BRENTON et al. 1999,
EGGER/PAFFERMAYR 2004) or affiliate sales (BRAINARD 1997, CARR et al. 2001). The
gravity equation relates bilateral flows of goods or factors to country income (Y), population
(P) and country distance (D):
3 51 2 40ij i j i j ijX Y Y P P Dα αα α αα= .
Originating in the work of TINBERGEN (1962) and PÖYHÖNEN (1963), its somewhat
intuitive econometric specification has been put on a solid foundation on economic theory
especially by LINNEMANN (1966), ANDERSON (1979) and BERGSTRAND (1985,1989). A
useful outcome of these derivations is that the gravity equation can be thought of as a

7
reduced form equation incorporating supply and demand factors of two countries. HELPMAN
(1987) and CARR et al. (2001) use gravity equations to test implications derived from
general-equilibrium models concerning the volume of trade or affiliate sales, respectively.
Common results of the new trade literature are that, on the one hand, bilateral trade volume
between countries rises when total income rises and when country incomes converge (this
effect is due to monopolistic competition and consumer preferences). On the other hand, the
trade volume also rises when factor endowments diverge because of Heckscher-Ohlin-type
specialisation in production. Rising trade or distance costs should dampen trade.
In the presence of multinational companies, the Knowledge-Capital-approach expects
analogous results for FDI activity and affiliate sales. The exception is distance costs, since
these are expected to influence multinational activity in more than one way: some part of
high distance costs might be attributed to high investment costs that should negatively
influence FDI. Pure trade costs are supposed to positively influence horizontal direct
investment, substituting for trade. Vertical direct investment, however, is related to increased
trade with intermediate products. Thus, rising trade costs are expected to lower vertical FDI.
In practice, of course, it is hard to disentangle horizontal from vertical FDI. The significance
of variables controlling for relative factor endowments is often taken as an indicator for the
presence of vertical FDI.
Here, gravity equations are specified for bilateral exports and bilateral FDI flows. In order to
remain close to the knowledge-capital-framework, I follow CARR et al. (2001) by taking
gravity variables that account for the total market size of two countries, for differences in
country size and for differences in skilled labour abundance, indices for trade and investment
costs and country distance. In contrast to CARR et al (2001), however, I include a stock
market indicator, exchange rates and price indices in order to account for possible relative
wealth effects in line with FROOT/STEIN (1991), BLONIGEN (1997) and DE SANTIS et al.
(2004). Note that the stock market indicator is the only variable that has not yet been derived
formally out of a general-equilibrium framework: BERGSTRAND (1985, 1989) includes
exchange rates and price indices into an empirical specification of the gravity equation in
order to control for relative price effects. Thus, the specifications are as follows:
1 2 3 4 5 $
6 $ 7 8 9 10 11 12
13 14 15
ijt ijt ijt ijt it it
jt it jt it jt it jt
tit jt ij t ij ijt
FDI GDPSUM GDPDIFF AGRPOPDIFF STOCK EXCH
EXCH CPI CPI RISK RISK TREATY TREATY
FREE FREE DIST YD a u
β β β β β
β β β β β β β
β β β
= + + + +
+ + + + + +
+ + + ⋅ + +

8
1 2 3 4 5 $
6 $ 7 8 9 10 11 12
13 14 15
ijt ijt ijt ijt it it
jt it jt it jt it jt
tit jt ij t ij ijt
EX GDPSUM GDPDIFF AGRPOPDIFF STOCK EXCH
EXCH CPI CPI RISK RISK TREATY TREATY
FREE FREE DIST YD a u
β β β β β
β β β β β β β
β β β
= + + + +
+ + + + + +
+ + + ⋅ + +
Both, yearly bilateral FDI flows from country i to country j, FDIijt and yearly bilateral exports,
EXijt, are in 1995 US$ and are explained by the same set of variables. (In the following,
indices are omitted for convenience.) GDPSUM is the sum of both countries’ GDP,
controlling for total market size. The expected sign is positive for both, FDI and EX.
GDPDIFF is an indicator of relative country size in terms of GDP, measured as
( ) ( )2 21 i ij j ijGDP GDPSUM GDP GDPSUM− − .
It ranges from nearly 0 (high difference in country size) to 0.5 (both countries are of the
same size). The expected sign of GDPDIFF is positive since convergence in country size is
supposed to raise horizontal FDI and intra-industry trade. AGRPOPDIFF is supposed to
control for endowment differences in skilled labour; I take the difference in the agricultural
population’s share of total population as a proxy. The difference is expressed in absolute
terms in order to keep observations strictly nonnegative (see BLONIGEN et al. 2002). I
expect its sign to be positive in respect to FDI, since high endowment differences in skilled
labour should encourage vertical FDI. The expected sign in respect to EX is positive, too,
because differences in factor endowments should foster inter-industry trade. Since a rising
stock market indicator is supposed to raise the relative wealth of country i, STOCK is
supposed to influence FDI positively. There are no predictions for its influence on exports.
An appreciation of the reporting country’s currency relative to the partner country’s currency
is supposed to raise bilateral FDI because there is a relative wealth effect in favour of the
reporting country. The opposite is true for exports: An appreciation of the home country’s
currency makes traded products in the partner country more expensive, thereby lowering
import demand. However, many multinational enterprises can be supposed to calculate their
overseas transactions in US-Dollars. Positive wealth effects thus are arguably connected not
so much to appreciations of the reporting countries own currency but to appreciations of the
US-Dollar. Therefore, it is not the bilateral exchange rate that is used here but the exchange
rates of the reporting and partner country’s currency in respect to the US-Dollar, EXCH$. An
appreciation of a countries currency in respect to the US-Dollar is reflected in a decrease of
EXCH$. It is expected that an increase in either EXCH$i or EXCH$j raises FDI outflows from
country i to country j, while it lowers corresponding exports. EXCH$ enters the equation in

9
nominal terms. Instead of calculating the real exchange rate, consumer price indices for the
reporting and partner country are included as separate terms, CPI. This is done in order to
distinguish between external and internal price effects.
Variables controlling for the political environment, and thus, transport and investment costs,
follow. RISK is a country risk indicator for each country, ranging from 0-100. High values
indicate a low country risk. Therefore, its sign is expected to be positive. TREATY is the
number of bilateral investment treaties each country has signed in total with other countries.
It controls for investment liberalisation; its expected sign is positive for FDI and unspecified
for EX. FREE is an index of economic freedom. It ranges from 1.0 to 5.0; higher values
indicate less economic freedom. Thus, its expected sign is definitely negative for EX. As this
index comprises trade and investment costs, its influence on FDI is ambiguous.
At last, DIST is the great circle distance of country capitals. The significantly negative
influence of distance on trade (and more recently also FDI) has been reported in many cross-
section studies. However, a fixed-effects regression does not allow for estimation of
parameter coefficients. Parameters are absorbed into the fixed group effects. A random-
effects specification would allow for estimation of parameter coefficients but necessitates the
assumption that the group effects are not correlated with the explaining variables. A
Hausman-test indicates that random effects are not appropriate in our case. Thus, DIST is
interacted with t year dummy variables. This approach renders observable the changing
influence of DIST on the dependent variable over time (WOOLDRIDGE 2003, p. 428).
4 DATA AND RESULTS
In contrast to much prior research, which relied heavily on data for inward and/or outward
FDI of the United States and occasionally other single countries, data of 22 reporting OECD
countries is used in order to come to more universally applicable results. This is justified with
regard to the relative importance that FDI by EU-countries has gained in recent years.
Countries included in the dataset are listed in Table 1. It remains as a drawback that the
already vast bilateral OECD data base is for total bilateral FDI only. Industrial Sector
specification on a country-to-country basis cannot be accounted for - the very reason that
makes comparable US data so attractive. Nevertheless, although it would be appreciable to
account for sectoral differences between FDI flows, it is the general tendencies we are most
interested in here. These can also be accounted for in a strict macroeconomic approach.

10
Table 1: Countries included in the dataset
OECD countries reporting bilateral FDI outflows
Australia Austria Belgium-Luxembourg Canada Denmark Finland France Germany Iceland Italy Japan Korea Netherlands New Zealand Norway Poland Portugal Spain Sweden Switzerland United Kingdom United States
Destination countries All of the countries listed above, plus
Algeria Argentina Baltic Countries Brazil Bulgaria Chile China Colombia Costa Rica Czech Republic Egypt Greece Hong Kong Hungary India Indonesia Iran Ireland Israel Malaysia Mexico Morocco Panama Philippines Romania Russia Saudi Arabia Singapore Slovak Republic Slovenia South Africa Thailand Turkey Ukraine United Arab Emirates Venezuela
Source: OECD (2003).
For the empirical analysis, an unbalanced panel data set is created for the period 1991-2001.
FDI data for yearly bilateral outward FDI flows from OECD countries are obtained from the
OECD Foreign Direct Investment Statistics Yearbook (OECD 2003a) and trade data come
from the OECD Bilateral Trade Database (OECD 2003b). Stock market indices are from the
WORLD FEDERATION OF EXCHANGES (2004). Exchange rates are from the IMF
Financial Statistics Yearbook (IMF 2003). GDP based on purchasing power parity is from the
IMF World Economic Outlook Database (IMF 2004). The number of total bilateral investment
treaties is taken from UNCTAD (2005). As an indicator for economic freedom the Heritage
Index of Economic Freedom is employed (HERITAGE FOUNDATION 2004). Since this index
starts only in 1995, the 1995 values are inserted for the years 1991-1994. This is clearly a
second-best solution but the alternatives would have been either to lose these observations
or to omit the index. The ICRG country risk indicator is part of the World Development
Indicators Series published by the World Bank (WORLD BANK 2004). Consumer price
indices with base year 1995 are also from this source. Variables appearing in levels, as well
as the stock market indicator, are transformed into logs for estimation.
Results were obtained by fixed-effects estimation, as already mentioned above. This means
that the group effects are constructed as dummy variables. Fixed-effects estimates are less
efficient than random-effects estimates, where the group effects are treated as a random

11
disturbance. However, fixed group effects yield consistent estimates even when they are
correlated with explaining variables. This approach seems better suited for country data and
was also supported by a Hausman-test.
First, regressions are run over all available observations. The results appear in the columns
“All country pairs” of Table 2. Then, regressions are run separately for FDI/exports within the
EU-25 area of 2005 (columns “Intra-EU25 investment/trade”) and for all remaining
observations (“Other investment/trade”). Results are reported with fully robust standard
errors that correct for heteroskedasticity and additionally for possible autocorrelation within
panel groups.
Results for the FDI equations show that total market size is the dominating force driving FDI
for all groups of observations with coefficients well over 1 (implying in this case an elastic
relationship). Relative country size is significant but only when regressed over all country
pairs. It is not significant when EU25 observations or observations with Non-EU countries
involved are dropped. This implies that the variation between the EU25 area and the rest of
the world is crucial for establishing a relationship between relative country size and FDI.
Differences in human capital endowments as measured by differences in the share of the
agricultural population do not influence FDI flows significantly over time. This result supports
the notion that horizontal FDI is more common than vertical FDI; it is consistent with
BLONIGEN et al. (2002) who could not establish a relationship between skill differences and
FDI either. On the other hand, stock market developments are highly significant for all
country pairs and for investment that did not take place between EU25 countries.
US-dollar exchange rate fluctuations are highly significant in respect to the reporting
country’s currency as long as we do not focus exclusively on Intra-EU25 investment. An
appreciation of the US-Dollar in respect to the reporting countries currency raises FDI in the
partner country while changes of the exchange rate of the partner country have no effect.
This does not directly support a relative wealth hypothesis along the lines of FROOT and
STEIN but suggests that (US-Dollar based) foreign direct investment becomes more
attractive the more there is to lose by doing business in one’s domestic currency. Within the
EU25 area, the US-dollar exchange rate of the reporting country’s currency has no significant
effect on direct investment. The partner country’s exchange rate, however, does have a
significant effect if only at the 10% level. Here, a negative sign implies that a depreciation of
the dollar in respect to the partner country’s currency raises FDI.

12
Inflation in the reporting country has a significantly negative influence on FDI if investment
within the EU25 area is left out. On the other hand, inflation in the partner country has a
significantly positive influence on FDI flows for all country groups.
Rather disappointingly, most of the variables controlling for political influences are not
significant. These variables show relatively little variation over time; differences of these
variables between countries rather likely do influence FDI but in this case they are accounted
for by the fixed country effects. However, an increase in the number of bilateral investment
treaties of the reporting country raises significantly FDI that does not take place between
EU25 countries. Within the EU25 area, changes in the number of investment treaties do not
influence FDI, which might be due to the irrelevance of third-country treaties in regard to
Intra-EU investment. (However, if standard errors need not account for possible
autocorrelation, the coefficient of TREATIESj becomes significantly positive; this result is not
reported in Table 2. A possible explanation is that bilateral investment treaties CEEC
countries established before their EU-accession raised EU-FDI into the future member
states.) Thus, overall, investment liberalisation has influenced FDI positively over the
nineties.
The influence of distance tended to become more negative over the same period. The
interaction terms are highly significant for all country pairs and moderately to highly
significant for Intra-EU25 investment; for other investment, however, they are only significant
for 2001. Therefore, as in the case of relative country size, variation between the EU25 area
and the rest of the world is important in order to measure a significant influence. BUCH et al.
(2004) stress that the coefficient of the distance variable does not measure distance costs
per se. A negative sign should rather be interpreted as a tendency to keep closer economic
relations to neighbouring countries than to countries far away. Thus, our results state a
tendency over the nineties to conduct relatively less FDI in distant countries. This effect is
highly significant when Intra-EU25 investment is included in the sample. Therefore, there has
taken place a concentration of FDI-activity in the EU25 area in contrast to the rest of the
world. On the other hand, significantly negative distance coefficients within the EU25 area for
the year 1993-1998 indicate a concentration of investment flows in the EU15 area. After
accession talks with potential new member states became relevant, EU investment began to
flow east, rendering the negative distance terms within the EU25 area insignificant.
Comparing these results with those for the export equations (the right side of Table 2), we
can see that market size is also highly significant for explaining exports for all country
groups, as is relative country size. The difference in the share of agricultural population is

13
significant only for trade flows within the EU25 area. This is most likely due to increased
exports to Central and Eastern Europe.
Stock market developments do not influence exports. This indicates one important diversion
from the results for FDI. However, also the influence of exchange rates differs: As expected,
appreciations of the US-Dollar in respect to the partner country’s currency reduce exports to
the partner country. However, exchange rate changes of the reporting country’s currency are
only significant for observations within the EU25 area. Here, a depreciation of the reporting
country’s currency in respect to the Dollar significantly raises exports, while such changes do
not influence overall observations and observations for “other trade”. Overall, these results
imply that in respect to exchange rate fluctuations, exports are influenced more heavily by
demand factors of the partner country while FDI is driven by supply factors of the reporting
country. As in the case of FDI, an increase in the price level of the partner country raises
exports. Price increases in the reporting country lower exports significantly in all country
groups.
Low country risk of the partner country is significant except for Intra-EU25 trade. Bilateral
investment treaties have no effect on exports for trade not between EU25-countries and for
all country pairs. Interestingly, however, TREATIES is significantly negative for Intra-EU25
trade with respect to the reporting and the partner country. This might be an indication for a
substitution effect between investment and trade between countries of the EU25 area. Rising
economic freedom in the partner country is significantly associated with rising exports to that
country except for Intra-EU25 trade.
The yearly distance variables are negative and highly significant for nearly all years when
estimated for all country pairs or without EU25 observations. However, for Intra-Eu25 trade
they are significantly positive for the period 1995-2000. Thus, while there has been a
worldwide tendency to trade more with less distant countries, within the EU25 area, this trend
was reversed and relatively more trade has been directed to the periphery.

Table 2: Fixed-effects panel estimation for bilateral FDI flows and exports 1991-2001
Regression with fully robust standard errors Dependent variable: bilateral FDI outflows Dependent variable: bilateral exports
All country pairs Intra-EU25 investment Other investment All country pairs Intra-EU25 trade Other trade
Coef. SE Coef. SE Coef. SE Coef. SE Coef. SE Coef. SE GDPSUM 3.360 *** 0.595 5.174 *** 1.563 2.476 *** 0.705 1.802 *** 0.228 0.598 * 0.334 1.724 *** 0.286 GDPDIFF 5.941 *** 2.192 9.764 6.639 3.354 2.493 3.589 *** 0.823 2.808 ** 1.164 3.468 *** 0.985 AGRDIFF 3.398 3.668 5.081 10.952 2.862 3.981 0.529 0.988 5.711 ** 2.258 -0.115 1.094 STOCKi 0.424 *** 0.082 0.215 0.181 0.480 *** 0.090 0.007 0.021 -0.021 0.031 -0.001 0.028 EXCH$i 0.837 *** 0.266 0.869 0.573 0.910 *** 0.299 0.073 0.059 0.202 ** 0.094 0.064 0.074
EXCH$j -0.011 0.084 -0.962 * 0.532 0.005 0.085 -0.070 *** 0.026 -0.436 *** 0.113 -0.069 *** 0.026 CPIi -2.157 *** 0.682 -0.355 0.851 -3.549 *** 0.771 -0.535 *** 0.138 -0.543 *** 0.140 -0.517 ** 0.213 CPIj 0.190 *** 0.050 1.085 ** 0.513 0.163 *** 0.051 0.130 *** 0.018 0.896 *** 0.109 0.123 *** 0.019 RISKi -0.009 0.009 -0.009 0.019 -0.004 0.010 0.003 0.002 0.003 0.002 0.003 0.002 RISKj 0.004 0.006 0.011 0.013 0.010 0.007 0.011 *** 0.002 0.001 0.002 0.012 *** 0.002 FREEDOMi 0.062 0.269 0.410 0.399 0.075 0.352 -0.045 0.053 0.064 0.063 -0.069 0.077 FREEDOMj -0.127 0.175 0.312 0.296 -0.303 0.211 -0.219 *** 0.047 0.004 0.058 -0.249 *** 0.064 TREATIESi 0.010 *** 0.004 -0.006 0.008 0.016 *** 0.004 0.001 0.001 -0.003 ** 0.001 0.001 0.001 TREATIESj 0.001 0.003 0.011 0.008 0.000 0.004 0.000 0.001 -0.005 *** 0.001 0.000 0.001 DIST*1992 0.000 0.010 -0.018 0.022 0.005 0.011 -0.004 * 0.002 0.002 0.003 -0.004 0.003 DIST*1993 -0.037 *** 0.012 -0.059 ** 0.029 -0.018 0.014 -0.016 *** 0.003 -0.010 * 0.005 -0.012 *** 0.003 DIST*1994 -0.028 * 0.014 -0.096 ** 0.043 0.000 0.016 -0.020 *** 0.004 0.004 0.008 -0.016 *** 0.005 DIST*1995 -0.033 * 0.019 -0.116 ** 0.057 0.000 0.021 -0.012 ** 0.005 0.030 *** 0.011 -0.010 0.007 DIST*1996 -0.046 ** 0.022 -0.162 ** 0.068 -0.006 0.026 -0.023 *** 0.006 0.034 ** 0.014 -0.021 *** 0.008 DIST*1997 -0.074 *** 0.025 -0.178 ** 0.082 -0.025 0.028 -0.029 *** 0.008 0.041 ** 0.018 -0.024 ** 0.010 DIST*1998 -0.065 ** 0.027 -0.162 * 0.095 -0.017 0.031 -0.039 *** 0.009 0.049 ** 0.021 -0.036 *** 0.010 DIST*1999 -0.091 *** 0.030 -0.165 0.108 -0.046 0.034 -0.052 *** 0.010 0.052 ** 0.024 -0.050 *** 0.012 DIST*2000 -0.101 *** 0.034 -0.149 0.121 -0.057 0.038 -0.061 *** 0.011 0.050 * 0.026 -0.056 *** 0.013 DIST*2001 -0.142 *** 0.036 -0.208 0.131 -0.089 ** 0.041 -0.073 *** 0.012 0.054 * 0.029 -0.068 *** 0.015 _CONS -
16.249 *** 5.122 -39.445 *** 9.380 -4.761 6.148 -7.620 *** 2.162 -1.463 2.181 -7.298 ** 2.851
N 6219 1833 4386 6219 1833 4386 Groups 1002 265 737 1002 265 737 F-Test F(23, 5193) F(23, 1544) F(23, 3625) F(23, 5193) F(23, 1544) F(23, 3625) 24.60 11.51 18.35 40.63 29.61 26.78 R2 (within) 0.17 0.22 0.18 0.33 0.68 0.28 R² (incl.FE,adj.) 0.80 0.80 0.80 0.98 0.99 0.98 Root MSE 1.12 1.10 1.11 0.23 0.13 0.26 ***, **, * = significant at 1%-, 5%-, 10%-level.

15
5 CONCLUSION
This paper tried to illuminate the factors that led to the dramatic increase in worldwide foreign
direct investment from 1991-2001 and the question if these factors influenced exports
differently over the same period. Gravity equations for bilateral FDI and exports were
estimated for a panel data set of OECD countries as reporting countries, with explaining
variables adopted from the new trade theory and the knowledge-capital approach of
multinational enterprises. The results show that an increase in total market size and
convergence in relative country size are main factors that promote both, FDI and exports.
Changing differences in skilled labour-endowments as measured by absolute differences in
shares of agricultural population, on the other hand, have no significant effect on either FDI or
exports.
There could be distinguished, however, factors that do not affect FDI and exports in the same
manner. Stock market booms seem to increase outward FDI if it does not take place between
countries of the EU25 group while exports are generally not influenced by stock market
variations. On the other hand, assessment changes in political risk or economic freedom of a
country have marked effects on exports while they leave outward FDI more or less
unchanged. This result may be due to the fact that import demand is reduced in countries that
are relatively unstable politically or equipped with high trade barriers, while FDI might be more
affected by push factors regarding ownership advantages of multinational firms. For the latter
could not explicitly be controlled for with the applied dataset. However, investment
liberalisation very significantly encouraged FDI while some evidence suggests that it might
have reduced exports within the EU25 area.
Exchange rate fluctuations of reporting and partner countries currencies in respect to the US-
dollar do influence FDI and exports, but differently. In the case of FDI, appreciations of the
dollar in respect to the reporting country’s currency raise outward FDI while exports are raised
by a dollar depreciation in respect to the partner country’s currency. This is further evidence
that FDI is directed more by supply factors of the reporting country while exports respond to
demand in the partner country.
Price increases in the partner country raise FDI and exports in all country groups while price
increases in the reporting country lower exports significantly. They lower FDI that does not
take place between EU-countries, too.

16
The effect of distance over time was negative for both, FDI and exports, when all available
country groups were taken into account. Thus, there has been a tendency of OECD countries
to boost economic integration with neighbouring economies rather than with countries far
away. Within the EU25 area, this trend was reversed for exports, indicating growing trade with
peripheral countries. This evidence can be brought forward in respect to the opinion that the
globalisation phenomenon is rather an ongoing regionalisation.
In sum, the results support general theories of horizontal foreign direct investment and should
encourage further research in the area, especially with regard to sector-specific effects which
could not be controlled for here. Better proxy variables for factor endowment differences than
differences in agricultural population might be employed in order to reveal vertical FDI.
6 REFERENCES
ANDERSON, J. E. (1979). "A theoretical foundation for the gravity equation." American Economic Review 69(2): 106-116.
BERGSTRAND, J. H. (1985). "The gravity equation in international trade: some microeconomic foundations and empirical evidence." Review of Economics and Statistics 67: 474-481.
BERGSTRAND, J. H. (1989). "The generalized gravity equation, monopolistic competition, and factor proportions theory in international trade." Review of Economics and Statistics 71: 143-153.
BLONIGEN, B.A. (1997): Firm-specific Assets and the Link Between Exchange Rates and Foreign Direct Investment. American Economic Review, 87(3), 447-465.
BLONIGEN, B. A., R. B. DAVIES, et al. (2002). Estimating the Knowledge-Capital model of the multinational enterprise: comment. Cambridge, MA, National Bureau of Economic Research.
BRAINARD, S.L. (1997): An Empirical Assessment of the Proximity-Concentration Trade-off Between Sales and Trade. American Economic Review, 87(4), 520-544.
BRENTON, P., F. d. MAURO, and W. LÜCKE (1999): "Economic Integration and FDI: An Empirical Analysis of Foreign investment in the EU and in Central and Eastern Europe." Empirica 26: 95-121.
BUCH, C., J. KLEINERT and F. TOUBAL (2004). "The distance puzzle: on the interpretation of the distance coefficient in gravity equations." Economics Letters 83: 293-298.
CARR, D., J.R. MARKUSEN, and K.E. MASKUS (2001): Estimating the Knowledge-Capital Model of the Multinational Enterprise. American Economic Review, 91 (3), 693-708.
CAVES, R.E. (1971): International Corporations: The Industrial Economics of Foreign Investment. Economica, 38, 1-27.

17
DE SANTIS, R.A., R. ANDERTON, and A. HIJZEN (2004): On the determinants of euro area FDI to the United States: The Knowledge-Capital-Tobin’s Q framework. European Central Bank Working Paper Series No. 329. Frankfurt.
DUNNING, J.H. (1977): Trade, Location of Economic Activity and the MNE: A Search for an Eclectic Approach. In: OHLIN, B., HESSELBORN, P.O. and P.M. WIJKMAN (eds.), The International Allocation of Economic Activity. London: Macmillan.
EATON, J. and A. TAMURA (1994): "Bilateralism and regionalism in Japanese and U.S. trade and direct foreign investment patterns." Journal of the Japanese and International Economies 8: 478-510.
EGGER, P. and M. PFAFFERMAYR (2004). "Distance, Trade and FDI: A Hausman-Taylor SUR Approach." Journal of Applied Econometrics 19: 227-246.
FROOT, K. and J. STEIN (1991): Exchange Rates and Foreign Direct Investment: An Imperfect Capital Markets Approach. Quarterly Journal of Economics, 106, 1191-1271.
GRAHAM, E. M. (1997). US direct investment abroad and US exports in the manufacturing sector: some empirical results based on cross-sectional analysis. Multinational Firms and International Relocation. P. J. Buckley and J.-L. Mucchielli. Cheltenham, Elgar: 90-102.
HELPMAN, E. (1984): A Simple Theory of Trade with Multinational Corporations. Journal of Political Economy, 92, 451-471.
HELPMAN, E. (1987): "Imperfect competition and international trade: evidence from fourteen industrial countries." Journal of the Japanese and International Economies 1: 62-81.
HELPMAN, E. and P.R. KRUGMAN (1985): Market Structure and Foreign Trade. Cambridge, MA: MIT Press.
HERITAGE FOUNDATION (2005): Heritage Index of Economic Freedom Database. Online at http://www.heritage.org/research/features/index/downloads/PastScores.xls. (Link verified 27 January 2005.)
HYMER, S. (1976): The International Operations of National Firms: A Study of Direct Foreign Investment. Cambridge, MA: MIT Press.
IMF (2003): Financial Statistics Yearbook. Washington, DC.
IMF (2004): World Economic Outlook Database, September. Online at http://www.imf.org/external/pubs/ft/weo/2004/02/data/index.htm. (Link verified 27 January 2005.)
KINDLEBERGER, C.P. (1969): American Business Abroad. New Haven: Yale University Press.
KLEINERT, J. (2000): Megafusionen – Trends, Ursachen, Implikationen. Tübingen: Mohr Siebeck.
LINNEMANN, H. (1966). An econometric study of international trade flows. Amsterdam, North-Holland.

18
MARKUSEN, J.R. (1984): Multinationals, Multi-Plant Economies and the Gains from Trade. Journal of International Economics, 16, 205-226.
MCCORRISTON, S. (1999): Foreign Direct Investment and Trade – Future Directions for Research. Paper presented to the IATRC, New Orleans.
OECD (2003a): Foreign Direct Investment Statistics Yearbook. Paris.
OECD (2003b): OECD Bilateral Trade Database, in: STAN Structural Analysis Databases, 2003 Edition (CD-ROM Windows). Paris.
PÖYHÖNEN, P. (1963). "A tentative model for the volume of trade between countries." Weltwirtschaftliches Archiv 90(1): 93-99.
TINBERGEN, J. (1962). Shaping the world economy - suggestions for an international economic policy. New York, The Twentieth Century Fund.
TOBIN, J. (1969): A General Equilibrium Approach to Monetary Theory. Journal of Money, Credit and Banking, 1, 15-29.
UNCTAD (various): World Investment Report. Geneva.
WOOLDRIDGE, J. M. (2003). Introductory Econometrics. A Modern Approach. Mason (OH), South-Western.
WORLD FEDERATION OF EXCHANGES (2004): Stock market indices. Online at http://www.world-exchanges.org/WFE/home.asp?action=document&menu= 10&nav=ie. (Link verified 27 January 2005.)
WORLDBANK (2004): World Investment Indicators Database. Online at http://publications.worldbank.org/WDI/. (Link verified 27 January 2005.)

19
Bisherige Veröffentlichungen in dieser Reihe:
No. 1 HERRMANN, R., KRAMB, M. C., MÖNNICH, Ch. (12.2000): Tariff Rate Quotas and the Economic Impacts of Agricultural Trade Liberalization in the WTO. (etwas revidierte Fassung erschienen in: "International Advances in Economic Research", Vol. 7 (2001), Nr. 1, S. 1-19.)
No. 2 BOHNET, A., SCHRATZENSTALLER, M. (01.2001): Der Einfluss der Globalisierung auf staatliche Handlungsspielräume und die Zielverwirklichungsmöglichkeiten gesellschaftlicher Gruppen. (erschienen in: "List-Forum für Wirtschafts - und Finanzpolitik", Bd. 27(2001), H. 1, S. 1-21.)
No. 3 KRAMB , M. C. (03.2001): Die Entscheidungen des "Dispute Settlement"-Verfahrens der WTO im Hormonstreit zwischen der EU und den USA – Implikationen für den zukünftigen Umgang mit dem SPS-Abkommen. (überarbeitete Fassung erschienen in: "Agrarwirtschaft", Jg. 50, H. 3, S. 153-157.)
No. 4 CHEN, J., GEMMER, M., TONG, J., KING, L., METZLER, M. (08.2001): Visualisation of Historical Flood and Drought Information (1100-1940) for the Middle Reaches of the Yangtze River Valley, P.R. China. (erschienen in: Wu et al. (eds) Flood Defence '2002, Beijing, New York 2002, pp. 802-808.)
No. 5 SCHROETER, Ch. (11.2001): Consumer Attitudes towards Food Safety Risks Associated with Meat Processing. (geänderte und gekürzte Fassung ist erschienen unter Christiane SCHROETER, Karen P. PENNER, John A. FOX unter dem Titel "Consumer Perceptions of Three Food Safety Interventions Related to Meat Processing" in "Dairy, Food and Environmental Sanitation", Vol. 21, No. 7, S. 570-581.)
No. 6 MÖNNICH, Ch. (12.2001): Zollkontingente im Agrarsektor: Wie viel Liberalisie-rungsfortschritt? Ergebnisse und Diskussion einer Auswertung der EU-Daten. (gekürzte Fassung erschienen in BROCKMEIER, M., ISERMEYER, F., von CRAMON-TAUBADEL, S. (Hrsg.), Liberalisierung des Weltagrarhandels - Strategien und Konsequenzen. "Schriften der Gesellschaft für Wirtschafts- und Sozialwissenschaften des Landbaues e.V.", Bd. 37(2002), S. 51-59.)
No. 7 RUBIOLO, M. (01.2002): EU and Latin America: Biregionalism in a Globalizing World?
No. 8 GAST, M. (02.2002): Zollkontingente bei US-amerikanischen Käseimporten. (gekürzte Fassung erschienen in: "Agrarwirtschaft", Jg. 51, H. 4, S. 192-202.)
No. 9 BISCHOFF, I. (08.2002): Efficiency-enhancing Effects of Private and Collective Enterprises in Transitional China.
No. 10 KÖTSCHAU, K. M., PAWLOWSKI, I., SCHMITZ, P. M. (01.2003): Die Policy Analysis Matrix (PAM) als Instrument zur Messung von Wettbewerbsfähigkeit und Politikeinfluss - Zwischen Theorie und Praxis: Das Fallbeispiel einer ukrainischen Molkerei.
20
No. 11 HERRMANN, R., MÖSER A. (06.2003): Price Variability or Rigidity in the Food-retailing Sector? Theoretical Analysis and Evidence from German Scanner Data.
No. 12 TROUCHINE, A. (07.2003): Trinkwasserversorgung und Armut in Kasachstan: Aktueller Zustand und Wechselwirkungen.
No. 13 WANG, R.; GIESE, E.; GAO, Q. (08.2003): Seespiegelschwankungen des Bosten-Sees (VR China).
No. 14 BECKER, S.; GEMMER, M.; JIANG, T.; KE, CH.. (08.2003): 20th Century Precipitation Trends in the Yangtze River Catchment.
No. 15 GEMMER, M.; BECKER, S.; JIANG, T (11. 2003): Detection and Visualisation of Climate Trends in China.
No. 16 MÖNNICH, Ch. (12.2003): Tariff Rate Quotas: Does Administration Matter?
No. 17 GIESE, E.; MOßIG. I. (03.2004) Klimawandel in Zentralasien
No. 18 GIESE, E.; SEHRING, J. TROUCHINE, A. (05.2004) Zwischenstaatliche Wassernutzungskonflikte in Zentralasien
No. 19 DIKICH, A. N. (09.2004) Gletscherwasserressourcen der Issyk-Kul-Region (Kirgistan), ihr gegenwärtiger und zukünftiger Zustand
No. 20 CHRISTIANSEN, TH.; SCHÖNER, U. (11.2004) Irrigation Areas and Irrigation Water Consumption in the Upper Ili Catchment, NW-China
No. 21 NARIMANIDZE, E. et al. (04.2005) Bergbaubedingte Schwermetallbelastungen von Böden und Nutzpflanzen in einem Bewässerungsgebiet südlich von Tiflis/Georgien - Ausmaß, ökologische Bedeutung, Sanierungsstrategien
No. 22 ROMANOVSKIJ, V.V.; KUZ’MICENOK, V.A. (06.2005) Ursachen und Auswirkungen der Seespiegelschwankungen des Issyk-Kul’ in jüngerer Zeit
No. 23 ZITZMANN, K.; TROUCHINE, A. (07.2005) Die Landwirtschaft Zentralasiens im Transformationsprozess

21
No. 24 SEHRING, J. (08.2005) Water User Associations (WUAs) in Kyrgyzstan - A Case Study on Institutional Reform in Local Irrigation Management
No. 25 GIESE, E., MAMATKANOV, D. M. und WANG, R. (08.2005) Wasserressourcen und Wassernutzung im Flussbecken des Tarim (Autonome Region Xinjiang / VR China)
No. 26 MOSSIG, I., RYBSKY, D. (08.2005) Die Erwärmung bodennaher Luftschichten in Zentralasien. Zur Problematik der Bestimmung von Trends und Langzeitkorrelationen
No. 27 GAST, M.: Determinants of Foreign Direct Investment of OECD Countries 1991-2001
Stand: 20. September 2005
Die Diskussionsbeiträge können im Internet unter:
http://www.uni-giessen.de/zeu/Publikation.html eingesehen werden.