Embed Size (px)
Citation preview
Ž .Chemical Physics 239 1998 437–445
ZEKE electron spectroscopy of azulene and azulene–argon
D. Tanaka 1, S. Sato 2, K. Kimura ) ,3
School of Materials Science, Japan AdÕanced Institute of Science and Technology, Tatsunokuchi 923-1212, Japan
Received 15 June 1998
Abstract
Ž .Mass-selected ion-current spectra and zero-kinetic-energy ZEKE electron spectra were obtained for azulene and its vanŽ . Ž X.der Waals vdW complex with Ar in supersonic jets by two-photon 1q1 resonant ionization through the second singlet
Ž .electronic excited states S . Ab initio calculations were also carried out to study the optimized geometries and vibrational2Ž . Ž .modes for azulene in the neutral and cation ground states S and D . Lennard-Jones LJ potential energy calculations2 0
including ‘charge–charge-induced-dipole interactions’ were also made for azulene–Ar. The main results may be summarizedŽ . Ž . y1 Žas follows. 1 The adiabatic ionization energies have been determined as: I azulene s59781"5 cm and I azulene–a a
. y1 y1 Ž . Ž .qAr s59708"5 cm . The difference in I is 73 cm . 2 Several vibrational frequencies of azulene have beenaŽ .observed and identified on the basis of ab initio theoretical calculations. 3 A vibrational progression with a spacing of 9–10
cmy1 in the ZEKE spectra of azulene–Ar, has been assigned experimentally and theoretically to the vdW bending vibrationq1 Ž .b along the long axis of azulene. 4 From the calculated LJ potential energy minima, it has been found that Ar is shiftedx
˚ Ž .by 0.10 A along the long axis of azulene from the position in the neutral electronic ground state. 5 The observed vdWvibrational progressions have been reproduced by Franck–Condon calculations, suggesting that Ar is shifted by 28 forŽ .qazulene–Ar with respect to their neutral S state. q 1998 Elsevier Science B.V. All rights reserved.2
1. Introduction
Azulene consisting of five- and seven-memberedcarbon rings is an isomer of naphthalene. The azu-lene molecule has the very unique character that thevertical ionization energy is unusually low compared
w xwith naphthalene 1 , and the second electronic ex-Ž .cited state S is responsible for fluorescence with a2
) Corresponding author. E-mail: [email protected] Present address: Copyer, 3-6-4 Technoport, Ishibashi-cho,
Fukui 910-3138, Japan.2 Present address: Institute for Molecular Science, Okazaki
444-8585, Japan.3 Present address: Emeritus Professor, Institute for Molecular
Science, Okazaki 444-8585, Japan.
w xlifetime of 1.4 ns 2 . Jet-cooled azulene has firstw xbeen studied in detail by Fujii et al. 3 by using
fluorescence excitation spectra and dispersed fluores-cence spectra of S and some higher electronic2
states.Ž X . Ž .Two-color 1q1 ZEKE zero kinetic energy
electron spectroscopy is a powerful method of study-w xing molecular cations in very high resolution 4 .
Namely, the molecule to be studied is first excited toa specific resonant excited state by the first laser andfurther excited to produce ZEKE electrons by thesecond laser. In this laboratory, we have been usinga compact high-brightness high-resolution ZEKEelectron detector with two pulsed electric fields sepa-
w xrated with some delay time 5 , one of which is to
0301-0104r98r$ - see front matter q 1998 Elsevier Science B.V. All rights reserved.Ž .PII: S0301-0104 98 00312-7
( )D. Tanaka et al.rChemical Physics 239 1998 437–445438
remove kinetic photoelectrons and the other is tocollect ZEKE electrons associated with veryhigh-lying Rydberg states.
So far no ZEKE electron studies have been re-ported for jet-cooled azulene. In the present work weconsidered it important to study azulene by ZEKEelectron spectroscopy to determine its adiabatic ion-ization energy as well as many low-frequency cationvibrational levels. For azulene in the neutral groundstate, all the vibrational frequencies have been ob-
w xserved and assigned by Chao and Khanna 6 in theirstudy of IR and Raman spectroscopy.
It is also interesting to study the cation of theŽ .azulene–Ar van der Waals vdW complex by the
ZEKE electron technique in a supersonic jet. Previ-ously, the vdW complexes of naphthalene and an-thracene with argon atoms in jets have been studied
w xby ZEKE electron spectra 7,8 . In naphthalene–Ar ithas been indicated that Ar is located over the centerof mass of the naphthalene molecule. In this studywe report the ZEKE spectra of azulene and theazulene–Ar vdW complex for the first time. Thestable structure and vdW vibrational modes are dis-cussed on the basis of Lennard-Jones potential calcu-lations in which we included charge-induced dipoleinteractions in the present work.
2. Experimental
The apparatus used in the present work is essen-w xtially the same as that described previously 5 . The
sample of azulene was heated in Ar at 758C to obtainsufficient vapor pressure, and expanded into the
Ž .chamber through the pulsed nozzle General Valveat a typical stagnation pressure between 1.0 and 1.5atm. The background pressure in the chamber waskept at 2=10y5 Torr during the experiments. In thepresent two-color experiments, we used two kinds of
Žfrequency-doubled outputs of dye lasers LDS698.and DCM pumped by a nanosecond Nd:YAG pulsed
Ž .laser 10 Hz . Azulene was purchased from Aldrich,and used without further purification.
Ž .The second excited states S of azulene and2
azulene–Ar were chosen as intermediate resonantstates, since very fast internal conversion occurs atthe S state. Prior to ZEKE electron measurements,1
Ž X.two-color 1q1 mass-selected ion-current spectra
of azulene and azulene–Ar were measured to obtaininformation about the S origin as well as about2
several low-frequency S vibrational levels. Mea-2
surements of ZEKE electrons were carried out with aw xtwo-pulsed-field ionization technique 5 : Namely, a
Žpositive pulsed electric field F sq0.7 Vrcm; 2001.ns duration was applied at 50 ns after each laser
shot to remove photoelectrons with kinetic energiesŽshallow Rydberg states are also removed at the
.same time , and then shortly after the first pulse aŽnegative pulsed field F sy1.0 Vrcm; 700 ns2
.duration was applied to collect ZEKE electronsfrom the deeper Rydberg states. The ZEKE electronswere detected by an electron multiplier.
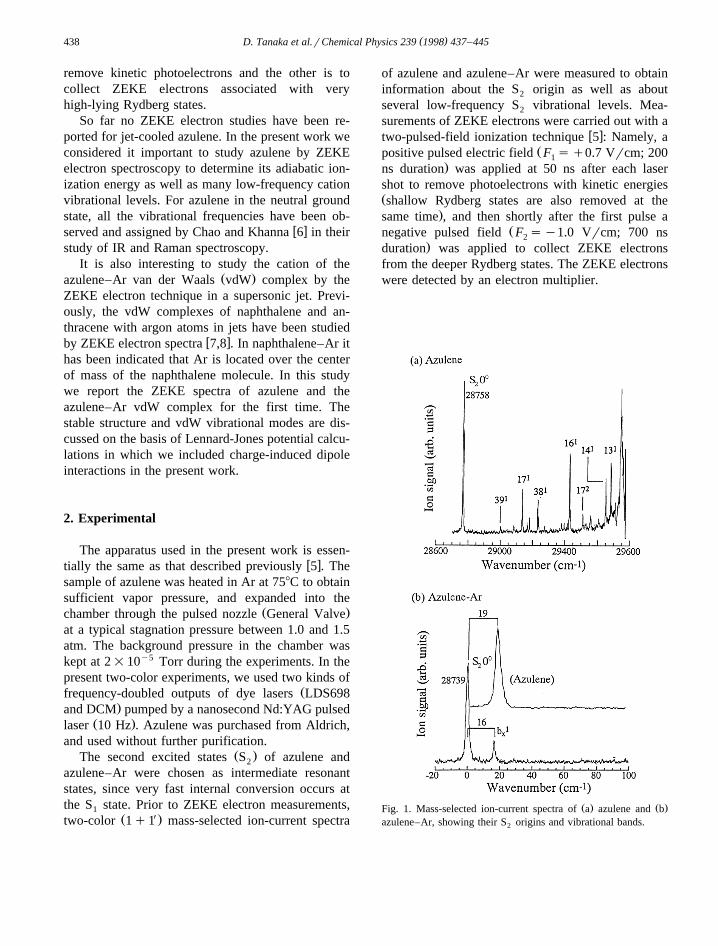
Ž . Ž .Fig. 1. Mass-selected ion-current spectra of a azulene and bazulene–Ar, showing their S origins and vibrational bands.2

( )D. Tanaka et al.rChemical Physics 239 1998 437–445 439
3. Results and discussion
3.1. Mass-selected ion-current spectra of azuleneand azulene–Ar
Ž X.A two-color 1q1 ion-current spectrum ob-tained for bare azulene in the region up to 900 cmy1
is shown in Fig. 1a, indicating the first peak due toŽ 0 . y1the S origin 0 , a at 28758"2 cm as well as2 1
several vibrational peaks. This spectrum is very simi-lar to an LIF spectrum reported previously by Fujii
w xet al. 3 . The several peaks observed at the vibra-tional frequencies of 239, 373, 468, 661, 746, 886and 918 cmy1 in Fig. 1a may be assigned to the
1 Ž . 1 Ž . 1following vibrational levels 39 b , 17 a , 380 1 0 1 0Ž . 1 Ž . 2 Ž . 1 Ž . 1 Ž .b , 16 a , 17 a , 14 a and 13 a ,1 0 1 0 1 0 1 0 1
respectively, on the basis of the study of Fujii et al.w x3 . In the LIF study it is reported that the transition
1 Ž . y137 b is fairly strongly observed at 666 cm .0 1
However, this transition is very weak in the ion-cur-Žrent spectrum although detectable, but not clearly.shown in Fig. 1 . The appearance of the b bands1
Ž .modes 38, 39 should be due to some vibronicŽ1 .couplings with S B .3 1
A mass-selected ion-current spectrum observedfor azulene–Ar in the region below 100 cmy1 isshown in Fig. 1b, indicating that the S origin of2
azulene–Ar is located at 28739 cmy1, which isshifted by y19 cmy1 from that of bare azulene. Sofar no ion-current spectra nor LIF spectra have beenpublished for azulene–Ar. Another weak peak ap-pears at 16 cmy1 in Fig. 1b. Two possible candi-dates may be considered for this weak peak ofazulene–Ar. Namely, one is a structure isomer, andthe other is a vdW vibration. As mentioned later, the16 cmy1 peak may be assigned to the vdW vibra-tional mode b .x
3.2. ZEKE electron spectra due to the azulene andazulene–Ar cations
A ZEKE spectrum of bare azulene, obtained byŽ X.two-color 1q1 resonant ionization via the S2
origin, is shown in the region below 1700 cmy1 inFig. 2a, indicating that the first peak due to the
Ž q0 . y1cation D origin 0 appears at 59781 cm and0
many vibrational peaks are also observed. The vibra-tional assignments shown in Fig. 2a were deducedexperimentally from our further ZEKE electron mea-
Ž . Ž .Fig. 2. a ZEKE electron spectrum of azulene, obtained via the S origin. b ZEKE electron spectrum of azulene–Ar, obtained via the S2 2Ž . 1 y1origin. c ZEKE electron spectrum of azulene–Ar, obtained via the S b level at 16 cm .2 x
( )D. Tanaka et al.rChemical Physics 239 1998 437–445440
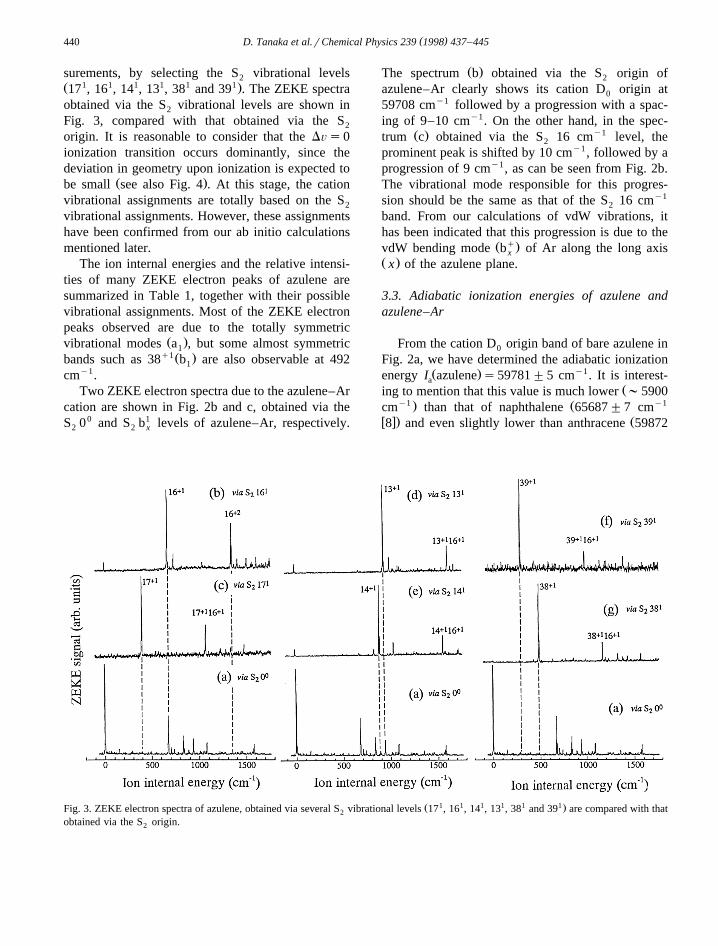
surements, by selecting the S vibrational levels2Ž 1 1 1 1 1 1.17 , 16 , 14 , 13 , 38 and 39 . The ZEKE spectraobtained via the S vibrational levels are shown in2
Fig. 3, compared with that obtained via the S2
origin. It is reasonable to consider that the DÕs0ionization transition occurs dominantly, since thedeviation in geometry upon ionization is expected to
Ž .be small see also Fig. 4 . At this stage, the cationvibrational assignments are totally based on the S2
vibrational assignments. However, these assignmentshave been confirmed from our ab initio calculationsmentioned later.
The ion internal energies and the relative intensi-ties of many ZEKE electron peaks of azulene aresummarized in Table 1, together with their possiblevibrational assignments. Most of the ZEKE electronpeaks observed are due to the totally symmetric
Ž .vibrational modes a , but some almost symmetric1q1Ž .bands such as 38 b are also observable at 4921
cmy1.Two ZEKE electron spectra due to the azulene–Ar
cation are shown in Fig. 2b and c, obtained via theS 00 and S b1 levels of azulene–Ar, respectively.2 2 x
Ž .The spectrum b obtained via the S origin of2
azulene–Ar clearly shows its cation D origin at0
59708 cmy1 followed by a progression with a spac-ing of 9–10 cmy1. On the other hand, in the spec-
Ž . y1trum c obtained via the S 16 cm level, the2
prominent peak is shifted by 10 cmy1, followed by aprogression of 9 cmy1, as can be seen from Fig. 2b.The vibrational mode responsible for this progres-sion should be the same as that of the S 16 cmy1
2
band. From our calculations of vdW vibrations, ithas been indicated that this progression is due to the
Ž q.vdW bending mode b of Ar along the long axisxŽ .x of the azulene plane.
3.3. Adiabatic ionization energies of azulene andazulene–Ar
From the cation D origin band of bare azulene in0
Fig. 2a, we have determined the adiabatic ionizationŽ . y1energy I azulene s59781"5 cm . It is interest-a
Žing to mention that this value is much lower ;5900y1 . Ž y1cm than that of naphthalene 65687"7 cm
w x. Ž8 and even slightly lower than anthracene 59872
Ž 1 1 1 1 1 1.Fig. 3. ZEKE electron spectra of azulene, obtained via several S vibrational levels 17 , 16 , 14 , 13 , 38 and 39 are compared with that2
obtained via the S origin.2
( )D. Tanaka et al.rChemical Physics 239 1998 437–445 441
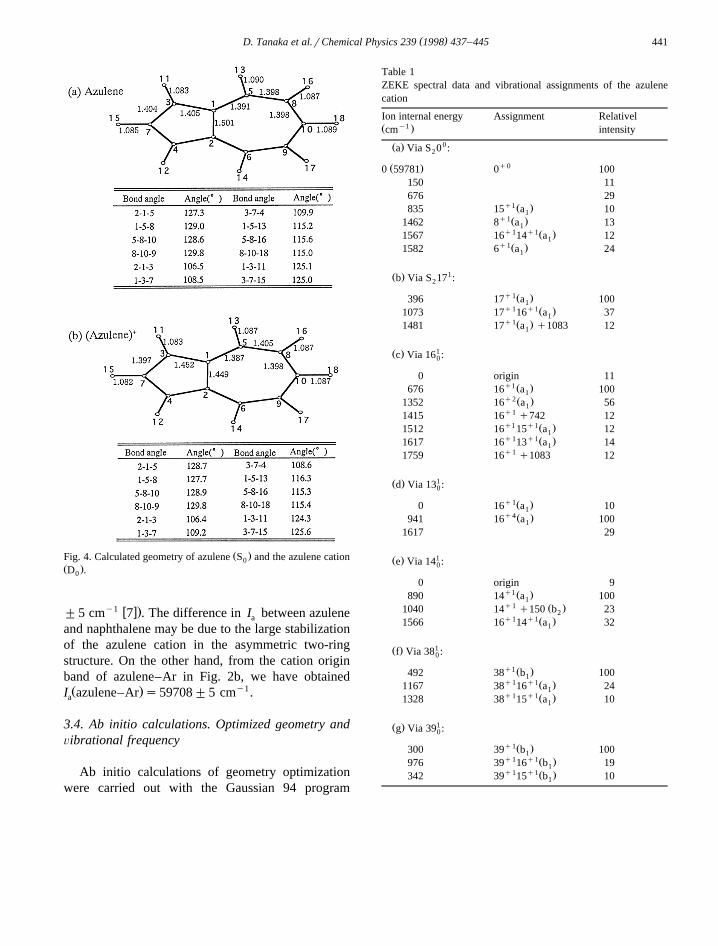
Ž .Fig. 4. Calculated geometry of azulene S and the azulene cation0Ž .D .0
y1 w x."5 cm 7 . The difference in I between azulenea
and naphthalene may be due to the large stabilizationof the azulene cation in the asymmetric two-ringstructure. On the other hand, from the cation originband of azulene–Ar in Fig. 2b, we have obtainedŽ . y1I azulene–Ar s59708"5 cm .a
3.4. Ab initio calculations. Optimized geometry andÕibrational frequency
Ab initio calculations of geometry optimizationwere carried out with the Gaussian 94 program
Table 1ZEKE spectral data and vibrational assignments of the azulenecation
Ion internal energy Assignment Relatively1Ž .cm intensity
0Ž .a Via S 0 :2
q0Ž .0 59781 0 100150 11676 29
q1 Ž .835 15 a 101q1Ž .1462 8 a 131
q1 q1Ž .1567 16 14 a 121q1Ž .1582 6 a 241
1Ž .b Via S 17 :2
q1Ž .396 17 a 1001q1 q1Ž .1073 17 16 a 371q1Ž .1481 17 a q1083 121
1Ž .c Via 16 :0
0 origin 11q1 Ž .676 16 a 1001q2Ž .1352 16 a 561q11415 16 q742 12q1 q1Ž .1512 16 15 a 121q1 q1Ž .1617 16 13 a 141q11759 16 q1083 12
1Ž .d Via 13 :0
q1Ž .0 16 a 101q4Ž .941 16 a 1001
1617 29
1Ž .e Via 14 :0
0 origin 9q1 Ž .890 14 a 1001q1 Ž .1040 14 q150 b 232q1 q1Ž .1566 16 14 a 321
1Ž .f Via 38 :0
q1 Ž .492 38 b 1001q1 q1Ž .1167 38 16 a 241q1 q1Ž .1328 38 15 a 101
1Ž .g Via 39 :0
q1Ž .300 39 b 1001q1 q1Ž .976 39 16 b 191q1 q1Ž .342 39 15 b 101
( )D. Tanaka et al.rChemical Physics 239 1998 437–445442
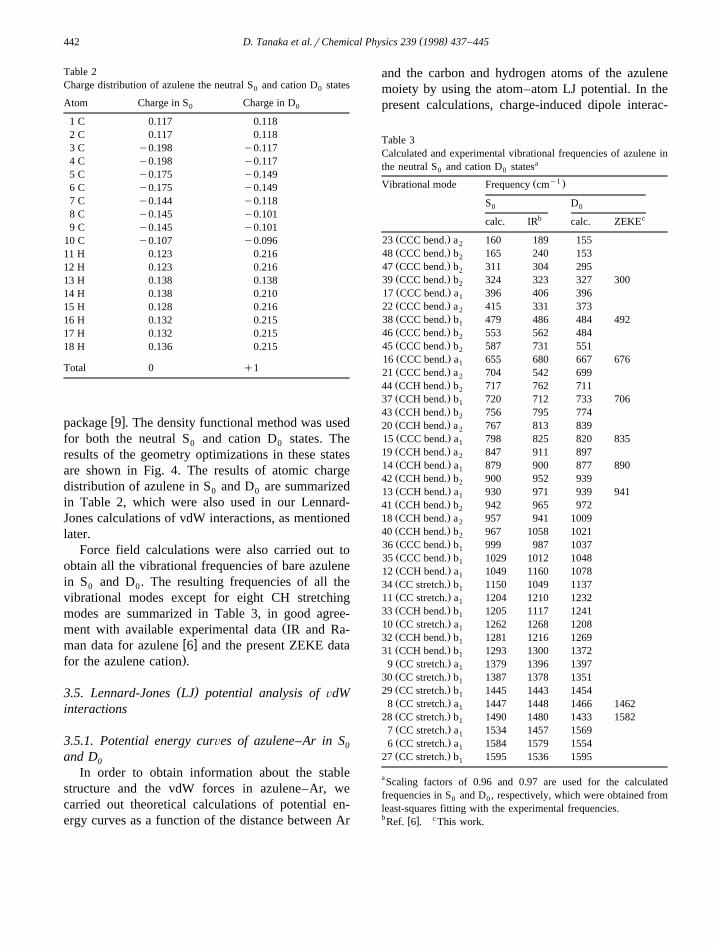
Table 2Charge distribution of azulene the neutral S and cation D states0 0
Atom Charge in S Charge in D0 0
1 C 0.117 0.1182 C 0.117 0.1183 C y0.198 y0.1174 C y0.198 y0.1175 C y0.175 y0.1496 C y0.175 y0.1497 C y0.144 y0.1188 C y0.145 y0.1019 C y0.145 y0.101
10 C y0.107 y0.09611 H 0.123 0.21612 H 0.123 0.21613 H 0.138 0.13814 H 0.138 0.21015 H 0.128 0.21616 H 0.132 0.21517 H 0.132 0.21518 H 0.136 0.215
Total 0 q1
w xpackage 9 . The density functional method was usedfor both the neutral S and cation D states. The0 0
results of the geometry optimizations in these statesare shown in Fig. 4. The results of atomic chargedistribution of azulene in S and D are summarized0 0
in Table 2, which were also used in our Lennard-Jones calculations of vdW interactions, as mentionedlater.
Force field calculations were also carried out toobtain all the vibrational frequencies of bare azulenein S and D . The resulting frequencies of all the0 0
vibrational modes except for eight CH stretchingmodes are summarized in Table 3, in good agree-
Žment with available experimental data IR and Ra-w xman data for azulene 6 and the present ZEKE data.for the azulene cation .
( )3.5. Lennard-Jones LJ potential analysis of ÕdWinteractions
3.5.1. Potential energy curÕes of azulene–Ar in S0
and D0
In order to obtain information about the stablestructure and the vdW forces in azulene–Ar, wecarried out theoretical calculations of potential en-ergy curves as a function of the distance between Ar
and the carbon and hydrogen atoms of the azulenemoiety by using the atom–atom LJ potential. In thepresent calculations, charge-induced dipole interac-
Table 3Calculated and experimental vibrational frequencies of azulene inthe neutral S and cation D statesa
0 0
y1Ž .Vibrational mode Frequency cm
S D0 0
b ccalc. IR calc. ZEKE
Ž .23 CCC bend. a 160 189 1552Ž .48 CCC bend. b 165 240 1532Ž .47 CCC bend. b 311 304 2952Ž .39 CCC bend. b 324 323 327 3002Ž .17 CCC bend. a 396 406 3961Ž .22 CCC bend. a 415 331 3732Ž .38 CCC bend. b 479 486 484 4921Ž .46 CCC bend. b 553 562 4842Ž .45 CCC bend. b 587 731 5512Ž .16 CCC bend. a 655 680 667 6761Ž .21 CCC bend. a 704 542 6992Ž .44 CCH bend. b 717 762 7112Ž .37 CCH bend. b 720 712 733 7061Ž .43 CCH bend. b 756 795 7742Ž .20 CCH bend. a 767 813 8392Ž .15 CCC bend. a 798 825 820 8351Ž .19 CCH bend. a 847 911 8972Ž .14 CCH bend. a 879 900 877 8901Ž .42 CCH bend. b 900 952 9392Ž .13 CCH bend. a 930 971 939 9411Ž .41 CCH bend. b 942 965 9722Ž .18 CCH bend. a 957 941 10092Ž .40 CCH bend. b 967 1058 10212Ž .36 CCC bend. b 999 987 10371Ž .35 CCC bend. b 1029 1012 10481Ž .12 CCH bend. a 1049 1160 10781Ž .34 CC stretch. b 1150 1049 11371Ž .11 CC stretch. a 1204 1210 12321Ž .33 CCH bend. b 1205 1117 12411Ž .10 CC stretch. a 1262 1268 12081Ž .32 CCH bend. b 1281 1216 12691Ž .31 CCH bend. b 1293 1300 13721Ž .9 CC stretch. a 1379 1396 13971Ž .30 CC stretch. b 1387 1378 13511Ž .29 CC stretch. b 1445 1443 14541Ž .8 CC stretch. a 1447 1448 1466 14621Ž .28 CC stretch. b 1490 1480 1433 15821Ž .7 CC stretch. a 1534 1457 15691Ž .6 CC stretch. a 1584 1579 15541Ž .27 CC stretch. b 1595 1536 15951
aScaling factors of 0.96 and 0.97 are used for the calculatedfrequencies in S and D , respectively, which were obtained from0 0
least-squares fitting with the experimental frequencies.b w x cRef. 6 . This work.
( )D. Tanaka et al.rChemical Physics 239 1998 437–445 443
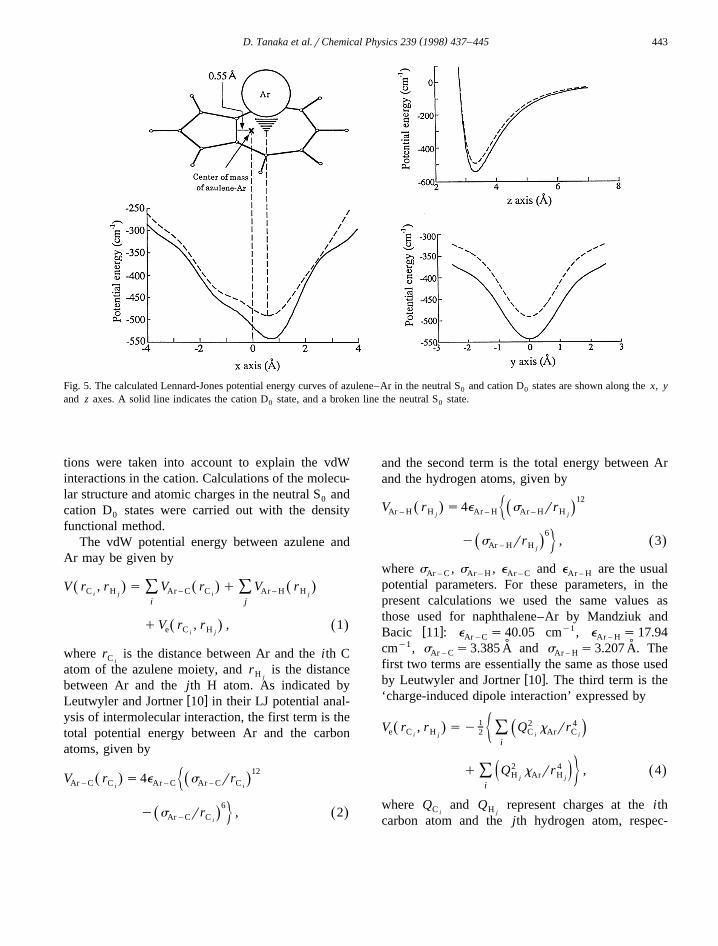
Fig. 5. The calculated Lennard-Jones potential energy curves of azulene–Ar in the neutral S and cation D states are shown along the x, y0 0
and z axes. A solid line indicates the cation D state, and a broken line the neutral S state.0 0
tions were taken into account to explain the vdWinteractions in the cation. Calculations of the molecu-lar structure and atomic charges in the neutral S and0
cation D states were carried out with the density0
functional method.The vdW potential energy between azulene and
Ar may be given by
V r , r s V r q V rŽ .Ž . Ž .Ý ÝC H Ar – C C Ar – H Hi j i ji j
qV r , r , 1Ž .Ž .e C Hi j
where r is the distance between Ar and the ith CC i
atom of the azulene moiety, and r is the distanceH j
between Ar and the jth H atom. As indicated byw xLeutwyler and Jortner 10 in their LJ potential anal-
ysis of intermolecular interaction, the first term is thetotal potential energy between Ar and the carbonatoms, given by
12V r s4e s rrŽ . Ž .½Ar – C C Ar – C Ar – C Ci i
6y s rr , 2Ž .Ž . 5Ar – C C i
and the second term is the total energy between Arand the hydrogen atoms, given by
12V r s4e s rrŽ . Ž .½Ar – H H Ar – H Ar – H Hj j
6y s rr , 3Ž .Ž . 5Ar – H H j
where s , s , e and e are the usualAr – C Ar – H Ar – C Ar – H
potential parameters. For these parameters, in thepresent calculations we used the same values asthose used for naphthalene–Ar by Mandziuk and
w x y1Bacic 11 : e s 40.05 cm , e s 17.94Ar – C Ar – Hy1 ˚ ˚cm , s s3.385 A and s s3.207 A. TheAr – C Ar – H
first two terms are essentially the same as those usedw xby Leutwyler and Jortner 10 . The third term is the
‘charge-induced dipole interaction’ expressed by
1 2 4V r , r sy Q x rrŽ . Ý Ž .e C H C Ar C2 ½i j i ii
q Q2 x rr 4 , 4Ž .Ý ž /H Ar H 5j ji
where Q and Q represent charges at the ithC Hi j
carbon atom and the jth hydrogen atom, respec-
( )D. Tanaka et al.rChemical Physics 239 1998 437–445444
tively, and x is the polarizability of Ar. A value ofAr˚31.650 A was used for x .Ar
The potential energy curves obtained along the x,y and z axes are shown in Fig. 5. From these curves,it has been found that the potential energy minima
˚ ˚are located at 0.59 A in S and 0.69 A in D from the0 0
center of mass of the azulene moiety along the longŽ .C axis.2v
3.5.2. Dissociation energiesThe shift in ionization potential, D I , is expresseda
in terms of the dissociation energies of azulene–Arin S and D by the equation:0 0
D I s I azulene–Ar y I azulene sDY yDq ,Ž . Ž .a a a 0 0
5Ž .
where DY and Dq are the dissociation energies in0 0
the neutral S and cation D states of azulene–Ar,0 0
respectively. The value of D I found from the exper-a
iment is y73 cmy1, while the dissociation energyŽ Y q.difference D yD calculated from our LJ-poten-0 0
tial analysis is y53 cmy1. In this calculation weneglected any interaction caused by a positive chargedeposited on the Ar atom.
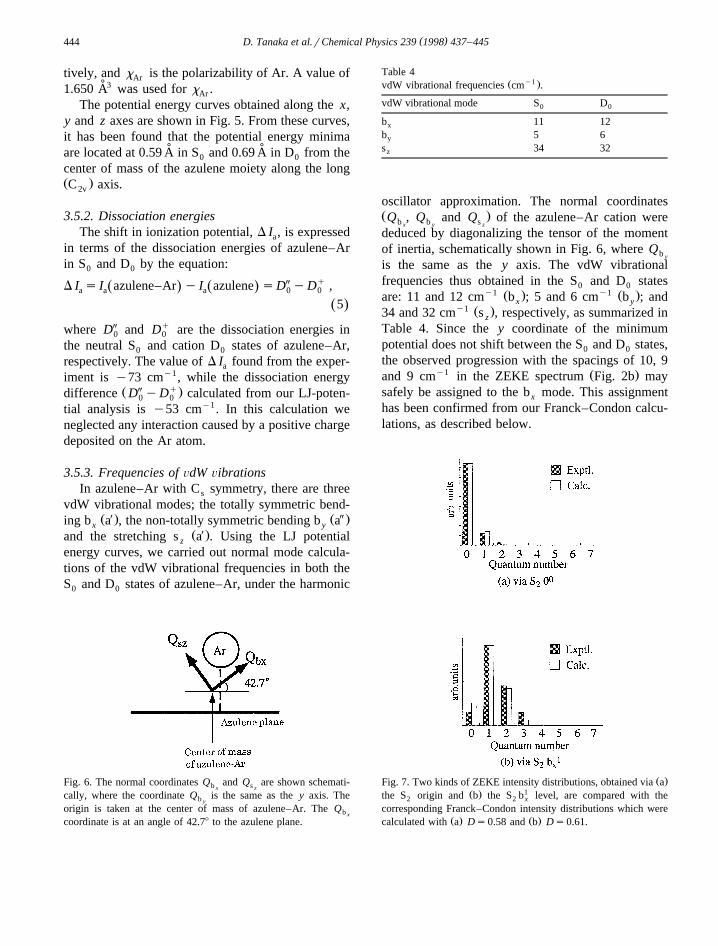
3.5.3. Frequencies of ÕdW ÕibrationsIn azulene–Ar with C symmetry, there are threes
vdW vibrational modes; the totally symmetric bend-Ž X. Ž Y .ing b a , the non-totally symmetric bending b ax y
Ž X.and the stretching s a . Using the LJ potentialz
energy curves, we carried out normal mode calcula-tions of the vdW vibrational frequencies in both theS and D states of azulene–Ar, under the harmonic0 0
Fig. 6. The normal coordinates Q and Q are shown schemati-b sx z
cally, where the coordinate Q is the same as the y axis. Theb y
origin is taken at the center of mass of azulene–Ar. The Qb x
coordinate is at an angle of 42.78 to the azulene plane.
Table 4Ž y1 .vdW vibrational frequencies cm .
vdW vibrational mode S D0 0
b 11 12x
b 5 6y
s 34 32z
oscillator approximation. The normal coordinatesŽ .Q , Q and Q of the azulene–Ar cation wereb b sx y z
deduced by diagonalizing the tensor of the momentof inertia, schematically shown in Fig. 6, where Qb y
is the same as the y axis. The vdW vibrationalfrequencies thus obtained in the S and D states0 0
y1 Ž . y1 Ž .are: 11 and 12 cm b ; 5 and 6 cm b ; andx yy1 Ž .34 and 32 cm s , respectively, as summarized inz
Table 4. Since the y coordinate of the minimumpotential does not shift between the S and D states,0 0
the observed progression with the spacings of 10, 9y1 Ž .and 9 cm in the ZEKE spectrum Fig. 2b may
safely be assigned to the b mode. This assignmentx
has been confirmed from our Franck–Condon calcu-lations, as described below.
Ž .Fig. 7. Two kinds of ZEKE intensity distributions, obtained via aŽ . 1the S origin and b the S b level, are compared with the2 2 x
corresponding Franck–Condon intensity distributions which wereŽ . Ž .calculated with a Ds0.58 and b Ds0.61.

( )D. Tanaka et al.rChemical Physics 239 1998 437–445 445
3.5.4. Franck–Condon calculations of ÕdW ÕibrationIn order to confirm the assignment of the ob-
served azulene–Ar progression with the spacing of9–10 cmy1, we carried out Franck–Condon calcula-
Ž qn .tions for the following vibrational transition D b0 xŽ n .§ S b : n s 0 . The same harmonic potential2 x
curves were assumed for both the lower S and the2
upper D state, except for the potential displacement0Ž q X .D sQ yQ between these two states alongb b bx x x
the b coordinate. Here, Qq and QX represent thex b bx x
normal coordinates along b of the cation D and thex 0
S states, respectively. In the calculations we used2
an analytical expression for the overlap derived byw x Ž .Smith 12 . The displacement D between theb x
lower and upper curves was taken as an adjustableparameter. Franck–Condon intensity distributionsobtained with D s0.58 and 0.61 are shown in Fig.b x
7, compared with the ZEKE spectral pattern. It isseen from Fig. 7 that the observed vibrational pro-gressions are well reproduced from the Franck–Con-don calculations.
3.5.5. Structural informationŽ .From the displacement of D azulene–Ar f0.6b x
in the potential curves, the change in the location ofAr between the S and D states was estimated by2 0
Ž .1r2 w xusing the equation D s m Df 13 , whereb b bx x x
Ž .Df is the difference in the angle in radian be-b x
tween the x axis and the line connecting Ar with thecenter of mass of the azulene moiety. As a result, avalue of Df s28 was obtained from D f0.6.b bx x
This means that Ar is shifted by 28 from the centerof mass of the azulene moiety upon photoionization.A similar situation has been reported, for example,
w xDf s88 and 78 in aniline–Ar 14 and benzoni-b x
w xtrile–Ar 15 . The change in the energy of vdWinteraction between S and D may be mainly due to2 0
the difference in the ‘charge–charge-induced-dipole’interaction.
4. Conclusions
In the present work, the ZEKE electron spectra ofazulene and azulene–Ar have been observed for thefirst time. It has been found that their adiabatic
ionization energies are extremely low compared withnaphthalene. From the ab initio calculations of azu-lene, we have obtained the molecular structures, theatomic charge distributions, and vibrational frequen-cies in the neutral S and cation D states. For0 0
azulene–Ar, we have carried out the LJ potentialenergy calculations including the charge-induceddipole interaction, and concluded that Ar is notlocated at above the center of mass of the azulenemoiety but shifted toward the seven-membered ring.A progression of the vdW bending mode b with ax
frequency of 10 cmy1 has also been observed for theazulene–Ar cation from the ZEKE electron spectrain the very low-frequency region.
References
w x Ž .1 R. Boschi, E. Clar, W. Schmit, J. Chem. Phys. 60 19744406.
w x Ž .2 A.E.W. Knight, B.K. Selinger, Chem. Phys. Lett. 12 1971419.
w x3 M. Fujii, T. Ebata, N. Mikami, M. Ito, Chem. Phys. 77Ž .1983 191.
w x4 K. Muller-Dethlefs, E.W. Schlag, Annu. Rev. Phys. Chem.¨Ž .42 1991 109.
w x Ž .5 S. Sato, K. Kimura, Chem. Phys Lett. 249 1996 155.w x Ž .6 R.S. Chao, R.K. Khanna, Spectrochim. Acta 33A 1977 53.w x Ž .7 M.C.R. Cockett, K. Kimura, J. Chem. Phys. 100 1994
3429.w x8 T. Vondrak, S. Sato, K. Kimura, Chem. Phys. Lett. 261
Ž .1996 481.w x9 M.J. Frisch, G.W. Trucks, H.B. Schlegel, P.M.W. Gill, B.G.
Johnson, M.A. Robb, J.R. Cheeseman, T.A. Keith, G.A.Petersson, J.A. Montgomery, K. Raghavachari, M.A. Al-Laham, V.G. Zakrzewski, J.V. Ortiz, J.B. Foresman, J.Cioslowski, B.B. Stefanov, A. Nanayakkara, M. Challa-combe, C.Y. Peng, P.Y. Ayala, W. Chen, M.W. Wong, J.L.Andres, E.S. Replogle, R. Gomperts, R.L. Martin, D.J. Fox,J.S. Binkley, D.J. Defrees, J. Baker, J.P. Stewart, M. Head-
ŽGordon, C. Gonzales, J.A. Pople, Gaussian 94 Revision C..3 , Gaussian, Inc., Pittsburgh, PA, 1995.
w x Ž .10 S. Leutwyler, J. Jortner, J. Phys. Chem. 91 1987 5558.w x Ž .11 M. Mandzuik, Z. Bacic, J. Chem. Phys. 98 1993 7165.w x Ž .12 W.L. Smith, J. Phys. B 1 1968 89.w x13 E.J. Bieske, M.W. Rainbird, A.E.W. Knight, J. Chem. Phys.
Ž .94 1991 7019.w x14 M. Takahashi, H. Ozeki, K. Kimura, Chem. Phys. Lett. 181
Ž .1991 255.w x Ž .15 M. Araki, S. Sato, K. Kimura, J. Phys. Chem. 100 1996
10542.