Embed Size (px)
Citation preview

JOURNAL
SOCIALMANAGEMENT
RESEARCH
AND
Volume 6 No. 1
Research Management Institute
ISSN 1675-7017
June 2009
Zakat Institution

SOCIAL AND MANAGEMENT RESEARCH JOURNAL
Chief Editor Prof. Dr. Rashidah Abdul Rahman,
Universiti Teknologi MARA, Malaysia
Managing Editor Assoc. Prof. Dr. Loo Ern Chen,
Universiti Teknologi MARA, Malaysia
Editorial Advisory and Review Board Prof. Dr. Normah Omar, Universiti Teknologi MARA, Malaysia
Assistant Prof. Alexander N. Kostyuk, Ukrainian Academy of Banking of National Bank of Ukraine, Sumy, Ukraine
Prof. Dr. Faridah Hassan, Universiti Teknologi MARA, Malaysia Prof. Dr. Sardar M.N. Islam, Victoria University, Melbourne, Australia
Assoc. Prof. Dr. Razidah Ismail, Universiti Teknologi MARA, Malaysia Assoc. Prof. Dr. Nor’azam Matstuki, Universiti Teknologi MARA, Malaysia
Assoc. Prof. Dr. Kiranjit Kaur, Universiti Teknologi MARA, Malaysia Assoc. Prof. Dr. Sabarinah Sheikh Ahmad, Universiti Teknologi MARA, Malaysia
Assoc. Prof. Dr. Nor Aziah Alias, Universiti Teknologi MARA, Malaysia Assoc. Prof. Dr. Maznah Wan Omar, Universiti Teknologi MARA, Malaysia
Assoc. Prof. Dr. Lionel Wee, National University of Singapore, Singapore Assoc. Prof. Dr. Binh Tram-Nam, The University of New South Wales,
Sydney, Australia Dr. Kalsom Salleh, Universiti Teknologi MARA, Malaysia
Dr. Azmi Abdul Hamid, Universiti Teknologi MARA, Malaysia Dr. Ria Nelly Sari, Universitas Riau, Riau, Indonesia
Dr. Agus Harjitok, Universitas Islam Indonesia, Jogjakarta, Indonesia Dr. Rashid Ameer, Universiti Teknologi MARA, Malaysia
Dr. Radiah Othman, Universiti Teknologi MARA, Malaysia Dr. Megawati Omar, Universiti Teknologi MARA, Malaysia Dr. Azizah Abdullah, Universiti Teknologi MARA, Malaysia
Siti Noor Hayati Mohamed Zawawi, Universiti Teknologi MARA, Malaysia
Copyright © 2009 by Research Management Institute (RMI), Universiti Teknologi MARA, 40450 Shah Alam, Selangor, Malaysia. All rights reserved. No part of this publication may be reproduced, stored in a retrieval system or transmitted in any form or by any means; electronics, mechanical, photocopying, recording or otherwise; without prior permission in writing from the Publisher. Social and Management Research Journal is jointly published by Research Management Institute (RMI) and University Publication Centre (UPENA), Universiti Teknologi MARA, 40450 Shah Alam, Selangor, Malaysia. The views and opinion expressed therein are those of the individual authors and the publication of these statements in the Scientific Research Journal do not imply endorsement by the publisher or the editorial staff. Copyright is vested in Universiti Teknologi MARA. Written permission is required to reproduce any part of this publication.

1. The Role of Demographic Variables as the Moderator between 1Organizational Variables and Job Stress Among Teachers in SabahNajihah Hanisah MarmayaSyed Azizi Wafa
2. Governing Zakat as a Social Institution: The Malaysian Perspective 15Shawal Kaslam
3. Customers’ Perception of Restaurant Service Quality: Evidence 33from MalaysiaVoon Boo HoKaren KuehLois UnggahRaymond Chali
4. Managing Talent in Human Resource: A Knowledge Discovery 51in Database (KDD) ApproachHamidah JantanAbdul Razak HamdanZulaiha Ali Othman
5. The Impact of Environmental Dynamism on Knowledge 63Absorptive Capacity-Innovation Performance RelationshipAmongst Manufacturing SMEs in MalaysiaZarina DenanNoraini IsmailNoormala Amir Ishak
6. Students’ Attendance at Management Accounting Classes – 87Reasons and the Effect on Academic PerformanceRosiatimah Mohd IsaAzrul Abdullah
Vol. 6 No. 1 June 2009 ISSN 1675-7017
Content.pmd 3/30/10, 10:54 AM1

Customers’ Perception of RestaurantService Quality: Evidence from
Malaysia
Voon Boo Ho1,3, Karen Kueh2, Lois Unggah and Raymond Chali1
1Faculty of Business Management, Universiti Teknologi MARACawangan Sarawak, Jalan Meranek, 94300 Kota Samarahan, Sarawak
2Swinburne University of Technology, Sarawak Campus3Email: [email protected]
ABSTRACT
Restaurant plays a key role in attracting tourists and hence contributessignificantly to a country’s economy. Restaurant service quality should thereforebe well managed and sustained to ensure continuous and increased patronage.In this respect, the determinants and consequences of restaurant service qualityneed to be well understood. This paper presents the customers’ perception ofrestaurant service quality for a sample of 342 restaurant customers in Malaysia.The results showed that customers were generally satisfied with the servicequality, price and variety of food. Reliability received the highest ratingsfollowed by tangibles and responsiveness. Restaurants serving Western cuisinewere rated better than the restaurants serving local food. Customer-perceivedrestaurant service quality was significantly correlated with the customersatisfaction and loyalty. Age and ethnic background did not affect perceptionof foodservice quality whereas gender influenced perceptions of food varietyand overall satisfaction.
Keywords: Restaurant service quality, customer satisfaction, loyalty, Malaysia
Introduction
The foodservice industry plays an important role in a nation’s economy.Food services can be one of the determinants of a country’s
33
Social and Management Research Journal Vol. 6 No. 1, 33-50, 2009
ISSN 1675-7017© 2009 Universiti Teknologi MARA (UiTM), Malaysia.
Artkel 3.pmd 3/30/10, 10:57 AM33
34
Social and Management Research Journal
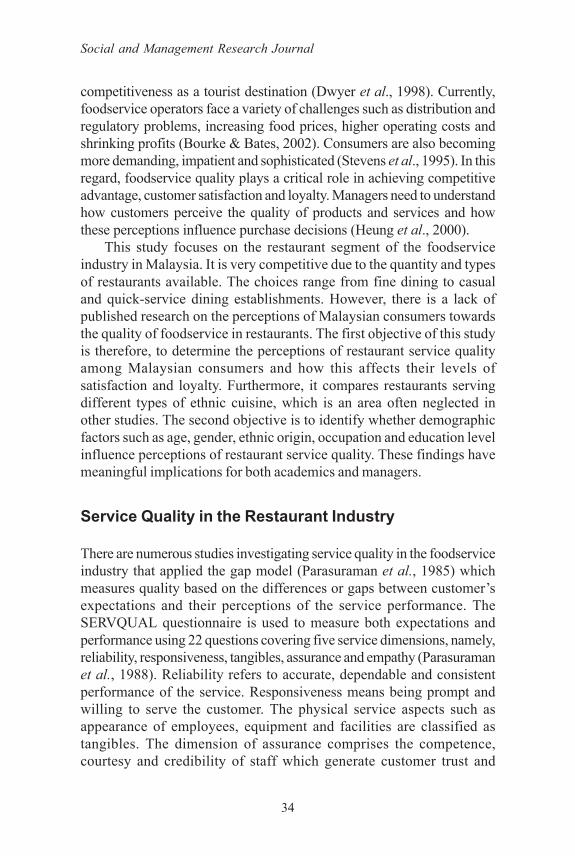
competitiveness as a tourist destination (Dwyer et al., 1998). Currently,foodservice operators face a variety of challenges such as distribution andregulatory problems, increasing food prices, higher operating costs andshrinking profits (Bourke & Bates, 2002). Consumers are also becomingmore demanding, impatient and sophisticated (Stevens et al., 1995). In thisregard, foodservice quality plays a critical role in achieving competitiveadvantage, customer satisfaction and loyalty. Managers need to understandhow customers perceive the quality of products and services and howthese perceptions influence purchase decisions (Heung et al., 2000).
This study focuses on the restaurant segment of the foodserviceindustry in Malaysia. It is very competitive due to the quantity and typesof restaurants available. The choices range from fine dining to casualand quick-service dining establishments. However, there is a lack ofpublished research on the perceptions of Malaysian consumers towardsthe quality of foodservice in restaurants. The first objective of this studyis therefore, to determine the perceptions of restaurant service qualityamong Malaysian consumers and how this affects their levels ofsatisfaction and loyalty. Furthermore, it compares restaurants servingdifferent types of ethnic cuisine, which is an area often neglected inother studies. The second objective is to identify whether demographicfactors such as age, gender, ethnic origin, occupation and education levelinfluence perceptions of restaurant service quality. These findings havemeaningful implications for both academics and managers.
Service Quality in the Restaurant Industry
There are numerous studies investigating service quality in the foodserviceindustry that applied the gap model (Parasuraman et al., 1985) whichmeasures quality based on the differences or gaps between customer’sexpectations and their perceptions of the service performance. TheSERVQUAL questionnaire is used to measure both expectations andperformance using 22 questions covering five service dimensions, namely,reliability, responsiveness, tangibles, assurance and empathy (Parasuramanet al., 1988). Reliability refers to accurate, dependable and consistentperformance of the service. Responsiveness means being prompt andwilling to serve the customer. The physical service aspects such asappearance of employees, equipment and facilities are classified astangibles. The dimension of assurance comprises the competence,courtesy and credibility of staff which generate customer trust and
Artkel 3.pmd 3/30/10, 10:57 AM34
35
Customers’ Perception of Restaurant Service Quality
confidence. Lastly, empathy involves caring and personalized attention,understanding customer needs and convenient access to the service.
The SERVQUAL instrument has been widely applied in studiescovering a variety of service industries such as healthcare (Mangold &Babakus, 1991; Kilbourne et al., 2004), public services (Brysland & Curry,2001), higher education (Soutar & McNeil, 1996), telemarketing (Kassim& Bojei, 2002) and banking (Arasli et al., 2005), as well as in othercultures (e.g. Johnson & Sirikit, 2002; Kassim & Bojei, 2002; Arasli etal., 2005; Jabnoun & Khalifa, 2005). Nevertheless, it has generatedcriticisms in terms of its basic methodology and conceptualization (Cronin& Taylor, 1992). Teas (1993) also questioned the validity of the waySERVQUAL conceptualized and measured expectations while Babakus& Boller (1992) identified the use of gap scores and mixed-item wordingas two of the major problems. Different industries vary in terms of theservice quality dimensions that were relevant (Carman, 1990, Babakus& Boller, 1992), hence the instrument may need to be adapted for use indifferent industries.
In spite of this, SERVQUAL remains popular whereby manyresearchers have used it as the starting point in measuring service qualityin the foodservice industry while making appropriate adjustments to theoriginal items and wordings as needed. Stevens et al. (1995) adaptedSERVQUAL to the restaurant industry and produced DINESERV. Basedon a survey of casual dining, fine dining and quick-service restaurants,they found that reliability was most important among restaurant consumers,followed by tangibles, assurance, responsiveness and empathy. TheSERVQUAL instrument was also applied by John and Tyas (1996) tothe catering sector where their findings revealed that competitivedifferentiation among food caterers was based on prompt service,reliability, staff behaviour (helpful, knowledgeable, polite and provideindividualized attention to customers) and attractive appearance offacilities, food and staff.
Heung et al. (2000) adapted the DINESERV scale to study desiredservice levels, adequate service levels and perceived performance infour types of restaurants (Chinese, casual dining, full service and quickservice) in an airport in Hong Kong. They found that regardless of thetype of restaurants, customers desired convenience in operating hours,cleanliness, politeness, courtesy, well-dressed employees and readablemenus. Customers had the highest expectations for full-service restaurantswhereby convenient operating hours was considered the top factor foradequate service levels. On the other hand, in a study of consumers’
Artkel 3.pmd 3/30/10, 10:57 AM35

36
Social and Management Research Journal
expectations and perceptions of performance in the fast-food industry,Lee et al. (2004) used a ratio-based SERVQUAL scale to overcomelimitations of the gap score. They found tangibles to be less important toconsumers. In contrast, the factors that need to be emphasized arereliability in solving problems and maintaining accurate records, providingprompt service, keeping customers informed of when the service will beperformed, having convenient business hours, giving personal attention,caring about customers’ interests and making customers feel comfortable.Winsted (2000) found that the key behaviours of service employees whichcontributed to customer satisfaction in the restaurant industry, were treatingthe customer with care, being attentive and pleasant.
Zopiatis and Pribic (2007) studied the expectations of college studentsin selecting a food and beverage establishment using the DINESERVinstrument. Reliability was the most important dimension followed byresponsiveness, tangibles, assurance and empathy. All five dimensionswere more important to women compared to men. There were alsosignificant differences between genders in terms of factors that affecttheir choice of which restaurant to frequent. Some of these factors includespeed of service, quality of menu items, feeling of safety and securityand employee professionalism. The most important factor that influencedthe choice of restaurant was overall cleanliness followed by employees’attitude and quality of menu items.
Another study of restaurants in Spain found that the most importantfactors for return patronage was the quality of food, service and cost/value of the meal, and that this finding was equally true for both male andfemale customers (Soriano, 2002). Similar results were revealed in astudy of Chinese restaurants in the U.S. which identified food andenvironment as the most important determinant of consumers’ repurchaseintention, followed by service/courtesy and price/value (Qu, 1997).
In terms of the behavioural consequences of service quality, it hasbeen shown that customers of family-style chain dinner houses in Koreawho reported higher perceptions of service quality were more satisfiedand higher levels of satisfaction were associated with increased word-of-mouth (Babin et al., 2005). Kivela et al. (2000) studied restaurantpatrons in Hong Kong and found support for the notion that satisfiedcustomers tend to return. Zeithaml et al. (1996) asserted that consumerswho reported higher levels of perceived service quality were more loyalto the organization, less likely to switch, more willing to pay higher pricesand less likely to complain to others. Boulding et al. (1993) also reportedthat perceptions of service quality influenced word of mouth and repeat
Artkel 3.pmd 3/30/10, 10:57 AM36
37
Customers’ Perception of Restaurant Service Quality
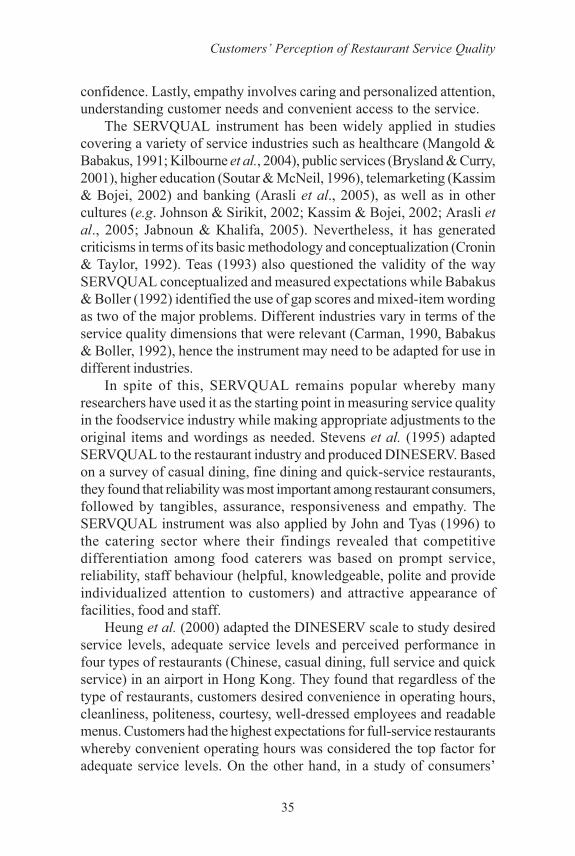
business. Similarly, there are empirical research findings (e.g. Croninet al., 2000; Qin & Prybutok, 2009; Kim et al., 2009) which indicate thatservice quality can have a significant influences on both satisfaction andbehavioral intentions whereas Tam (2004) found that perceived servicequality positively affected customer satisfaction which in turn significantlyinfluenced customer loyalty.
Methodology
This is an exploratory research which aims to gauge the levels ofcustomer-perceived service quality of restaurants in Malaysia using cross-sectional data collected via structured questionnaires. The DINESERVEscale of Stevens et al. (1995) was adapted for this purpose. Morespecifically, the perception-only or “DINESERV.per” version was used.Responses were on a seven-point scale ranging from “strongly disagree”(1) to “strongly agree” (7). Initially, 28 items were used to measure servicequality. A face validity check of the survey items was carried out by twoservices marketing experts. Pilot testing of the questionnaire was alsoperformed using 60 respondents. One culture-specific item, “Use thelanguage that I can understand” was added while two potentially confusingitems, “Provide an accurate guest check” and “Makes me feel special”,were deleted.
More than 400 questionnaires were distributed to restaurant customersin a Malaysian city who had patronized a restaurant within the past threemonths. Respondents were asked to select a specific ethnic restaurant(Western, Chinese, Malay or Indian) before answering the questionnaire.The type of restaurants assessed included fine-dining, casual-dining andfast-service restaurants. Quota sampling based on convenience selectionprocess was employed and the main control characteristic was restauranttype (i.e. Western, Chinese and Others). For purposes of statisticalanalysis, the Malay and Indian restaurants were grouped together as“Others” as they were fewer in number.
Findings and Discussions
A total of 342 respondents participated in the survey. Their demographiccharacteristics are shown in Table 1. Male respondents outnumberedfemale respondents (61.1 per cent versus 38.9 per cent). Most of the
Artkel 3.pmd 3/30/10, 10:57 AM37

38
Social and Management Research Journal
respondents (83.4 per cent) were aged 26 years old and below, with alarge number consisting of students (77.2 per cent). There were 162(47.4 per cent) respondents having diploma qualification and 118 (34.5per cent) with degree qualification. One-third of the respondents wereMalays, followed by Chinese (22.8 per cent), Ibans (24.6 per cent),Bidayuhs (7.9 per cent) and others (11.4 per cent). 100 respondents(29.2 per cent) assessed Malay restaurants, 127 respondents (37.1 percent) assessed Chinese restaurants and 115 (33.6 per cent) assessedMalay/Indian restaurants (classified as ‘Others’).
The adapted scale for measuring restaurant service quality (Stevenset al. 1995) was found to be reliable (Table 2). The Cronbach α test wasapplied to determine the reliability of the data. The overall service qualityscale was found to be internally reliable (Cronbach α = 0.95) as it exceedsthe minimum standard of 0.7 suggested by Nunnally and Bernstein (1994).The Cronbach α values for all the five dimensions, tangibles (0.91),reliability (0.81), responsiveness (0.78), assurance (0.85), and empathy(0.81), were also found to be satisfactory. The item-to-total correlation,which indicates the degree of an item’s relationship to the total score,were more than 0.50 showing that all the attributes of the respectivedimensions were reliable. Therefore, the restaurant service quality scaleused in this survey has demonstrated its internal consistency in measuringthe construct.
Table 1: Respondent Characteristics
Variables N % Variables N %
Gender Work StatusMale 209 61.1 Student 264 77.2Female 133 38.9 Working 78 22.8
Age Group Race17-21 148 43.3 Malays 114 33.322-26 137 40.1 Chinese 78 22.827-31 23 6.7 Ibans 84 24.6Above 31 34 9.9 Bidayuhs 27 7.9
Others 39 11.4Education Level Restaurant Type
Diploma 162 47.4 Western 100 29.2Degree 118 34.5 Chinese 127 37.1Others 62 18.1 Others 115 33.6
Artkel 3.pmd 3/30/10, 10:57 AM38

39
Customers’ Perception of Restaurant Service Quality
Table 2: Reliability Analysis on Restaurant Service Quality
Dimensions and ItemsCronbach Item-total
Alpha Correlation
Tangibles (10 items) 0.911 Attractive parking areas and building exteriors 0.6142 Visually attractive dining area 0.7413 Décor in keeping with image and price 0.6854 Staff appear neat and appropriately dressed 0.6575 Menu is easily readable 0.6376 Menu is visually attractive and reflects image 0.6397 Dining area is comfortable and easy to move 0.604
around 8 Dining areas are clean 0.7329 Wash/rest rooms are clean 0.68610 Comfortable seats in dining room 0.631
Reliability (4 items) 0.8111 Customers are served in the time promised 0.61312 Employees quickly correct wrong things 0.61913 Service is dependable and consistent 0.68114 Employees serve exactly as ordered 0.576
Responsiveness (3 items) 0.7815 Employees provide prompt service 0.60216 Employee shifts to help in maintaining fast 0.663
service17 Employees give extra efforts to handle 0.595
customer requestsAssurance (6 items) 0.85
18 Employees able to answer questions completely 0.57019 Employees make me feel comfortable and 0.647
confident20 Employees able and willing to give information 0.60421 Personnel well trained, competent and experienced 0.71522 Restaurant makes me feel personally safe 0.66223 Employees are supported to do their jobs well 0.641
Empathy (5 items) 0.8124 Employees sensitive to my individual needs 0.584
and wants25 Employees anticipate my individual needs and 0.618
wants26 Employees sympathetic and reassuring 0.58327 Employees have customers’ best interests at heart 0.640
Overall 0.95
Artkel 3.pmd 3/30/10, 10:57 AM39

40
Social and Management Research Journal
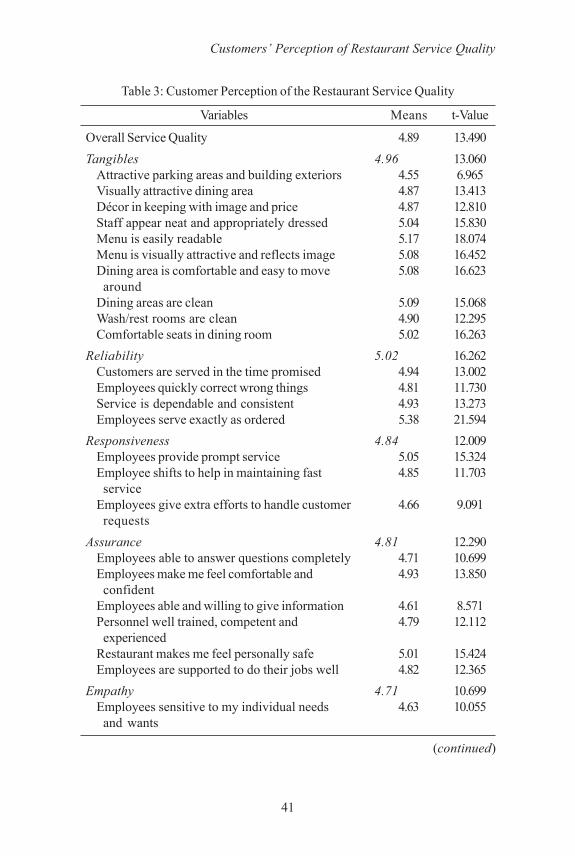
Table 3 displays the perceptions of respondents of the variousdimensions of foodservice quality. Reliability was rated the highest,followed by tangibles, responsiveness, assurance and lastly empathy. Interms of reliability, customers felt that the restaurants were most reliablein terms of serving them exactly what was ordered but relatively lessreliable in providing dependable and consistent service, serving food withinthe time promised and promptly correcting mistakes. For the tangiblesdimension, customers felt that the restaurants provided menus that wereeasy to read, visually attractive and consistent with the image of therestaurant. They also felt that the dining areas were clean, comfortableand easy to move around. Other physical aspects that received higherratings were the appearance of staff and the comfort of seats. However,the results indicate that customers had lower perception ratings of theattractiveness of the parking area, building exterior and dining area, aswell as the cleanliness of wash/rest rooms. This implies that restaurantscould do more to improve these aspects of the physical serviceenvironment. Other aspects of service that received higher ratings werethe promptness of service, the safety of the restaurants and the price andvariety of food. Empathy received the lowest perception score out of allthe five quality dimensions. This indicates that customers would like therestaurants to be more sensitive to their needs and requirements and bemore caring and sympathetic. Compared to the overall mean servicequality score of 4.89, customers had relatively high levels of satisfaction(5.28), customer loyalty (5.06) and repurchase intention (5.14), althoughpositive word-of-mouth was slightly lower (4.98). The perception scoresprovide useful information to the management of food establishmentsregarding the areas in which customers are satisfied and those whichcould be improved. The overall service quality score of 4.89 is comparableto that of other studies. For instance, a study of a chain restaurant in theUnited States by Bojanic and Rosen (1994) based on SERVQUALreported an overall perception score of 4.93. However, there is still roomfor improvement as indicated by the individual items of the scale inTable 3.
In terms of the demographic differences of the customers’perceptions, Table 4 shows the summary of the findings for the meansanalyses (purposely no statistics). The findings results indicate that ageand ethnic backgrounds do not seem to have any significant influence onthe customer-perceived restaurant service quality. The latter finding is inline with that of Yun and Hing (1995) who had found that ethnic type had
Artkel 3.pmd 3/30/10, 10:57 AM40
41
Customers’ Perception of Restaurant Service Quality
Table 3: Customer Perception of the Restaurant Service Quality
Variables Means t-Value
Overall Service Quality 4.89 13.490Tangibles 4.96 13.060
Attractive parking areas and building exteriors 4.55 6.965Visually attractive dining area 4.87 13.413Décor in keeping with image and price 4.87 12.810Staff appear neat and appropriately dressed 5.04 15.830Menu is easily readable 5.17 18.074Menu is visually attractive and reflects image 5.08 16.452Dining area is comfortable and easy to move 5.08 16.623
aroundDining areas are clean 5.09 15.068Wash/rest rooms are clean 4.90 12.295Comfortable seats in dining room 5.02 16.263
Reliability 5.02 16.262Customers are served in the time promised 4.94 13.002Employees quickly correct wrong things 4.81 11.730Service is dependable and consistent 4.93 13.273Employees serve exactly as ordered 5.38 21.594
Responsiveness 4.84 12.009Employees provide prompt service 5.05 15.324Employee shifts to help in maintaining fast 4.85 11.703
serviceEmployees give extra efforts to handle customer 4.66 9.091
requestsAssurance 4.81 12.290
Employees able to answer questions completely 4.71 10.699Employees make me feel comfortable and 4.93 13.850
confidentEmployees able and willing to give information 4.61 8.571Personnel well trained, competent and 4.79 12.112
experiencedRestaurant makes me feel personally safe 5.01 15.424Employees are supported to do their jobs well 4.82 12.365
Empathy 4.71 10.699Employees sensitive to my individual needs 4.63 10.055
and wants
(continued)
Artkel 3.pmd 3/30/10, 10:57 AM41

42
Social and Management Research Journal
no influence on the expectations of customers of fine-dining restaurants.However more definitive research is needed to clarify this issue.Occupation was found to have a significant influence only in terms of theperceptions of tangibles, whereas education level affected only theperceptions of empathy and overall customer satisfaction. This tends tosuggest that restaurants that have targeted to serve the higher incomeand elite groups should emphasize physical appearance and caring,personalized service. As for gender, the only influence was found onperceptions of food variety and overall customer satisfaction.
Table 3 (continued)
Variables Means t-ValueEmployees anticipate my individual needs 4.79 12.165
and wantsEmployees sympathetic and reassuring 4.65 9.788Employees have customers’ best interests at 4.79 12.092
heartPrice of Food 5.01 14.512Product Variety 5.09 14.878Overall Customer Satisfaction 5.28 18.698Customer Loyalty 5.06 14.870Repurchase Intention 5.14 16.853Recommend to Others 4.98 13.557
Note: All means are significantly different (at p = 0.05) from the mid-point value of 4.00.
Table 4: Demographic Differences of the Customer Perceptions
Variables Gender Age Education Occupation Race
Service Quality No No No No NoTangibles No No No Yes NoReliability No No No No NoResponsiveness No No No No NoAssurance No No No No NoEmpathy No No Yes No No
Price of Food No No No No NoProduct Variety Yes No No No NoOverall Customer Yes No Yes No No
SatisfactionCustomer Loyalty No No No No No
* Significance level is P = 0.05 (2-tailed).
Artkel 3.pmd 3/30/10, 10:57 AM42

43
Customers’ Perception of Restaurant Service Quality
Analysis of the quality perceptions by restaurant type (Table 5) revealsthat customers have higher perceptions of Western restaurants than localrestaurants on all the factors investigated in the study. Specifically, theygave significantly higher ratings to Western restaurants in terms of thefive service quality dimensions, customer satisfaction and loyalty.Tangibles was the highest rated quality dimension for Western restaurants.This is not surprising given that many Western restaurants in Malaysiahave sophisticated and unique décor consistent with their image and thetype of cuisine served. However, customers seemed less impressed withthe levels of empathy in Western restaurants. This implies that employeesof these restaurants could do more to demonstrate better understandingand concern for customers’ needs. The findings also show that customershave better impressions of the service in Western restaurants (meanservice quality rating of 5.17) compared to local restaurants (mean servicequality rating of 4.77). The reliability dimension for local restaurants wasgiven the highest mean perception scores followed by tangibles, whilethe lowest mean score was for empathy. Just like in Western restaurants,Malaysian customers want more caring and personalized attention fromthe employees of local restaurants.
Further analysis of local restaurants (Table 6) reveals that Chineserestaurants have higher overall service quality perception ratings comparedto other local restaurants. Chinese restaurants were also significantlymore highly rated in terms of tangibles, assurance and reliability as well
Table 5: Restaurant Service Quality by Western and Local Restaurant
Means byVariables and Items Restaurant Type T P Value
Western Local
Service Quality 5.17 4.77 4.216* 0.000Tangibles 5.31 4.83 4.562* 0.000Reliability 5.24 4.93 2.658* 0.008Responsiveness 5.11 4.73 2.892* 0.004Assurance 5.10 4.69 3.733* 0.000Empathy 4.91 4.64 2.374* 0.018
Price of Food 5.08 4.98 0.664 0.507Product Variety 5.25 5.03 1.378 0.169Customer Satisfaction 5.53 5.18 2.354* 0.019Customer Loyalty 5.34 4.94 2.870* 0.004
* Significant difference at P = 0.05 level (2-tailed)
Artkel 3.pmd 3/30/10, 10:57 AM43

44
Social and Management Research Journal
as product variety and customer loyalty. Nevertheless, all the three typesof restaurants scored the highest in terms of product variety as comparedto service quality and price. Western restaurants were rated higher onservice quality compared to price. Such a result is expected as Westernrestaurants generally charge much higher prices than local restaurantswhile trying to deliver higher standards of service, a strategy which isconsistent with their image and positioning as fine-dining establishments.On the other hand, Chinese restaurants received higher ratings on pricethan service quality. This is reflective of the fact that in Chineserestaurants, service quality is generally less of a concern compared tothe quality of the food and affordability of the prices.
The correlations of the various variables were also examined in thestudy (Table 7). The correlations among the various restaurant servicequality dimensions were moderate (0.54 - 0.75, less than 0.8) and thusshowing no multi-collinearity problem (for regressions). The dimensionshave stronger correlations with the overall service quality perception,implying a satisfactory convergent validity in measuring the construct ofthe customer-perceived restaurant service quality. This indicates that alldimensions are important and need to be emphasized by restaurants inorder to deliver quality service. The individual dimensions were alsosignificantly correlated with overall customer satisfaction and loyalty,although the correlations with customer loyalty were relatively weakeron the whole. The overall customer-perceived service quality wasmoderately correlated (0.67) with overall customer satisfaction.
Table 6: Further Analysis of Restaurant Service Quality by Restaurant Type
Means by RestaurantVariables Type F P Value
Western Chinese Others
Service Quality 5.17 4.79 4.74 9.179* 0.000Tangibles 5.31 4.90 4.75 11.533* 0.000Reliability 5.24 4.96 4.89 3.793* 0.023Responsiveness 5.11 4.73 4.73 4.251* 0.015Assurance 5.10 4.70 4.67 7.143* 0.001Empathy 4.91 4.54 4.72 4.122* 0.017
Price of Food 5.08 5.12 4.83 1.788 0.169Product Variety 5.25 5.23 4.83 3.828* 0.023Customer Satisfaction 5.53 5.21 5.14 2.932 0.055Customer Loyalty 5.34 5.06 4.83 5.389* 0.005
* Significant difference at P = 0.05 level (2-tailed)
Artkel 3.pmd 3/30/10, 10:57 AM44

45
Customers’ Perception of Restaurant Service Quality
Table 7: Correlations Among Restaurant Service Quality, CustomerSatisfaction and Loyalty
Service Quality Dimensions TAN REL RES ASS EMP SQ
Tangibles Reliability 0.62Responsiveness 0.60 0.75Assurance 0.68 0.60 0.72Empathy 0.54 0.60 0.61 0.65
Overall Service Quality 0.89 0.81 0.83 0.87 0.77Overall Customer Satisfaction 0.60 0.58 0.52 0.56 0.51 0.67Customer Loyalty 0.51 0.55 0.58 0.58 0.54 0.64
Note: All correlations are significant at 0.01 level (2-tailed)
Conclusions and Implications
This exploratory study has discovered that the customer-perceivedrestaurant service quality of restaurants in the Malaysian sample wasperceived to be satisfactory on the whole. The 342 customers surveyedin this study indicated that they were satisfied with the service, price andvariety of food served. Levels of customer loyalty were also relativelyhigh. Although restaurants serving Western cuisine were more highlyrated in terms of service quality, they were not perceived to be significantlybetter in terms of price charged and variety of food served. In terms ofthe measurement instrument, the adapted DINESERV scale was foundto be a reliable scale for measuring restaurant service quality. Thiscontextual survey in Malaysia has therefore contributed to furthervalidation of the reliability of the scale developed by Stevens et al. (1995).
The study also highlights the areas of improvement for the variousethnic restaurants. All the types of restaurants had the lowest scores onempathy. This shows that customers still want more caring andpersonalized service. Local restaurants were rated significantly lowerthan Western restaurants on all dimensions of service quality as well ascustomer satisfaction and loyalty. There is therefore still ample room forimprovement of restaurant service quality in these establishments.
Customer-perceived restaurant service quality in this study wassignificantly linked to customer satisfaction and customer loyalty. Thisreinforces the idea that it is important for restaurants to provide qualityservice in order to retain customers. For this, all the dimensions of service
Artkel 3.pmd 3/30/10, 10:57 AM45

46
Social and Management Research Journal
quality need management attention as they all contribute towardscustomers’ perceptions of restaurant service quality.
Limitations
This study has various limitations that could be addressed in futureresearch. The sample should cover a wider spectrum of foodservicecustomers such as working adults and tourists to provide betterrepresentation. A longitudinal study will serve to establish causality amongfoodservice quality, customer satisfaction and customer loyalty. Therestaurant service quality construct also needs to be more comprehensivelydefined and operationalised to enable more effective measurement ofperformance in the foodservice industry. Finally, the use of appropriatequalitative research such as focus groups is recommended to providemore in-depth understanding of the restaurant service quality constructin a multi-ethnic country such as Malaysia.
Acknowledgement
The contributions of Berken Gill Naga and Deskandar Morjidi in termsof data collection and data entry are hereby acknowledged.
References
Arasli, H., Mehtap-Smadi, S. and Katircioglu, S. T. (2005). Customerservice quality in the Greek Cypriot banking industry. ManagingService Quality, 15(1), 41-56.
Babakus, E. and Boller, G. W. (1992). An empirical assessment of theSERVQUAL scale. Journal of Business Research, 24, 253-268.
Babin, B. J., Lee, Y. K., Kim, E. J. and Griffin, M. (2005). Modelingconsumer satisfaction and word-of-mouth: restaurant patronage inKorea. Journal of Services Marketing, 19(3), 133-139.
Bojanic, D. C. and Rosen, L. D. (1994). Measuring service quality inrestaurants: An application of the SERVQUAL instrument.Hospitality Research Journal, 18(1), 3-14.
Artkel 3.pmd 3/30/10, 10:57 AM46

47
Customers’ Perception of Restaurant Service Quality
Boulding, W., Kalra, A., Staelin, R. and Zeithaml, V. A. (1993). A dynamicprocess model of service quality: From expectations to behavioralintentions. Journal of Marketing Research, 30 (February), 7-27.
Bourke, J. R. and Bates, E. J. (2002). Health concerns ‘drive’ foodservicepackaging. New Food, 5(3), 80-82.
Brysland, A. and Curry, A. (2001). Service improvements in public servicesusing SERVQUAL. Managing Service Quality, 11(6), 389-401.
Carman, J. M. (1990). Consumer perceptions of service quality: Anassessment of the SERVQUAL dimension. Journal of Retailing,66 (1), 33-55.
Cronin, J. J. and Taylor, S. A. (1992). Measuring service quality: Areexamination and extension. Journal of Marketing, 56 (July),55-68.
Cronin, J. J., Brady, M. K., and Hult, G. T. M. (2000). Assessing theeffects of quality, value, and customer satisfaction on consumerbehavioral intentions in service environments. Journal of Retailing,76(2), 193-218.
Dwyer, L., Forsyth, P., Rao, P. and Valerio, P. (1998). How pricecompetitive is Australian tourism? Progress in Tourism andHospitality Research. Proceedings of the Eighth AustralianTourism and Hospitality Research Conference, Queensland,Australia, 717-729.
Heung, V. C. S., Wong, M. Y. and Qu, H. (2000). Airport-restaurantservice quality in Hong Kong. Cornell Hotel and RestaurantAdministration Quarterly, 41(3), 86-96.
Jabnoun, N. and Khalifa, A. (2005). A customized measure of servicequality in the UAE. Managing Service Quality, 15(4), 374-388.
Johns, N. and Tyas, P. (1996). Use of service quality gap theory todifferentiate between foodservice outlets. The Service IndustriesJournal, 16(3), 321-346.
Artkel 3.pmd 3/30/10, 10:57 AM47

48
Social and Management Research Journal
Johnson, W. and Sirikit, A. (2002). Service quality in the Thaitelecommunication industry: a tool for achieving a sustainablecompetitive advantage. Management Decision, 40(7), 693-701.
Kassim, N. M. and Bojei, J. (2002). Service quality: gaps in the Malaysiantelemarketing industry. Journal of Business Research, 55, 845-852.
Kilbourne, W. E., Duffy, J. A., Duffy, M. and Giarchi, G. (2004). Theapplicability of SERVQUAL in cross-national measurements ofhealth-care quality. Journal of Services Marketing, 18(7), 524-533.
Kim, W. G., Ng, C. Y. N. and Kim, Y. (2009). Influence of institutionalDINESERV on customer satisfaction, return intention, and word-of-mouth. International Journal of Hospitality Management, 28,10-17.
Kivela, J., Inbakaran, R. and Reece, J. (2000). Consumer research in therestaurant environment. Part 3: analysis, findings and conclusions.International Journal of Contemporary HospitalityManagement, 12(1), 13-30.
Knutson, B., Stevens, P. and Patton, M. (1995). DINESERV: Measuringservice quality in quick service, casual/theme and fine diningrestaurants. Journal of Hospitality and Leisure Marketing, 3(2),35-44.
Lee, S. H., Kim, Y. P., Hemmington, N. and Yun, D. K. (2004). Competitiveservice quality improvement (CSQI): a case study in the fast-foodindustry. Food Service Technology, 4, 75-84.
Lovelock, C. (2001). Services Marketing: People, Technology,Strategy, 4th Edition, Prentice-Hall International, USA.
Mangold, W. G. and Babakus, E. (1991). Service quality: The front-stagevs. the back-stage perspective. The Journal of Services Marketing,5(4), 59-70.
Artkel 3.pmd 3/30/10, 10:57 AM48
49
Customers’ Perception of Restaurant Service Quality
Nunnally, J. C. and Bernstein, I. H. (1994). Psychometric Theory, 3rd
ed. New York: McGraw-Hill, Inc.
Parasuraman, A., Berry, L. L. and Zeithaml, V. A. (1985). A ConceptualModel of Service Quality and Its Implications for Future Research.Journal of Marketing, 49 (Fall), 41-50.
Parasuraman, A., Berry, L. L. and Zeithaml, V. A. (1988). SERVQUAL:A multiple-item scale for measuring consumer perceptions of servicequality. Journal of Retailing, 64 (Spring), 12-40.
Qin, H. and Prybutok, V. R. (2009). Service quality, customer satisfaction,and behavioral intentions in fast-food restaurants. InternationalJournal of Quality and Service Sciences, 1(1), 78-95.
Qu, H. (1997). Determinant factors and choice intention for Chineserestaurant dining: A multivariate approach. Journal of Restaurantand Foodservice Marketing, 2(2), 35-49.
Stevens, P., Knutson, B. and Patton, M. (1995). DINESERV: A tool formeasuring service quality in restaurants. Cornell Hotel andRestaurant Administration Quarterly, 36(2), 56-60.
Soriano, D. R. (2002). Customers’ expectations factors in restaurants:The situation in Spain. International Journal of Quality andReliability Management, 19(8/9), 1055-1067.
Soutar, G. and McNeil, M. (1996). Measuring service quality in a tertiaryinstitution. Journal of Educational Administration, 34(1), 72-82.
Tam, J. L. M. (2004). Customer satisfaction, service quality and perceivedvalue: An integrative model. Journal of Marketing Management,20, 897-917.
Teas, R. K. (1993). Expectations, performance evaluation, and consumers’perceptions of quality. Journal of Marketing, 57 (October), 18-34.
Artkel 3.pmd 3/30/10, 10:57 AM49

50
Social and Management Research Journal
Winsted, K. F. (2000). Service behaviours that lead to satisfied customers.European Journal of Marketing, 34(3/4), 399-417.
Yun, L. L. and Hing, N. (1995). Measuring quality in restaurant operations:an application of the SERVQUAL instrument. InternationalJournal of Hospitality Management, 14(3/4), 293-310.
Zeithaml, V. A., Berry, L. L. and Parasuraman, A. (1996). The behavioralconsequences of service quality. Journal of Marketing, 60 (April),31-46.
Zopiatis, A. and Pribic, J. (2007). College students’ dining expectations inCyprus. British Food Journal, 109(10), 765-776.
Artkel 3.pmd 3/30/10, 10:57 AM50