Embed Size (px)
Citation preview
Zahid, Noosheen (2014) Developing chitosan based green fungicides to control pre- and postharvest anthracnose of dragon fruit. PhD thesis, University of Nottingham.
Access from the University of Nottingham repository: http://eprints.nottingham.ac.uk/14357/1/Noosheen_Final_Thesis.pdf
Copyright and reuse:
The Nottingham ePrints service makes this work by researchers of the University of Nottingham available open access under the following conditions.
This article is made available under the University of Nottingham End User licence and may be reused according to the conditions of the licence. For more details see: http://eprints.nottingham.ac.uk/end_user_agreement.pdf
For more information, please contact [email protected]
DEVELOPING CHITOSAN BASED GREEN FUNGICIDES TO CONTROL PRE- AND POSTHARVEST ANTHRACNOSE OF DRAGON FRUIT
By
Noosheen Zahid
A thesis submitted in fulfilment of the requirement for the degree of
Doctor of Philosophy
School of Biosciences, Faculty of Science
THE UNIVERSITY OF NOTTINGHAM MALAYSIA CAMPUS
AUGUST, 2013

ii
DEDICATION
I dedicate this humble effort to my Parents and loving
Husband whose support has been a great source of
motivation and inspiration
iii
ABSTRACT
DEVELOPING CHITOSAN BASED GREEN FUNGICIDES TO CONTROL PRE AND POST HARVEST ANTHRACNOSE OF DRAGON FRUIT
A study was conducted to develop an ecofriendly and sustainable
fungicide based on submicron chitosan dispersions using low molecular
weight chitosan and locally prepared chitosan. The physicochemical
properties of both submicron dispersions were determined and their
antimicrobial effect on Colletotrichum gloeosporioides was also investigated.
The antifungal effect was further demonstrated by the production of fungal
cell wall degrading enzymes and by the production of defence related
enzymes in the plants along with the effect of submicron chitosan dispersions
on the vegetative growth of plants. The effect of submicron chitosan
dispersions on biochemical and physiological responses of dragon fruit
during storage at 10 ± 2 °C and 80 ± 5% relative humidity for 28 days was
also investigated.
In vitro antifungal activity of submicron chitosan dispersions showed that
low molecular weight chitosan has better antifungal properties than the
locally prepared chitosan and therefore was selected for further studies.
However, 600 nm droplets of 1.0% chitosan showed promising results in
terms of suppressing mycelial growth (90.2%), conidial germination (93.1%)
and reducing dry weight of mycelium (37.9%). Similarly, in vivo studies
showed that the 600 nm droplets of 1.0% chitosan helped to reduce the
disease incidence by up to 33.0 %.
Beside the direct antifungal effect, this study suggests that the submicron
chitosan dispersions enhanced host resistance through the production of
iv
defence related compounds, such as total phenols, peroxidase (PO),
polyphenol oxidase (PPO), phenylalanine ammonia lyase (PAL) and also the
activity of pathogenesis related proteins, such as β, 1-3 glucanase and
chitinase. Treatments with submicron chitosan dispersions as 600 nm
droplets of 1.0% chitosan showed more vigorous growth of plants as
compared to the control.
The submicron chitosan dispersions with 600 nm droplets of 1.0%
chitosan helped to reduce the incidence of disease on fruit by up to 94% as
compared to the control. The biochemical and physiological studies of dragon
fruit after 28 days of storage showed that weight loss of the fruit treated with
600 nm droplets of 1.0% chitosan compared with the control reduced two fold
but this was not significantly different from the conventional chitosan. The
same trend was observed in all the parameters tested, including antioxidant
activity. Control of disease using submicron chitosan dispersions has the
potential to add market value to fresh produce.
The findings from all the experiments showed that 600 nm droplets of
1.0% chitosan help to reduce anthracnose in the field and also during
postharvest storage. Thus, 600 nm droplets of 1.0% chitosan could be used
commercially in fields of dragon fruit as a green fungicide. Being non-toxic
and biodegradable, chitosan has the potential to become an alternative to
synthetic fungicides for protecting fruit crops and thus assisting sustainable
agriculture.

v
ACKNOWLEDGEMENTS
Up and above, everything, all gratitude to Almighty Allah, the
compassionate, the merciful, who enabled me to elucidate a drop from the
existing ocean of knowledge, and the Holy Prophet Muhammad (peace be
upon him) the most perfect and exalted among and even of ever born on the
surface of earth, who is, far ever a torch of guidance and knowledge for the
humanity as a whole.
I am highly obliged to my worthy supervisor Dr. Asgar Ali, Professor and
Director of Centre of Excellence for Postharvest Biotechnology (CEPB),
School of Biosciences, The University of Nottingham Malaysia Campus, for
his pleasing temperament, personal interest, inspiring guidance, enlightened
supervision and constructive criticism throughout the course of this research
endeavor. I could not have imagined having a better advisor and mentor for
my Ph D studies.
I wish to express my deep sense of gratitude to my Co-supervisor Dr.
Sivakumar Manickam, Professor in Department of Chemical and
Environmental Engineering, The University of Nottingham Malaysia Campus,
for his keen interest, kind cooperation, scholastic guidance and precious
suggestions throughout the course of my research.
I also wish to express my deep sense of gratitude to my Co-supervisor
Dr. Yasmeen Siddiqui, Senior Lecturer, University Putra Malaysia, for her
insight full comments and precious suggestions during my research.
In addition I would like to thank Dr. Ajit Singh, Associate Professor,
School of Biosciences, The University of Nottingham, Malaysia Campus who

vi
introduced me to the statistical programme and taught me from the basics of
statistics.
I like to articulate my humble gratitude to my internal assessor Dr. Peter
G. Alderson, Associate Professor, School of Biosciences, The University of
Nottingham Sutton Bonington Campus, United Kingdom.
Furthermore, I would also like to thank the Chief Lab Technician, Mr. Wan
Ghani and other lab technicians, Ms. Radha, Ms. Siti Norazlin, Ms.
Shankari, for providing me the required equipments and materials, to
complete this task and Ms. Filzah, for providing guidance during SEM
studies. A special thanks goes to my exquisite fellows Dr. Ong Mei Kying,
Ms. Nurul Aalya Alwi, Ms. Maysoun, Mr. Wei Keat and Faculty Office Staff
Ms. Sabariah and Mr. Marcus for their assistance and help during my PhD
programme.
The most profound thanks go to the Ministry of Agriculture,
Government of Malaysia (MOA) represented by The University of
Nottingham Malaysia Campus, for providing me the Research Assistantship
(RA) and financial support under the project grant (05-02-12-SF1003).
I would like to express my weighty esteem and appreciation to my
sweetest daughter Doa Fatima and dearest son Mohammad Afnan Mehdi
for their serenity and patience during the entire phase of my studies.
I do not have words at command to express my gratitude and profound
admiration to my dearest parents, venerated brother Mr. Aafaq Zahid and
valued in laws for their spiritual and intellectual inspiration and moral support
which made it possible for me to achieve the present knowledge in my life
and wished to see me glittering high in the skies of success.
vii
SUPERVISORY COMMITTEE
The thesis submitted to the School of Biosciences, Faculty of Science, The
University of Nottingham Malaysia Campus has been accepted as fulfilment
of the requirement for the degree of Doctor of Philosophy. The members of
the Supervisory Committee are as follows:
Asgar Ali, PhD
Professor
Director of Centre of Excellence for Posthravest Biotechnology (CEPB)
School of Biosciences
The University of Nottingham Malaysia Campus
(Principal Supervisor)
Sivakumar Manickam, PhD
Professor of Chemical and Nanopharmaceutical Process Engineering,
Faculty of Engineering
The University of Nottingham Malaysia Campus
(Co-supervisor)
Yasmeen Siddiqui, PhD
Senior Lecturer
Laboratory of Food Crops, Institute of Tropical Agriculture
Universiti Putra Malaysia, Serdang
(Co-supervisor)

viii
DECLARATION
I hereby declare that the thesis is based on my original work except for the
quotations and citations which have been duly acknowledged. I also declare
that it has not been previously or concurrently submitted for any other degree
at the University of Nottingham Malaysia Campus or other institutions.
_______________ NOOSHEEN ZAHID Date:
ix
TABLE OF CONTENTS Page DEDICATION ABSTRACT ACKNOWLEDGEMENTS SUPERVISORY COMMITTEE DECLARATION TABLE OF CONTENTS LIST OF TABLES LIST OF FIGURES FIELD PLOT DESIGN LIST OF ABBREVIATIONS
ii iii v vii viii ix xv xvi xxi xxii
CHAPTER
1. INTRODUCTION 1.1 Hypothesis 1.2 Research objectives
1 5 6
2. LITERATURE REVIEW 7 2.1 Dragon fruit 2.2 Anthracnose 2.3 Techniques used to control pre harvest
anthracnose of fruit plants 2.3.1 Crop rotation and other cultural practices 2.3.2 Chemical control 2.3.3 Biological control
2.4 Techniques used to control postharvest anthracnose 2.4.1 Physical control 2.4.2 Chemical control 2.4.3 Natural compounds
2.5 Chitosan 2.5.1 Antifungal properties of chitosan 2.5.2 Chitosan as an elicitor of response mechanisms 2.5.3 Mode of action of chitosan 2.5.4 Chitosan as an edible coating
2.6 Submicron chitosan dispersions 2.6.1 Formation of submicron dispersions 2.6.2 Applications of submicron dispersions
7 9
11
12 13 13 16 16 17 17 18 19 22 29 30 31 32 33
3. PRELIMINARY STUDY FOR SCREENING OF CHITOSAN,
PREPARATION OF SUBMICRON CHITOSAN DISPERSIONS AND THEIR PHYSICOCHEMICAL PROPERTIES
36
3.1 Introduction 3.2 Materials and methods for screening of different types of
conventional chitosan against C. gloeosporioides 3.2.1 Materials 3.2.2 Isolation of C. gloeosporioides and preparation
of inoculum
36 38
38 38
x
3.2.3 Pathogenicity test 3.2.4 Preparation of conventional chitosan solution 3.2.5 In vitro antifungal assay of conventional
chitosan against C. gloeosporioides isolated from dragon fruit plants 3.2.5.1 Inhibition in radial mycelial growth 3.2.5.2 Conidial germination inhibition test 3.2.5.3 Dry weight of mycelium 3.2.5.4 Viability of spores
3.3 Methods for the preparation of submicron chitosan dispersions
3.3.1 Physicochemical analysis of submicron chitosan dispersions 3.3.1.1 Zeta potential and stability
determination 3.3.1.2 Measurement of viscosity 3.3.1.3 Determination of pH 3.3.1.4 Release of chitosan from submicron
dispersions 3.4 Statistical analyses 3.5 Results and discussion
3.5.1 Isolation and identification of C. gloeosporioides from dragon fruit plants
3.5.2 Pathogenicity test 3.5.3 Effect of chitosan on radial mycelial growth of
C. gloeosporioides 3.5.4 Effect of chitosan on conidial germination of
C. gloeosporioides 3.5.5 Effect of different types of chitosan on dry
weight of mycelium and spore viability of C. gloeosporioides
3.6 Formation of submicron chitosan dispersions 3.6.1 Physicochemical properties of submicron
chitosan dispersions 3.6.1.1 Zeta potential 3.6.1.2 Stability 3.6.1.3 Viscosity and pH 3.6.1.4 Release of chitosan from submicron
dispersions
39 40 40
40 41 41 42 42
43
43
43 44 44
45 46 46
48 49
51
53
56 58
58 60 63 65
xi
4. PREHARVEST ANTIFUNGAL EFFECTS OF SUBMICRON
CHITOSAN DISPERSIONS ON DRAGON FRUIT PLANTS 68
4.1 Introduction 4.2 Materials and methods
4.2.1 Inhibition in radial mycelial growth 4.2.2 Conidial germination inhibition test of C.
gloeosporioides 4.2.3 Dry weight of mycelium and viability of spores
4.3 Methods for in vitro production of hydrolytic enzymes by C. gloeosporioides 4.3.1 Extraction of cellulolytic enzymes
4.3.1.1 β-galactosidase 4.3.1.2 β-1, 4-glucanase
4.3.2 Extraction of pectinolytic enzymes 4.3.2.1 Polygalacturonase activity 4.3.2.2 Pectin lyase activity
4.4 Preliminary field trial to screen potential treatments 4.4.1 Plant material and experimental site preparation
4.4.1.1 Fertilizer applications 4.4.1.2 Water management
4.4.2 Disease incidence 4.4.3 Area under disease progress curve 4.4.4 Disease severity
4.5 Results and discussion 4.5.1 Effect of different types of submicron chitosan
dispersions on in vitro growth of C. gloeosporioides 4.5.1.1 Percent inhibition in radial mycelial
growth of C. gloeosporioides 4.5.1.2 Percent inhibition in conidial
germination of C. gloeosporioides 4.5.1.3 Effect of submicron chitosan
dispersions on dry weight of mycelium and spore viability of C. gloeosporioides
4.5.2 Effect of submicron chitosan dispersions on the activity of cellulose degrading enzymes
4.5.3 Effect of submicron chitosan dispersions on the activity of pectin degrading enzymes
4.5.4 Effect of conventional chitosan and submicron chitosan dispersions on anthracnose of dragon fruit plants 4.5.4.1 Disease incidence 4.5.4.2 Disease severity
68 70 70 70
70 71
71 71 72 73 74 74 75 75 75 76 78 78 79 80 80
80
85
90
95
98
102
102 106
xii
5. MECHANISM OF SUPRESSION OF Colletotrichum gloeosporioides, THE CAUSAL ORGANISM OF ANTHRACNOSE IN DRAGON FRUIT PLANTS
109
5.1 Introduction 5.2 Materials and methods
5.2.1 Determination of disease incidence and area under disease progress curve
5.2.2 Determination of lignin compounds 5.2.3 Penetration of conventional chitosan and
submicron chitosan dispersions inside the plants and determination of total phenolic contents
5.2.4 Determination of enzymatic activities 5.2.4.1 Extraction of peroxidase and
polyphenol oxidase 5.2.4.1.1 Assay of peroxidase
(PO) activity 5.2.4.1.2 Assay of polyphenol
oxidase (PPO) activity 5.2.4.2 Extraction and assay of
phenylalanine ammonia-lyase (PAL) activity
5.2.4.3 Extraction of β- 1,3-glucanase and chitinase 5.2.4.3.1 Assay of β 1,3-
glucanase activity 5.2.4.3.2 Assay of chitinase
activity 5.2.4.4 Determination of vegetative growth
of dragon fruit plants 5.2.4.5 Chlorophyll content
5.3 Results and discussion 5.3.1 Disease incidence 5.3.2 Effect of conventional chitosan and
submicron chitosan dispersions on lignin induction
5.3.3 Penetration of chitosan inside dragon fruit plants and its effects on total phenolic
5.3.4 Effect of conventional chitosan and submicron chitosan dispersions on enzymatic activities 5.3.4.1 Peroxidase (PO) activity 5.3.4.2 Polyphenol oxidase (PPO) activity 5.3.4.3 Effect of conventional chitosan and
submicron chitosan dispersions on phenylalanine ammonia lyase (PAL) activity
109 112 114
114 115
116 116
116
117
117
118
118
119
120
120 121 121 123
126
132
132 136 140
xiii
5.3.4.4 Effect of conventional chitosan and submicron chitosan dispersions on β- 1,3- glucanase and chitinase activity
5.3.5 Effect of chitosan on the growth of plants 5.3.6 Effect of chitosan on chlorophyll content of
dragon fruit plants
144
150 153
6. EFFECT OF SUBMICRON CHITOSAN DISPERSIONS ON POSTHARVEST ANTHRACNOSE OF DRAGON FRUIT DURING STORAGE
156
6.1 Introduction 6.2 Material and methods
6.2.1 In vitro antifungal assay of conventional chitosan and submicron chitosan dispersions
6.2.1.1 Inhibition of mycelial growth and conidial germination
6.2.1.2 Scanning electron microscopy 6.2.2 In vivo antifungal assay of conventional chitosan
and submicron chitosan dispersions 6.2.2.1 Disease incidence 6.2.2.2 Disease severity
6.3 Results and discussion 6.3.1 Inhibition in radial mycelial growth 6.3.2 Conidial germination inhibition test 6.3.3 Scanning electron microscopy 6.3.4 In vivo antifungal effect of conventional chitosan
and submicron chitosan dispersions
7. EFFECT OF SUBMICRON CHITOSAN DISPERSIONS ON PHYSICO-CHEMICAL CHARACTERISTICS AND ANTIOXIDANT PROPERTIES OF DRAGON FRUIT DURING STORAGE
7.1 Introduction 7.2 Materials and methods
7.2.1 Fruit samples 7.2.2 Coating solutions 7.2.3 Physicochemical quality changes in fruit coated
with conventional chitosan and submicron chitosan dispersions
7.2.3.1 Sample preparation 7.2.3.2 Determination of physical quality 7.2.3.3 Determination of chemical quality 7.2.3.4 Determination of antioxidants
7.2.4 Gaseous exchange analysis 7.2.4.1 Determination of respiration rate 7.2.4.2 Determination of ethylene evolution
7.3 Results and discussion 7.3.1 Physical quality of fruit treated with conventional
chitosan and submicron chitosan dispersions
156 158 158
158
158 159
159 159 161 161 162 164 166
169
169 171 171 171 172
172 172 173 174 176 176 176 178 178
xiv
7.3.1.1 Weight loss 7.3.1.2 Fruit firmness
7.3.2 Chemical quality of fruit treated with conventional chitosan and submicron chitosan dispersions
7.3.2.1 Soluble solids concentration 7.3.2.2 Titratable acidity
7.3.3 Antioxidants capacity of fruit treated with conventional chitosan and submicron chitosan dispersions
7.3.3.1 Total phenolic content 7.3.3.2 Total flavonoids 7.3.3.3 Lycopene 7.3.3.4 Total antioxidant activit
7.3.4 Gaseous exchange analysis 7.3.4.1 Respiration rate 7.3.4.2 Ethylene evolution
178 180 182
182 183 185
185 186 187 189 191 191 191
8. CONCLUSION
194
REFERENCES APPENDICES BIODATA OF THE AUTHOR LIST OF PUBLICATIONS
196 227
255 256
xv
LIST OF TABLES
Table Title Page
3.1 Time of sonication (min) to obtain different droplet sizes at various concentrations of chitosan.
57
3.2 Zeta potential (mV) of different droplet sizes and various concentrations of chitosan.
59
3.3 Stability (days) of droplet sizes at various concentrations of chitosan.
61
3.4 Viscosity (cp) of different droplet sizes and various concentrations of chitosan.
64
3.5 Release of chitosan (mg ml-1) from submicron chitosan dispersions at various droplet sizes and chitosan concentrations.
66
4.1 Physicochemical characteristics of Serdang Series soil of Universti Putra Malaysia.
76
4.2 Effect of conventional chitosan and submicron chitosan dispersions on disease incidence (%) of dragon fruit plants.
103
4.3 Effect of conventional chitosan and submicron chitosan dispersions on disease incidence (%) and area under disease progress curve (AUDPC) of dragon fruit plants, 90 days after inoculation with C. gloeosporioides.
104
4.4 Effect of conventional chitosan and submicron chitosan dispersions on disease severity (score) and disease severity (%) of dragon fruit plants 90 days after inoculation with C. gloeosporioides.
107
5.1 Effect of conventional chitosan and submicron chitosan dispersions on disease severity (%) and area under disease severity curve (AUDPC) of anthracnose on dragon fruit plants, 30 days after treatment.
122
5.2 Effect of conventional chitosan and submicron chitosan dispersions on the number of shoots, stem diameter and shoot length of dragon fruit plants inoculated with C. gloeosporioides and of uninoculated plants at thirty day intervals after treatment.
151
5.3 Effect of conventional chitosan and submicron chitosan dispersions on chlorophyll a, chlorophyll b and total chlorophyll in dragon fruit plants inoculated with C. gloeosporioides and uninoculated plants at 30 day intervals after treatment.
154
6.1 Effect of chitosan and submicron chitosan dispersions on disease incidence (%) and disease severity (score) of dragon fruit during 28 days of storage at 10 ± 2 °C and 80 ± 5% RH.
168
xvi
LIST OF FIGURES
Figure Title Page
3.1 Symptoms of anthracnose on dragon fruit: a) Arrow showing anthracnose lesion on shoot, b) Arrow showing lesion on fruit, c) Pure culture of C. gloeosporioides and d) Conidia.
47
3.2 Pathogenicity test showing lesion on shoot a) 3 days and b) 10 days after inoculation.
48
3.3 Pathogenicity test showing lesions on fruit a) 2 days and b) 5 days after inoculation.
49
3.4 Effect of concentration and type of chitosan on radial mycelial growth after 10 days of incubation. The vertical bars represent the standard error of means for four replicates.
50
3.5 Effect of concentration and type of chitosan on conidial germination inhibition (%) of C. gloeosporioides. The vertical bars represent the standard error of means for four replicates.
52
3.6 Effect of concentration and type of chitosan on dry weight (g) of mycelium of C. gloeosporioides. The vertical bars represent the standard error of means for four replicates.
54
3.7 Effect of concentration and type of chitosan on spore viability (%) of C. gloeosporioides. The vertical bars represent the standard error of means for four replicates.
55
3.8 Relationship between zeta potential and stability of submicron chitosan dispersions of a) low molecular weight chitosan and b) locally prepared chitosan at P < 0.05.
62
4.1 Comparison between control and emulsifiers on mycelial growth of C. gloeosporioides.
80
4.2 Effect of submicron dispersions of a) low molecular weight chitosan and b) locally prepared chitosan on percent inhibition in radial mycelial growth after 10 days of incubation. The vertical bars represent the standard error of means for four replicates.
82
4.3 Effect of concentration and droplet size of low molecular weight submicron chitosan dispersions on mycelial growth of C. gloeosporioides.
83
4.4 Effect of concentration and droplet size of locally prepared submicron chitosan dispersions on mycelial growth of C. gloeosporioides.
83
4.5 Effect of submicron dispersions of a) low molecular weight chitosan and b) locally prepared chitosan on conidial germination inhibition (%) after seven hours of incubation. The vertical bars represent the standard error of means for four replicates.
87
xvii
4.6 Light microscopy study of germ tube of C. gloeosporioides treated with emulsifiers: a) control, b) spores treated with Brij 56, c) spores treated with Span 20 and d) spores treated with combination of Brij 56 and Span 20.
88
4.7 Light microscopy of conidia and mycelium of C. gloeosporioides treated with submicron chitosan dispersions: a) germ tube growth in control (arrow), b) treated conidia, c) hyphal agglomeration from treated conidia, d) large vesicles in treated hyphae (arrows), e) normal growth of hyphae in control.
89
4.8 Effect of submicron dispersions of a) low molecular weight chitosan and b) locally prepared chitosan on dry weight of mycelium (g). The vertical bars represent the standard error of means for four replicates.
91
4.9 Effect of submicron dispersions of a) low molecular weight chitosan and b) locally prepared chitosan on sporulation (%). The vertical bars represent the standard error of means for four replicates.
92
4.10 Effect of concentration of conventional chitosan and droplet size of submicron chitosan dispersions on β-galactosidase activity after 10 days of incubation. The vertical bars represent the standard error of means for four replicates.
96
4.11 Effect of concentration of conventional chitosan and droplet size of submicron chitosan dispersions on β-1,4-glucanase activity after 10 days of incubation. The vertical bars represent the standard error of means for four replicates.
97
4.12 Effect of concentration of conventional chitosan and droplet size of submicron chitosan dispersions on polygalacturonase activity after 10 days of incubation. The vertical bars represent the standard error of means for four replicates.
99
4.13 Effect of concentration of conventional chitosan and droplet size of submicron chitosan dispersions on pectin lyase activity after 10 days of incubation. The vertical bars represent the standard error of means for four replicates.
100
4.14 Dragon fruit plants inoculated with spore suspension of C. gloeosporioides and sprayed with conventional chitosan and submicron chitosan dispersions after 90 days of treatments. (a: Control; b: 600 nm droplets of 0.5% chitosan; c: 600 nm droplets of 1.0% chitosan; d: 600 nm droplets of 1.5% chitosan; e: 600 nm droplets of 2.0% chitosan; f: 2.0% conventional chitosan).
105
5.1 Disease incidence in dragon fruit plants treated with conventional chitosan and submicron chitosan dispersions after inoculation with C. gloeosporioides. Each value represents a mean of 3 replicates and vertical bars indicate standard errors.
122
xviii
5.2 Lignin content of dragon fruit plants treated with conventional chitosan and submicron chitosan dispersions after inoculation with C. gloeosporioides. Each value represents a mean of three replicates and vertical bars indicate standard errors.
124
5.3 Relationship between lignin content and disease incidence (%) in dragon fruit plants.
125
5.4 Visualization of dye-binded conventional chitosan and submicron chitosan dispersions inside stems of dragon fruit plants. Dye absent in a) control but visible in plants treated with b) 1.0% conventional chitosan, c) 200 nm droplets of 1.0% chitosan, d) 600 nm droplets of 1.0% chitosan and e) 1000 nm droplets of 1.0% chitosan. Stem f) showing accumulation of dye at the edge and g) stomata on the surface.
127
5.5 Total phenolic content in a) uninoculated dragon fruit plants and b) plants inoculated with C. gloeosporioides after treatment with conventional chitosan and submicron chitosan dispersions. Each value represents a mean of three replicates and vertical bars indicate standard errors.
130
5.6 Relationship between total phenolics and disease incidence in dragon fruit plants.
131
5.7 Peroxidase (PO) activity in a) uninoculated dragon fruit plants and b) plants inoculated with C. gloeosporioides treated with conventional chitosan and submicron chitosan dispersions. Each value represents a mean of three replicates and vertical bars indicate standard errors.
134
5.8 Relationship between PO content and disease incidence in dragon fruit plants.
135
5.9 Polyphenol oxidase (PPO) activity in a) uninoculated dragon fruit plants and b) plants inoculated with C. gloeosporioides treated with conventional chitosan and submicron chitosan dispersions. Each value represents a mean of three replicates and vertical bars indicate standard errors.
138
5.10 Relationship between PPO content and disease incidence in dragon fruit plants.
139
5.11 Phenylalanine ammonia lyase (PAL) activity in a) uninoculated dragon fruit plants and b) plants inoculated with C. gloeosporioides treated with conventional chitosan and submicron chitosan dispersions. Each value represents a mean of three replicates and vertical bars indicate standard errors.
142
5.12 Relationship between PAL content and disease incidence in dragon fruit plants.
143
5.13 β-1,3-glucanase activity in a) uninoculated dragon fruit plants and b) plants inoculated with C. gloeosporioides treated with conventional chitosan and submicron chitosan dispersions. Each value represents a mean of three replicates and vertical bars indicate standard errors.
146
xix
5.14 Chitinase activity in a) uninoculated dragon fruit plants and b) plants inoculated with C. gloeosporioides treated with conventional chitosan and submicron chitosan dispersions. Each value represents a mean of three replicates and vertical bars indicate standard errors.
147
5.15 Relationships between (a) β, 1-3 glucanase activity and disease incidence and (b) chitinase activity and disease incidence in dragon fruit plants.
148
6.1 Effect of concentration of chitosan and droplet size of submicron chitosan dispersions on percent inhibition of radial mycelial growth of C. gloeosporioides after 10 days of incubation. The vertical bars represent standard error of means for four replicates.
162
6.2 Effect of chitosan concentration and droplet size of submicron chitosan dispersions on conidial germination inhibition (%) of C. gloeosporioides after 7 hours of incubation. The vertical bars represent standard error of means for four replicates.
163
6.3 Scanning electron microscopy of normal conidia and conidia of C. gloeosporioides treated with submicron chitosan dispersions: a) normal hyphae, b) cluster of hyphae, c) normal conidia and d) abnormal conidia extracted from dragon fruit.
165
7.1 Effect of conventional chitosan and submicron chitosan dispersions on weight loss in dragon fruit during 28 days of storage at 10 ± 2 °C; vertical bars indicate standard errors; means of four replicates.
179
7.2 Effect of conventional chitosan and submicron chitosan dispersions on fruit firmness of dragon fruit during 28 days of storage at 10 ± 2 °C; vertical bars indicate standard errors; means of 4 replicates.
181
7.3 Effect of conventional chitosan and submicron chitosan dispersions on soluble solids concentration of dragon fruit during 28 days of storage at 10 ± 2 °C; vertical bars indicate standard errors; means of four replicates.
182
7.4 Effect of conventional chitosan and submicron chitosan dispersions on titratable acidity of dragon fruit during 28 days of storage at 10 ± 2 °C; vertical bars indicate standard errors; means of four replicates; DMRT at P < 0.05.
184
7.5 Effect of conventional chitosan and submicron chitosan dispersions on total phenolics of dragon fruit during 28 days of storage at 10 ± 2 °C; vertical bars indicate standard errors; means of four replicates.
186
7.6 Effect of conventional chitosan and submicron chitosan dispersions on total flavonoids of dragon fruit during 28 days of storage at 10 ± 2 °C; vertical bars indicate standard errors; means of four replicates.
187
xx
7.7 Effect of conventional chitosan and submicron chitosan dispersions on lycopene content of dragon fruit during 28 days of storage at 10 ± 2 °C; vertical bars indicate standard errors; means of four replicates.days of storage at 10 ± 2 °C; vertical bars indicate standard errors; means of four replicates.
188
7.8 Effect of conventional chitosan and submicron chitosan dispersions on total antioxidants of dragon fruit during 28 days of storage at 10 ± 2 °C; vertical bars indicate standard errors; means of 4 replicates.
190
7.9 Effect of conventional chitosan and submicron chitosan dispersions on (a) carbon dioxide (CO2) production (b) ethylene evolution in dragon fruit during 28 days of storage at 10 ± 2 °C; vertical bars indicate standard errors; means of four replicates.
192
xxi
FIELD PLOT DESIGN
Field Plot Title Page
4.1 Field layout for preliminary screening 77
5.1 Field layout for plant and for enzyme analysis 113
xxii
LIST OF ABBREVIATIONS
µm Micrometer
ANOVA Analysis of variance
AUDPC Area under disease progress curve
°C Celsius
Ca Calcium
CaCl2 Calcium chloride
CaO Calcium oxide
CEC Cation exchange capacity
cm Centimeters
CO2 Carbon dioxide
Cp Centipoise
CRD Completely randomized design
cv Cultivar
DD Degree of deacetylation
DI Disease incidence
DMRT Duncan multiple range test
DNA Dioxyribonucleic acid
DS Disease severity
EDS Emulsion dispersion size
Fig Figure
FRAP Ferric reducing antioxidant power
FTIR Fourier transform infrared spectroscopy
g Gram
g Gravitational force
GC Gas chromatograph
h Hour
H2O Water
H2O2 Hydrogen peroxide
HPMC Hydroxypropyl methylcellulose
HR Hypersensitive response
K Potassium
xxiii
K2O Potassium oxide
KCl Potassium chloride
kDa Kilo Dalton
kg Kilogram
l Litre
Mg Magnesium
mg Milligram
MgO Magnesium oxide
MgSo4.7H2O Magnesium sulphate heptahydrate
ml Milliliter
mm Millimeter
mM Millimolar
Mol Mole
Na2 CO3 Sodium carbonate
N Newton
N Normality
n Total number of sampled plants
Na2HPO4.7H2O Sodium monohydrogen phosphate heptahydrate
NaOH Sodium hydroxide
NH2 Amine group
nm Nanometer
OD Optical density
OH Hydroxyl group
ONGP O-nitrophenyl-β-D-galactoside
P Probability
P2O5 Phosphorus pentoxide
PAL Phenylalanine ammonia lyase
PDA Potato dextrose agar
PDB Potato dextrose broth
PIRG Percent inhibition in radial mycelial growth
OH Hydroxyl group
ONGP O-nitrophenyl-β-D-galactoside
POD Peroxidase
xxiv
ppm parts per million
PPO Polyphenol oxidase
PR Pathogenesis related
PVP Polyvinylpyrrolidone
PVPP Polyvinylpolypyrrolidone
r2 Coefficient of determination
RM Ringgit Malaysia
S.E Standard error
SAS Statistical analysis system
sp Specie
SSC Soluble solids concentration
TA Titratable acidity
TBZ Thiabendazole
TCD Thermal conductivity detector
TFA Trifluoroacetic acid
TGA Thioglycolic acid
TPTZ 2,4,6-tripyridyl-s-triazine
Tris HCl Tris hydrochloride
U enzyme unit ( ⁄
⁄
)
UK United Kingdom
UNIVARIATE One variable
USA United States of America
UV-Vis Ultraviolet – visible
v Volume
var Variety
w Weight
Z Highest rating scale
1
CHAPTER 1
INTRODUCTION
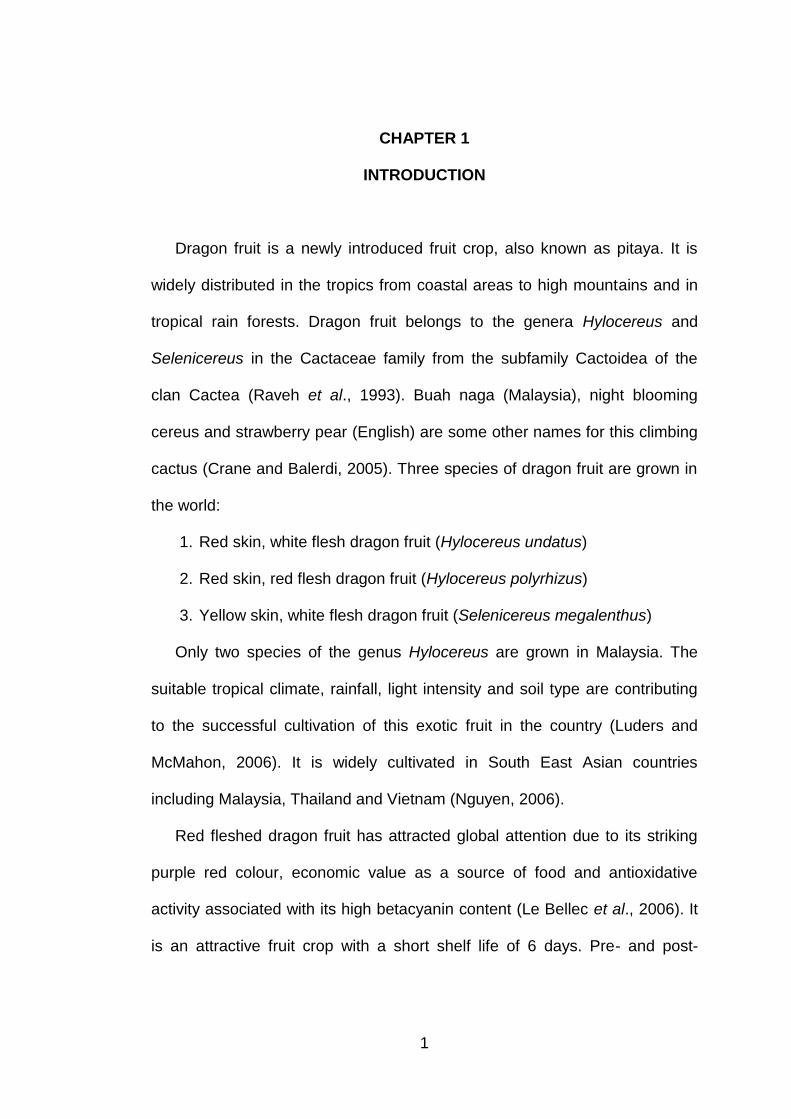
Dragon fruit is a newly introduced fruit crop, also known as pitaya. It is
widely distributed in the tropics from coastal areas to high mountains and in
tropical rain forests. Dragon fruit belongs to the genera Hylocereus and
Selenicereus in the Cactaceae family from the subfamily Cactoidea of the
clan Cactea (Raveh et al., 1993). Buah naga (Malaysia), night blooming
cereus and strawberry pear (English) are some other names for this climbing
cactus (Crane and Balerdi, 2005). Three species of dragon fruit are grown in
the world:
1. Red skin, white flesh dragon fruit (Hylocereus undatus)
2. Red skin, red flesh dragon fruit (Hylocereus polyrhizus)
3. Yellow skin, white flesh dragon fruit (Selenicereus megalenthus)
Only two species of the genus Hylocereus are grown in Malaysia. The
suitable tropical climate, rainfall, light intensity and soil type are contributing
to the successful cultivation of this exotic fruit in the country (Luders and
McMahon, 2006). It is widely cultivated in South East Asian countries
including Malaysia, Thailand and Vietnam (Nguyen, 2006).
Red fleshed dragon fruit has attracted global attention due to its striking
purple red colour, economic value as a source of food and antioxidative
activity associated with its high betacyanin content (Le Bellec et al., 2006). It
is an attractive fruit crop with a short shelf life of 6 days. Pre- and post-
2
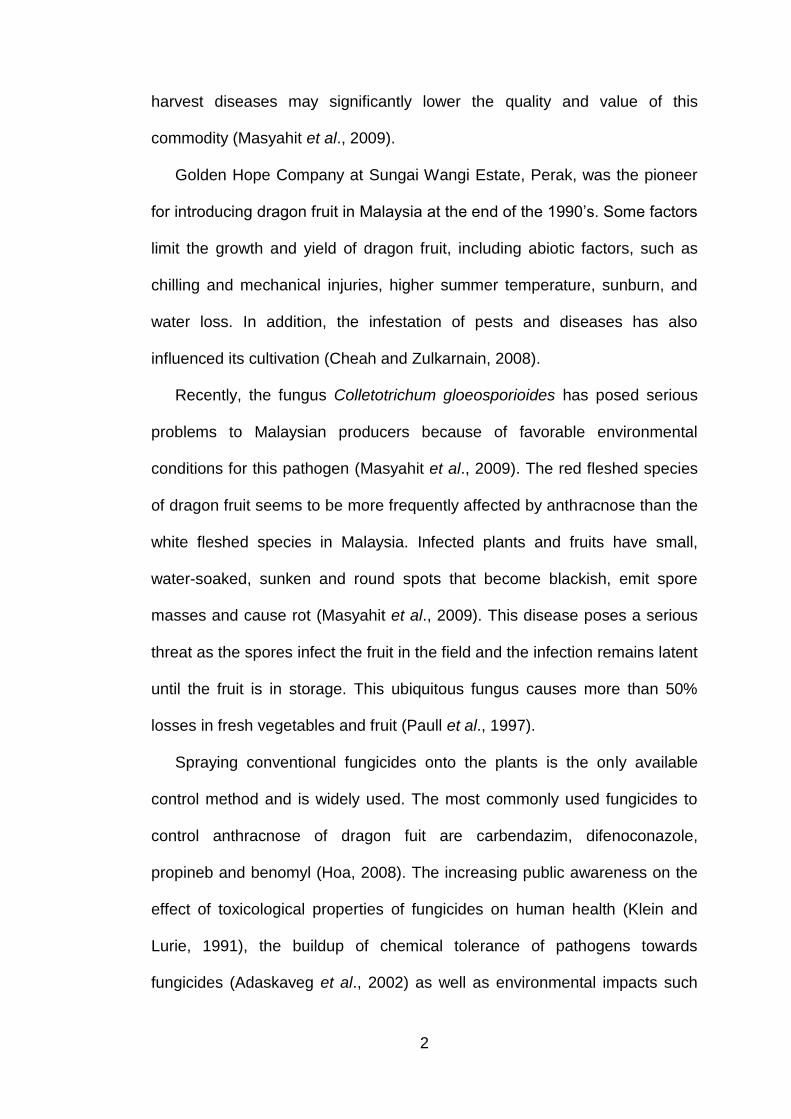
harvest diseases may significantly lower the quality and value of this
commodity (Masyahit et al., 2009).
Golden Hope Company at Sungai Wangi Estate, Perak, was the pioneer
g g M h h 99 ’ . S
limit the growth and yield of dragon fruit, including abiotic factors, such as
chilling and mechanical injuries, higher summer temperature, sunburn, and
water loss. In addition, the infestation of pests and diseases has also
influenced its cultivation (Cheah and Zulkarnain, 2008).
Recently, the fungus Colletotrichum gloeosporioides has posed serious
problems to Malaysian producers because of favorable environmental
conditions for this pathogen (Masyahit et al., 2009). The red fleshed species
of dragon fruit seems to be more frequently affected by anthracnose than the
white fleshed species in Malaysia. Infected plants and fruits have small,
water-soaked, sunken and round spots that become blackish, emit spore
masses and cause rot (Masyahit et al., 2009). This disease poses a serious
threat as the spores infect the fruit in the field and the infection remains latent
until the fruit is in storage. This ubiquitous fungus causes more than 50%
losses in fresh vegetables and fruit (Paull et al., 1997).
Spraying conventional fungicides onto the plants is the only available
control method and is widely used. The most commonly used fungicides to
control anthracnose of dragon fuit are carbendazim, difenoconazole,
propineb and benomyl (Hoa, 2008). The increasing public awareness on the
effect of toxicological properties of fungicides on human health (Klein and
Lurie, 1991), the buildup of chemical tolerance of pathogens towards
fungicides (Adaskaveg et al., 2002) as well as environmental impacts such
3
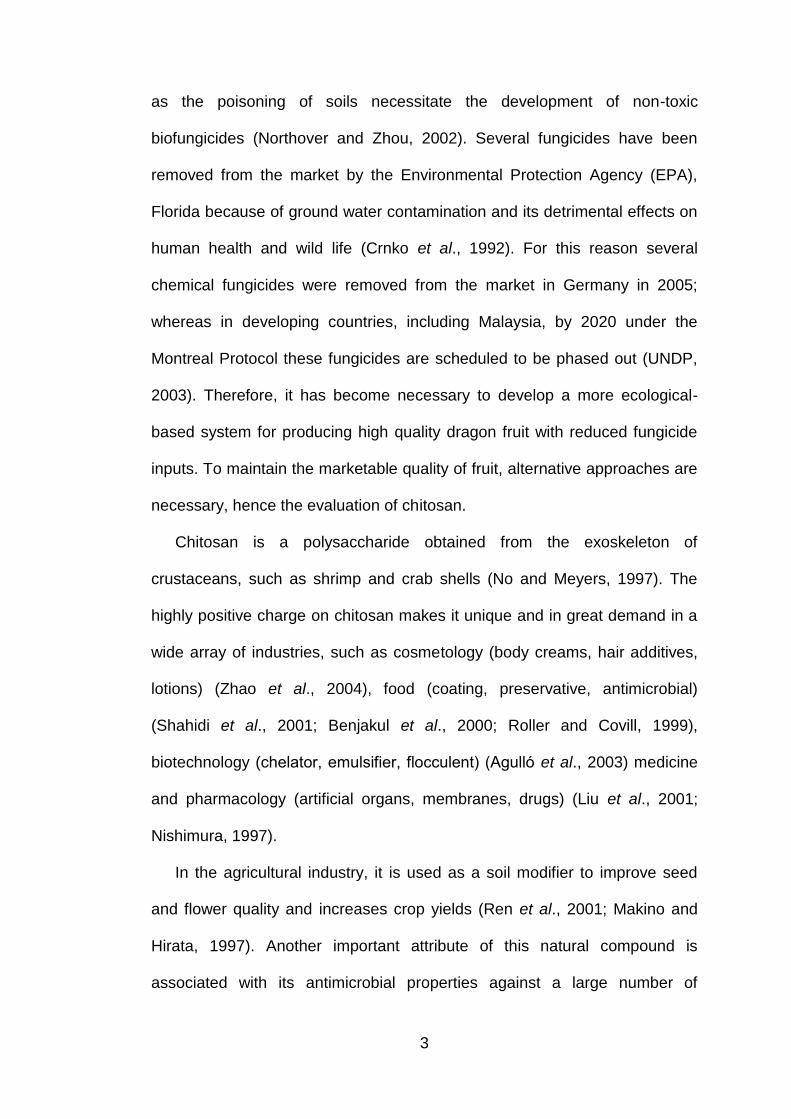
as the poisoning of soils necessitate the development of non-toxic
biofungicides (Northover and Zhou, 2002). Several fungicides have been
removed from the market by the Environmental Protection Agency (EPA),
Florida because of ground water contamination and its detrimental effects on
human health and wild life (Crnko et al., 1992). For this reason several
chemical fungicides were removed from the market in Germany in 2005;
whereas in developing countries, including Malaysia, by 2020 under the
Montreal Protocol these fungicides are scheduled to be phased out (UNDP,
2003). Therefore, it has become necessary to develop a more ecological-
based system for producing high quality dragon fruit with reduced fungicide
inputs. To maintain the marketable quality of fruit, alternative approaches are
necessary, hence the evaluation of chitosan.
Chitosan is a polysaccharide obtained from the exoskeleton of
crustaceans, such as shrimp and crab shells (No and Meyers, 1997). The
highly positive charge on chitosan makes it unique and in great demand in a
wide array of industries, such as cosmetology (body creams, hair additives,
lotions) (Zhao et al., 2004), food (coating, preservative, antimicrobial)
(Shahidi et al., 2001; Benjakul et al., 2000; Roller and Covill, 1999),
biotechnology ( h , , ) (Ag ό et al., 2003) medicine
and pharmacology (artificial organs, membranes, drugs) (Liu et al., 2001;
Nishimura, 1997).
In the agricultural industry, it is used as a soil modifier to improve seed
and flower quality and increases crop yields (Ren et al., 2001; Makino and
Hirata, 1997). Another important attribute of this natural compound is
associated with its antimicrobial properties against a large number of
4
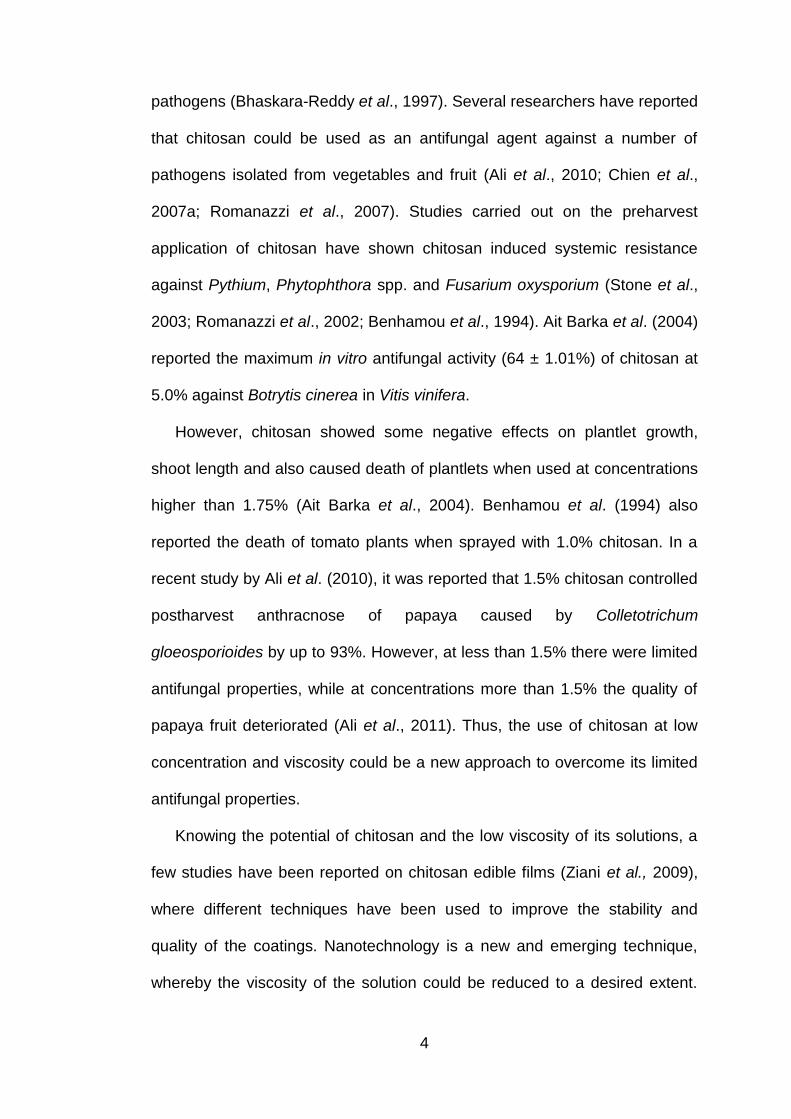
pathogens (Bhaskara-Reddy et al., 1997). Several researchers have reported
that chitosan could be used as an antifungal agent against a number of
pathogens isolated from vegetables and fruit (Ali et al., 2010; Chien et al.,
2007a; Romanazzi et al., 2007). Studies carried out on the preharvest
application of chitosan have shown chitosan induced systemic resistance
against Pythium, Phytophthora spp. and Fusarium oxysporium (Stone et al.,
2003; Romanazzi et al., 2002; Benhamou et al., 1994). Ait Barka et al. (2004)
reported the maximum in vitro antifungal activity (64 ± 1.01%) of chitosan at
5.0% against Botrytis cinerea in Vitis vinifera.
However, chitosan showed some negative effects on plantlet growth,
shoot length and also caused death of plantlets when used at concentrations
higher than 1.75% (Ait Barka et al., 2004). Benhamou et al. (1994) also
reported the death of tomato plants when sprayed with 1.0% chitosan. In a
recent study by Ali et al. (2010), it was reported that 1.5% chitosan controlled
postharvest anthracnose of papaya caused by Colletotrichum
gloeosporioides by up to 93%. However, at less than 1.5% there were limited
antifungal properties, while at concentrations more than 1.5% the quality of
papaya fruit deteriorated (Ali et al., 2011). Thus, the use of chitosan at low
concentration and viscosity could be a new approach to overcome its limited
antifungal properties.
Knowing the potential of chitosan and the low viscosity of its solutions, a
few studies have been reported on chitosan edible films (Ziani et al., 2009),
where different techniques have been used to improve the stability and
quality of the coatings. Nanotechnology is a new and emerging technique,
whereby the viscosity of the solution could be reduced to a desired extent.
5
Furthermore, innovative nanotechnology has been used successfully for
packaging of food (Traver, 2006). Submicron dispersion is the class of
emulsions where the droplet size is in the range of 200-1000 nm (Winhab et
al., 2005). These are widely used in various industries, such as in cosmetics,
pharmaceuticals, health care and agrochemicals (Sonneville-Aubrun et al.,
2004; Schulz and Daniels, 2000).
The small droplet size and high kinetic stability make submicron
dispersions suitable for efficient delivery of active ingredients (due to their
large surface area) and for penetratio h gh h “ gh” x h k
(Amselem et al., 1998). The formulation of such a sub micro carrier could
result in a slow release of chitosan so that sudden accumulation of chitosan
on the fruit surface and in the plant tissues never occurs.
So far, no study has been reported on the use of submicron chitosan
dispersions for the control of pre- and postharvest anthracnose of dragon
fruit. Therefore, this study has been aimed at developing a novel biofungicide
using submicron chitosan dispersions to control pre- and postharvest
anthracnose.
1.1 Hypothesis
The application of submicron chitosan dispersions will help control C.
gloeosporioides and supress disease of dragon fruit plants and fruit due to its
small size and low viscosity.
6
1.2 Research objectives
The main objective is to develop submicron chitosan dispersions and to
study their efficacy on pre- and postharvest anthracnose and the quality of
dragon fruit.
1. Formulation of submicron chitosan dispersions and measurement of their
physical and chemical properties.
2. To determine the antifungal activity of submicron chitosan dispersions
against anthracnose disease of dragon fruit plants.
3. To study the mechanism of action of submicron chitosan dispersions for
the control of C. gloeosporioides.
4. To evaluate the efficacy of submicron dispersions against anthracnose
disease of dragon fruit.
5. To evaluate the effect of submicron chitosan dispersions on physiological
responses, antioxidant activity and gaseous exchange analysis of dragon
fruit during cold storage.
7
CHAPTER 2
REVIEW OF LITERATURE
2.1 Dragon fruit
This epiphytic tropical cactus is known as pitaya or pitahaya (Spanish),
thang loy (Vietnamese), strawberry pear, night blooming cactus and dragon
. A Ch h “j ” wh h “ h
w b g”. I M , k w ‘b h g ’
‘b h g ’.
The true origin of dragon fruit is Mexico, Central and South America. It is
the most widely distributed cactus, and is now found in six continents.
Southeast Asian countries, such as Vietnam, Thailand, Malaysia, Taiwan and
the Southeast coast of China, are known for its cultivation. Spaniards and
Filipinos introduced this fruit in the Philippines through trading and exchange
of goods. High economic value of this fruit indicates its competitive benefit for
the local fruit industry (Teddy, 2008).
Plants of dragon fruit are epiphytic, fast growing, terrestrial, perennial and
vine-like cacti. The stem has many green, fleshy and triangular branches.
Each stem segment has three wavy spineless wings or may have 1-3 spines.
Pitaya stems form aerial adventitious roots to adhere to the surface on which
they grow. Each stem can reach a length of about 6.1 m. (Crane and Balerdi,
2005).
Some species of dragon fruit are self-incompatible, however, flowers of
some cultivars are hermaphrodite. The plant bears very large bell-shaped
flowers (23 cm wide and 36 cm long) which are extremely showy (white or
8
pink), fragrant and only receptive at night. The stamens and lobed stigmas
are cream coloured. They are usually cross-pollinated by bats, bees and
other nocturnal insects or animals. For the fruit to mature from anthesis
requires 30 to 35 days. The plant has fleshy berry fruit, which are oblong with
red or yellow skin (almost 0.31 cm thick) and scales. Fruit pulp contains
numerous small black seeds (Masyahit et al., 2009; Chien et al., 2007 b).
The dragon fruit grows very well in tropical climates. Hence, it is suitable
to be grown in Malaysia as a commercial crop. The plant requires rainfall of
500 to 1500 mm annually and temperature between 25 and 30°C. It also
needs well-drained loose soils (Cheah and Zulkarnain, 2008).
The preferred method of propagation is through stem cuttings, however,
such plants possess variable characteristics of stem and fruit. Usually whole
stem segments of 12-38 cm are used. Cuttings grow very fast and produce
fruit 6 to 9 months after planting. Fruit production by 3-4 years old plants may
reach 100 kg per year and the estimated life of a dragon fruit plant is 20
years (Crane and Balerdi, 2005).
Dragon fruit is a popular commercial fruit, which can be eaten fresh and
used for culinary and confectionary purposes. It can also be fermented as
wine and for the extraction of functional enzymes. The fruit is mostly
consumed fresh, however, the frozen pulp may be used to make yogurt,
candies, ice cream, marmalade, jelly, juice and pastries. Unopened flower
buds can be used as a vegetable. The mild laxative activity of dragon fruit is
due to its seeds, which contain oil (Cheah and Zulkarnain, 2008; Crane and
Balerdi, 2005). Its products have several useful properties, including as
9
colouring agent, thickening properties, high antioxidant capacity and dietary
fibre (Le Bellec et al., 2006).
Here the focus is on the red dragon fruit which is scientifically known as
Hylocereus polyrhizus. Red dragon fruit have attracted significant attention
worldwide. This is because of the unique red-purple colour of the flesh,
economic value as a food source and high betacyanin content. Other
benefits, such as cancer chemopreventives, anti-inflammatory agents and
anti-diabetics, can also be found in dragon fruit. It reduces cardiovascular
mortality rates (Cos et al., 2004). It contains less sugar than most popular
tropical fruits, and thus is more suitable for diabetics and high blood pressure
patients (Lau et al., 2008).
In Malaysia, the total value of red dragon fruit production for 2006 was
RM 12 million. The cultivation area has been increased about 20 fold in 4
years from 2002 to 2006, indicating that the demand for the fruit has
increased at a remarkable rate (Cheah and Zulkarnain, 2008).
In a seminar on Pitaya Production, Market and Export - Issues and
Challenges (2008), it was stated that, although the demand is increasing and
red dragon fruit cultivation is lucrative, very few studies have been done on
fungal and bacterial infections on the fruit after harvest. These infections can
drastically reduce the shelf life of the fruit, making it difficult to commercialize
it globally (Masyahit et al., 2009; Cheah and Zulkarnain, 2008).
2.2 Anthracnose
Scientific reports on pathogenic diseases infecting dragon fruit plants are
still lacking, especially on anthracnose. Masyahit et al. (2009) noted that
10
there had been only three previous studies on the occurrence of fungal
diseases in dragon fruit and only in white-fleshed species in Japan and USA
and yellow species in Brazil (Takahashi et al., 2008; Taba et al., 2006).
Anthracnose caused by Colletotrichum gloeosporioides is a devastating
disease not only on dragon fruit but also on other tropical fruit. Damage to
plants results in decreased total yield and reduced quality and value of the
fruit. This disease is more dominant during rainy seasons. The fungal
pathogen not only attacks postharvest dragon fruit but also the live stems,
branches, flower buds and fruit (Hoa, 2008).
Masyahit et al. (2009) reported that, in Malaysia, anthracnose disease on
dragon fruit plants is caused by a facultative fungus, Colletotrichum
gloeosporioides, which belongs to the order Melanconiales. This disease is
regularly seen in the field on ripe or overripe fruit and reduces the economic
value of crops in tropical, subtropical and temperate regions. The most
significant economic losses occur when the fruiting stage is attacked.
Anthracnose appears in developing and mature plant tissues. It can affect the
developing fruit in the field and also damage the mature fruit during storage.
The ability to cause latent infections has made it one of the most important
postharvest pathogens (Agrios, 2004; Freeman et al., 1998).
The symptoms that can be observed on the plants are round, water
soaked and sunken spots. Lesion centres are covered with pinkish-orange
conidial masses. Symptoms are sharply defined with irregular to circular
spots, and reddish-brown in colour. These lesions are referred to as
"chocolate spots." As the plant matures, these spots enlarge rapidly to form
the characteristic circular sunken lesions (Masyahit, et al., 2009).
11
Chau and Alvarez (1983) examined the infection process of
Colletotrichum gloeosporioides using light microscopy and transmission and
scanning electron microscopy. The conidia are dumbbell shaped or slightly
curved, one-celled, oblong or ovoid, 5-7 µm in width and 10-15 µm in length.
Production of sunken lesions is a consistent feature of anthracnose,
which causes the death and maceration of infected tissues (Baiely et al.,
1992). Colletotrichum species secrete a range of enzymes, which destroy
and sometimes kill plant cells. Two enzymes are encountered most
frequently; one which is responsible for degradation of carbohydrates and
dissolve cell walls, and the second hydrolyzes the cuticle. Cell wall degrading
enzymes, such as polygalacturonases, pectin lyases and proteases, play an
important role in starting infection and softening of tissues (Bailey and Jeger,
1992).
Environmental conditions favouring the pathogen are high temperature
(28 oC being optimal) and high humidity. Presence of abundant moisture
helps in the release of spores. Spores can only ooze out in the presence of
high moisture and their dispersal usually takes place with rain. Disease
severity is related to weather conditions. Extreme temperatures, low
humidity, dry weather and sunlight rapidly inactivate fungi (Agrios, 2004).
2.3 Techniques used to control pre harvest anthracnose of fruit
plants
In recent years there has been strong market competition in the
agriculture sector due to developments in technology. Extra attention has
been given to provide high quality fresh products without using synthetic
12
chemicals. However, despite all these efforts and techniques being used,
modern agriculture is still heavily dependent on synthetic fungicides (Schirra
et al., 2011). In order to minimize the use of fungicides and to find some safer
alternatives, research is being conducted on improved cultural practices,
biological control and plant defense promoters. To reduce the losses due to
anthracnose, techniques such as crop rotation, chemical or biological control
have been adopted (Jirak-Peterson and Esker, 2011; Pinto et al., 2010;
Cowan, 1999).
2.3.1 Crop rotation and other cultural practices
In recent years, crop rotation and other cultural technical practices have
been used to control anthracnose throughout the world. Crop rotation is the
first step in a successful cropping system. It is also beneficial for
improvement of soil conditions and reduction of weed and insect populations,
resulting in high yields of crops. Implementation of crop rotations is helpful to
farmers who use conservation tillage. Bergstrom and Nicholson (1999)
concluded that corn crop residues are the important source of inoculum for
anthracnose disease dispersal. Lipps (1983) demonstrated that anthracnose
is negatively correlated with increasing distance from a residue source,
indicating that local sources of inoculum were most important for disease
development. The use of rotation or tillage can reduce the level of soil
inoculum. Previous study has shown that corn and soy bean rotation instead
of continuous corn reduced the incidence of corn anthracnose (Lipps, 1983).
However, there are a few drawbacks to these conventional cultural practices,
for example tillage resulted in higher incidence of anthracnose stalk rots
13
compared to no tillage (Lipps and Deep, 1991; Byrnes and Carroll, 1986;
Doupnik et al., 1975). The major disadvantage of crop rotation is that it needs
a lot of expertise, equipment and differing management practices. Nutrient
requirements vary from crop to crop which results in alteration of nutrient
management programmes and weed control practices.
2.3.2 Chemical control
Application of antifungal agents is the most common and effective method
to control fungal diseases (Sommer, 1985) and synthetic fungicides are the
most viable option. Commonly used synthetic fungicides are thiabendazole
and benomyl (Khan et al., 2001). However, due to the consistent use of these
synthetic chemicals some resistant strains of Colletotrichum have emerged
(Mari et al., 2003) and environmental and health risks are very high
(Janisiewicz and Korsten, 2002; Mari and Guizzardi, 1998; Ragsdale and
Sisler, 1994; Wilson and Wisniewski, 1989; Eckert and Ogawa, 1985).
The demand for non-chemically treated products has increased due to
consumer awareness of these chemicals. Thus, an alternative approach for
safe and efficient control of anthracnose by using plant and animal derived
products is needed.
2.3.3 Biological control
Many research studies have shown the potential of biological control
agents for the prevention of plant diseases, but there are only a few
commercialized systems for bio control of plant diseases, especially for foliar
parts (Elad 2000; Elad et al., 1998). Nevertheless, progress has been
14
substantial and Trichoderma spp. have been used for the control of B.
cinerea for grapes (Dubos, 1984). Spadaro and Gullino (2004) reviewed the
main agents that have been assayed as antagonistic microorganisms,
including Pseudomonas syringae Van Hall, which are active against the
genera Botrytis, Penicillium, Mucor and Geotrichum. The yeast Candida
oleophila Montrocher was found to be effective against Botrytis and
Penicillium spp., while other yeasts such as Aureobasidium pullulans,
Candida saitoana, Candida sake and Metschnikowia pulcherrima are under
development. It is important that evaluation of these microorganisms is
carried out in a product formulation, since the formulation may improve or
diminish antagonistic efficacy depending on the concentration and the
duration of exposure to the treatment. Bacillus brevis protected Chinese
cabbage from anthracnose by reducing the wetness of leaves (Edwards and
Seddon, 1992).
Another approach to control plant diseases is the use of compost
extracts. These extracts are helpful in controlling Sphaerotheca fuliginea on
cucumbers and B. cinerea in strawberries and beans (Weltzien, 1992;
Tränkner, 1991). Activity of dried extracts of compost could be enhanced with
the addition of proteins against B. cinerea (Urban and Tränkner, 1993). The
compost extracts help by inducing resistance and by direct inhibition of the
pathogen (Weltzien, 1992). Watery extracts of compost originated from
animal and plant resources (cattle, chicken manure and grape marc)
suppressed the activity of grey mould of pepper and tomato by up to 56-
100% depending on the fermentation of the compost (Elad and Shtienberg,
1994).
15
Several plant extracts have also been used for the biocontrol of
anthracnose (Pinto et al., 2010). Sweetflag (Acorus calamus L.) and Betel
pepper (Piper betel L.) were used against four species of Colletotrichum
isolated from chilli plants. The mixture of these plant extracts helped to
reduce anthracnose on the plants but they caused some phytotoxic effects
on chilli leaves (Charigkapakorn, 2000).
The degree of control obtained by these biological control agents alone is
often not satisfactory, so the use of additives or chemical fungicides at low
concentrations can enhance biocontrol activity. Bioactivity of yeast
antagonists could be enhanced by several methods. For example,
bicarbonate salts have been shown to possess broad-spectrum antimicrobial
properties for controlling pathogens. Postharvest decay caused by P.
expansum and A. alternata in pear fruit can be reduced significantly by the
addition of 2% (w/v) sodium carbonate to suspensions of the antagonistic
yeasts Cryptococcus laurrentii or Trichosporon pullulans (Yao et al., 2004).
Reasons for the paucity of biocontrol agents include the low cost,
availability and effectiveness of fungicides, the surface conditions of plant
parts not favouring survival and activity of introduced microorganisms
(Fokkema and Schippers, 1986), the inconsistent effectiveness of biocontrol
agents, the relatively narrow spectrum of diseases controlled and the
difficulty of formulating and distributing biocontrol agents as compared with
chemicals. In addition, registration is required by regulatory agencies, e.g.
Environmental Protection Agency (EPA) and European Agencies, before any
biocontrol agent can be used commercially.
16
The doses of these compounds to be applied need to be determined,
particularly in relation to any potential mammalian toxicity. Furthermore, the
efficacy of these compounds can decrease under commercial conditions
when used as a stand-alone treatment (Droby et al., 2002). Thus, due to
these drawbacks, interest has increased in developing alternative control
methods, which are biodegradable and environmentally sound.
2.4 Techniques used to control postharvest anthracnose
For reduction of postharvest losses of fresh produce efforts are also being
made to use some physical methods, such as ultraviolet irradiation,
radiofrequency treatment, heat treatments (heat therapy), biological control
and storage techniques (Narayanasamy, 2006; Barkai-Golan, 2001).
2.4.1 Physical control
Chilling injury and rot development of fruit can be reduced by using
postharvest heat treatments, such as hot water treatment, short hot water
rinsing and brushing and hot air treatment (Kumah et al., 2011; Barkai-Golan
and Phillips, 1991). These treatments enhance the shelf life of fresh produce
and also provide quarantine security. Heat treatment as a postharvest
technique was used in the first decade of the 20th century after the First
World War in the citrus industry in the United States. Subsequently,
postharvest heat treatments have been used commercially on a limited scale
to control fungal diseases and pest infestations of horticultural crops. In
general, heat treatments are applied as pre-storage treatments prior to short
or long cold storage by using hot water, hot air or vapour heat (Yimyong et
17
al., 2011; Fallik, 2010; Fan et al., 2008; Kremer-Köhne, 1999). However,
there are limitations, for example different commodities require different
temperatures and exposure times (Kumah et al., 2011). There are some
situations in which the application of inappropriate hot water treatments leads
to tissue damage, abnormal softening, lack of starch breakdown, flesh
darkening and development of internal cavities (Maqbool, 2012).
2.4.2 Chemical control
Use of synthetic fungicides is the most common method for controlling
anthracnose (Young, 2008; Leroux, 2004; Rosslenbroich and Stuebler,
2000). The emergence of resistant strains of fungi (Mari et al., 2003) and
very high environmental and health risks are the major reasons for the
removal of such fungicides from the market (Janisiewicz and Korsten, 2002;
Mari and Guizzardi, 1998; Ragsdale and Sisler, 1994; Wilson and
Wisniewski, 1989; Eckert and Ogawa, 1985).
2.4.3 Natural compounds
Natural compounds, particularly of plant and animal origin, with
antimicrobial properties have gained considerable attention during the past
decade (Ncube et al., 2008; Valgas et al., 2007; Tripathy and Dubey, 2004).
Acetic acid, jasmonates, flavour compounds (e.g. hexane, acetaldehyde, and
benzaldehyde), fusapyrone and deoxyfusapyrone, glucosinolates, chitosan,
essential oils and propolis are examples of natural compounds that have
been exploited to manage postharvest diseases of fresh fruits and
vegetables (Tripathy and Dubey, 2004). In vitro trials of some plant volatiles,
18
e.g. benzaldehyde, benzyl alcohol, acetaldehyde, ethanol, 2-nonanone and
nerolidol, have proved them to be anti-fungal agents against the fruit and
vegetable pathogens, R. stolonifer, C. musae, P. digitatum and Erwinia
carotovora (Utama et al., 2002). Similarly, essential oils obtained from the
leaves of Citrus medica, Melaleuca leucadendron and Ocimum canum are
able to control deterioration of stored food caused by Aspergillus versicolor
and A. flavus (Dubey and Kishore, 1988). Most of the studies showed that
several essential oils can inhibit fungi in in vitro conditions (Hidalgo et al.,
2002; Bellerbeck et al., 2001; Singh and Tripathi, 1999; Bishop and Reagan,
1998). Lima et al. (1998) reported that the growth of B. cinerea and P.
expansum could be inhibited by propolis obtained from poplar and conifer
trees.
These compounds need to be assessed for mammalian toxicity. Their
efficacy is limited and, under commercial conditions, they may not be
effective when used alone (Droby et al., 2001). Thus, there is urgency to
develop alternative control methods that are biodegradable and
environmentally safe.
One fascinating area of study is the use of natural compounds such as
edible films and coatings. Edible films and coatings have been used since the
8 ’ (G b et al., 1996) and extensive research on them has paved the
way for effective treatments.
2.5 Chitosan
Chitosan is derived from N-deacetylated chitin, which is obtained from the
outer shell of crustaceans (Sandford, 1989). It is a natural polymer composed
19
of β-(1,4)-2 acetylamino-2-deoxy-D-glucose and β-(1,4)-2-amino-2-deoxy-D-
glucose units. The positive charge of chitosan is responsibe for its distinctive
physiological and biological properties. From its biological activity and mode
of action, it is postulated as an antimicrobial compound that can be applied
against fungi, bacteria and viruses, and as an inducer of the defense
mechanisms of plants (Guerra-Sánchez, 2009; Fisk et al., 2008; Terry and
Joyce, 2004).
Chitin and chitosan are natural polysaccharides and the presence or
absence of nitrogen distinguishes them from cellulose. Chitosan is in high
demand as a natural compound used in various industuries, such as
agriculture (films, fungicide and elicitor) (Ren et al., 2001; Makino and Hirata,
1997; Hoagland and Parris, 1996; Lafontaine and Benhamou, 1996), food
(coating, antimicrobial, preservative and antioxidant,) (Shahidi et al., 2001;
Benjakul et al., 2000, Roller and Covill, 1999; Sapers, 1992, Pennisi, 1992),
pharmacology and medicine (fibre, membranes, fabrics, drugs and artificial
organs) (Liu et al., 2001; Kulpinsky et al., 1997; Nishimura, 1997; Muzarelli,
1989), biotechnology (emulsifier, chelator and flocculent) (Hirano 1989;
Sandford, 1989), and cosmetology (hair additives, lotions, facial and body
creams) (Lang and Clausen, 1989).
2.5.1 Antifungal properties of chitosan
The antifungal properties of chitosan are correlated with its concentration
(Ali et al., 2010), suggesting a link between its polycationic nature and its
antifungal properties. It is also possible that chitosan plays an important role
20
in the synthesis of certain fungal enzymes. Changes in fungal morphology,
such as abnormal shapes of conidia, excessive mycelial branching, abnormal
shapes of hyphae and reduction in the size of hyphae, are due to the effect of
chitosan (Bautista-Baños et al., 2006; Bautista-Baños et al., 2003). After
treatment with chitosan, Rhizopus stolonifer and Sclerotinia sclerotiorum
showed abnormal shapes of conidia and swelling and reduction in size of
hyphae (Hernández-Lauzardo et al., 2008; Cheah et al., 1997).
Based on in vitro and in vivo studies, the antifungal properties of chitosan
have been highly corelated with fungal inhibition (Ali and Mahmud, 2008;
Bautista-Baños et al., 2003; Ben-Shalom et al., 2003; Cheah et al., 1997; El
Ghaouth et al., 1992; Kendra and Hadwiger, 1984).
Mycelial growth is inhibited when the culture medium contains chitosan,
for example Sclerotinia sclerotiorum was inhibited by 4% when chitosan
concentration was increased (Cheah et al., 1997). The radial expansion of
Alternaria alternata, Botrytis cinerea, Colletotrichum gloeosporioides and
Rhizopus stolonifer declines as the concentration of chitosan increases (Ali
and Mahmud, 2008; El Ghaouth et al., 1992). Other reports showed similar
results, i.e. growth of F. oxysporum, C. gloeosporioides, R. stolonifer and
Penicillium digitatum was inhibited by 3.0% chitosan. Generally, fungal
spores treated with chitosan germinate less well compared with untreated
spores, as shown for C. gloeosporioides (Bautista-Baños et al., 2003).
Various investigations have confirmed the antifungal potential of chitosan.
Dipping of tomato seedlings and seeds significantly reduced the diseases
caused by P. aphanidermatum and F. oxysporum f. sp. radicis-lycopersici
(Lafontaine and Benhamou, 1996; Benhamou et al., 1994; El Ghaouth et al.,
21
1994a). An increase in chitosan concentration (0.5 to 2.0 mg ml-1) helped
reduce root lesions on tomato seedlings caused by F. oxysporum f. sp.
lycopersici (Benhamou et al., 1994).
Benhamou et al. (1994) reported that no root lesions in tomato were
observed when a combination of chitosan-amended soil and chitosan-treated
tomato seeds were used. In contrast, for cucumber plants only the growing
medium was amended with 400 mg ml-1 chitosan and no symptoms of root
infection were observed (El Ghaouth et al., 1994a). Lower incidence of
disease caused by F. graminearum and better germination of wheat was
recorded for chitosan-treated (2 to 8 mg ml-1) seeds in comparision with
untreated controls (Bhaskara Reddy et al., 1999).
The preventive antifungal effect of chitosan has been documented on
cucumber and groundnut plants infected by B. cinerea and Puccinia
arachidis, respectively. For both studies, chitosan (0.1% and 1000 ppm,
respectively) was sprayed 24h before inoculation (Ben-Shalom et al., 2003;
Sathiyabama and Balasubramanian, 1998).
Daikon radish (Raphanus sativus L.) showed an increase in root and
shoot growth (Tsugita et al., 1993). Various crops, such as soybean sprouts
(Lee et al., 2005), cabbage (Brassica oleracea L. v . ‘C p ’) w
basil (Kim, 2005), showed vigorous growth after treatment with chitosan.
Frequent application of chitosan and the concentration applied markedly
increased the growth in various crops, including chilli, Chinese cabbage,
celery, bitter cucumber and rice (Boonlertnirun et al., 2005; Chandrkrachang
et al., 2003).
22
Increase in the growth of orchids (Paphiopedilum and Dendrobium
S ‘P p ’) w b v w h h h 2.5-40.0 mg l-1
(Chandrkrachang, 2002 and 2005). Limpanavech et al. (2003) noted that the
development and growth of cut flower Dendrobium S J ‘E k ’ w
affected by the concentration and degree of deactylation of chitosan. The
reduced severity of leaf spot and increase in inflorescences in three and half
year old D. misteen were reported by Win et al. (2005), however there was
no effect on size of floret and new shoot growth.
In bell pepper, production of cell wall macerating enzymes such as
polygalacturonases is markedly reduced by chitosan (El Ghaouth et al.,
1997). Chitosan effectively impaired the assembly of fungal virulence factors,
such as organic acids (fumaric and oxalic acids), cell wall degrading
enzymes (pectate lyase, cellulose and polygalacturonase), and host specific
toxins (alternariol and alternariol monomethylether) and induced rishitin
production (Bhaskara Reddy et al., 2000).
2.5.2 Chitosan as an elicitor of response mechanisms
Chitosan is considered as a potential candidate for inducing phenolics
(Bautista-Baños et al., 2006) and defense-related enzymes in plants
(Benhamou, 1996). It is regarded as a potent elicitor of plant defense
reactions because it induces activity of chitinases, phytoalexins, protease
inhibitors and structural compounds such as cellulose and lignin (Benhamou,
1996).
Enzymatic responses of plants are highly correlated with induced defense
reactions. Previous studies have demonstrated that chitosan is responsible
23
for eliciting exogenous host defense responses, e.g. phenolic compounds, β-
1,3-glucanases, chitinases, synthesis of phytoalexins and lignin induction
(Zhang and Quantick, 1998; Bhaskara Reddy et al., 1997; Fajardo et al.,
1998; Arlorio et al., 1992; Tejchgraber et al., 1991). Gagnon and Ibrahim
(1997) reported an increase in the amount of 20-hydroxygenistein
monoprenyls, genistein and isoflavonoids after chitosan treatment in roots
and exudates of white lupin, respectively.
Application of chitosan as root and seed dressings and foliar spray helps
in inducing resistance by eliciting defense reactions when applied in
susceptible tomato plants against F. oxysporum (Benhamou et al., 1998).
This induced resistance may be due to the accumulation of fungitoxic
compounds at penetration sites of the pathogen.
Phenolics encompass a wide range of substances that have an aromatic
ring with at least one hydroxyl group. They represent one of the most
abundant groups of compounds found in nature and are of particular interest
in postharvest due to their defense mechanism and their role in colour and
flavour in many crops. They have been identified as antimicrobial and
antifungal agents. In general, phenolics have been implicated as detrimental
allelopathic agents and feeding deterrents for fungi. Due to these functions,
plant phenolic compounds have been advocated to play a number of roles in
plant defense mechanisms against several pathogens. The amount of
phenolics varies widely in postharvest products (Hammerschmidt, 2005;
Kays, 1997).
De Ascensao and Dubery (2000) investigated the tolerance in banana
against Fusarium wilt caused by race four of Fusarium oxysporum f. sp.
24
cubense. They observed that tissue cultured cv. Goldfinger roots treated with
chitosan showed a prominent increase in total soluble phenolic acids, ester-
bound phenolic acids and cell wall-bound phenolic acids, but a relatively
small increase in free phenolic acids and a moderate increase in glycoside-
bound phenolic acids, as compared to the corresponding controls. This could
be explained by the fact that esterification with phenols, such as
hydroxycinnamic acids, modifies the cell wall polysaccharides and they may
become cross-linked and provide a platform for later lignification to resist the
action of lytic enzymes produced by fungal pathogens (Lewis and
Yamamoto, 1990). Success or failure of plant resistance may, therefore,
p h v x h h ’ g p .
A plant cell wall is composed of lignin and cellulose. Chitosan induces
plants to increase their lignin and cellulose synthesis, and the greater
lignification results in a stronger cell wall that is less penetrable by a fungal
pathogen (Vander et al., 1998; Prospieszny and Zielinska, 1997). Chitosan
increases lignification in wheat plants and chitosan oligomers elicit
lignification in pea tissue (Barber et al., 1989). The invasion by a pathogen in
the plants was restricted by the induction of structural barriers at fungal
penetration sites. In some plants, cellular suberisation and lignification
occurred during the course of infection. Chitosan treatments after inoculation
with B. cinerea caused moderate lignification of cell walls after 48 and 72 h in
wheat leaves (Barber et al., 1989; Pearce and Ride, 1982). The evidence of
formation of abnormal structures, such as agglomerates of hyphae, was
confirmed by transmission electron microscopy of Fusarium oxysporium f. sp.
radicis-lycopersici. Chitosan treated tomato leaves and roots showed some
25
changes in cell structure, including (i) formation of papillae (wall appositions)
into the endodermis tissues and the cortex, (ii) xylem vessels sealed with
bubble-like structures which were milky in appearance and (iii) thickening of
pit membranes (Lafontaine and Benhamou, 1996).
Tomato roots treated with chitosan plus Bacillus pumilus showed an
increase in host defense (Benhamou et al., 1998). The host defense
response of inoculated (P. aphanidermatum) cucumber plants was similar to
those observed on tomato plants, such as formation of papillae and fibrillar
material to protect the cell wall and intercellular space, respectively (El
Ghaouth et al., 1994a).
Some studies have reported the involvement of self-defense enzymes in
controlling disease and preventing infection caused by pathogens (Vander et
al., 1998; Bohland et al., 1997). Chitin and chitosan have been reported to
enhance resistance systems, such as lignin formation, phenylalanine
ammonia lyase and lipoxygenase activities, in wheat leaves (Vander et al.,
1998; Bohland et al., 1997). Some oxidative enzymes, such as polyphenol
oxidase (PPO) and peroxidase (POD), are also involved in defense
mechanisms of plants against pathogens. These enzymes catalyse the
formation of oxidative phenols and lignin that contribute to the formation of
defense barriers for reinforcing the cell structure (Zhu and Ma, 2007).
The natural resistance of plants towards diseases is based on preformed
defenses and on induced mechanisms. The induced mechanisms are
associated with local changes of pathogen infection site, such as the
hypersensitive response (HR), which is one of the most efficient forms of
plant defense (Kortekamp and Zyprian, 2003). Besides the accumulation of
26
antimicrobial compounds, such as phenolic compounds and phytoalexins
(Ortega et al., 2005), the HR also leads to an increase in the activity of
peroxidase (POD) (Kortekamp and Zyprian, 2003) and polyphenol oxidase
(PPO) enzymes involved in defense responses (Agrios, 2004).
PPO belongs to the group of enzymes called oxidoreductases. It is
present in almost all plants, but most abundant or active in fruit, being
distributed in almost all fruit parts (Vamos-Vigyazo, 1981). PPO catalyses
two reactions; the oxidation of diphenol to o-benzoquinones and
hydroxylation of the monophenol oxidase of hydroxyl group adjacent to the o-
position. Both reactions utilise molecular oxygen as a co-substrate
(Rupasinghe, 2008).
POD, like PPO, is also an oxidoreductase (Vamos-Vigyazo, 1981). It is
widely distributed in nature and catalyses the decomposition of hydrogen
peroxide (H2O2) in the presence of a hydrogen donor.
It has been observed that the wounding or softening of fruit results in an
increase of POD and PPO activity (Cantos et al., 2002). These enzymes
along with total phenolics may result in quality losses by inducing changes in
the flavour, colour, texture and nutrient value of the fruit. Oxidation of
phenolic compounds by PPO and POD causes fruit to undergo enzymatic
browning (Rupasinghe, 2008).
Reduction of PPO levels in plants or fruit could contribute to reduced
oxidation of phenolic compounds, which could result in reduced resistance to
pathogens. Examination of the sensitivity of plants to pathogens revealed a
dramatic increase in their susceptibility when there were lower amounts of
PPO in the plants (Mayer, 2006). While the exact mechanisms have yet to be
27
elucidated, PPO and POD are known to play a part in increasing the
defenses of a plant against pathogens.
El Ghaouth et al. (1997) found that, in bell pepper, chitosan reduced the
secretion of polygalacturonases by B. cinerea that results in decreased
maceration of host cell walls. Bhaskara Reddy et al. (2000) reported
increased acitivities of phenolic compounds, POD and PPO in strawberry fruit
treated with chitosan. However, chitosan increased the total phenolic
compounds and protein in wounded tomato but the PPO activity decreased
(Badawy and Rabea, 2009). Ben-Shalom et al. (2002) also found that the
increased resistance of cucumber against B. cinerea was due to elicited
activity of POD. In a recent study, Liu et al. (2007) observed that chitosan not
only inhibited the in vitro growth of P. expansum and B. cinerea but also
induced defense reactions in tomato fruit. The findings of previous studies
suggest that activity of chitosan is not only associated with fungitoxic
properties, but is also involved in elicitation of defense enzymes in fruit and
plants.
Evidence strongly suggests that esterification of phenols to cell wall
materials is a common theme in the expression of plant resistance, and the
crosslinking of such phenylpropanoid esters leads to the formation of lignin-
like polymers (Fry, 1987). In plants, the key enzyme for phenylpropanoid
metabolism is phenylalanine ammonia lyase (PAL). PAL activity in plant
tissue may rapidly change under the influence of various factors, such as
pathogen attack and treatment with elicitors (Dixon and Harrison, 1990).
However, POD is a phenol oxidizing enzyme. The activities of PAL and POD
may be rapidly enhanced under the influence of elicitors or pathogen attack.
28
As a biodegragable agent, chitosan is a potential antimicrobial candidate
and is involved in eliciting activities (Benhamou, 1996). The fungicidal
activities of chitosan have been shown to be equivalent to synthetic
fungicides such as thiabendazole (TBZ) and ipriodione (El Ghaouth et al.,
1992).
Extensive literature documents the biochemical changes of defense
mechanisms against fungal pathogens, as they cause physiological changes
induced in plants by treatment with chitosan. One of the most studied
biochemical changes is an increased production of antifungal hydrolases,
such as β-1,3-glucanase, chitinase and chitosanase, in leaves and roots of
b p pp . H h j h p ’
arsenal against fungal attack, as the enzymes are able to attack the cell walls
of the invading fungal germ tubes. Marked increases in the anti-fungal
hydrolases (0.13 U mg-1 protein) after treatment with chitosan have been
noted in strawberries and raspberries (Zhang and Quantick, 1998; El
Ghaouth et al., 1997).
Tejchgraber et al. (1991) reported that exposure time of soyabean seeds
to chitosan glutamate was crucial for increased germination and chitinase
activity. Some other studies indicated that the de-novo synthesis of phenolic
compounds was triggered by chitosan, and these phenolic compounds serve
as the first defensive line for inhibiting fungal growth, while β-1,3-glucanase
serves as the second barrier for inhibiting the penetration of fungal hyphae
into plant cells (Lanfontaine and Benhamou, 1996; Benhamou et al., 1994).
In contrast, chitosan was unable to produce significant amounts of defense
enzymes in cucumber to reduce grey mould (Ben-Shalom et al., 2003).
29
2.5.3 Mode of action of chitosan
Based on the positive charge of the glucosamine monomer on the C2
below pH 6, chitosan showed more antimicrobial activity as compared to
chitin (Chen et al., 1998). The actual antimicrobial mechanism of chitin and
chitosan is unknown, but diverse theories have been reported.
The leakage of intracellular and proteinaceous constituents occurred as a
result of the interaction between polycatoinic chitosan and anionic microbial
cell membranes (Chen et al., 1998; Fang et al., 1994; Seo et al., 1992;
Hadwiger et al., 1986). The outer surface of a pathogen is in direct contact
with chitosan. At concentrations lower than 0.2 mg ml-1, the positively
charged chitosan may not interact fully with the negatively charged microbial
surface to form accretion while, at higher concentrations, chitosan molecules
form a positively charged network on the bacterial surface and keep them in
suspension. Chitosan also inhibits microbial growth and binds trace metals,
which proves chitosan to be a chelating agent (Cuero et al., 1991).
It also inhibits the production of various fungal enzymes and helps in
triggering numerous defense processes in the host tissue (El Ghaouth et al.,
1992). Application of chitosan on plant tissues results in two major effects.
The first is prevention of the pathogen invading inside the plant tissue by the
formation of a physical barrier. This phenomenon is similar to the abscission
zones observed on potato leaves, which prevent necrotrophic pathogens
from further spread (El Hadrami et al., 2009). The second is cell wall
fortification, which occurs as a response of H2O2 accumulation and serves as
an alert signal for healthy plant parts.
30
Chitosan is a chelator for metals and minerals and used for purification of
fresh and salt water. This ability to chelate is also of value as it prevents the
access of pathogens to minerals and nutrients. Chitosan can also bind
mycotoxins and can reduce the damage of tissues due to toxins (Bornet and
Teissedre, 2005).
Owing to the ability of chitosan to bind to biological membranes and their
positive charges, it is helpful in wound healing following pathogen attack or
mechanical injury (Hirano et al., 1999). Chitosan is reported to trigger the
formation of defense-related enzymes including peroxidase and
phenylalanine ammonia-lyase and PR-proteins. These enzymes are involved
in lignin assembly and formation of tyloses that accelerate wound healing.
2.5.4 Chitosan as an edible coating
Another advantage of chitosan is its barrier properties, which make it a
good coating agent to prolong the shelf life of fresh fruits and vegetables.
The chitosan coatings on fruits and vegetables are able to form a semi-
permeable layer that can adjust the gaseous exchange, reduce transpiration
loss and hold back fruit ripening. Reductions in respiration rate and water
loss, when chitosan is applied as a coating, eventually lead to the retention of
freshness as well as a slower decrease in weight loss, as evidenced by
studies with strawberry, peach, longan and papaya (Ali et al., 2011; Jiang
and Li, 2001; Du et al., 1997; El Ghaouth et al., 1992).
Decreased respiration of fruit results in the reduction of internal CO2 in
pears due to the efficacy of chitosan coatings (Du et al., 1997), with a
consequent decrease in ethylene production. Similar effects were reported in
31
chitosan coated tomatoes and peaches (Li and Yu, 2000). The physical
quality of crop commodities that have been treated with chitosan coating
improved significantly, such as external appearance and retention of colour
(Ali et al., 2011). Chitosan coated fruit, such as strawberries, litchi and
raspberries, were able to retard anthocyanin degradation (Zhang and
Quantick, 1997 & 1998). Chitosan treated papayas were more firm at the end
of storage in comparision with the control fruit (Bautista-Baños et al., 2003).
Chitosan enhances the quality of vegetables and fruits, but may also
decrease the quality depending on the variety, cultivar and type of crop. Bell
pepper and cucumbers treated with chitosan were darker green than control
fruit, while a slight colour enhancement was observed in papayas and pears
(Jiang and Li, 2001; Du et al., 1997; Woods et al., 1996: El Ghaouth et al.,
1992).
2.6 Submicron chitosan dispersions
Dispersion of a liquid in another immiscible liquid by mechanical shear
forms an emulsion (Bibette et al., 1990). These forms of emulsion are
commonly known as dispersions (Kobayashi et al., 2001) and contain
uniform and extremely small droplets from 1-1000 nm (Wells and Goldberg,
1992). Submicron dispersions are kinetically stable systems that can be
p ( p (E S < 2 )) ‘‘ k ” (E S ~5
nm) (Tadros et al., 2004; Izquierdo et al., 2002).
Properties of dispersions, such as low viscosity, high kinetic stability
against creaming or sedimentation and a large interfacial area (Solans et al.,
32
2002; Buszello and Muller, 2000), make them increasingly used in many
applications (Solans et al., 2005).
2.6.1 Formation of submicron dispersions
Formation of submicron dispersions requires energy inputs by means of
mechanical devices, such as high pressure homogenizers, ultrasound
generators and high-shear stirring, or by chemical potential of the
components. It has been reported that the smallest sizes of dispersions are
obtained by the machines which supply energy for a short time (Walstra,
1996).
The most efficient method for producing small sized droplets is ultrasound
emulsification but it is only suitable for small batches (Walstra, 1996). In
preparing submicron dispersions, sonication time and amplitude are two
important components. Time of sonication depends on the type of liquid, as
more hydrophobic monomers require a longer period of sonication
(Landfester et al., 2004).
The properties of submicron dispersions depend on liquids and on the
emulsification path or sonication time. Optimization studies are required for
achieving the best emulsifiers and required droplet sizes. The aim behind this
optimization is to increase the efficacy of submicron dispersions with respect
to conventional emulsions (i.e. macro dispersions). Therefore, in general, the
smallest droplet size and minimum polydisperity is obtained by proper
optimization of the variables. Stability is another problem for these smaller
sized particles that can be managed by optimization.
33
For different combinations of Span-Tween surfactants, an optimum
surfactant composition presenting a water solubility maximum is chosen, and
p v w h p w ( ś ,
2004).
The small droplet size of dispersions confers stability against
sedimentation (or creaming) because the Brownian motion and consequently
the rate of diffusion are higher than the rate of sedimentation (or creaming)
induced by gravity force. Ostwald ripening or molecular diffusion, which
arises from dispersion polydispersity and different solubility levels between
smaller and larger droplets, is the main mechanism for the destabilization of
submicron dispersions (Tadros et al., 2004).
The theory of Lifshitz and Slyozov (1961) and Wagner (1961) assumes
that the droplets of the dispersed phase are spherical, the distance between
them is higher than the droplet diameter and the kinetics is controlled by
molecular diffusion of the dispersed phase in the continuous phase.
According to this theory, the Ostwald ripening rate in O/W dispersions is
directly proportional to the solubility of the oil in the aqueous phase.
2.6.2 Applications of submicron dispersions
Higher kinetic stability, low viscosity and optical transparency of
submicron dispersions make them very attractive systems for many industrial
applications. They are used in the pharmaceutical field as drug delivery
systems (Taha et al., 2004; Wu et al., 2001), in cosmetics as personal care
formulations (Sonneville-Aubrun et al., 2004), in agrochemicals for pesticide
delivery (Lee and Tadros, 1982) and in the chemical industry as
34
polymerization reaction media (Liu et al., 2004). The use of submicron
dispersions as colloidal drug carriers is well documented (Sadurni et al.,
2005; Taha et al., 2004; Nicolaos et al., 2003). The bioavailability of drugs
was reported to be strongly enhanced by solubilization in small droplets
(b w .2 μ ) (N et al., 2003). The formation of submicron
dispersions is generally attributed to phase instabilities during emulsification,
where the presence of lamellar liquid crystallites and/or bicontinuous
microemulsions are thought to play critical roles (Forgiarini et al., 2001a;
Forgiarini et al., 2001b; Forgiarini et al., 2000).
The attraction of submicron dispersions for applications in various
industrial fields (Izquierdo et al., 2002), for example as reaction media for
polymerization, health care and agrochemicals, is due to their small droplet
size, high kinetic stability and optical transparency compared to conventional
emulsions, giving advantages for their use in many technological
applications. Submicron dispersion applications deal with the preparation of
polymeric small particles using a monomer as the dispersant (Antonietti and
Landfester 2002; Asua 2002; El-Aasser and Miller 1997).
Surfactants containing a polymerisable group (surfmers) are used in
dispersion polymerisation to protect, stabilise and functionalize the polymer
particles. Guyot et al. (2003) reported the dispersion polymerization of
methylmethacrylate or styrene in the presence of acrylic surfmers which gave
the latexes a good stability. However, a non-polymerisable surfactant was
required to obtain stable dispersions.
An important application of dispersion polymerisation is the production of
low viscosity and high solid content latexes. Do Amaral and Asua (2004) and
35
Asua (2002) prepared submicron dispersions using acrylic monomers and
reported that particle size is mainly controlled by droplet size of the
dispersion, which is dependent on the type and concentration of surfactant.
The small droplet size and the high kinetic stability make dispersions
suitable for efficient delivery of active ingredients (due to their large surface
) p h gh h “ gh” x h k (A
and Friedman, 1998).
With respect to agrochemical applications, Wang et al. (2007) proposed
dispersions for solubilizing water-insoluble pesticides. Submicron dispersions
are formed before the application by dilution of a concentrate containing oil,
surfactant, the active and 50% water. It is claimed that the dispersions
obtained showed good stability but the diameter of droplets increased about
five times in 14h, from 40 to 200 nm. Therefore, application should be carried
out a few hours after preparation to obtain the advantages of small droplet
size.
Chitosan dissolves in a mixture of water and acetic acid, but it cannot be
dissolved in oil. Therefore, to prepare submicron chitosan dispersions,
particles have to be bound by an emulsifier. The emulsifier aggregates
around the chitosan micelles and entraps them, conferring further stability.
Hydrophilic emulsifiers which contain a hydroxyl group are usually suitable
for polysaccharides (Navarro-Tarazaga et al., 2008).
Thus, on the basis of this literature review, the present study has been
designed to evaluate the effect of chitosan and submicron chitosan
dispersions on pre- and post-harvest anthracnose of dragon fruit, production
of inducible compounds, plant growth and the yield of dragon fruit.
36
CHAPTER 3
PRELIMINARY STUDY FOR SCREENING OF CHITOSAN, FORMULATION OF SUBMICRON CHITOSAN DISPERSIONS AND DETERMINATION OF THEIR PHYSICOCHEMICAL PROPERTIES
3.1 Introduction
Antimicrobiol activity of chitosan has been detected towards many
bacteria, fungi and yeasts. Several studies show that the biological activity of
chitosan considerably depends on degree of deacetylation (DD) and
physicochemical properties such as molecular weight (MW) (Ueno et al.,
1997; Hirano and Nagao, 1989; Uchida, et al., 1989; Kendra and Hadwiger,
1984). These features have a great impact on the solubility of chitosan and
its contact with the cell walls of target microorganisms. These factors
independently affect the antimicrobial properties of chitosan, though it has
been advocated that the effect of molecular weight is greater than the degree
of deacetylation (Sekiguchi et al., 1994).
Antimicrobial properties of chitosan can be enhanced by decreasing the
deacetylation (Andres et al., 2007; Tsai et al., 2004). In studies using several
fungi, including Aspergillus parasiticus, Candida albicans, A. fumigatus and
Fusarium oxysporum, and Gram-negative bacteria (Escherichia coli,
Salmonella tiphymurium, Pseudomonas aeruginosa, Shigella dysenteriae,
Vibrio cholerae, V. parahaemolyticus) and Gram-positive bacteria
(Staphylococcus saprophyticus and S. aureus), it was found that
antimicrobial activity increased with the lower degree of deacetylation
(Hongpattarakere and Riyaphan, 2008; Tsai et al., 2002).
The application of this polysaccharide is limited due to its low solubility in
aqueous dilute acids and the high viscosity of its solutions (Tikhonov et al.,
37
2006). Chitosan at concentrations higher than 1.5% showed limited
antimicrobial effect due to high viscosity (Davis, 2011), therefore it is
essential to increase the efficacy of chitosan by reducing its viscosity and
surface tension.
The main objectives of the present study were:
1. To screen different molecular weight chitosans and to evaluate their
efficacy against C. gloeosporioides.
2. To formulate submicron chitosan dispersions and to study their
physicochemical properties.
38
3.2 Materials and methods for screening of different types of
conventional chitosan against C. gloeosporioides
3.2.1 Materials
Locally prepared crab shell chitosan (MW 350 kDa; 95% deacetylated)
was purchased from Chitin-Chitosan Research Centre of Universiti
Kebangsaan Malaysia. Low molecular weight chitosan from crab shell (MW
50 kDa; 75–85% deacetylated), medium molecular weight chitosan from
shrimp shell (MW 400 kDa; 75–85% deacetylated) and high molecular weight
chitosan from shrimp shell (MW 760 kDa; ≥ 85% ) w
purchased from Sigma-Aldrich, USA. Brij 56 and Span 20 used as emulsifiers
were purchased from Merck KGaA, Darmstadt, Germany and Sigma-Aldrich,
USA, respectively.
3.2.2 Isolation of C. gloeosporioides and preparation of inoculum
Isolation of C. gloeosporioides was carried out from infected dragon fruit
plants and fruit. Small slices of the fruit skin and infected plant with disease
lesions were placed in Petri dishes containing potato dextrose agar (PDA,
Merck KGaA, Darmstadt, Germany) and incubated at room temperature (28
± 2°C). To obtain pure cultures, the colonies were re-isolated after mycelial
growth was observed. The isolates were identified on the basis of their
morphological and cultural characteristics (Barnett and Hunter, 1972). The
identified cultures of C. gloeosporioides were preserved for further use on
PDA slants.
39
3.2.3 Pathogenicity test
Pathogenicity test was carried out according to the method developed by
Melanie et al. (2004) and Ali (2006), on healthy stems and fruit, respectively.
The isolated pathogen (Section 3.2.2) was cultured in potato dextrose broth
(PDB) and incubated for 7 days on a rotary shaker at 150 rpm. Mycelium was
removed from the harvested conidia by filtering through four layers of
cheesecloth. Sterile purified water was used to adjust the conidial
concentration to 1×10⁶ conidia ml-1, determined using a hemacytometer.
Healthy plant stems were surface disinfected with 1% sodium hypochlorite
(NaOCl) for 2 min. A sterile sharp tooth pick was used to made 2 mm deep
artificial wounds and each wound was inoculated with 20 µl of conidial
suspension using a sterile syringe needle. These stems were laid on moist
filter paper in trays wrapped with transparent plastic and incubated at room
temperature for 14 days. Symptom development was observed regularly.
For the pathogenicity test on fruit, healthy fruit were surface sterilised
using 0.5% sodium hypochlorite solution followed by washing with purified
water. Using a sharp sterile cork borer, 5-6 mm diameter plugs were cut from
the fruit surface and replaced with mycelial plugs from a 10 days old culture
of C. gloeosporioides. The fruit were placed separately in plastic bags and
incubated for 10 days at 28 ± 2 °C. They were observed daily for lesion
development.
40
3.2.4 Preparation of conventional chitosan solution
Chitosan powder (1.0 g) was dissolved in 100 ml purified water containing
0.5 ml (v/v) glacial acetic acid using an overhead stirrer (Model: IKA® RW 14
basic, Fisher Scientific Sdn Bhd., Malaysia). The pH of the solution was
adjusted to 5.6 by adding 1N NaOH, using a digital pH meter (Model: Knick
646). Four types of chitosan were used for the screening experiment, i.e.
locally prepared chitosan, low molecular weight chitosan, medium molecular
weight chitosan and high molecular weight chitosan.
The following treatments were used:
T1: Control
T2: 0.5% chitosan
T3: 1.0% chitosan
T4: 1.5% chitosan
T5: 2.0% chitosan
3.2.5 In vitro antifungal assay of conventional chitosan against C.
gloeosporioides isolated from dragon fruit plants
3.2.5.1 Inhibition of radial mycelial growth
The in vitro antifungal activity of conventional chitosan was determined by
placing a 5 mm diameter disc from the pure culture of C. gloeosporioides in
the centre of PDA dishes containing chitosan solution at 0.5, 1.0, 1.5 and
2.0%. Petri dishes containing only PDA were used as controls. All the Petri
dishes were incubated at room temperature (28°C) until the radial mycelial
growth of the control dishes reached the edge of the dish. The percentage
41
inhibition in radial mycelial growth (PIRG) was calculated using the formula
described by Al-Hetar et al. (2010).
PI G 2
Where R1 = mycelial growth in control plates
R2 = mycelial growth in treated plates
3.2.5.2 Conidial germination inhibition test
The conidial germination inhibition test was carried out using the cavity
slide technique. Briefly, an aliq 4 μ h h h
w p p v . T μ h h v
conidial suspension of C. gloeosporioides (adjusted to 105 conidia ml-1) was
then pipetted onto each cavity slide and the slide was covered with a cover
slip and kept in the dark for 7 h at 25 ± 2°C. Cavity slides containing purified
water served as the control. After 7 h of incubation, the conidia were killed by
g μ 2. % b v g
light microscope at 40× magnification. The number of germinated conidia
was counted in 10 microscopic fields in 20 replicated dishes and presented
as percent inhibition. A conidium was considered germinated if its germ tube
was longer than the conidium itself. The percentage inhibition in germination
was calculated by the method of Cronin et al. (1996).
3.2.5.3 Dry weight of mycelium
Potato dextrose broth (PDB) and chitosan solutions were separately
autoclaved at 121°C for 20 min and 100 ml of chitosan was added to the
PDB (100 ml) in 250 ml Erlenmeyer flasks. Three mycelial discs (5 mm) from
42
a 10 days old culture were added to each flask and incubated at room
temperature for 14 days. Pre-weighed Whatman no. 1 filter paper was used
to filter mycelium and dried in an oven at 100°C for 24 h, and then weighed.
The dry weight of mycelium was calculated by the following formula:
w gh p p
p
3.2.5.4 Viability of spores
Viability of spores was measured using growth media containing chitosan
as described above (Section 3.2.5.3). A spore suspension of C.
gloeosporioides (adjusted to 200 spores ml-1) was prepared using 10 days
old culture plates incorporated with different concentrations of conventional
chitosan along with submicron chitosan dispersions of different droplet sizes.
1 ml of suspension was added to PDA dishes and incubated at room
temperature for 4 days. After incubation, the spore population density in each
treatment was measured as a percent of sporulation using the formula
described by Al-Hetar et al. (2010).
% Sp N b p p
N b p p
3.3 Methods for the preparation of submicron chitosan dispersions
Submicron chitosan dispersions were prepared using a new nano
emulsifying alcohol free system. Chitosan was dissolved separately in 0.5%
(v/v) glacial acetic acid (Sigma-Aldrich, USA) and was used as an oil phase.
The emulsifiers, Brij 56 (polyethylene glycol hexadecyl ether) and Span 20
(sorbitan monolaurate), were mixed with each other in a ratio of 1:1. The
43
chitosan solution and emulsifier mixture (4:1) were mixed together and
subjected to ultrasonication in an ultrasound water bath (Model: Bandelin
Sonorex, Germany) at 25 °C. Subjecting to ultrasound for different time
periods, submicron chitosan dispersions with droplet sizes of 200, 400, 600,
800 and 1000 nm were obtained. The droplet size was measured using a
dynamic light scattering (DLS) technique [Zetasizer NanoZS, Malvern, UK;
g g (λ 633 ) g g 73°] (J et al.,
2007).
Before using Brij 56 and Span 20, a few other emulsifiers at different
temperatures and sonication times were also tested for the preparation of
submicron dispersions (Appendix A 3.1).
3.3.1 Physicochemical analysis of submicron chitosan dispersions
3.3.1.1 Zeta potential and stability determination
The zeta potential values of submicron chitosan dispersions were
measured using a Zetasizer (Freitas and Müller, 1998). The stability of
submicron chitosan dispersions was determined by measuring the size of the
droplets in nm at 25°C and was expressed in days.
3.3.1.2 Measurement of viscosity
Viscosity of submicron chitosan dispersions was measured using a
Brookfield Viscometer (Brookfield LVDV-I Prime, Brookfield Engineering
Laboratory Inc., USA) equipped with different spindles. The operating
principle of the viscometer is to drive the spindle through the calibrated spring
44
immersed in the testing liquid. By using the spindle No. 62 and 250 ml of the
liquid in a glass beaker of 400 ml, the viscosity was measured and the data
was expressed in centipoises (cp) in a range that a torque required to rotate
the spindle is 10% or more by reacting at 100 rpm at 25°C for 1 minute.
3.3.1.3 Determination of pH
The pH of submicron chitosan dispersions was determined using a pH
meter (Model: Cyber Scan pH 510, Eutech Instruments, Singapore).
3.3.1.4 Release of chitosan from submicron dispersions
The release of chitosan from submicron dispersions was measured using
the method described by Nitschke et al. (2011) with slight modifications.
Briefly, samples (3 ml) were dissolved in 100 ml of 1M NaOH solution. The
mixture was boiled for two hours at 100°C in a water bath with continuous
agitation. The mixture was filtered and the residues collected were dissolved
in 20 ml of 10% acetic acid. The mixture was again boiled for one hour in a
water bath. This mixture served as the standard solution for chitosan
determination. A 2 µl sample of the standard solution was dyed with 1 µl of
. % g ’ h b b w 45 g
UV-Vis spectrophotometer (Varioskan Flash Multimode Reader, Thermo
Fisher Scientific, USA) for 3 min. A standard curve was prepared using 0.5 to
5 ml of chitosan solution (Appendix B 3.2).
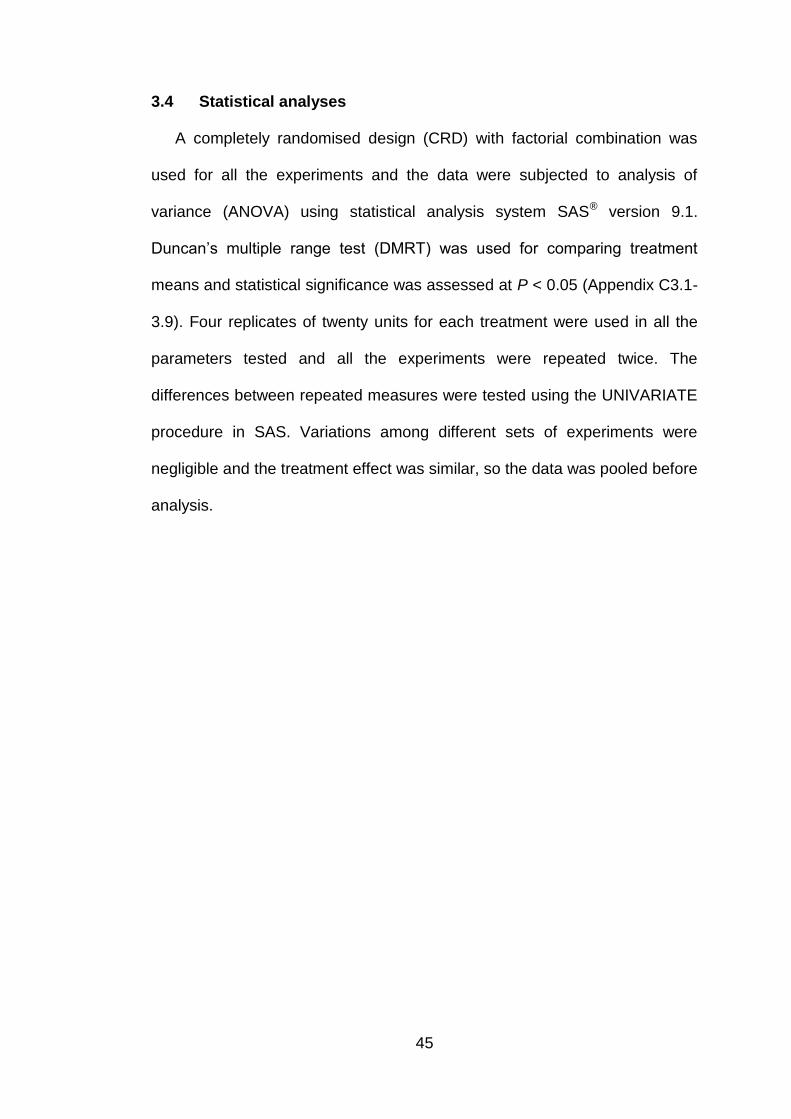
45
3.4 Statistical analyses
A completely randomised design (CRD) with factorial combination was
used for all the experiments and the data were subjected to analysis of
variance (ANOVA) using statistical analysis system SAS® version 9.1.
’ p g ( M T) w p g
means and statistical significance was assessed at P < 0.05 (Appendix C3.1-
3.9). Four replicates of twenty units for each treatment were used in all the
parameters tested and all the experiments were repeated twice. The
differences between repeated measures were tested using the UNIVARIATE
procedure in SAS. Variations among different sets of experiments were
negligible and the treatment effect was similar, so the data was pooled before
analysis.
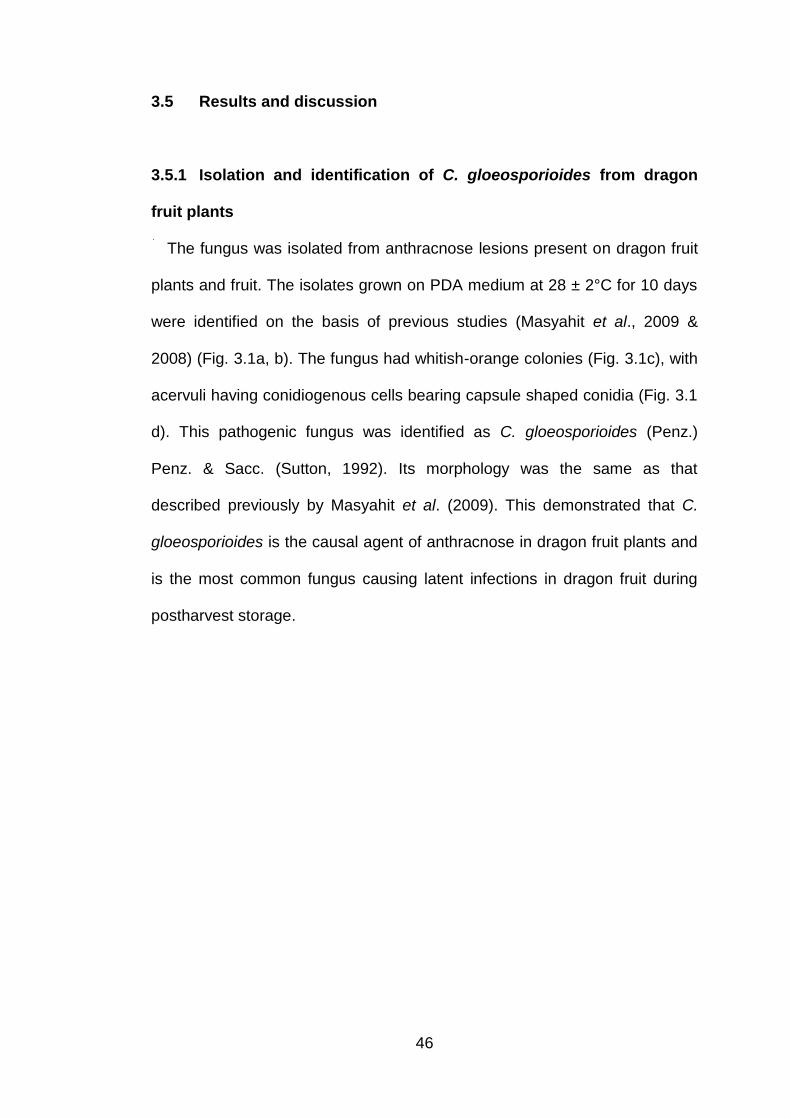
46
3.5 Results and discussion
3.5.1 Isolation and identification of C. gloeosporioides from dragon
fruit plants
The fungus was isolated from anthracnose lesions present on dragon fruit
plants and fruit. The isolates grown on PDA medium at 28 ± 2°C for 10 days
were identified on the basis of previous studies (Masyahit et al., 2009 &
2008) (Fig. 3.1a, b). The fungus had whitish-orange colonies (Fig. 3.1c), with
acervuli having conidiogenous cells bearing capsule shaped conidia (Fig. 3.1
d). This pathogenic fungus was identified as C. gloeosporioides (Penz.)
Penz. & Sacc. (Sutton, 1992). Its morphology was the same as that
described previously by Masyahit et al. (2009). This demonstrated that C.
gloeosporioides is the causal agent of anthracnose in dragon fruit plants and
is the most common fungus causing latent infections in dragon fruit during
postharvest storage.
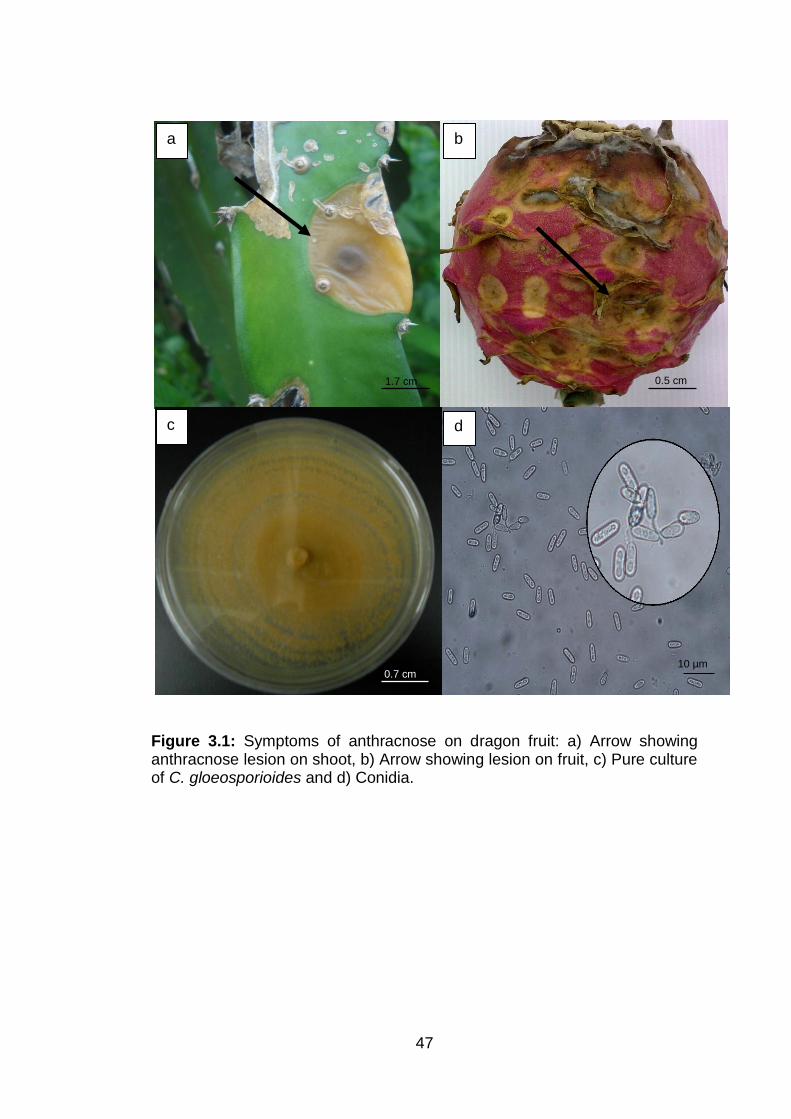
47
Figure 3.1: Symptoms of anthracnose on dragon fruit: a) Arrow showing anthracnose lesion on shoot, b) Arrow showing lesion on fruit, c) Pure culture of C. gloeosporioides and d) Conidia.
b
c d
b a
10 µm
0.5 cm
0.7 cm
1.7 cm
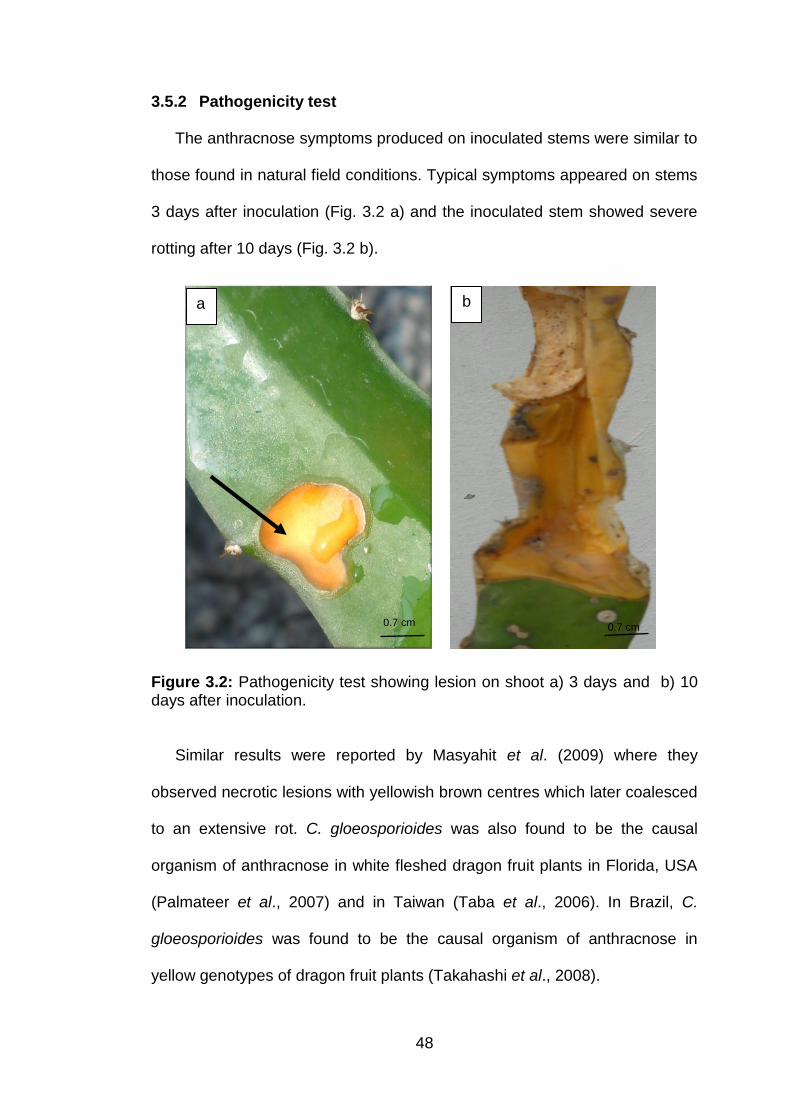
48
3.5.2 Pathogenicity test
The anthracnose symptoms produced on inoculated stems were similar to
those found in natural field conditions. Typical symptoms appeared on stems
3 days after inoculation (Fig. 3.2 a) and the inoculated stem showed severe
rotting after 10 days (Fig. 3.2 b).
Figure 3.2: Pathogenicity test showing lesion on shoot a) 3 days and b) 10 days after inoculation.
Similar results were reported by Masyahit et al. (2009) where they
observed necrotic lesions with yellowish brown centres which later coalesced
to an extensive rot. C. gloeosporioides was also found to be the causal
organism of anthracnose in white fleshed dragon fruit plants in Florida, USA
(Palmateer et al., 2007) and in Taiwan (Taba et al., 2006). In Brazil, C.
gloeosporioides was found to be the causal organism of anthracnose in
yellow genotypes of dragon fruit plants (Takahashi et al., 2008).
a b
0.7 cm 0.7 cm
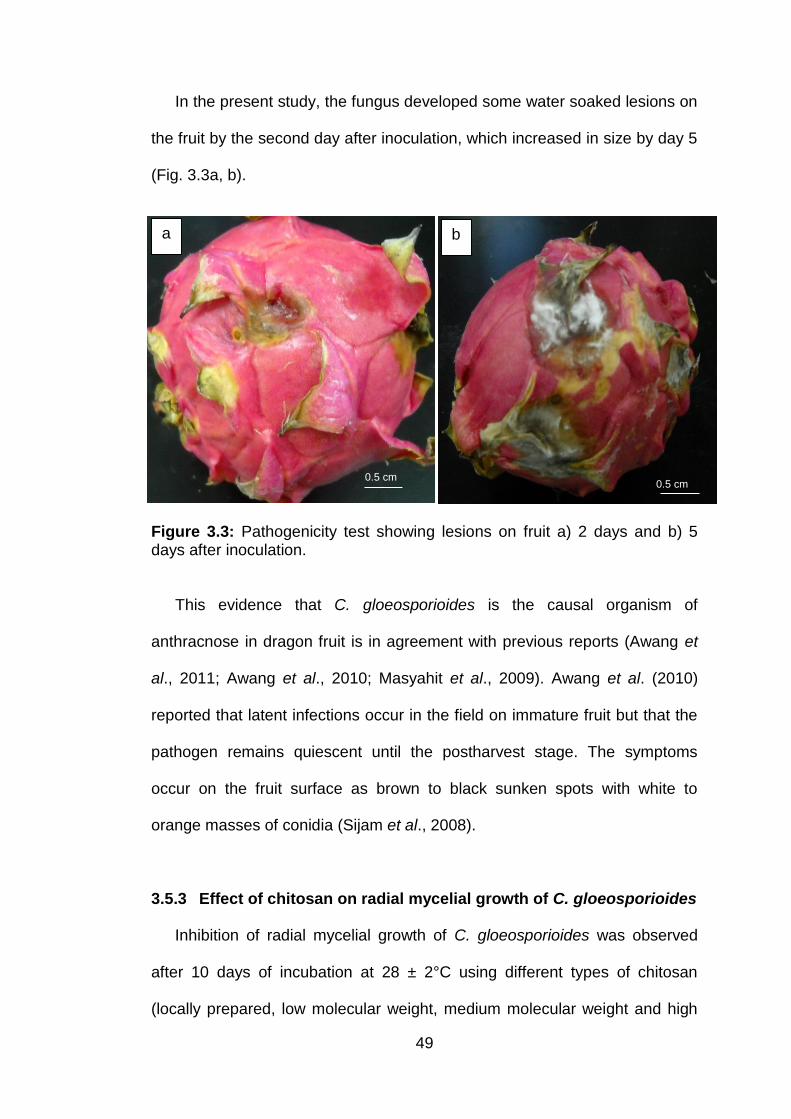
49
In the present study, the fungus developed some water soaked lesions on
the fruit by the second day after inoculation, which increased in size by day 5
(Fig. 3.3a, b).
Figure 3.3: Pathogenicity test showing lesions on fruit a) 2 days and b) 5 days after inoculation.
This evidence that C. gloeosporioides is the causal organism of
anthracnose in dragon fruit is in agreement with previous reports (Awang et
al., 2011; Awang et al., 2010; Masyahit et al., 2009). Awang et al. (2010)
reported that latent infections occur in the field on immature fruit but that the
pathogen remains quiescent until the postharvest stage. The symptoms
occur on the fruit surface as brown to black sunken spots with white to
orange masses of conidia (Sijam et al., 2008).
3.5.3 Effect of chitosan on radial mycelial growth of C. gloeosporioides
Inhibition of radial mycelial growth of C. gloeosporioides was observed
after 10 days of incubation at 28 ± 2°C using different types of chitosan
(locally prepared, low molecular weight, medium molecular weight and high
a b
0.5 cm 0.5 cm
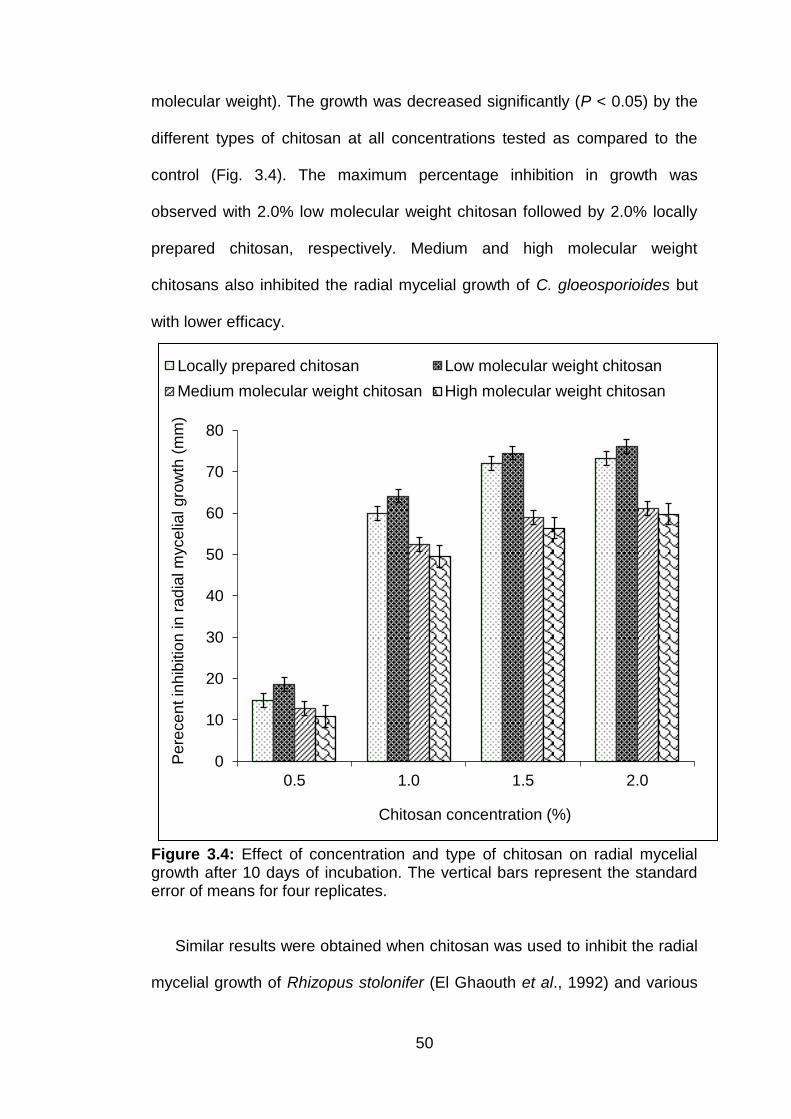
50
molecular weight). The growth was decreased significantly (P < 0.05) by the
different types of chitosan at all concentrations tested as compared to the
control (Fig. 3.4). The maximum percentage inhibition in growth was
observed with 2.0% low molecular weight chitosan followed by 2.0% locally
prepared chitosan, respectively. Medium and high molecular weight
chitosans also inhibited the radial mycelial growth of C. gloeosporioides but
with lower efficacy.
Figure 3.4: Effect of concentration and type of chitosan on radial mycelial growth after 10 days of incubation. The vertical bars represent the standard error of means for four replicates.
Similar results were obtained when chitosan was used to inhibit the radial
mycelial growth of Rhizopus stolonifer (El Ghaouth et al., 1992) and various
0
10
20
30
40
50
60
70
80
0.5 1.0 1.5 2.0
Pe
rece
nt in
hib
itio
n in r
ad
ial m
yce
lial gro
wth
(m
m)
Chitosan concentration (%)
Locally prepared chitosan Low molecular weight chitosan
Medium molecular weight chitosan High molecular weight chitosan
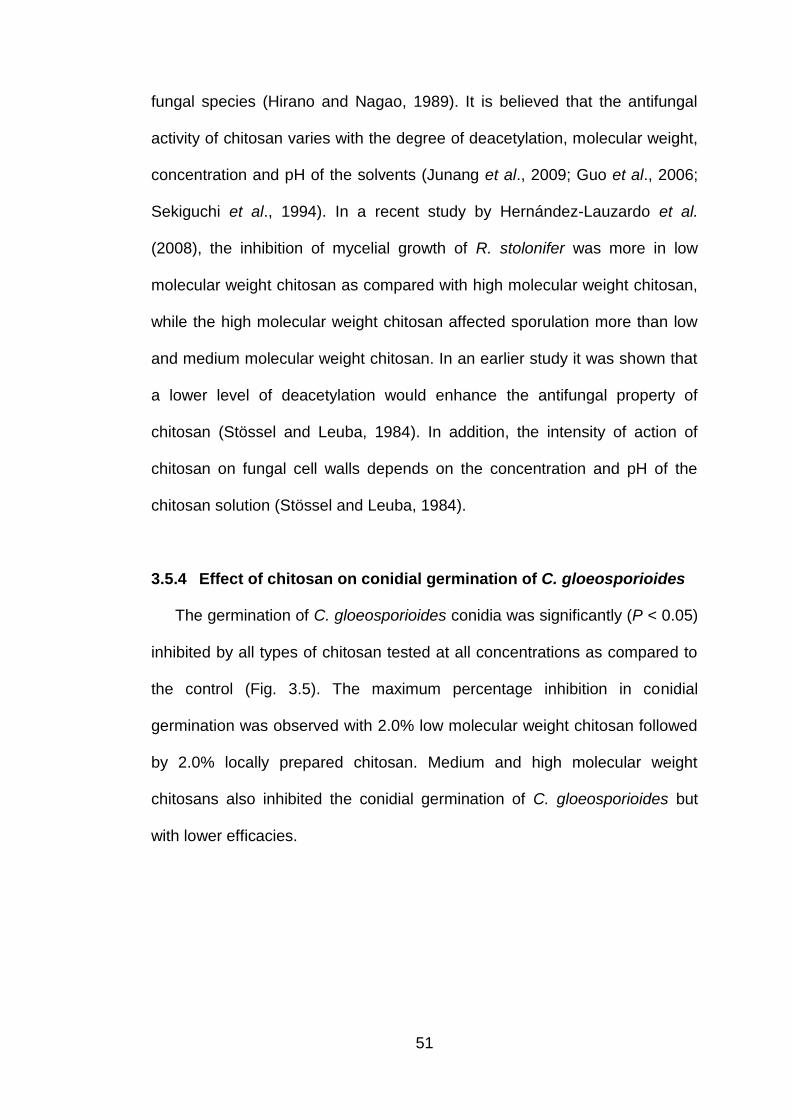
51
fungal species (Hirano and Nagao, 1989). It is believed that the antifungal
activity of chitosan varies with the degree of deacetylation, molecular weight,
concentration and pH of the solvents (Junang et al., 2009; Guo et al., 2006;
Sekiguchi et al., 1994). In a recent study by Hernández-Lauzardo et al.
(2008), the inhibition of mycelial growth of R. stolonifer was more in low
molecular weight chitosan as compared with high molecular weight chitosan,
while the high molecular weight chitosan affected sporulation more than low
and medium molecular weight chitosan. In an earlier study it was shown that
a lower level of deacetylation would enhance the antifungal property of
chitosan (Stössel and Leuba, 1984). In addition, the intensity of action of
chitosan on fungal cell walls depends on the concentration and pH of the
chitosan solution (Stössel and Leuba, 1984).
3.5.4 Effect of chitosan on conidial germination of C. gloeosporioides
The germination of C. gloeosporioides conidia was significantly (P < 0.05)
inhibited by all types of chitosan tested at all concentrations as compared to
the control (Fig. 3.5). The maximum percentage inhibition in conidial
germination was observed with 2.0% low molecular weight chitosan followed
by 2.0% locally prepared chitosan. Medium and high molecular weight
chitosans also inhibited the conidial germination of C. gloeosporioides but
with lower efficacies.
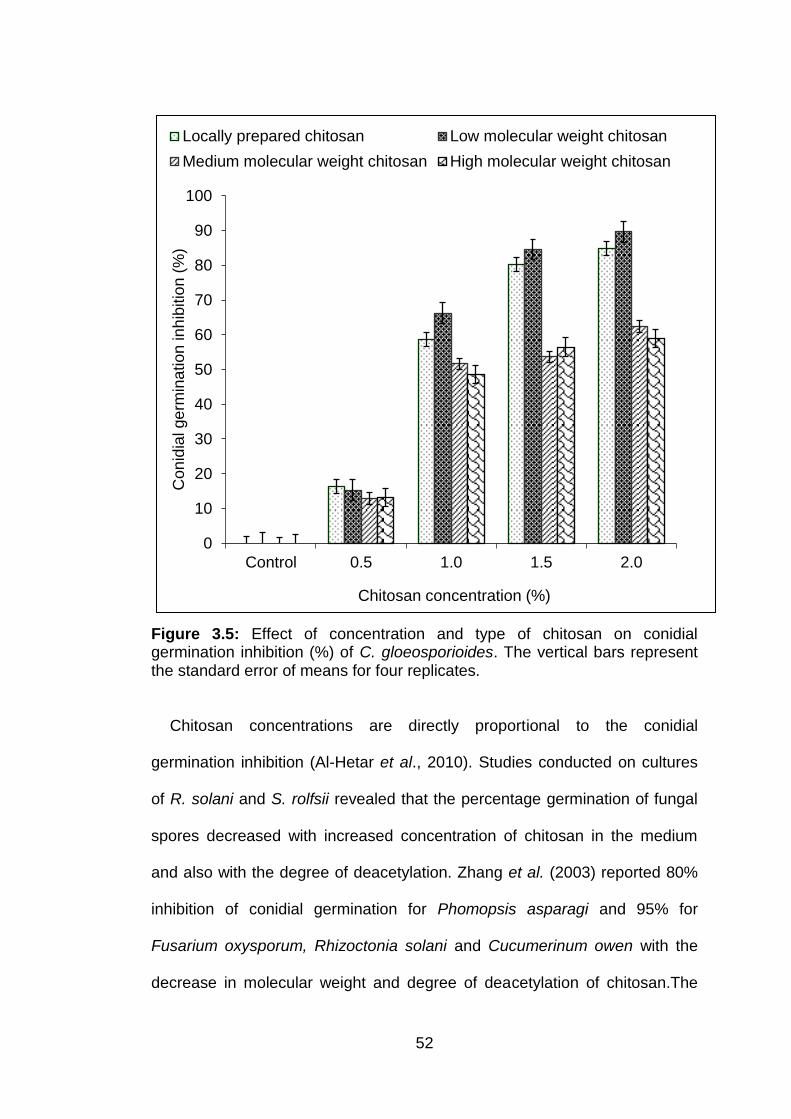
52
Figure 3.5: Effect of concentration and type of chitosan on conidial germination inhibition (%) of C. gloeosporioides. The vertical bars represent the standard error of means for four replicates.
Chitosan concentrations are directly proportional to the conidial
germination inhibition (Al-Hetar et al., 2010). Studies conducted on cultures
of R. solani and S. rolfsii revealed that the percentage germination of fungal
spores decreased with increased concentration of chitosan in the medium
and also with the degree of deacetylation. Zhang et al. (2003) reported 80%
inhibition of conidial germination for Phomopsis asparagi and 95% for
Fusarium oxysporum, Rhizoctonia solani and Cucumerinum owen with the
decrease in molecular weight and degree of deacetylation of chitosan.The
0
10
20
30
40
50
60
70
80
90
100
Control 0.5 1.0 1.5 2.0
Con
idia
l ge
rmin
atio
n inh
ibitio
n (
%)
Chitosan concentration (%)
Locally prepared chitosan Low molecular weight chitosan
Medium molecular weight chitosan High molecular weight chitosan
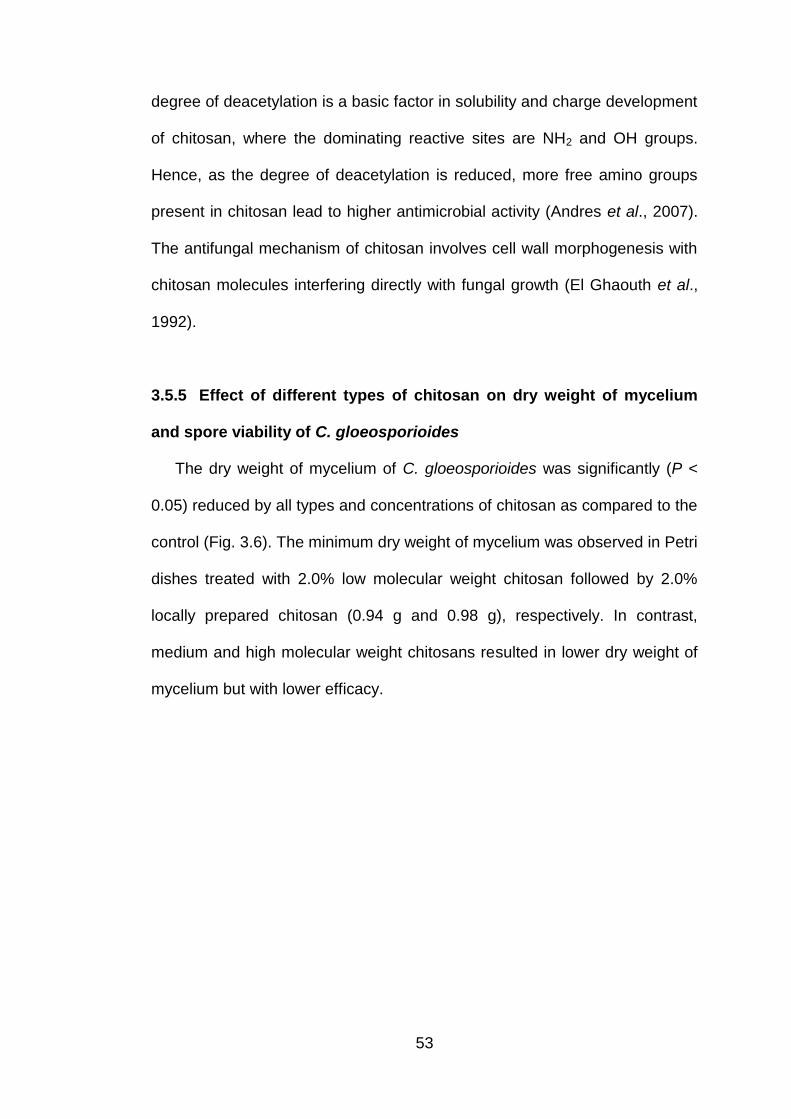
53
degree of deacetylation is a basic factor in solubility and charge development
of chitosan, where the dominating reactive sites are NH2 and OH groups.
Hence, as the degree of deacetylation is reduced, more free amino groups
present in chitosan lead to higher antimicrobial activity (Andres et al., 2007).
The antifungal mechanism of chitosan involves cell wall morphogenesis with
chitosan molecules interfering directly with fungal growth (El Ghaouth et al.,
1992).
3.5.5 Effect of different types of chitosan on dry weight of mycelium
and spore viability of C. gloeosporioides
The dry weight of mycelium of C. gloeosporioides was significantly (P <
0.05) reduced by all types and concentrations of chitosan as compared to the
control (Fig. 3.6). The minimum dry weight of mycelium was observed in Petri
dishes treated with 2.0% low molecular weight chitosan followed by 2.0%
locally prepared chitosan (0.94 g and 0.98 g), respectively. In contrast,
medium and high molecular weight chitosans resulted in lower dry weight of
mycelium but with lower efficacy.
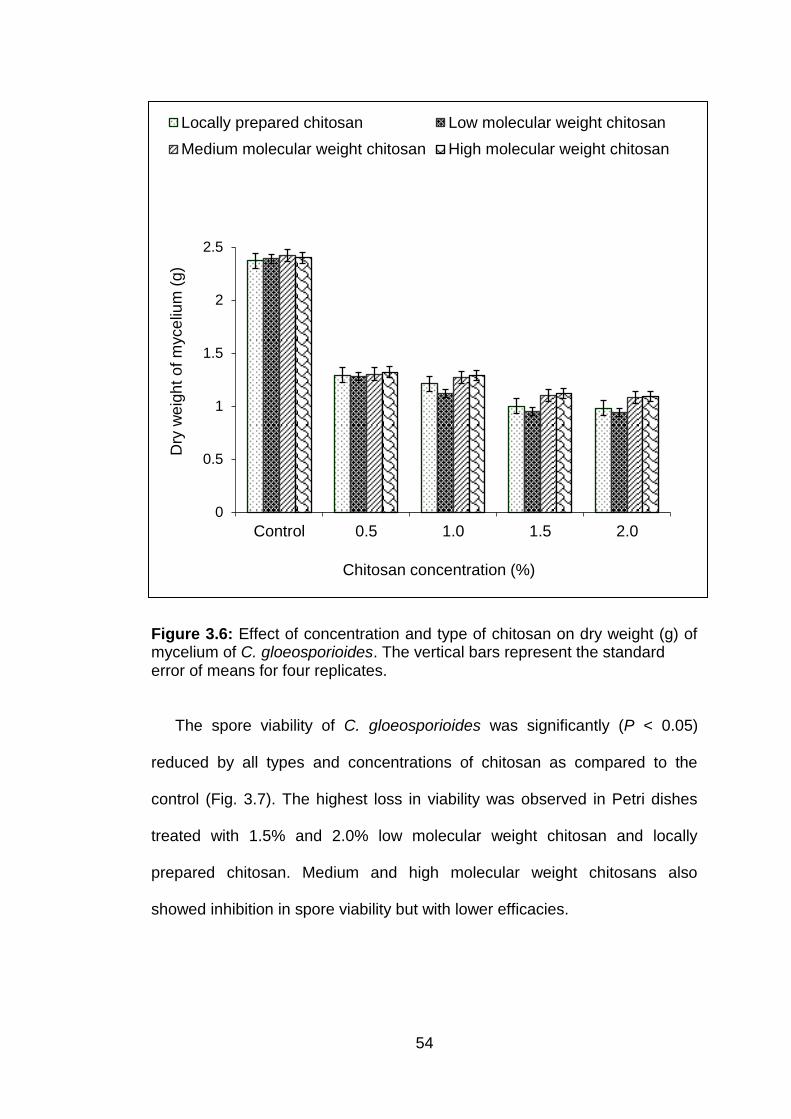
54
Figure 3.6: Effect of concentration and type of chitosan on dry weight (g) of mycelium of C. gloeosporioides. The vertical bars represent the standard error of means for four replicates.
The spore viability of C. gloeosporioides was significantly (P < 0.05)
reduced by all types and concentrations of chitosan as compared to the
control (Fig. 3.7). The highest loss in viability was observed in Petri dishes
treated with 1.5% and 2.0% low molecular weight chitosan and locally
prepared chitosan. Medium and high molecular weight chitosans also
showed inhibition in spore viability but with lower efficacies.
0
0.5
1
1.5
2
2.5
Control 0.5 1.0 1.5 2.0
Dry
we
igh
t o
f m
yce
lium
(g)
Chitosan concentration (%)
Locally prepared chitosan Low molecular weight chitosan
Medium molecular weight chitosan High molecular weight chitosan
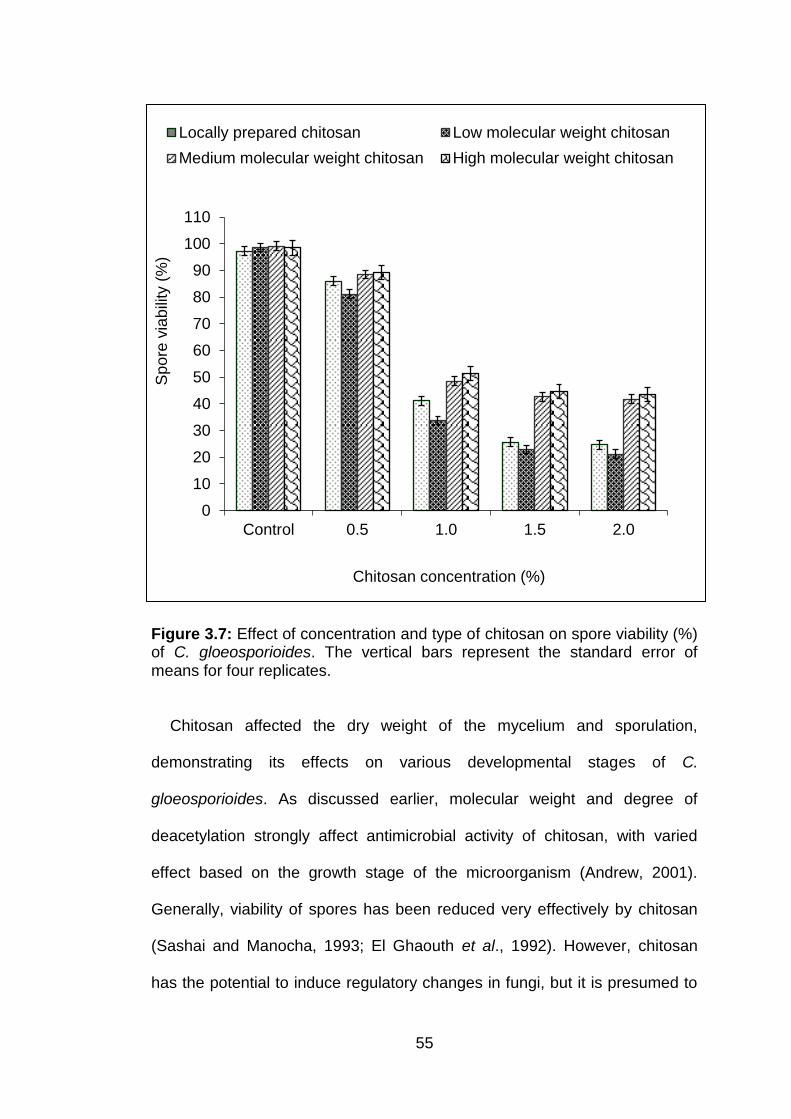
55
Figure 3.7: Effect of concentration and type of chitosan on spore viability (%) of C. gloeosporioides. The vertical bars represent the standard error of means for four replicates.
Chitosan affected the dry weight of the mycelium and sporulation,
demonstrating its effects on various developmental stages of C.
gloeosporioides. As discussed earlier, molecular weight and degree of
deacetylation strongly affect antimicrobial activity of chitosan, with varied
effect based on the growth stage of the microorganism (Andrew, 2001).
Generally, viability of spores has been reduced very effectively by chitosan
(Sashai and Manocha, 1993; El Ghaouth et al., 1992). However, chitosan
has the potential to induce regulatory changes in fungi, but it is presumed to
0
10
20
30
40
50
60
70
80
90
100
110
Control 0.5 1.0 1.5 2.0
Sp
ore
via
bili
ty (
%)
Chitosan concentration (%)
Locally prepared chitosan Low molecular weight chitosan
Medium molecular weight chitosan High molecular weight chitosan
56
be fungistatic rather than fungicidal (Raafat et al., 2008; El Ghaouth et al.,
1992).
After an initial screening experiment, two types of chitosan (low molecular
weight and locally prepared) were selected to prepare submicron dispersions
and for further in vitro evaluation against C. gloeosporioides isolated from
dragon fruit plants.
3.6 Formation of submicron chitosan dispersions
To obtain smaller droplets, a longer period of sonication was applied.
Similarly, with an increase in chitosan concentration, a longer time was
required for sonication (Table 3.1). In contrast, to achieve larger droplets at
low chitosan concentration required less time of sonication. Locally prepared
chitosan required a little more time for sonication as compared to low
molecular weight chitosan for all of the concentrations and droplet sizes.
The results regarding formation of submicron chitosan dispersions could
be explained by the increased sonication time also increasing the energy
input into the system, which resulted in a decrease of the droplet size (Jafari
et al., 2007). It has previously been reported that the time of sonication
required to prepare submicron dispersions varies with the type and
concentration of the material (Lobo and Svereika, 2003; Karbstein and
Schubert, 1995).
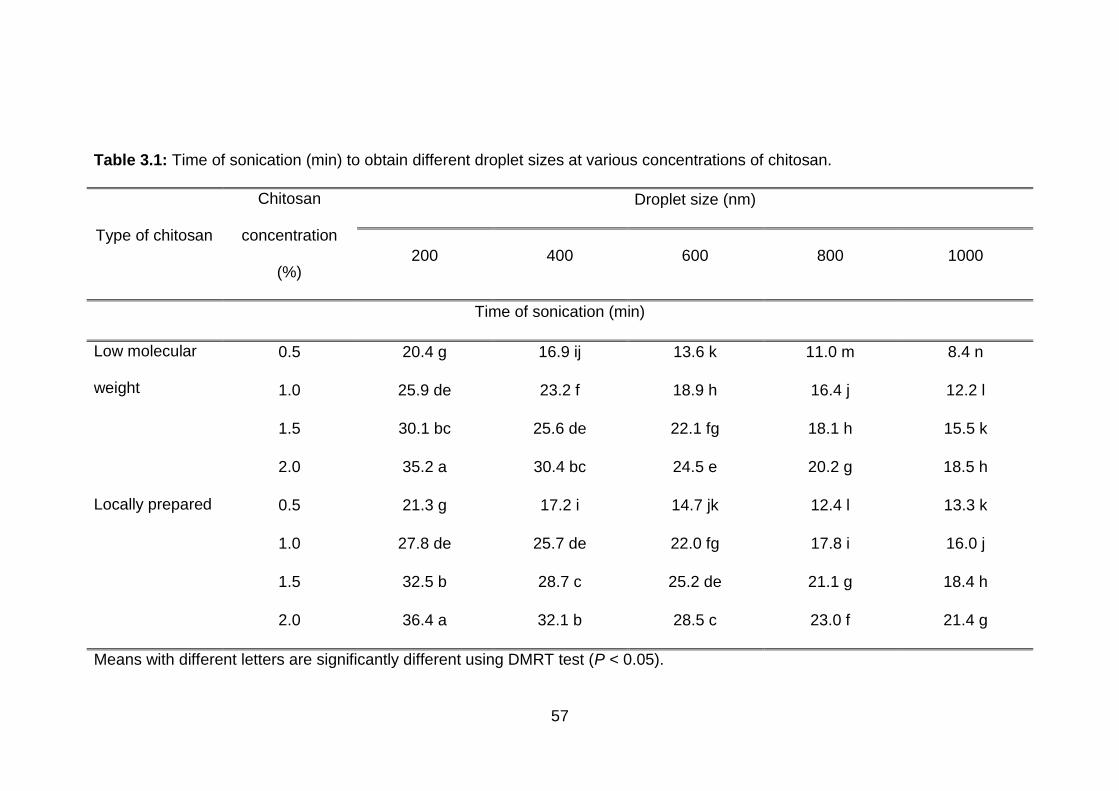
57
Table 3.1: Time of sonication (min) to obtain different droplet sizes at various concentrations of chitosan.
Type of chitosan
Chitosan
concentration
(%)
Droplet size (nm)
200 400 600 800 1000
Time of sonication (min)
Low molecular
weight
0.5 20.4 g 16.9 ij 13.6 k 11.0 m 8.4 n
1.0 25.9 de 23.2 f 18.9 h 16.4 j 12.2 l
1.5 30.1 bc 25.6 de 22.1 fg 18.1 h 15.5 k
2.0 35.2 a 30.4 bc 24.5 e 20.2 g 18.5 h
Locally prepared 0.5 21.3 g 17.2 i 14.7 jk 12.4 l 13.3 k
1.0 27.8 de 25.7 de 22.0 fg 17.8 i 16.0 j
1.5 32.5 b 28.7 c 25.2 de 21.1 g 18.4 h
2.0 36.4 a 32.1 b 28.5 c 23.0 f 21.4 g
Means with different letters are significantly different using DMRT test (P < 0.05).
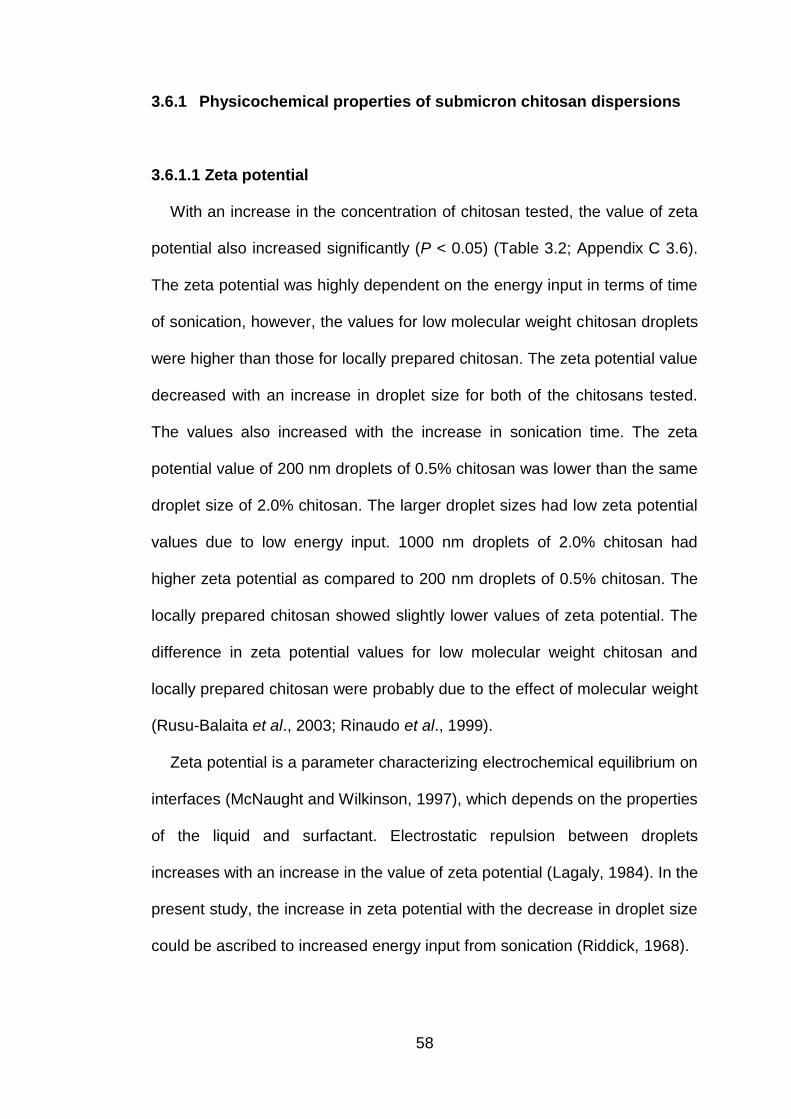
58
3.6.1 Physicochemical properties of submicron chitosan dispersions
3.6.1.1 Zeta potential
With an increase in the concentration of chitosan tested, the value of zeta
potential also increased significantly (P < 0.05) (Table 3.2; Appendix C 3.6).
The zeta potential was highly dependent on the energy input in terms of time
of sonication, however, the values for low molecular weight chitosan droplets
were higher than those for locally prepared chitosan. The zeta potential value
decreased with an increase in droplet size for both of the chitosans tested.
The values also increased with the increase in sonication time. The zeta
potential value of 200 nm droplets of 0.5% chitosan was lower than the same
droplet size of 2.0% chitosan. The larger droplet sizes had low zeta potential
values due to low energy input. 1000 nm droplets of 2.0% chitosan had
higher zeta potential as compared to 200 nm droplets of 0.5% chitosan. The
locally prepared chitosan showed slightly lower values of zeta potential. The
difference in zeta potential values for low molecular weight chitosan and
locally prepared chitosan were probably due to the effect of molecular weight
(Rusu-Balaita et al., 2003; Rinaudo et al., 1999).
Zeta potential is a parameter characterizing electrochemical equilibrium on
interfaces (McNaught and Wilkinson, 1997), which depends on the properties
of the liquid and surfactant. Electrostatic repulsion between droplets
increases with an increase in the value of zeta potential (Lagaly, 1984). In the
present study, the increase in zeta potential with the decrease in droplet size
could be ascribed to increased energy input from sonication (Riddick, 1968).
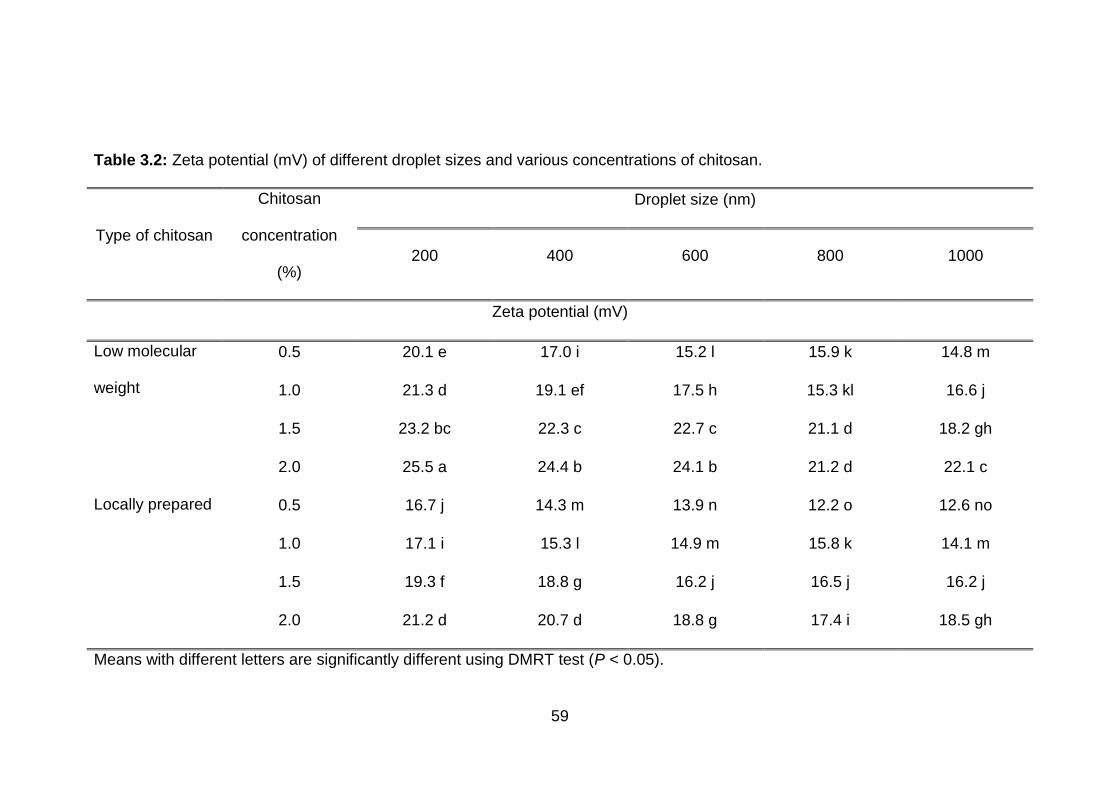
59
Table 3.2: Zeta potential (mV) of different droplet sizes and various concentrations of chitosan.
Type of chitosan
Chitosan
concentration
(%)
Droplet size (nm)
200 400 600 800 1000
Zeta potential (mV)
Low molecular
weight
0.5 20.1 e 17.0 i 15.2 l 15.9 k 14.8 m
1.0 21.3 d 19.1 ef 17.5 h 15.3 kl 16.6 j
1.5 23.2 bc 22.3 c 22.7 c 21.1 d 18.2 gh
2.0 25.5 a 24.4 b 24.1 b 21.2 d 22.1 c
Locally prepared 0.5 16.7 j 14.3 m 13.9 n 12.2 o 12.6 no
1.0 17.1 i 15.3 l 14.9 m 15.8 k 14.1 m
1.5 19.3 f 18.8 g 16.2 j 16.5 j 16.2 j
2.0 21.2 d 20.7 d 18.8 g 17.4 i 18.5 gh
Means with different letters are significantly different using DMRT test (P < 0.05).
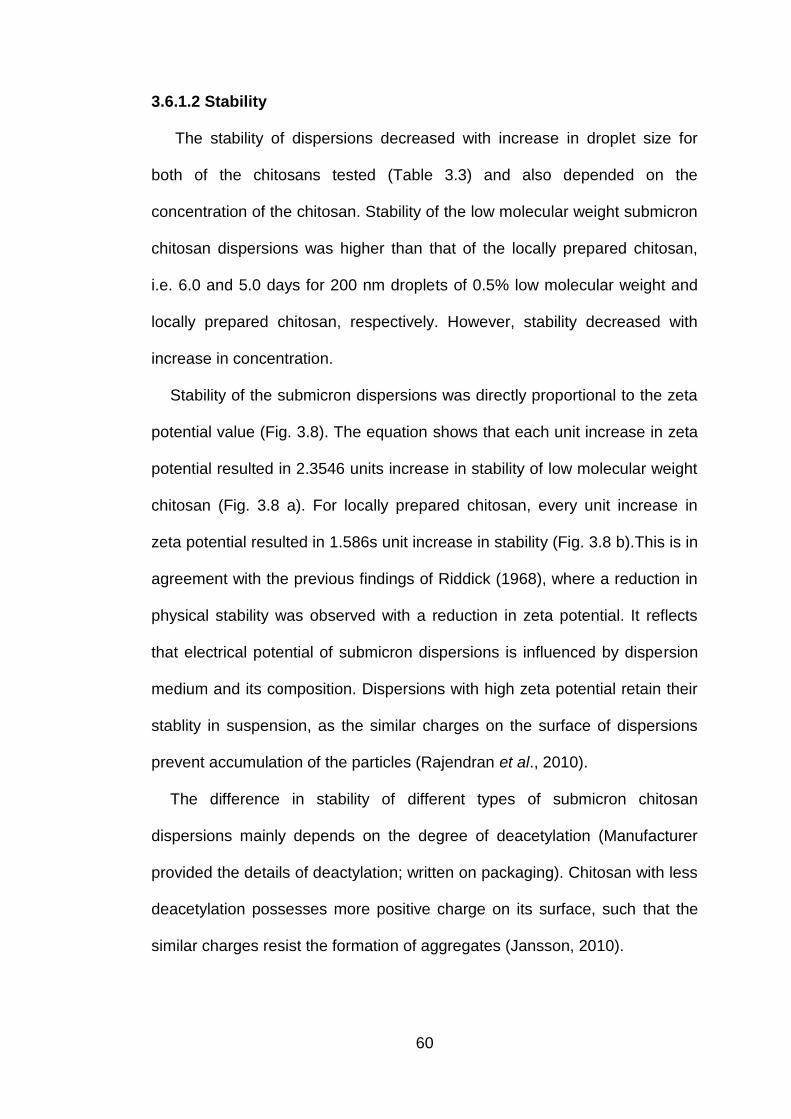
60
3.6.1.2 Stability
The stability of dispersions decreased with increase in droplet size for
both of the chitosans tested (Table 3.3) and also depended on the
concentration of the chitosan. Stability of the low molecular weight submicron
chitosan dispersions was higher than that of the locally prepared chitosan,
i.e. 6.0 and 5.0 days for 200 nm droplets of 0.5% low molecular weight and
locally prepared chitosan, respectively. However, stability decreased with
increase in concentration.
Stability of the submicron dispersions was directly proportional to the zeta
potential value (Fig. 3.8). The equation shows that each unit increase in zeta
potential resulted in 2.3546 units increase in stability of low molecular weight
chitosan (Fig. 3.8 a). For locally prepared chitosan, every unit increase in
zeta potential resulted in 1.586s unit increase in stability (Fig. 3.8 b).This is in
agreement with the previous findings of Riddick (1968), where a reduction in
physical stability was observed with a reduction in zeta potential. It reflects
that electrical potential of submicron dispersions is influenced by dispersion
medium and its composition. Dispersions with high zeta potential retain their
stablity in suspension, as the similar charges on the surface of dispersions
prevent accumulation of the particles (Rajendran et al., 2010).
The difference in stability of different types of submicron chitosan
dispersions mainly depends on the degree of deacetylation (Manufacturer
provided the details of deactylation; written on packaging). Chitosan with less
deacetylation possesses more positive charge on its surface, such that the
similar charges resist the formation of aggregates (Jansson, 2010).
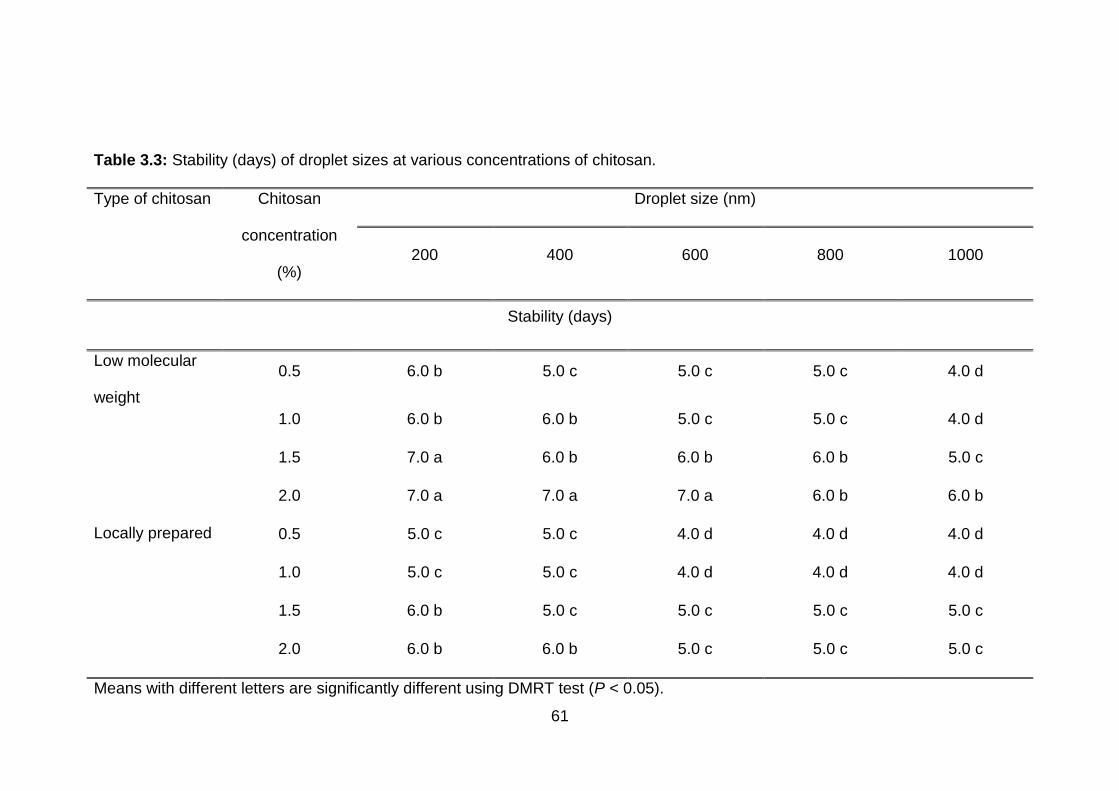
61
Table 3.3: Stability (days) of droplet sizes at various concentrations of chitosan.
Type of chitosan Chitosan
concentration
(%)
Droplet size (nm)
200 400 600 800 1000
Stability (days)
Low molecular
weight
0.5 6.0 b 5.0 c 5.0 c 5.0 c 4.0 d
1.0 6.0 b 6.0 b 5.0 c 5.0 c 4.0 d
1.5 7.0 a 6.0 b 6.0 b 6.0 b 5.0 c
2.0 7.0 a 7.0 a 7.0 a 6.0 b 6.0 b
Locally prepared 0.5 5.0 c 5.0 c 4.0 d 4.0 d 4.0 d
1.0 5.0 c 5.0 c 4.0 d 4.0 d 4.0 d
1.5 6.0 b 5.0 c 5.0 c 5.0 c 5.0 c
2.0 6.0 b 6.0 b 5.0 c 5.0 c 5.0 c
Means with different letters are significantly different using DMRT test (P < 0.05).
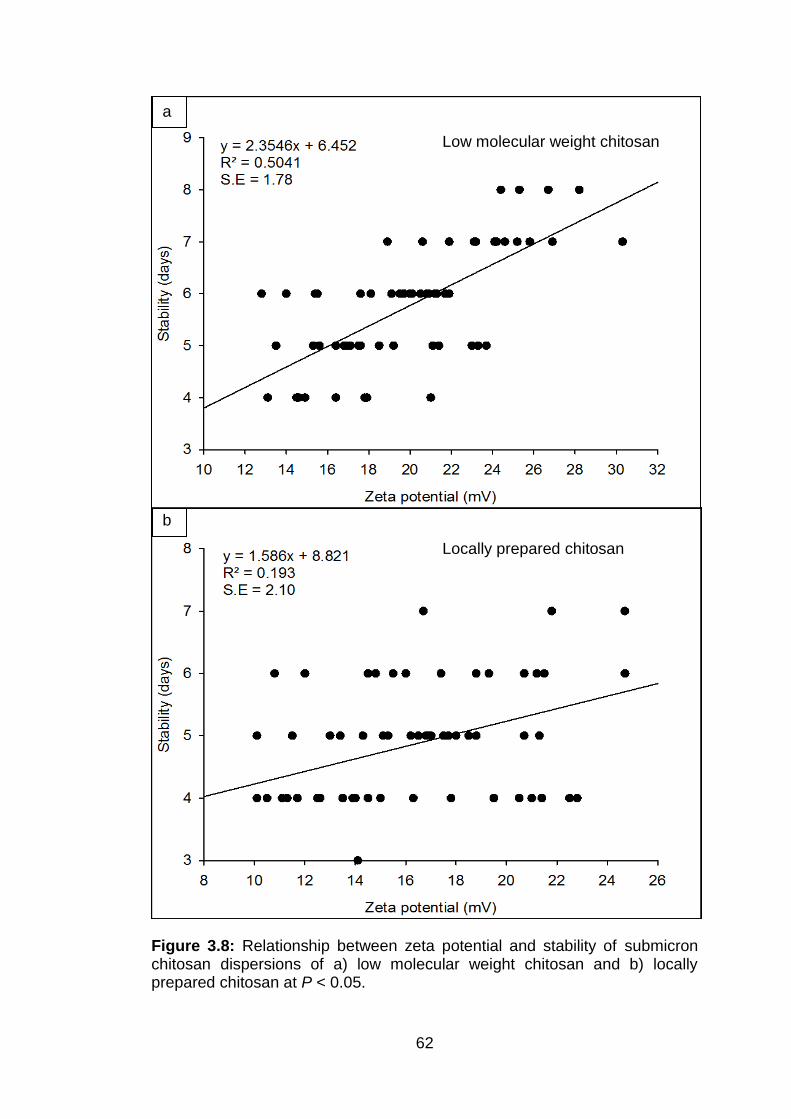
62
Figure 3.8: Relationship between zeta potential and stability of submicron chitosan dispersions of a) low molecular weight chitosan and b) locally prepared chitosan at P < 0.05.
Locally prepared chitosan
b
Low molecular weight chitosan
a
63
3.6.1.3 Viscosity and pH
The viscosity of the dispersions also increased with increase in the
concentration of chitosan and in droplet size for both of the chitosans tested
(Table 3.4). The solutions prepared with locally prepared chitosan had higher
viscosity than the low molecular weight chitosan solutions. The increase in
viscocity with the increase in droplet size and chitosan concentration could
be ascribed to the greater time of sonication and therefore the greater energy
input required to obtain smaller submicron dispersion droplets. Increased
sonication time leads to higher temperature of the submicron dispersion, thus
reducing the viscosity of the solution. The temperature was monitored using
a thermometer and constantly maintained at 25 °C by adding water in the
sonicator as it is believed that temperature is the most important factor which
reduces the viscosity and interfacial tension of dispersions (McClements,
2005). Schuhmann (1995) also reported that higher temperatures caused the
destabilisation of droplets and decreased the viscosity.
There was no effect on the pH of submicron chitosan dispersions after
formulation of dispersions and the pH at 5.6.
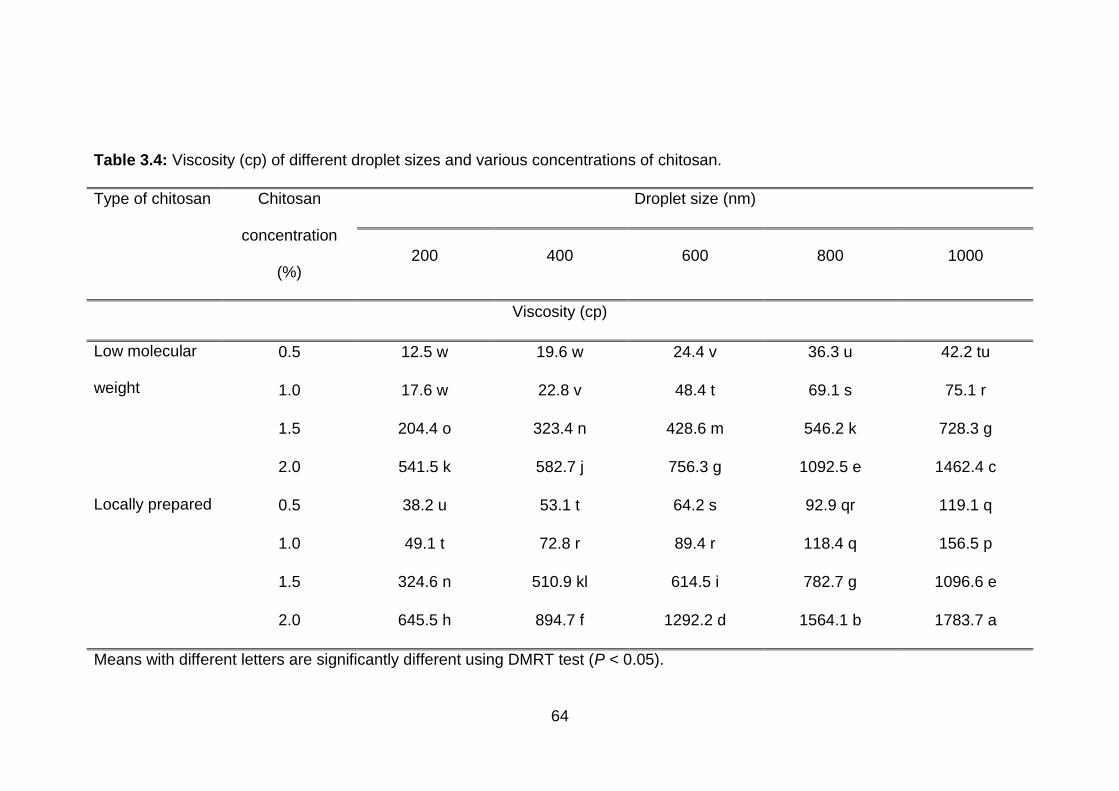
64
Table 3.4: Viscosity (cp) of different droplet sizes and various concentrations of chitosan.
Type of chitosan Chitosan
concentration
(%)
Droplet size (nm)
200 400 600 800 1000
Viscosity (cp)
Low molecular
weight
0.5 12.5 w 19.6 w 24.4 v 36.3 u 42.2 tu
1.0 17.6 w 22.8 v 48.4 t 69.1 s 75.1 r
1.5 204.4 o 323.4 n 428.6 m 546.2 k 728.3 g
2.0 541.5 k 582.7 j 756.3 g 1092.5 e 1462.4 c
Locally prepared 0.5 38.2 u 53.1 t 64.2 s 92.9 qr 119.1 q
1.0 49.1 t 72.8 r 89.4 r 118.4 q 156.5 p
1.5 324.6 n 510.9 kl 614.5 i 782.7 g 1096.6 e
2.0 645.5 h 894.7 f 1292.2 d 1564.1 b 1783.7 a
Means with different letters are significantly different using DMRT test (P < 0.05).
65
3.6.1.4 Release of chitosan from submicron dispersions
The release of chitosan from submicron dispersions decreased with
increase in the concentration of chitosan and in the droplet size for both of
the types of chitosan tested (Table 3.5). The solutions prepared with locally
prepared chitosan showed lower release of chitosan as compared to the low
molecular weight chitosan solutions. The results of this study showed that the
release of chitosan is related to the chitosan concentration, droplet size and
molecular weight of chitosan (Hejazi and Amiji, 2003). The release of
chitosan from submicron dispersion at lower concentrations was faster. This
could be attributed to the network of emulsifier and chitosan at lower
concentration containing a large volume of free moving liquid molecules,
which results in quick release of active ingredient from the emulsifiers (Desai
and Park, 2005). The molecular weight of chitosan also affects the release of
chitosan from the matrix of emulsifier. Chitosan of higher molecular weight
has higher chain relaxation ability which results in an increase in the polymer
chain entanglement of chitosan and emulsifiers (Agnihotri et al., 2004).
Therefore, variation in the molecular weight of chitosan results in different
release profiles.
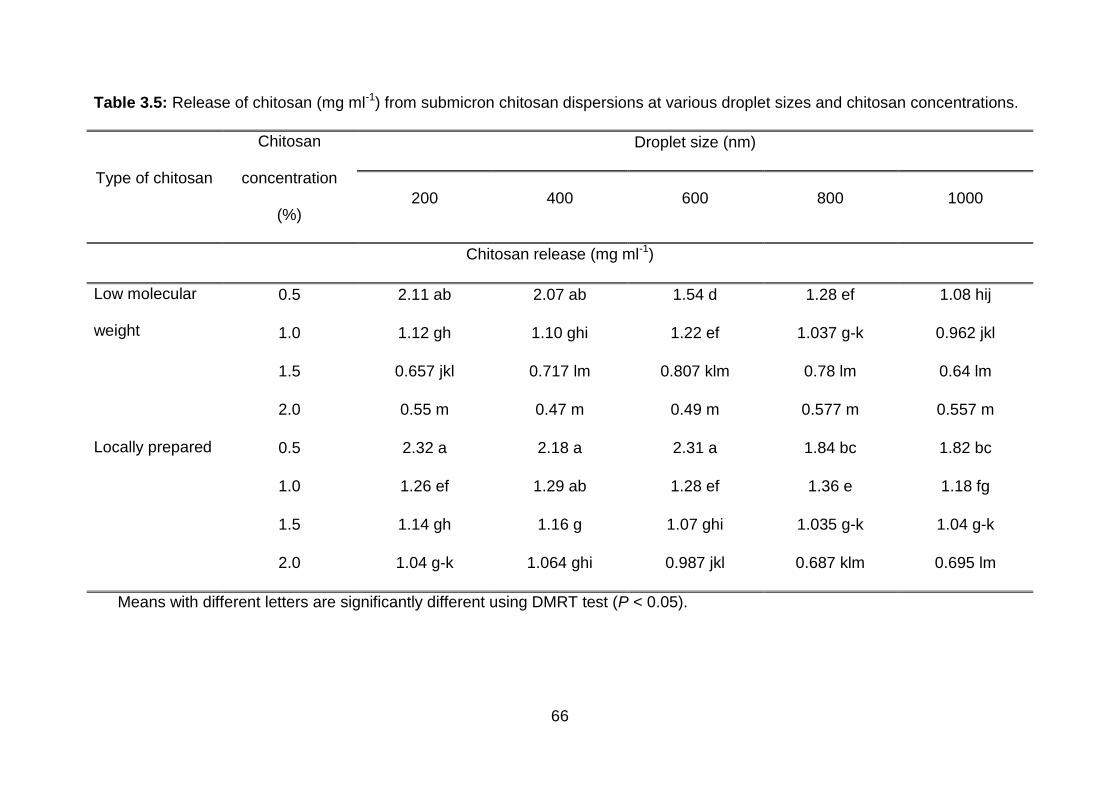
66
Table 3.5: Release of chitosan (mg ml-1) from submicron chitosan dispersions at various droplet sizes and chitosan concentrations.
Type of chitosan
Chitosan
concentration
(%)
Droplet size (nm)
200 400 600 800 1000
Chitosan release (mg ml-1)
Low molecular
weight
0.5 2.11 ab 2.07 ab 1.54 d 1.28 ef 1.08 hij
1.0 1.12 gh 1.10 ghi 1.22 ef 1.037 g-k 0.962 jkl
1.5 0.657 jkl 0.717 lm 0.807 klm 0.78 lm 0.64 lm
2.0 0.55 m 0.47 m 0.49 m 0.577 m 0.557 m
Locally prepared 0.5 2.32 a 2.18 a 2.31 a 1.84 bc 1.82 bc
1.0 1.26 ef 1.29 ab 1.28 ef 1.36 e 1.18 fg
1.5 1.14 gh 1.16 g 1.07 ghi 1.035 g-k 1.04 g-k
2.0 1.04 g-k 1.064 ghi 0.987 jkl 0.687 klm 0.695 lm
Means with different letters are significantly different using DMRT test (P < 0.05).
67
This study showed that the antimicrobial properties of chitosan depend on
the degree of deacetylation and molecular weight of the chitosan. Chitosan
with low molecular weight showed better antifungal activity than chitosan with
medium or high molecular weight. Similar to the antifungal effects, the
properties of submicron chitosan dispersions were also highly dependent on
the molecular weight of chitosan. Further studies are required to investigate
the antifungal effects of submicron chitosan dispersions and also to elucidate
the mechanism behind their antimicrobial activities.
68
CHAPTER 4
PREHARVEST ANTIFUNGAL EFFECTS OF SUBMICRON CHITOSAN DISPERSIONS ON DRAGON FRUIT PLANTS
4.1 Introduction
Colletotrichum is one of the most important pathogens on crops, causing
the serious disease anthracnose on numerous vegetables, legumes, cereals
and fruits (Bailey and Jeger, 1992). Dragon fruit is an important fruit crop
affected by anthracnose with yield losses of 20-80% (Kays, 1997).
This fungus enters plants through natural openings, by mechanical force
or wounds on the surface of plants (Chau, 1981; Van den Ende and
Linskens, 1974). It is hemibiotrophic (Wijesundera et al., 1989) and takes
nutrients from dead and living cells. It produces several types of cell wall
degrading enzymes which play a major role in the infection process and
development of symptoms (Wijesundera et al., 1984). These enzymes help
the fungal hyphae penetrate the mechanical barrier of the plant cell wall
(Köller et al., 1982) resulting in death and maceration of infected tissues
(Fernando et al., 2001).
Cultural practices, such as crop rotation, enhancement of soil quality,
water management, growing of resistant varieties, field sanitation, habitat
management and chemical fungicides, are commonly used to control the
disease (Waller, 1992). Cultural or chemical control strategies have not been
very effective against this disease (Backman, 1997).
The use of natural compounds, such as chitosan, for the control of
anthracnose is a novel approach. Chitosan is well known for its versatile
antifungal, biodegradable, nontoxic and biocompatible properties (Kurita,
69
1998). However, some drawbacks, such as its high viscosity, have been
reported (Tikhonov et al., 2006). Chitosan in the form of submicron
dispersions, which are low in viscosity and penetrate tissues more rapidly, is
a novel approach to control anthracnose of dragon fruit plants. To our
knowledge no studies have been conducted on the antifungal activities of
submicron chitosan dispersions.
Therefore, the main objectives of the present study were:
1. To test the in vitro efficacy of submicron chitosan dispersions and
emulsifiers against C. gloeosporioides.
2. To evaluate the efficacy of submicron chitosan dispersions against the
cell wall degrading enzymes produced by C. gloeosporioides.
3. To determine the in vivo antifungal activity of submicron chitosan
dispersions against anthracnose.
70
4.2 Materials and methods
Four concentrations (0.5, 1.0, 1.5 and 2.0%) of chitosan were used to
prepare submicron dispersions with droplet sizes of 200, 400, 600, 800 and
1000 nm, as described in Section 3.3. Two types of chitosan (low molecular
weight chitosan and locally prepared chitosan) were used for the in vitro
antifungal assay of submicron chitosan dispersions and emulsifiers (Brij 56
and Span 20), alone and in combination.
4.2.1 Inhibition in radial mycelial growth
The in vitro antifungal activity of submicron chitosan dispersions was
determined by the food poison technique described in Section 3.2.5.1.
4.2.2 Conidial germination inhibition test of C. gloeosporioides
The inhibition of conidial germination by submicron chitosan dispersions
was determined by the cavity slide technique described in Section 3.2.5.2.
4.2.3 Dry weight of mycelium and viability of spores
Dry mycelial weight and viability of spores were determined as described
in Sections 3.2.5.3 and 3.2.5.4, respectively.
The conidial morphology was also observed using a camera attached to a
light microscope (Nikon Eclipse 80i) at 40× magnification.

71
4.3 Methods for in vitro extraction of hydrolytic enzymes by C.
gloeosporioides
4.3.1 Extraction of cellulolytic enzymes
F C p k’ b h (S g A h) g .5% b x
methyl cellulose (w/v) (acting as a sole carbon source) with submicron
dispersions of chitosan at 0.5, 1.0, 1.5 and 2.0% was added to 250 ml
Erlenmeyer flasks. The flasks were inoculated with 9 mm mycelial disks from
ten days old cultures of C. gloeosporioides and incubated for 10 days at
room temperature. The contents of the flasks were filtered after 10 days
using Whatman filter paper number 1. The 150 ml of filtrate was mixed with
350 ml of 0.1 M potassium phosphate buffer pH 6.8 followed by
centrifugation at 5000 x g for 20 minutes at 4°C. The supernatant was
lyophilized and served as the source for enzyme assays (Fischer et al.,
1995).
4.3.1.1 β-galactosidase
β-galactosidase activity was determined by hydrolysis of the chromogenic
substance, O-nitrophenyl-β-D-galactoside (ONGP) as a substrate (Byrde and
Fielding, 1968). An extract of 100 µl was mixed with 0.9 ml of Z-buffer and 2
ml of breaking buffer. The mixture was incubated in a water bath at 28 °C for
5 minutes. ONGP (0.2 ml) was added and the mixture incubated again at
28°C in a water bath. The reaction was stopped after 30 minutes by adding
0.5 ml of Na2CO3. The hydrolysis was monitored spectrophotometrically at
420 nm using a UV-Vis spectrophotometer (Varioskan Flash Multimode
72
Reader, Thermo Fisher Scientific, USA). One β-galactosidase activity unit (U)
was defined as the quantity of enzyme required for hydrolysis of 1 µmol of
substrate (ONGP) per minute (U mg-1 protein) under given experimental
conditions (Gueguen et al., 1997). Specific activity was measured using the
formula:
β g v 42 .7
. 45 p x v
Where,
OD420 is optical density of product at 420 nm
Factor 1.7 corrects the reaction volume
Factor 0.0045 was optical density of O-nitrophenol at 420 nm
Z-buffer contained 60 mM Na2HPO4.7H2O, 40mM NaH2PO4.H2O, 10mM
KCl and 1mM MgSO4.7H2O adjusted to pH 7. After preparation, the buffer
was stored at 4°C. Before use, 2.7 ml of 2-mercaptoethanol was added in 1
litre of the Z-buffer.
Breaking buffer contained 50 ml of 100 mM Tris HCl (pH 8), 1 ml of 1mM
dithiothreitol and 50 ml of 20% glycerol. The protein content of the filtrate was
measured according to Bradford (1976) with bovine serum albumin (BSA) as
standard (Appendix B 4.1).
4.3.1.2 β-1, 4-glucanase
β-1,4-glucanase activity was measured spectrophometrically by
determining the amount of reducing sugars released from 1 g of filter paper
(Whatman no. 1) as substrate, using dinitrosalicylic acid as a reagent
(Gopinath et al., 2006). Crude extract (0.5 ml) was added to 1 ml of Na-
73
citrate buffer pH 4.8 and incubated at 50°C for 60 minutes. After incubation,
3.0 ml of 1.0% 3,5-dinitrosalicylic reagent was added to the reaction mixture
and boiled at 100°C for 5 minutes, followed by immediate incubation on ice.
The amount of reducing sugars produced was determined by a UV-Vis
spectrophotometer (Varioskan Flash Multimode Reader, Thermo Fisher
Scientific, USA) at 540 nm. The enzyme activity was expressed as mg
glucose released per min. Boiled enzyme extract served as a control (Jayaraj
and Radakrishnan, 2003). A standard curve was prepared using a glucose
stock solution (Appendix B 4.2). Specific activity was measured using the
following formula after correcting the values with the glucose standard curve
β , 4 g v . 85
2. g g
Where,
Factor 0.185 is the optical density of 1.0% 3, 5-dinitrosalicylic acid at 540 nm
4.3.2 Extraction of pectinolytic enzymes
Pectinolytic enzymes were extracted using the method described in
Section 4.3.1 but with 1.0% citrus pectin (w/v) as a carbon source (Jayaraj
and Radhakrishnan, 2003). The supernatant obtained was precipitated by
adding 75% chilled acetone and centrifuged for 10 minutes at 10,000 rpm
and 4°C. The pellets obtained after were washed twice with 95% chilled
ethanol and used for further determination of enzyme activity (Ayers et al.,
1966).
74
4.3.2.1 Polygalacturonase activity
The pellets (Section 4.3.2) were re dissolved in 1ml of 50 mM potassium
phosphate buffer at pH 5.5, incubated in a water bath for five h at 30 °C and
absorbance was measured at 556 nm (εM = 54176 mol-1 l-1 cm) with a UV-Vis
spectrophotometer (Varioskan Flash Multimode Reader, Thermo Fisher
Scientific, USA) (Cooper and Wood, 1975). One unit of polygalacturonase
was defined as the amount of enzyme that liberates 1 µmol of reducing
groups per ml at 30°C using D-galacturonic acid as a standard (Appendix B
4.3).
4.3.2.2 Pectin lyase activity
The pellets (Section 4.3.2) were dissolved in a mixture of 1 ml of 50 mM
Tris-HCl and 1ml of 1mM CaCl2 pH 8.5. One hundred µl of the dissolved
sample was mixed with reaction mixture, which contained 200 µl of 1.0%
polygalacturonic acid dissolved in 1.0% pectin from citrus and 50µl of 50mM
Tris-HCl, and incubated at 30°C for five hours. The absorbance was
measured at 550nm with a UV-Vis spectrophotometer (Varioskan Flash
Multimode Reader, Thermo Fisher Scientific, USA) (Gainvors et al., 1994).
One unit of pectin lyase was defined as the amount of enzyme producing one
µmol of unsaturated product per ml at 30°C. A standard curve of bovin serum
albumin was used to determine protein content (Appendix B 4.1). Specific
acitivity was defined as U mg-1 protein.
75
4.4 Preliminary field trial to screen potential treatments
4.4.1 Plant material and experimental site preparation
The size of the experimental area was 87 x 45 metres. A system of poles
was already installed in the field with the poles 2 metres high and 3 metres
apart.
Cuttings of 0.5 m in length, from mature, healthy red dragon fruit plants (2
years old), were obtained from a commercial orchard located at Puchong,
Selangor, Malaysia. These cuttings were rooted and grown in a shade house
at The University of Nottingham, Malaysia Campus. After 2 months, they
were planted in the field plot at Farm no B2, Taman Pertanian University,
UPM, Serdang, Malaysia. The soil of the field site was Serdang series (Table
4.1).
The first trial was carried out from April 2011 to March 2012 and the
second from August 2011 to July 2012. For these trials, the plants were
raised separately. Planting holes were prepared by digging the soil to a depth
of 14 cm and four plants were planted at each pole.
4.4.1.1 Fertilizer applications
The rate and schedule of fertilizer application was done according to the
recommendations made by Yusoff (2006). Organic fertilizer Amino-Q®
(1.38% N: 3.02% P2O5: 0.98% K2O: 0.87% MgO: 5.74% CaO) was applied at
350 g plant-1 at intervals of one month.
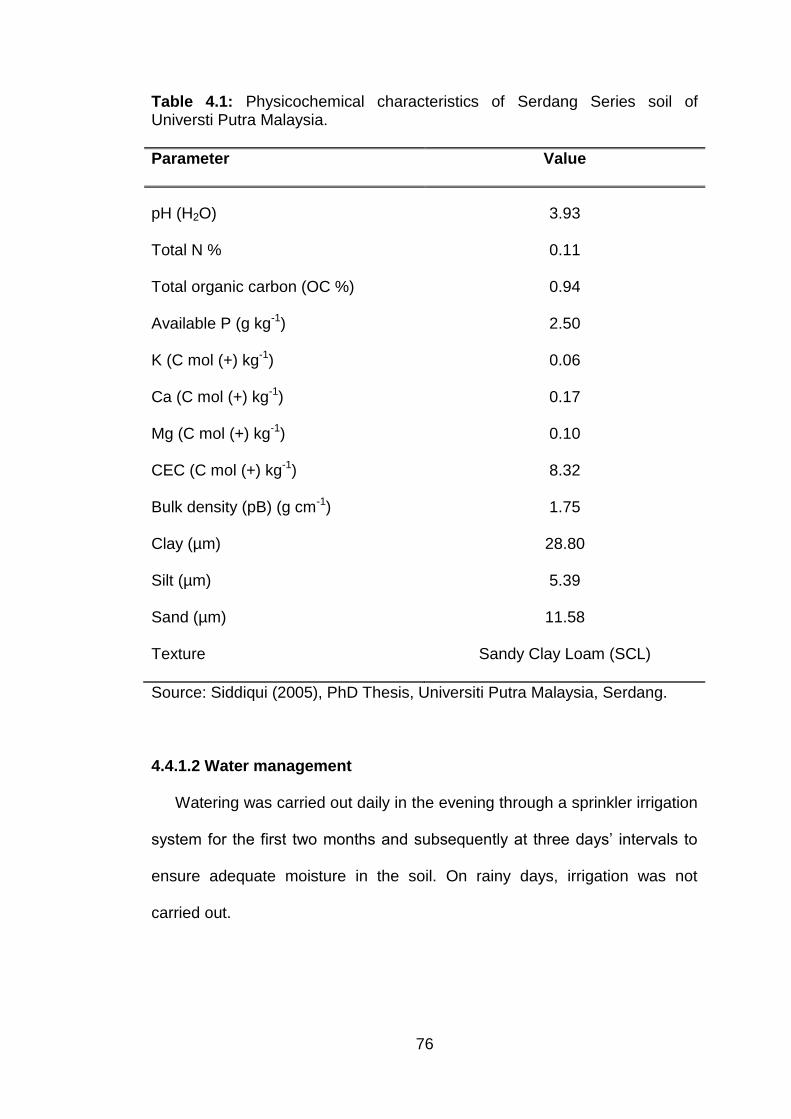
76
Table 4.1: Physicochemical characteristics of Serdang Series soil of Universti Putra Malaysia.
Parameter Value
pH (H2O) 3.93
Total N % 0.11
Total organic carbon (OC %) 0.94
Available P (g kg-1) 2.50
K (C mol (+) kg-1) 0.06
Ca (C mol (+) kg-1) 0.17
Mg (C mol (+) kg-1) 0.10
CEC (C mol (+) kg-1) 8.32
Bulk density (pB) (g cm-1) 1.75
Clay (µm) 28.80
Silt (µm) 5.39
Sand (µm) 11.58
Texture Sandy Clay Loam (SCL)
Source: Siddiqui (2005), PhD Thesis, Universiti Putra Malaysia, Serdang.
4.4.1.2 Water management
Watering was carried out daily in the evening through a sprinkler irrigation
h w h b q h ’ v
ensure adequate moisture in the soil. On rainy days, irrigation was not
carried out.
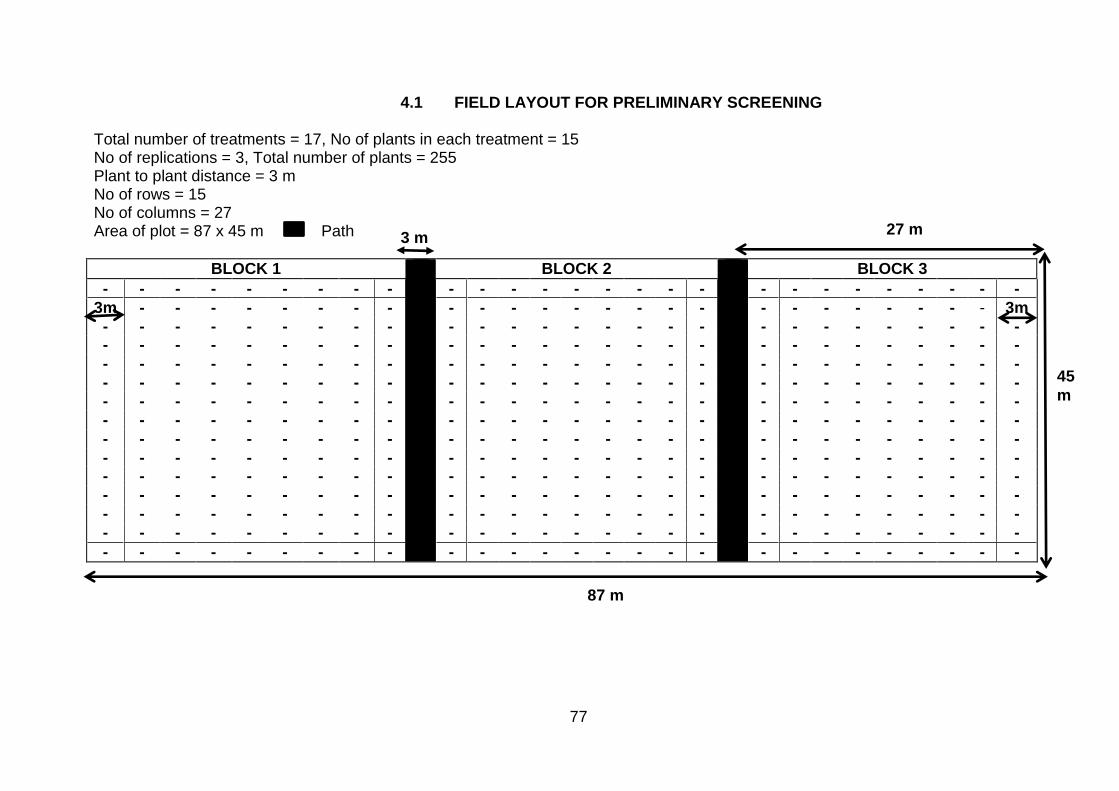
77
4.1 FIELD LAYOUT FOR PRELIMINARY SCREENING
Total number of treatments = 17, No of plants in each treatment = 15 No of replications = 3, Total number of plants = 255 Plant to plant distance = 3 m No of rows = 15 No of columns = 27 Area of plot = 87 x 45 m Path
BLOCK 1 BLOCK 2 BLOCK 3
- - - - - - - - - - - - - - - - - - - - - - - - - - -
3m - - - - - - - - - - - - - - - - - - - - - - - - - 3m
- - - - - - - - - - - - - - - - - - - - - - - - - - - - - - - - - - - - - - - - - - - - - - - - - - - - - -
- - - - - - - - - - - - - - - - - - - - - - - - - - -
- - - - - - - - - - - - - - - - - - - - - - - - - - - - - - - - - - - - - - - - - - - - - - - - - - - - - -
- - - - - - - - - - - - - - - - - - - - - - - - - - -
- - - - - - - - - - - - - - - - - - - - - - - - - - -
- - - - - - - - - - - - - - - - - - - - - - - - - - - - - - - - - - - - - - - - - - - - - - - - - - - - - -
- - - - - - - - - - - - - - - - - - - - - - - - - - -
- - - - - - - - - - - - - - - - - - - - - - - - - - -
- - - - - - - - - - - - - - - - - - - - - - - - - - -
- - - - - - - - - - - - - - - - - - - - - - - - - - -
3 m
87 m
27 m
45
m
78
4.4.2 Disease incidence
Plants used for assessment of disease incidence were inoculated
artificially using a toothpick method (Melanie et al., 2004). A sterile sharp
toothpick was used to make wounds approximately 2 mm deep and a sterile
syringe needle was used to inoculate 20 µl of spore suspension (1 x 10⁶
spores ml-1) in each wound site. Five areas on five stems of each plant were
inoculated. Starting one week after inoculation, the plants were treated at
monthly intervals for 3 months with conventional chitosan solution and
submicron chitosan dispersions applied as spray until run off (at each pole,
150 ml for the first month, 250 ml for the second and 400ml for the third).
Development of foliar symptoms as water soaked necrotic lesions was
assessed at intervals of 30 days for three months. Disease incidence was
expressed as the percentage of stems showing necrotic symptoms out of the
total number of inoculated stems in each treatment (Cooke, 2006).
I % N b p
T b p
4.4.3 Area under disease progress curve
The effectiveness of the chitosan treatments was assessed as reduction
in the disease incidence and was expressed by plotting a disease progress
curve. The area under the disease progress curve (AUDPC) was calculated
using the formula described by Campbell and Madden (1990).
A PC ∑ (
)(
) 2]
Where, t = time interval between assessments (days)
y = disease incidence; n = number of assessments
79
4.4.4 Disease severity
Disease severity (DS) was recorded using a scale of 1-5 at intervals of
thirty days, where 0 = no disease, 1 = 1-20%, 2 = 21-40%, 3 = 41-60%, 4 =
61-80% and 5 = 81-100% disease symptoms (Bowen, 2007). It was
expressed as a percentage (%) calculated using the formula proposed by
Kranz (1988).
S (%) ∑ ( b p p v )
N
∑ ( ) ( ) ( 2) ( 3) ( 4) ( 5)
N
Where, N = Total number of sampled plants
Z = Highest rating scale
The in vitro experiments were arranged in a completely randomized
design (CRD) with four replicates, each consisting of twenty units. The
experimental layout for DI and DS was a randomized complete block design
(RCBD) with three replicates and each replicate consisted of 17 plots
(treatments) with five plants per plot. Extra plants were planted on all the four
sides of each experimental block in order to minimize the border effect. Data
for DI and DS were subjected to arcsine and square root transformation,
respectively and then back transformed for presentation. Data collected were
subjected to UNIVARIATE procedure in SAS for testing the normality of
residuals. Analysis of variance (ANOVA) was carried out and tested for
significant differences among treatments by ’ p g
(DMRT) at P < 0.05, using statistical analysis system SAS® version 9.1
(Appendix C 4.1 to 4.16).
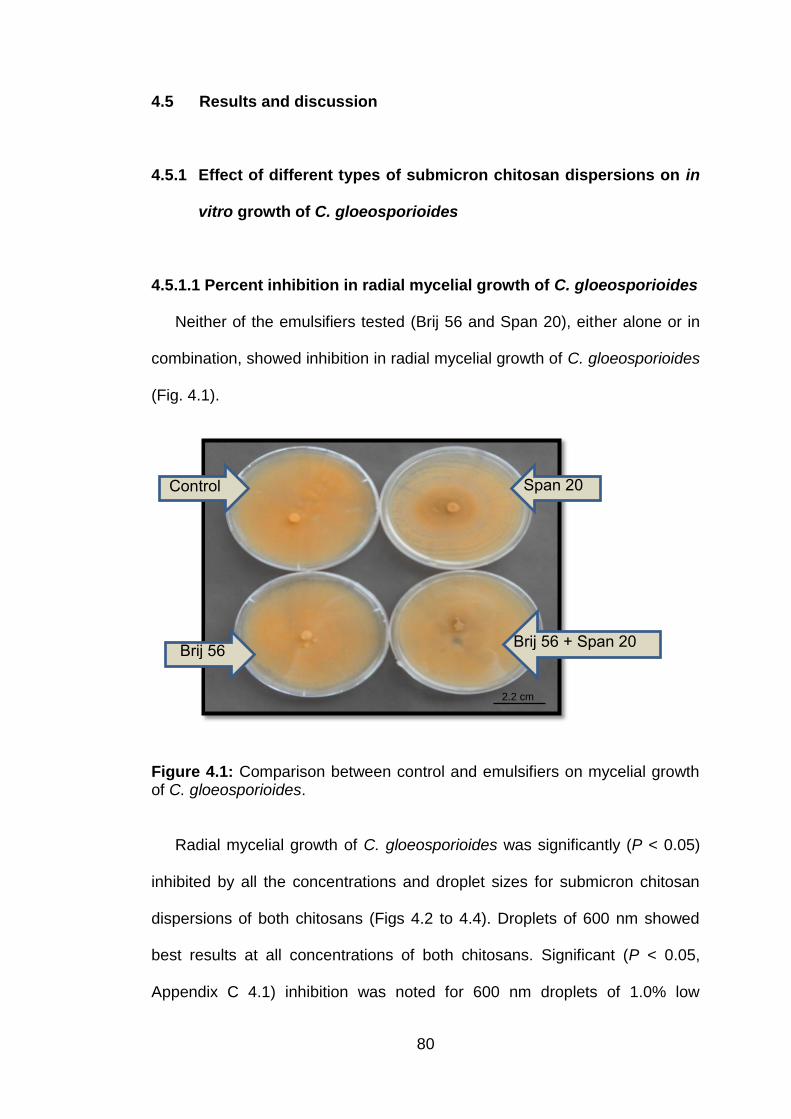
80
4.5 Results and discussion
4.5.1 Effect of different types of submicron chitosan dispersions on in
vitro growth of C. gloeosporioides
4.5.1.1 Percent inhibition in radial mycelial growth of C. gloeosporioides
Neither of the emulsifiers tested (Brij 56 and Span 20), either alone or in
combination, showed inhibition in radial mycelial growth of C. gloeosporioides
(Fig. 4.1).
Figure 4.1: Comparison between control and emulsifiers on mycelial growth of C. gloeosporioides.
Radial mycelial growth of C. gloeosporioides was significantly (P < 0.05)
inhibited by all the concentrations and droplet sizes for submicron chitosan
dispersions of both chitosans (Figs 4.2 to 4.4). Droplets of 600 nm showed
best results at all concentrations of both chitosans. Significant (P < 0.05,
Appendix C 4.1) inhibition was noted for 600 nm droplets of 1.0% low
C
Sp 2
j 56 j 56 Sp 2
2.2 cm
81
molecular weight chitosan (Figs 4.2a, 4.3) and for 600 nm droplets of 1.5%
chitosan (Figs 4.2b, 4.4; Appendix C 4.2).
The 600 nm submicron chitosan dispersions had the greatest effects
against C. gloeosporioides in in vitro experiments and, as the concentration
of chitosan increased, the growth of C. gloeosporioides was decreased.
Comparable results were obtained when chitosan was used on strawberry to
control growth of Rhizopus stolonifer and Botrytis cinerea (El Ghaouth et al.,
1992), and when chitosan was increased from 0.75 to 6.0 mg ml-1 to
decrease the mycelial growth of Alternaria alternata and C. gloeosporioides
(Muñoz et al., 2009; Ali and Mahmud, 2008; Wade and Lamondia, 1994).
Chitosan has also been reported to affect Sclerotinia sclerotiorum on carrot
(Cheah et al., 1997), and at 3% to inhibit completely F. oxysporium, R. solani,
Pencillium digitatum and C. gloeosporioides isolated from fruit and
vegetables (Bautista-Baños et al., 2004 & 2003). Liu et al. (2007) showed
that low molecular weight chitosan at 0.01-1.0% markedly inhibited radial
mycelial growth of B. cinerea and Penicillium expansum.
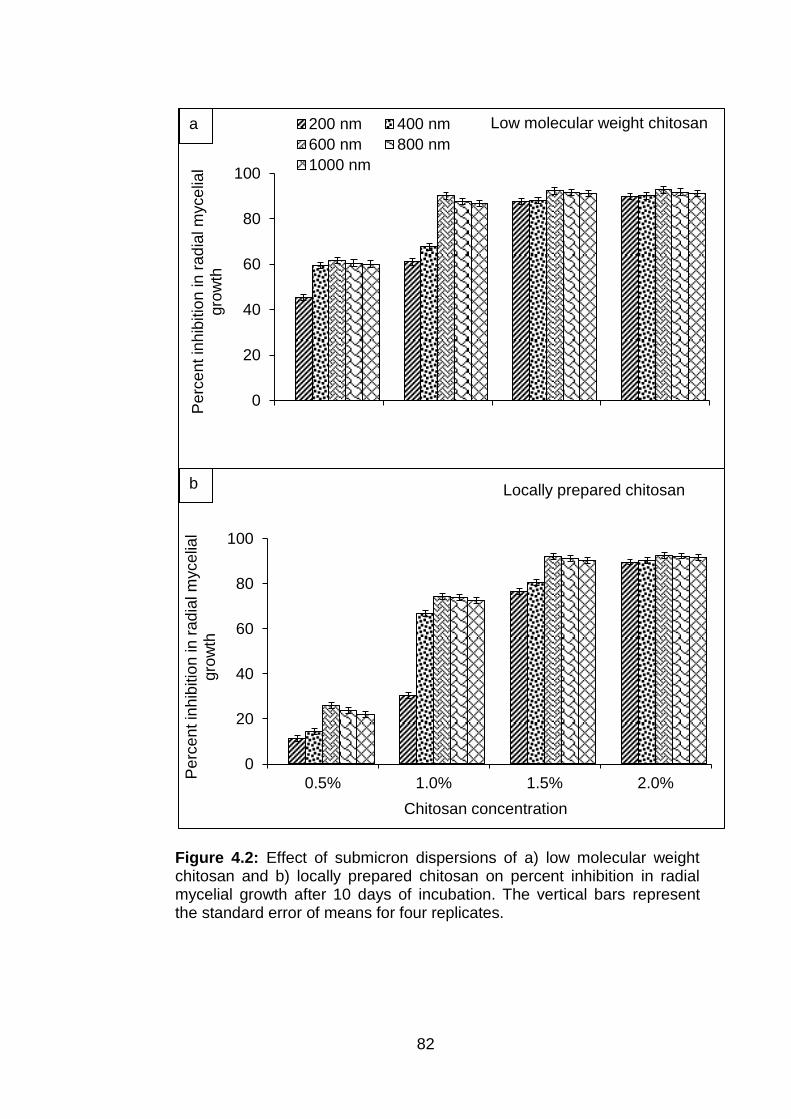
82
Figure 4.2: Effect of submicron dispersions of a) low molecular weight chitosan and b) locally prepared chitosan on percent inhibition in radial mycelial growth after 10 days of incubation. The vertical bars represent the standard error of means for four replicates.
0
20
40
60
80
100
0.5% 1.0% 1.5% 2.0%
Pe
rcen
t in
hib
itio
n in r
ad
ial m
yce
lial
gro
wth
Chitosan concentration
Locally prepared chitosan
0
20
40
60
80
100
Pe
rcen
t in
hib
itio
n in r
ad
ial m
yce
lial
gro
wth
200 nm 400 nm
600 nm 800 nm
1000 nm
Low molecular weight chitosan a
b
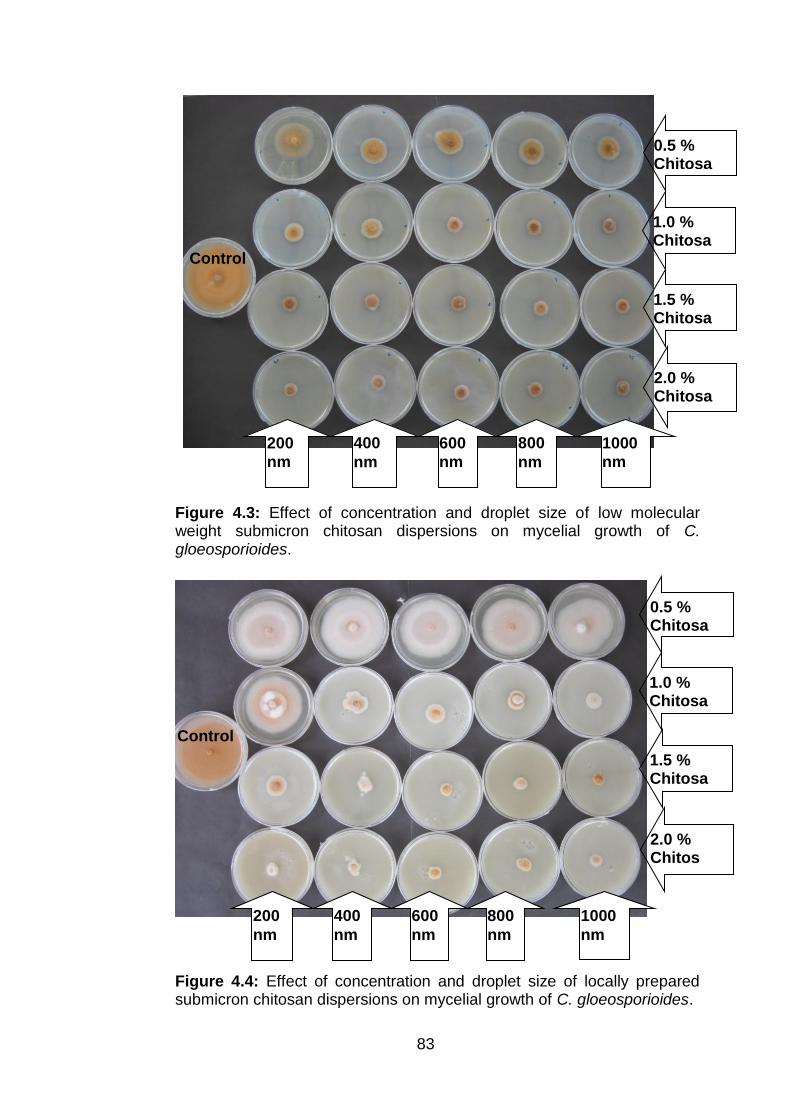
83
Figure 4.3: Effect of concentration and droplet size of low molecular weight submicron chitosan dispersions on mycelial growth of C. gloeosporioides.
Figure 4.4: Effect of concentration and droplet size of locally prepared submicron chitosan dispersions on mycelial growth of C. gloeosporioides.
Control
Control
200
nm
800
nm
600
nm
400
nm
1000
nm
2.0 % Chitosan
1.5 % Chitosan
1.0 % Chitosan
0.5 % Chitosan
2.0 % Chitosan
1.5 % Chitosan
1.0 % Chitosan
0.5 % Chitosan
200 nm
800
nm
600 nm
400
nm
1000 nm
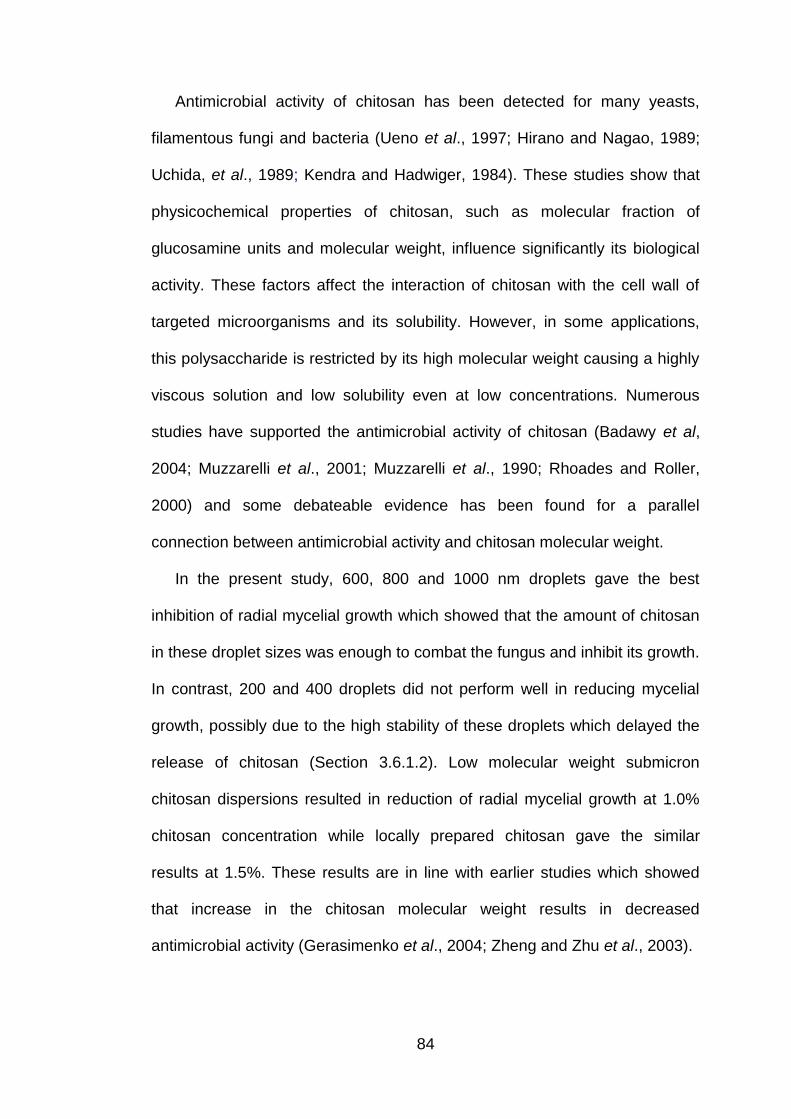
84
Antimicrobial activity of chitosan has been detected for many yeasts,
filamentous fungi and bacteria (Ueno et al., 1997; Hirano and Nagao, 1989;
Uchida, et al., 1989; Kendra and Hadwiger, 1984). These studies show that
physicochemical properties of chitosan, such as molecular fraction of
glucosamine units and molecular weight, influence significantly its biological
activity. These factors affect the interaction of chitosan with the cell wall of
targeted microorganisms and its solubility. However, in some applications,
this polysaccharide is restricted by its high molecular weight causing a highly
viscous solution and low solubility even at low concentrations. Numerous
studies have supported the antimicrobial activity of chitosan (Badawy et al,
2004; Muzzarelli et al., 2001; Muzzarelli et al., 1990; Rhoades and Roller,
2000) and some debateable evidence has been found for a parallel
connection between antimicrobial activity and chitosan molecular weight.
In the present study, 600, 800 and 1000 nm droplets gave the best
inhibition of radial mycelial growth which showed that the amount of chitosan
in these droplet sizes was enough to combat the fungus and inhibit its growth.
In contrast, 200 and 400 droplets did not perform well in reducing mycelial
growth, possibly due to the high stability of these droplets which delayed the
release of chitosan (Section 3.6.1.2). Low molecular weight submicron
chitosan dispersions resulted in reduction of radial mycelial growth at 1.0%
chitosan concentration while locally prepared chitosan gave the similar
results at 1.5%. These results are in line with earlier studies which showed
that increase in the chitosan molecular weight results in decreased
antimicrobial activity (Gerasimenko et al., 2004; Zheng and Zhu et al., 2003).
85
4.5.1.2 Percent inhibition in conidial germination of C. gloeosporioides
The emulsifiers Brij 56 and Span 20, either alone or in combination, did
not inhibit conidial germination of C. gloeosporioides (Data not shown). The
submicron chitosan dispersions significantly (P < 0.05) inhibited the conidial
germination as compared to the control (Fig. 4.5). For both types of chitosan,
600 nm droplets were the most effective in inhibiting conidial germination.
Low molecular weight chitosan showed significant (P < 0.05) inhibition at 1%
with 600 nm droplets (Fig. 4.5a, Appendix C 4.3) and locally prepared
chitosan at 1.5% chitosan with 600 nm droplets (Fig. 4.5b, Appendix C 4.4).
Rappussi et al. (2009) reported that conidial germination and
appressorium formation of Guignardia citricarpa were stimulated when
treated with chitosan as compared to the control. However, the conidial
germination and appressorium formation were abnormal with the germ tube
and appressorium deformed. Plascencia-Jatomea et al. (2003) also showed
that chitosan caused spore aggregation and morphological anomalies, such
as swelling of germ tube and spore polarization of Aspergillus niger.
Reglinski et al. (2010) observed that chitosan inhibited B. cinerea growth
and also induced morphological changes in conidia. Similarly, 75% and 90%
reduction in conidial germination and germ tube elongation was observed by
El Ghaouth et al. (1992) when they used chitosan at 10 and 15 mg ml-1
against B. cinerea and R. stolonifer, respectively.
In this investigation 600, 800 and 1000 nm droplets showed more
inhibition of conidial germination with both types of chitosan. This suggests
that droplets 600 nm or larger are capable of encapsulating sufficient
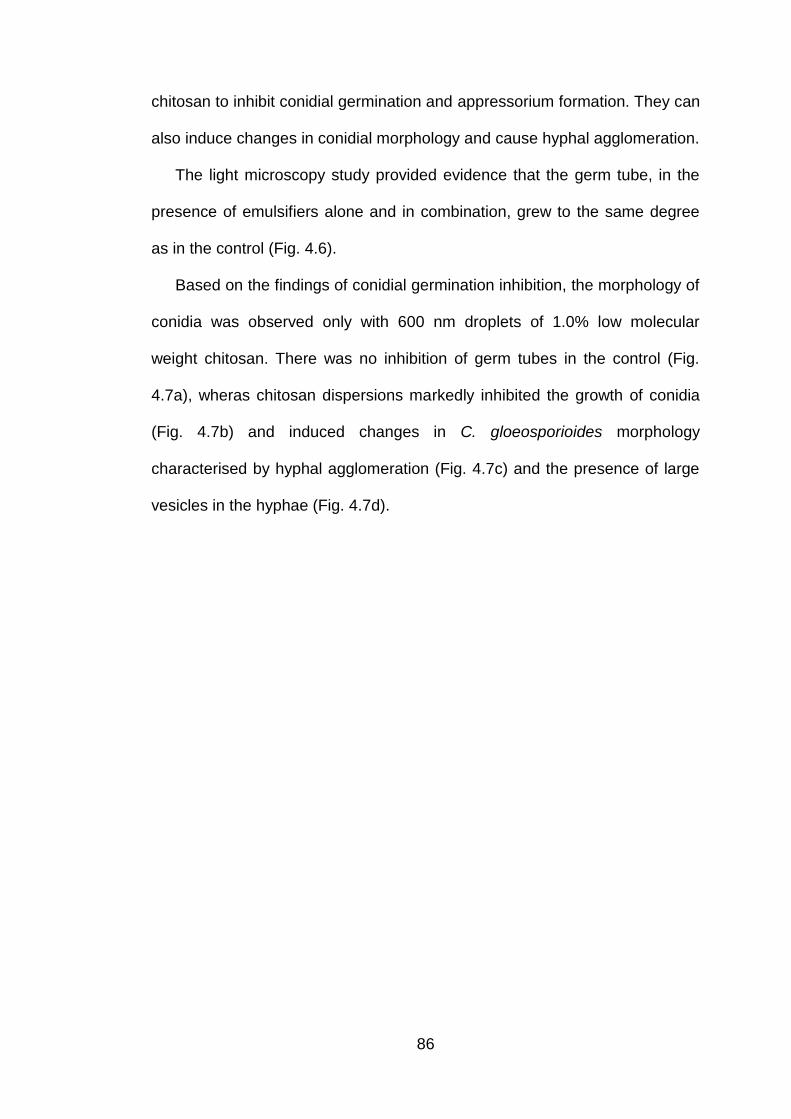
86
chitosan to inhibit conidial germination and appressorium formation. They can
also induce changes in conidial morphology and cause hyphal agglomeration.
The light microscopy study provided evidence that the germ tube, in the
presence of emulsifiers alone and in combination, grew to the same degree
as in the control (Fig. 4.6).
Based on the findings of conidial germination inhibition, the morphology of
conidia was observed only with 600 nm droplets of 1.0% low molecular
weight chitosan. There was no inhibition of germ tubes in the control (Fig.
4.7a), wheras chitosan dispersions markedly inhibited the growth of conidia
(Fig. 4.7b) and induced changes in C. gloeosporioides morphology
characterised by hyphal agglomeration (Fig. 4.7c) and the presence of large
vesicles in the hyphae (Fig. 4.7d).
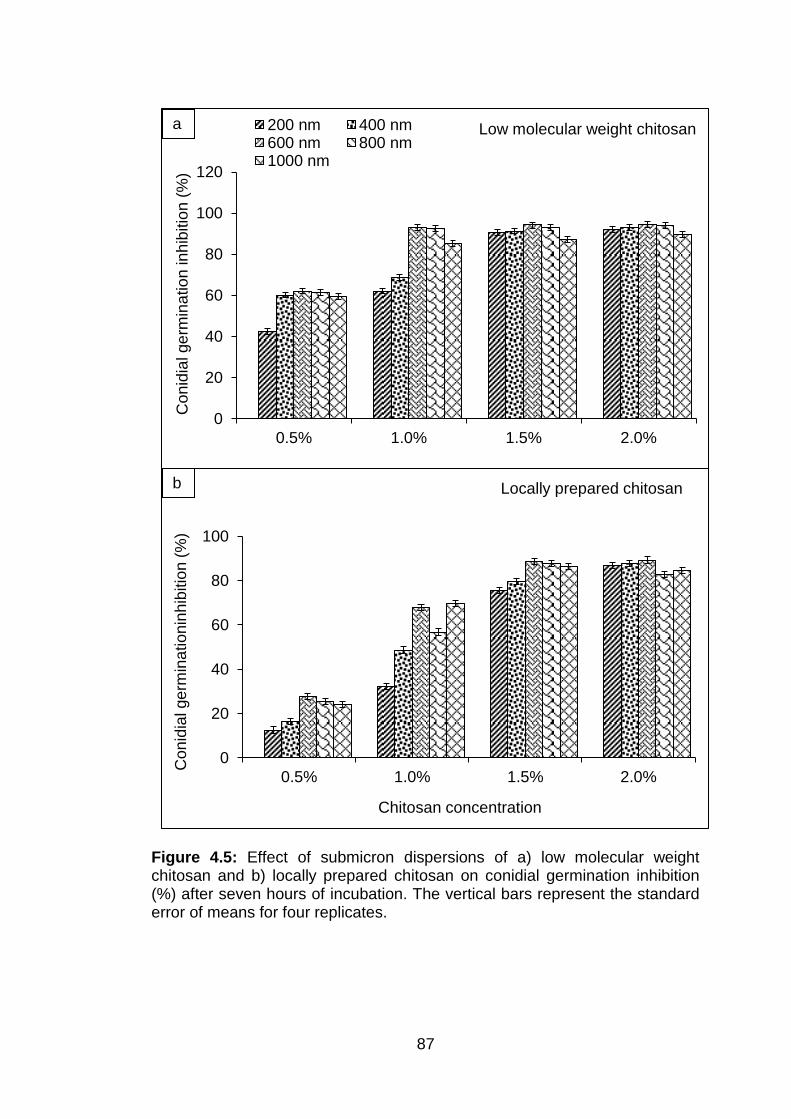
87
Figure 4.5: Effect of submicron dispersions of a) low molecular weight chitosan and b) locally prepared chitosan on conidial germination inhibition (%) after seven hours of incubation. The vertical bars represent the standard error of means for four replicates.
0
20
40
60
80
100
120
0.5% 1.0% 1.5% 2.0%
Con
idia
l ge
rmin
atio
n inh
ibitio
n (
%)
200 nm 400 nm600 nm 800 nm1000 nm
Low molecular weight chitosan a.
0
20
40
60
80
100
0.5% 1.0% 1.5% 2.0%
Con
idia
l ge
rmin
atio
nin
hib
itio
n (
%)
Chitosan concentration
Locally prepared chitosan b.
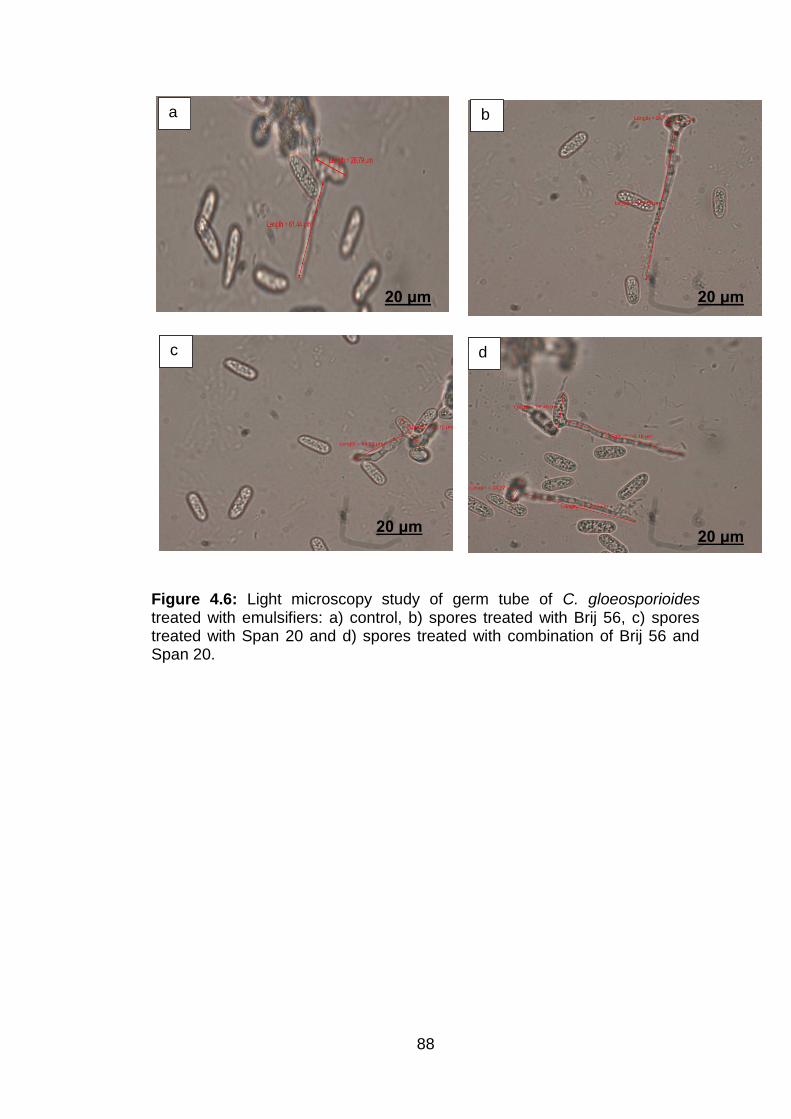
88
Figure 4.6: Light microscopy study of germ tube of C. gloeosporioides treated with emulsifiers: a) control, b) spores treated with Brij 56, c) spores treated with Span 20 and d) spores treated with combination of Brij 56 and Span 20.
a
d
b
c
20 μm 20 μm
20 μm 20 μm
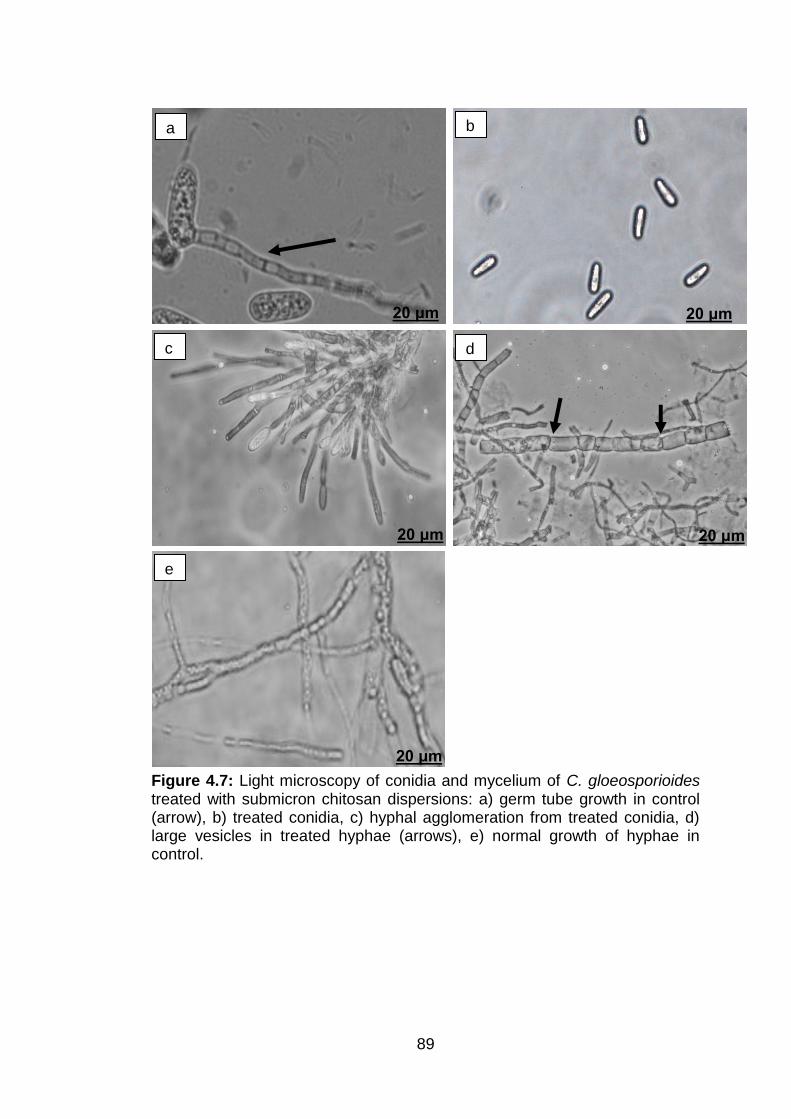
89
Figure 4.7: Light microscopy of conidia and mycelium of C. gloeosporioides treated with submicron chitosan dispersions: a) germ tube growth in control (arrow), b) treated conidia, c) hyphal agglomeration from treated conidia, d) large vesicles in treated hyphae (arrows), e) normal growth of hyphae in control.
a b
c d
e
20 μm 20 μm
20 μm 20 μm
20 μm

90
In a recent study by Ali et al. (2010), it was found that conidial germination
of C. gloeosporioides was inhibited and morphologically affected by chitosan.
El Ghaouth et al. (1992) also found that, at concentrations higher than 0.3%,
chitosan induced abnormal hyphal growth and reduced the growth of germ
tubes and viability of spores of R. stolonifer and B. cinerea isolated from
strawberry fruit. Similar effects were reported for F. oxysporum f. sp. radicis
lycopersici (Benhamou, 1996), F. oxysporum, F. acuminatum and
Cylindrocarpon destructans (Laflamme et al., 1999), F. oxysporum f.sp.
albedinis (El Hassni et al., 2004) and Phytophthora capsici (Xu et al., 2007).
4.5.1.3 Effect of submicron chitosan dispersions on dry weight of
mycelium and sporulation of C. gloeosporioides
Dry weight of mycelium and sporulation were assessed only with
submicron chitosan dispersions. The 600 nm droplets for both chitosans
proved to be the most effective in reducing dry weight of mycelium with
significant reduction (P < 0.05; Appendix C 4.5, 4.6) by 1.0% low molecular
weight chitosan and 1.5% locally prepared chitosan (Fig. 4.8a and b).
A similar trend in inhibiting sporulation was observed for both chitosans
(Fig 4.9a and b). Sporulation inhibition was significantly (P < 0.05; Appendix
C 4.7, 4.8) higher with 600 nm droplets of 1.0% low molecular weight
chitosan and 1.5% locally prepared chitosan in comparision with the control.
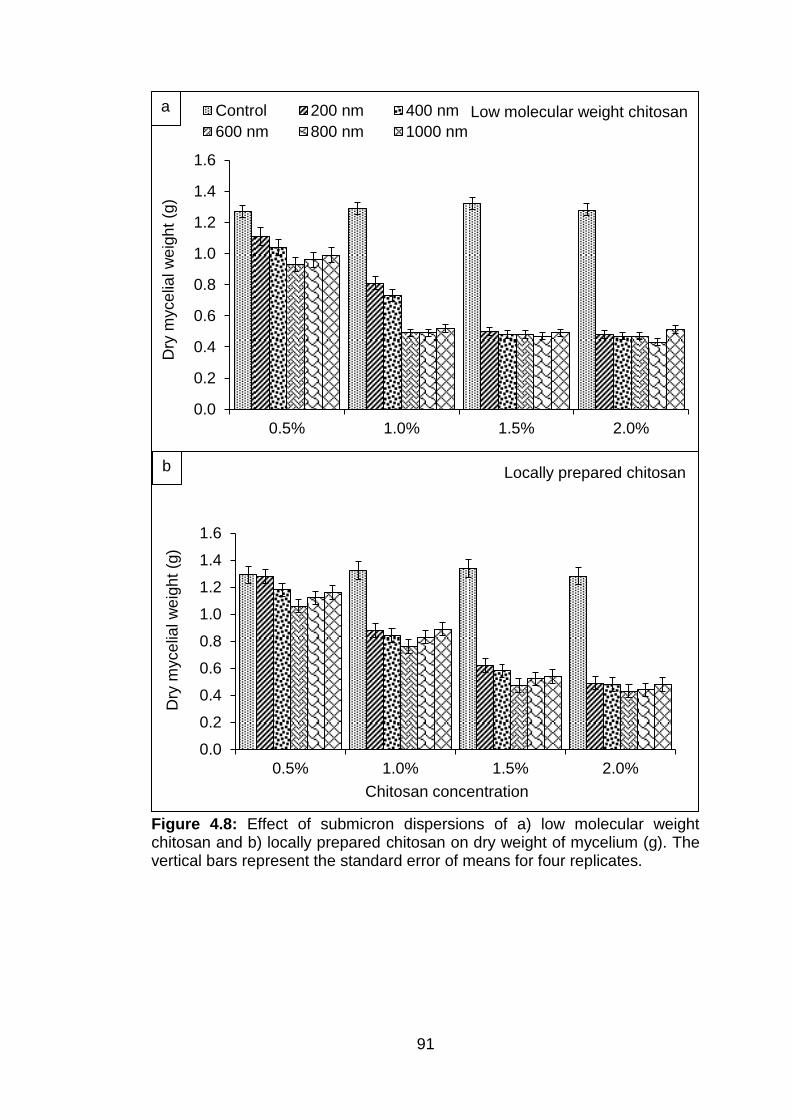
91
Figure 4.8: Effect of submicron dispersions of a) low molecular weight chitosan and b) locally prepared chitosan on dry weight of mycelium (g). The vertical bars represent the standard error of means for four replicates.
0.0
0.2
0.4
0.6
0.8
1.0
1.2
1.4
1.6
0.5% 1.0% 1.5% 2.0%
Dry
myce
lial w
eig
ht
(g)
Control 200 nm 400 nm
600 nm 800 nm 1000 nm
Low molecular weight chitosan a
0.0
0.2
0.4
0.6
0.8
1.0
1.2
1.4
1.6
0.5% 1.0% 1.5% 2.0%
Dry
myce
lial w
eig
ht
(g)
Chitosan concentration
Locally prepared chitosan b
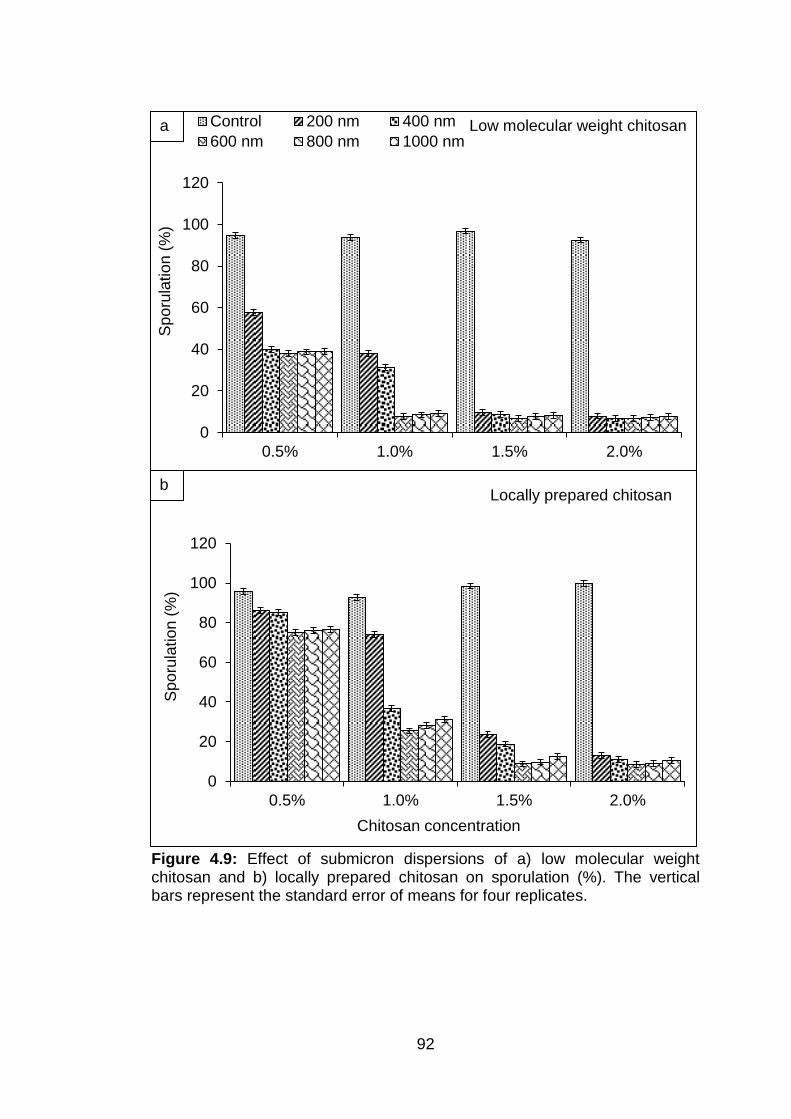
92
Figure 4.9: Effect of submicron dispersions of a) low molecular weight chitosan and b) locally prepared chitosan on sporulation (%). The vertical bars represent the standard error of means for four replicates.
0
20
40
60
80
100
120
0.5% 1.0% 1.5% 2.0%
Sp
oru
lation
(%
)
Control 200 nm 400 nm
600 nm 800 nm 1000 nmLow molecular weight chitosan a
0
20
40
60
80
100
120
0.5% 1.0% 1.5% 2.0%
Sp
oru
lation
(%
)
Chitosan concentration
b Locally prepared chitosan
93
Mycelial growth, spore germination, dry mycelium weight and sporulation
were affected by chitosan indicating its effects on various growth and
developmental stages of C. gloeosporioides. Previous studies have shown
similar effects in F. oxysporum isolated from papaya (Bautista-Baños et al.,
2004), F. solani (Kauss et al.,1989) and Phytophthora capsici (Xu et al.,
2007). In contrast, some studies showed increase in sporulation of A.
alternata (Bhaskara Reddy et al., 1999) and C. gloeosporioides (Bautista-
Baños et al., 2006) and that high sporulation could be associated with a
stress response caused by chitosan. High sensitivity of conidia of C.
gloeosporioides to chitosan was observed with no germination when they
were plated on media amended with chitosan (Bautista-Baños et al., 2004).
Spore germination of B. cinerea (Ben-Shalom et al., 2003), F. oxysporum f.
sp. radicis lycopersici, (Tikhonov et al., 2006), C. gloeosporioides, (Bautista-
Baños et al., 2004) and P. capsici (Xu et al., 2007) was completely inhibited
in the chitosan amended media. Similar results for broth cultures were
obtained by Prapagdee et al. (2007) for F. solani f. sp. glycines.
The mechanism of action of chitosan against microorganisms is still not
known. It is a common belief that the antifungal effect of chitosan is due to its
polycationic nature, which makes it positively charged with great affinity to the
negatively charged residues of macromolecules on the microbial cell surface.
Therefore, chitosan adheres rapidly to the surface of microorganisms,
causing leakage of the intercellular and proteinaceous constituents and
electrolytes as a consequence of the increased membrane permeability, and
causes death by the loss of essential fluids (Tsai and Su, 1999; Muzzarelli,
1996; Fang et al., 1994).
94
Another possible mechanism whereby chitosan inhibits microbial growth is
its activity as a chelating agent. It may bind to trace metal ions, trace
elements or essential nutrients in the intracellular fluid and substances that
are essential in the biochemistry of microbes. Deficiency of metal ions can
result in the inhibition of the production of toxins and enzymes (Cuero et al.,
1991). In this study, the enlarged vesicles observed suggested higher
membrane permeability, whereas the chelating activity of chitosan was
supported by the results of conidial germination and growth in broth culture.
The third possible mechanism for chitosan to inhibit microbial growth is
that it binds DNA and inhibits production of protein and mRNA upon invasion
into the nuclei (Hadwiger et al., 1986). The inhibition of mycelial growth and
conidial germination by different concentrations of chitosan has also been
explained by histological studies in which chitosan applied was accumulated
in the fungal cell wall to hinder its growth (Kendra et al., 1989; Kendra and
Hadwiger, 1987; Hadwiger et al., 1981).
Thus, in the present study, low molecular weight submicron chitosan
dispersions showed better antifungal activity than locally produced chitosan
for all of the parameters assessed. That may have been due to the difference
in molecular weight of the chitosans, since low molecular weight chitosan has
w v wh h b h ’ , g
mRNA synthesis by interacting with DNA, and affecting protein production
and inhibiting various enzymes (Martìnez-Camacho et al., 2010; Rabea et al.,
2003).
Due to higher antifungal activity in comparision with locally prepared
chitosan, low molecular weight chitosan, in conventional form and as 200 nm,
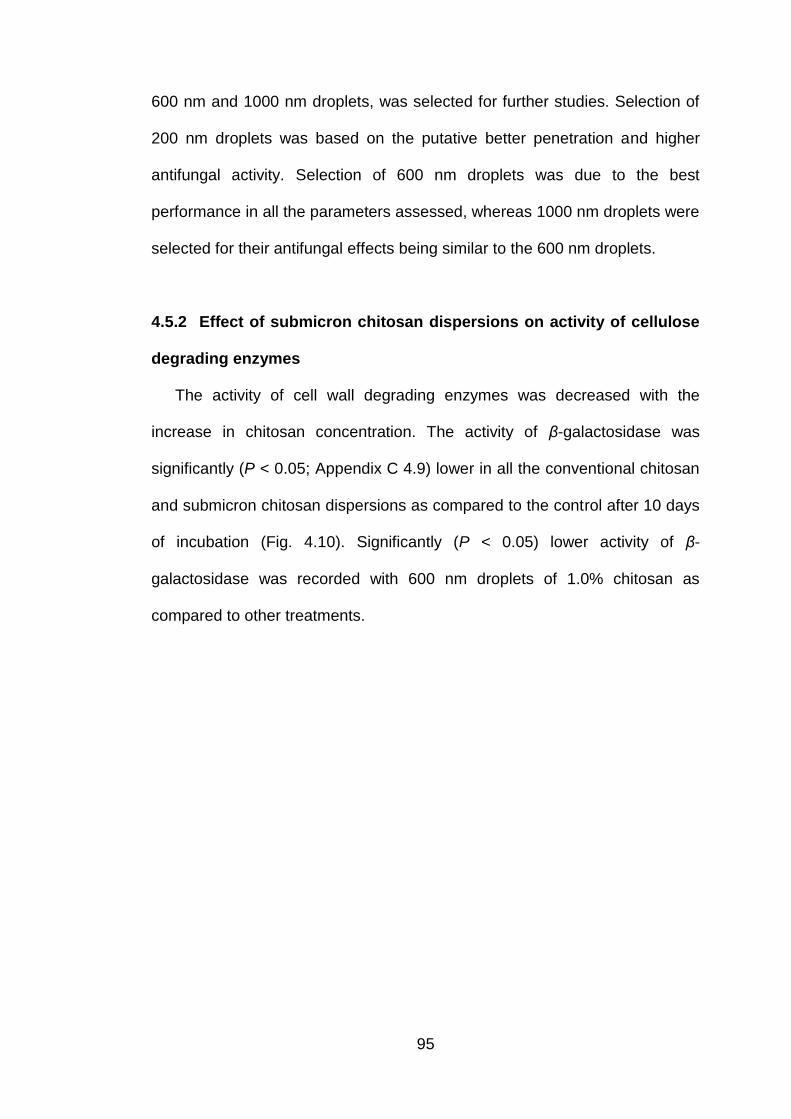
95
600 nm and 1000 nm droplets, was selected for further studies. Selection of
200 nm droplets was based on the putative better penetration and higher
antifungal activity. Selection of 600 nm droplets was due to the best
performance in all the parameters assessed, whereas 1000 nm droplets were
selected for their antifungal effects being similar to the 600 nm droplets.
4.5.2 Effect of submicron chitosan dispersions on activity of cellulose
degrading enzymes
The activity of cell wall degrading enzymes was decreased with the
increase in chitosan concentration. The activity of β-galactosidase was
significantly (P < 0.05; Appendix C 4.9) lower in all the conventional chitosan
and submicron chitosan dispersions as compared to the control after 10 days
of incubation (Fig. 4.10). Significantly (P < 0.05) lower activity of β-
galactosidase was recorded with 600 nm droplets of 1.0% chitosan as
compared to other treatments.
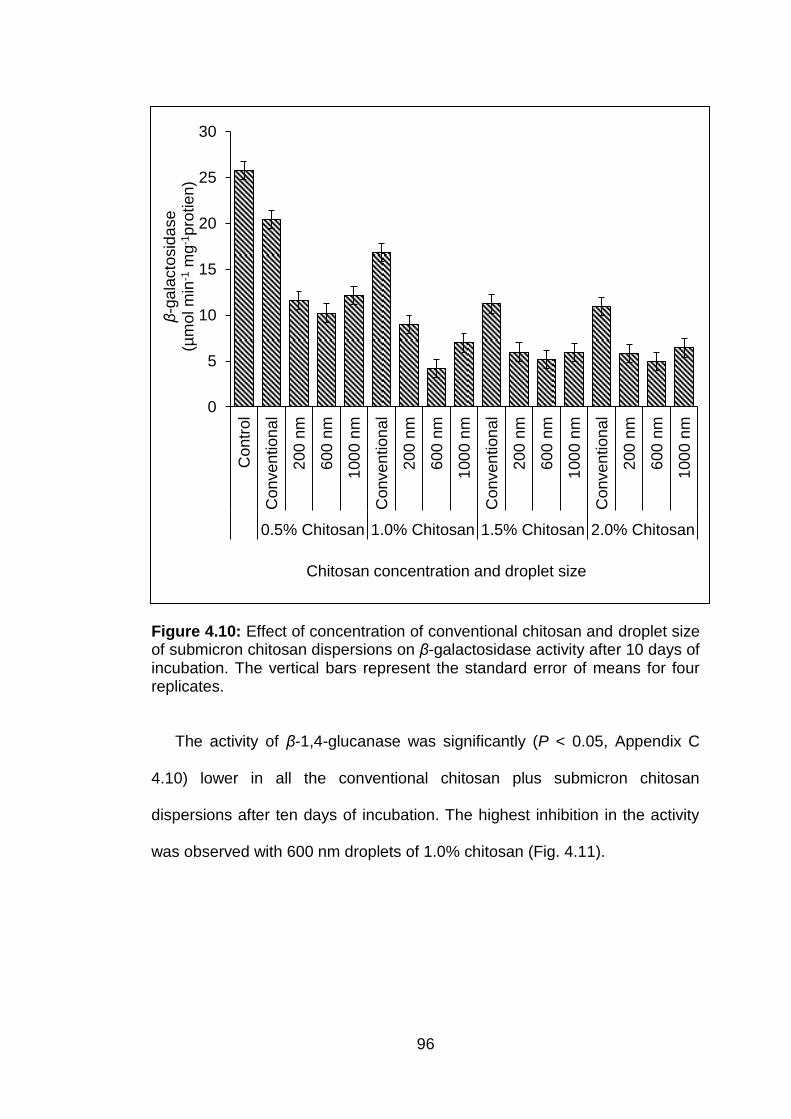
96
Figure 4.10: Effect of concentration of conventional chitosan and droplet size of submicron chitosan dispersions on β-galactosidase activity after 10 days of incubation. The vertical bars represent the standard error of means for four replicates.
The activity of β-1,4-glucanase was significantly (P < 0.05, Appendix C
4.10) lower in all the conventional chitosan plus submicron chitosan
dispersions after ten days of incubation. The highest inhibition in the activity
was observed with 600 nm droplets of 1.0% chitosan (Fig. 4.11).
0
5
10
15
20
25
30
Contr
ol
Conve
ntion
al
200
nm
600
nm
100
0 n
m
Conve
ntion
al
200
nm
600
nm
100
0 n
m
Conve
ntion
al
200
nm
600
nm
100
0 n
m
Conve
ntion
al
200
nm
600
nm
100
0 n
m
0.5% Chitosan 1.0% Chitosan 1.5% Chitosan 2.0% Chitosan
β-g
ala
cto
sid
ase
(µ
mo
l m
in-1
mg
-1p
rotie
n)
Chitosan concentration and droplet size
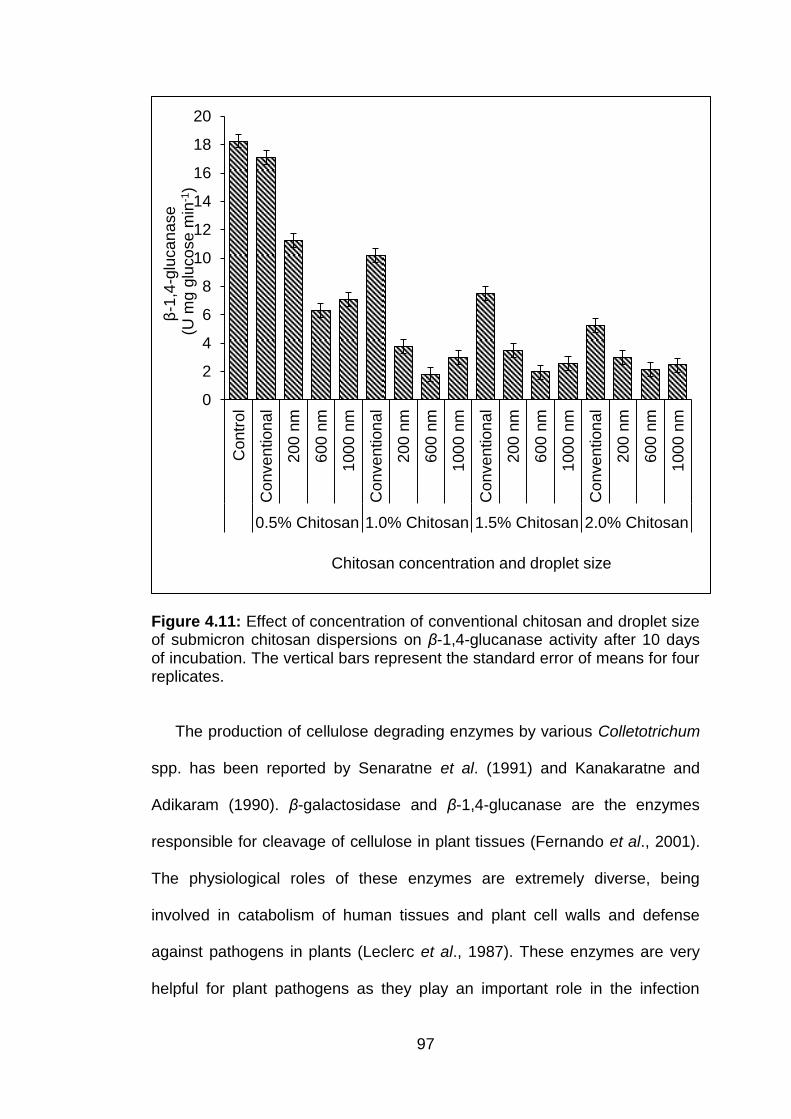
97
Figure 4.11: Effect of concentration of conventional chitosan and droplet size of submicron chitosan dispersions on β-1,4-glucanase activity after 10 days of incubation. The vertical bars represent the standard error of means for four replicates.
The production of cellulose degrading enzymes by various Colletotrichum
spp. has been reported by Senaratne et al. (1991) and Kanakaratne and
Adikaram (1990). β-galactosidase and β-1,4-glucanase are the enzymes
responsible for cleavage of cellulose in plant tissues (Fernando et al., 2001).
The physiological roles of these enzymes are extremely diverse, being
involved in catabolism of human tissues and plant cell walls and defense
against pathogens in plants (Leclerc et al., 1987). These enzymes are very
helpful for plant pathogens as they play an important role in the infection
0
2
4
6
8
10
12
14
16
18
20
Contr
ol
Conve
ntion
al
200
nm
600
nm
100
0 n
m
Conve
ntion
al
200
nm
600
nm
100
0 n
m
Conve
ntion
al
200
nm
600
nm
100
0 n
m
Conve
ntion
al
200
nm
600
nm
100
0 n
m
0.5% Chitosan 1.0% Chitosan 1.5% Chitosan 2.0% Chitosan
β-1
,4-g
luca
na
se
(
U m
g g
luco
se
min
-1)
Chitosan concentration and droplet size
98
process and development of symptoms, tissue maceration and cellular death
(Wijesundera et al., 1989). In this study, chitosan treatments reduced the
production of cellulolytic enzymes which might be linked with the antifungal
activity of chitosan. In addition to the inhibition of mycelial and conidial
growth, chitosan has the ability to interfere with the production of host specific
toxins, organic acids and cell wall degrading enzymes. Several studies have
confirmed direct antifungal action of chitosan (El Ghaouth et al., 1992 & 1991;
Allan and Hadwiger, 1979). Even though information is available on the
antimicrobial effects of chitosan, the mechanism of its involvement in the
pathogenesis of disease causing organisms in plants is still unknown.
4.5.3 Effect of submicron chitosan dispersions on activity of pectin
degrading enzymes
The activity of polygalacturonase tested was significantly (P < 0.05,
Appendix 4.11) lower in all the conventional chitosan plus submicron chitosan
dispersions as compared to the control after ten days of incubation (Fig.
4.12). The highest activity of polygalacturonase was observed in control
samples. In contrast, the lowest activity was recorded with 600 nm droplets of
1.0% chitosan.
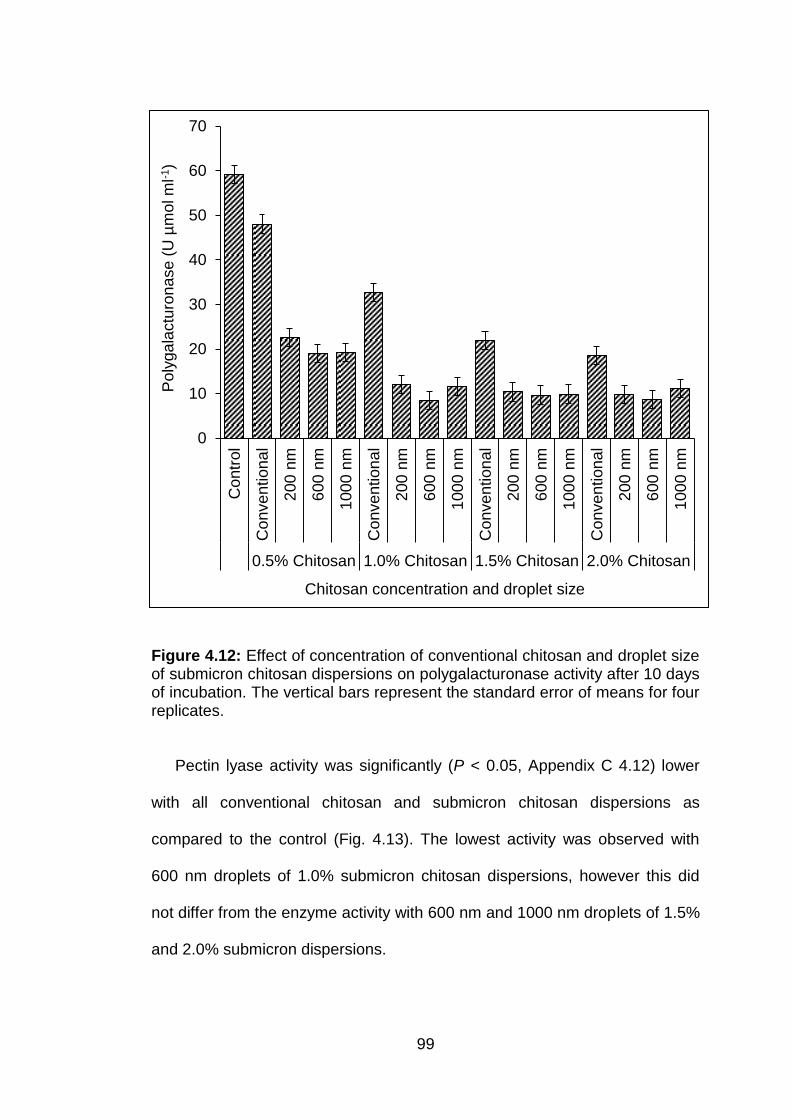
99
Figure 4.12: Effect of concentration of conventional chitosan and droplet size of submicron chitosan dispersions on polygalacturonase activity after 10 days of incubation. The vertical bars represent the standard error of means for four replicates.
Pectin lyase activity was significantly (P < 0.05, Appendix C 4.12) lower
with all conventional chitosan and submicron chitosan dispersions as
compared to the control (Fig. 4.13). The lowest activity was observed with
600 nm droplets of 1.0% submicron chitosan dispersions, however this did
not differ from the enzyme activity with 600 nm and 1000 nm droplets of 1.5%
and 2.0% submicron dispersions.
0
10
20
30
40
50
60
70
Contr
ol
Co
nve
ntion
al
200
nm
600
nm
100
0 n
m
Conve
ntion
al
200
nm
600
nm
100
0 n
m
Conve
ntion
al
200
nm
600
nm
100
0 n
m
Co
nve
ntion
al
200
nm
600
nm
100
0 n
m
0.5% Chitosan 1.0% Chitosan 1.5% Chitosan 2.0% Chitosan
Po
lyga
lactu
ron
ase
(U
µm
ol m
l-1)
Chitosan concentration and droplet size
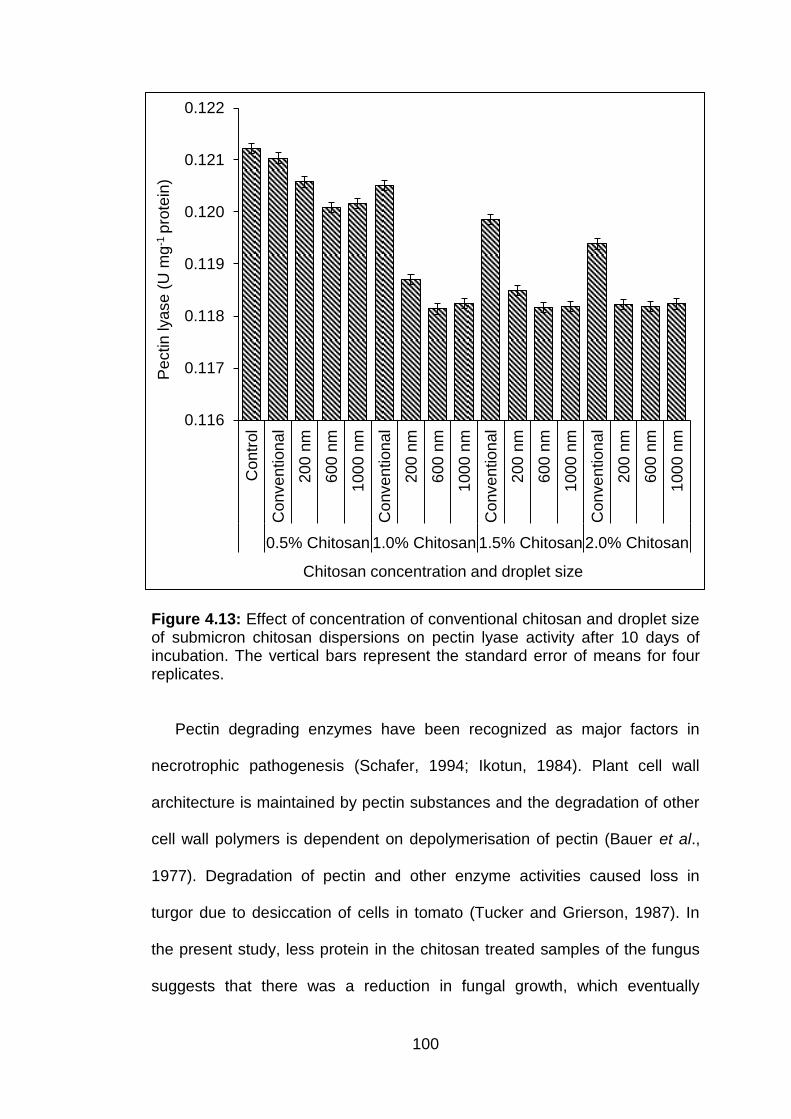
100
Figure 4.13: Effect of concentration of conventional chitosan and droplet size of submicron chitosan dispersions on pectin lyase activity after 10 days of incubation. The vertical bars represent the standard error of means for four replicates.
Pectin degrading enzymes have been recognized as major factors in
necrotrophic pathogenesis (Schafer, 1994; Ikotun, 1984). Plant cell wall
architecture is maintained by pectin substances and the degradation of other
cell wall polymers is dependent on depolymerisation of pectin (Bauer et al.,
1977). Degradation of pectin and other enzyme activities caused loss in
turgor due to desiccation of cells in tomato (Tucker and Grierson, 1987). In
the present study, less protein in the chitosan treated samples of the fungus
suggests that there was a reduction in fungal growth, which eventually
0.116
0.117
0.118
0.119
0.120
0.121
0.122
Contr
ol
Conve
ntion
al
200
nm
600
nm
100
0 n
m
Conve
ntion
al
200
nm
600
nm
100
0 n
m
Conve
ntion
al
200
nm
600
nm
100
0 n
m
Conve
ntion
al
200
nm
600
nm
100
0 n
m
0.5% Chitosan 1.0% Chitosan 1.5% Chitosan 2.0% Chitosan
Pe
ctin
lya
se
(U
mg
-1 p
rote
in)
Chitosan concentration and droplet size
101
reduced the production of macerating enzymes by C. gloeosporioides. These
results support the previous findings of Reddy et al. (2000) which showed
that chitosan treatments on A. alternata reduced the cell wall degrading
activity. Polygalacturonase solubilized the pectin substances in plants and
thus enabled the fungal appressoria to penetrate inside the cell wall (Bennett
et al. 1993). However, the fungus in direct contact with chitosan showed less
activity of pectin degrading enzymes, possibly due to solubilisation of
polygalacturonase formed in the presence of chitosan also being reduced, as
shown with the Erwinia system in potato (Reddy et al., 1997). Hence,
reduction in the fungal virulence occurred as the signals required by the
pathogen to produce toxins may not have been generated in the presence of
chitosan.
Up till now there has been no study reported on the uptake of chitosan
into the cells of microorganisms. However, in the present study, submicron
chitosan dispersions at 1.0% with 600 nm droplets showed the best results in
the parameters studied, which suggests that this size might permit
penetration and release inside the fungus more easily. This submicron
dispersion affected the morphology of the spores at various stages, reduced
mycelial growth and dry weight and also inhibited growth of the spores. At
this droplet size, the production of pathogenic factors by the fungus, such as
cell wall degrading enzymes, was also reduced. In contrast, 200 nm droplets
might also penetrate but the higher stability of smaller droplets could have
deferred the release of chitosan and adversely affected its antifungal
properties.
102
4.5.4 Effect of conventional chitosan and submicron chitosan
dispersions on anthracnose of dragon fruit plants
4.5.4.1 Disease incidence
The initial symptoms of disease appeared in control plants and the plants
treated with 0.5 and 1.0% conventional chitosan and submicron chitosan
dispersions thirty days after inoculation. In plants treated with 1.5 and 2.0%
conventional chitosan and submicron chitosan dispersions, the disease
symptoms appeared sixty days after inoculation (Table 4.2). The higher
concentrations of conventional chitosan and submicron dispersions formed a
thick layer on the plant surface, which later either dropped off or was washed
away with sprinkler water or rain.
Disease incidence reached up to 46.8% after ninety days in control plants.
Significant differences (P < 0.05) in disease incidence were recorded
between the plants treated with conventional chitosan and submicron
chitosan dispersions (Table 4.3; Fig. 4.14, Appendix 4.13). The highest
fungicidal effect occurred in plants treated with 600 nm droplets of 1.0%
chitosan. Disease incidence recorded for 1.5 and 2.0% submicron chitosan
dispersions was higher than for 1.0% dispersions.
Disease development was less in the 600 nm submicron chitosan
dispersions at all the four concentrations tested based on the area under the
disease progress curve (AUDPC). The AUDPC at the 90th day after
inoculation with C. gloeosporioides was lowest for 600 nm droplets of 1.0%
chitosan and highest for control plants (Table 4.3).
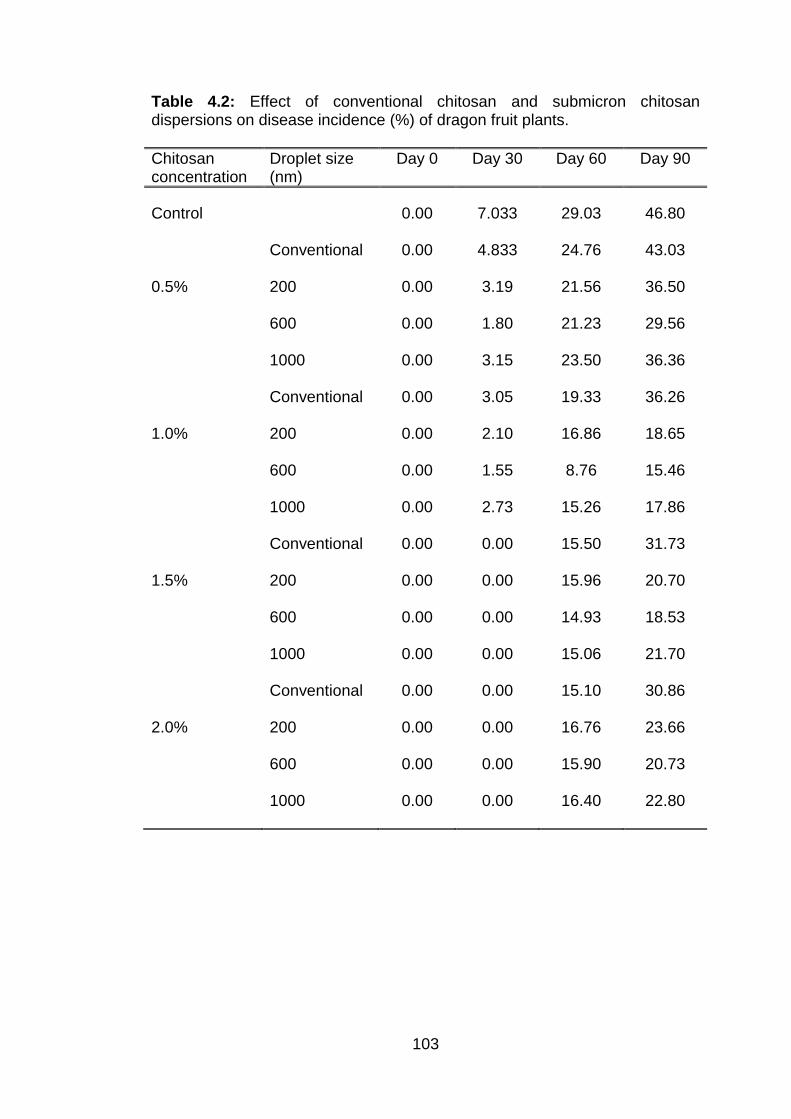
103
Table 4.2: Effect of conventional chitosan and submicron chitosan dispersions on disease incidence (%) of dragon fruit plants.
Chitosan concentration
Droplet size (nm)
Day 0 Day 30 Day 60 Day 90
Control 0.00 7.033 29.03 46.80
Conventional 0.00 4.833 24.76 43.03
0.5% 200 0.00 3.19 21.56 36.50
600 0.00 1.80 21.23 29.56
1000 0.00 3.15 23.50 36.36
Conventional 0.00 3.05 19.33 36.26
1.0% 200 0.00 2.10 16.86 18.65
600 0.00 1.55 8.76 15.46
1000 0.00 2.73 15.26 17.86
Conventional 0.00 0.00 15.50 31.73
1.5% 200 0.00 0.00 15.96 20.70
600 0.00 0.00 14.93 18.53
1000 0.00 0.00 15.06 21.70
Conventional 0.00 0.00 15.10 30.86
2.0% 200 0.00 0.00 16.76 23.66
600 0.00 0.00 15.90 20.73
1000 0.00 0.00 16.40 22.80
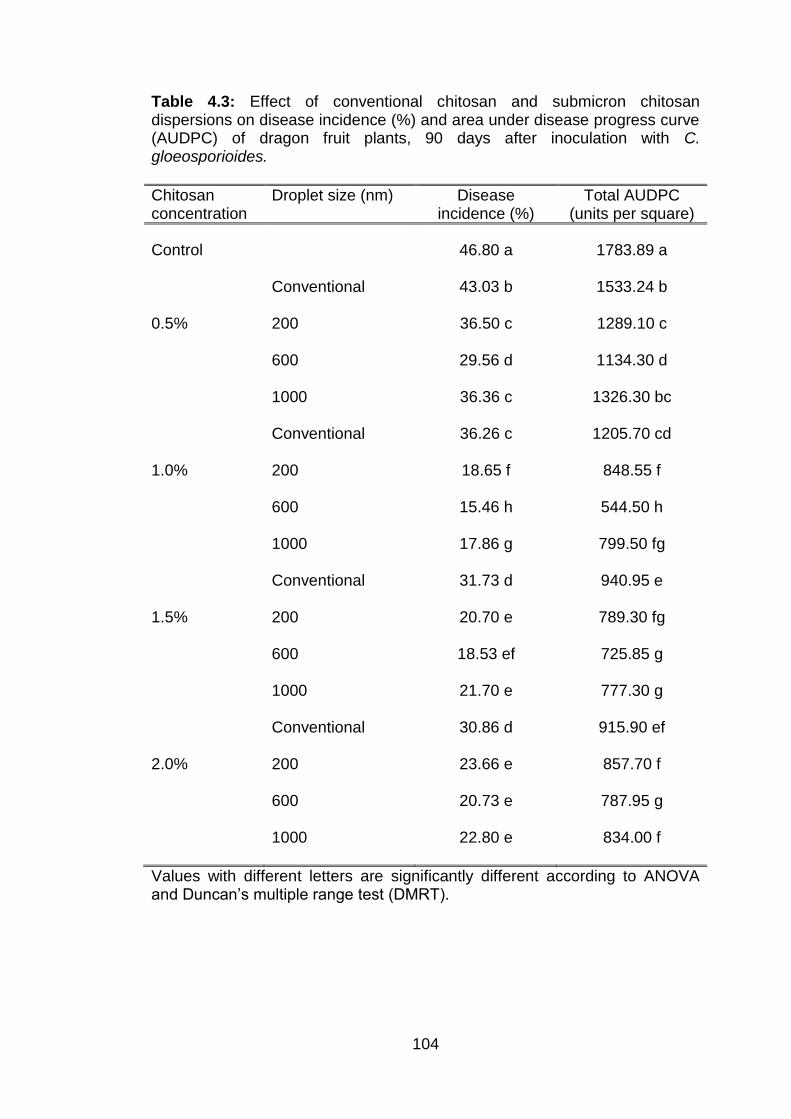
104
Table 4.3: Effect of conventional chitosan and submicron chitosan dispersions on disease incidence (%) and area under disease progress curve (AUDPC) of dragon fruit plants, 90 days after inoculation with C. gloeosporioides.
Chitosan concentration
Droplet size (nm) Disease incidence (%)
Total AUDPC (units per square)
Control 46.80 a 1783.89 a
Conventional 43.03 b 1533.24 b
0.5% 200 36.50 c 1289.10 c
600 29.56 d 1134.30 d
1000 36.36 c 1326.30 bc
Conventional 36.26 c 1205.70 cd
1.0% 200 18.65 f 848.55 f
600 15.46 h 544.50 h
1000 17.86 g 799.50 fg
Conventional 31.73 d 940.95 e
1.5% 200 20.70 e 789.30 fg
600 18.53 ef 725.85 g
1000 21.70 e 777.30 g
Conventional 30.86 d 915.90 ef
2.0% 200 23.66 e 857.70 f
600 20.73 e 787.95 g
1000 22.80 e 834.00 f
Values with different letters are significantly different according to ANOVA ’ p g ( M T).
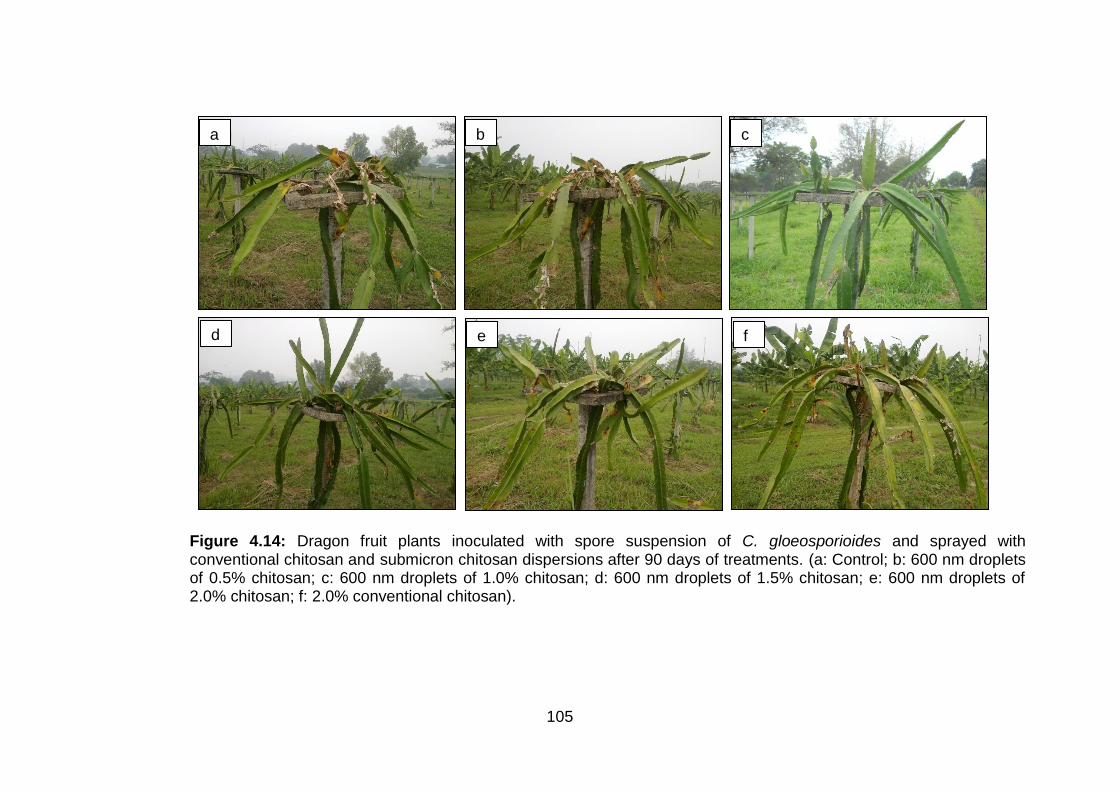
105
Figure 4.14: Dragon fruit plants inoculated with spore suspension of C. gloeosporioides and sprayed with conventional chitosan and submicron chitosan dispersions after 90 days of treatments. (a: Control; b: 600 nm droplets of 0.5% chitosan; c: 600 nm droplets of 1.0% chitosan; d: 600 nm droplets of 1.5% chitosan; e: 600 nm droplets of 2.0% chitosan; f: 2.0% conventional chitosan).
a b c
d e f
106
4.5.4.2 Disease severity
Disease severity was significantly (P < 0.05) reduced in all treatments
compared with the control plants (Table 4.4, Appendix C 4.15). The highest
fungicidal effect was found in plants treated with 600 nm droplets of 1.0%
chitosan followed by the plants treated with 600 nm droplets of 1.5% chitosan
90 days after inoculation.
The fungicidal activity of chitosan and submicron chitosan dispersions has
been clearly shown in in vitro as well as in vivo experiments. Chitosan has
been found to induce a delay in appearance of disease, leading to a
reduction in plant wilting (Benhamou et al., 1994). The polycationic nature
and molecular weight of chitosan are the major factors in its fungicidal
properties (Hirano and Nagao, 1989). The effect of chitosan has also been
documented in several pathosystems which include numerous plant species
and a wide range of pathogens comprising fungi, bacteria, viruses and
nematodes.
In a recent study by Reglinski et al. (2010), efficacy of chitosan was
assessed against B. cinerea in a vineyard. Plants treated with chitosan
showed more vigour and disease incidence was reduced by up to 84.2%.
Chitosan has also been shown to possess antifungal activity against downy
mildew (Aziz et al., 2006) and F. oxysporium f. sp. lycopersici of tomato
seedlings (Benhamou and Thériault, 1992). Disease suppression has also
been observed in cucumber and groundnut against B. cinerea and P.
arachidis (Sathyabama and Balasubramanian, 1998; Ben-Shalom et al.,
2003).
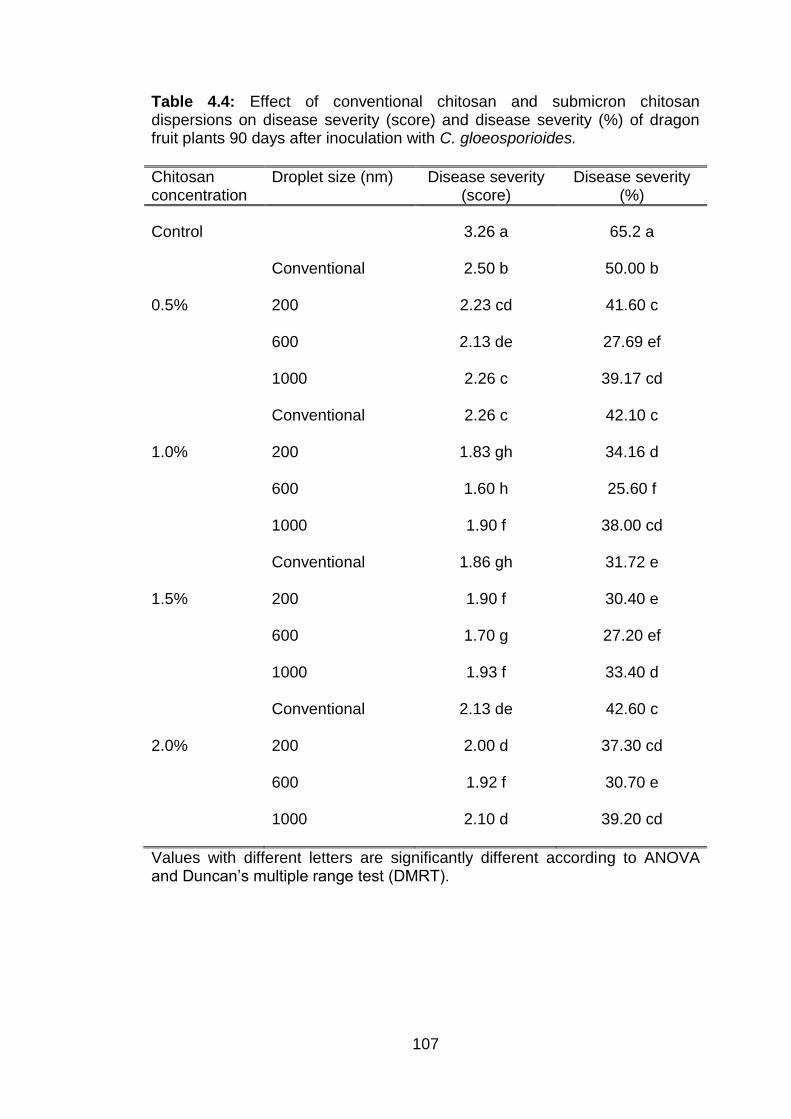
107
Table 4.4: Effect of conventional chitosan and submicron chitosan dispersions on disease severity (score) and disease severity (%) of dragon fruit plants 90 days after inoculation with C. gloeosporioides.
Chitosan concentration
Droplet size (nm) Disease severity (score)
Disease severity (%)
Control 3.26 a 65.2 a
Conventional 2.50 b 50.00 b
0.5% 200 2.23 cd 41.60 c
600 2.13 de 27.69 ef
1000 2.26 c 39.17 cd
Conventional 2.26 c 42.10 c
1.0% 200 1.83 gh 34.16 d
600 1.60 h 25.60 f
1000 1.90 f 38.00 cd
Conventional 1.86 gh 31.72 e
1.5% 200 1.90 f 30.40 e
600 1.70 g 27.20 ef
1000 1.93 f 33.40 d
Conventional 2.13 de 42.60 c
2.0% 200 2.00 d 37.30 cd
600 1.92 f 30.70 e
1000 2.10 d 39.20 cd
Values with different letters are significantly different according to ANOVA ’ p g ( M T).
108
Earlier studies have shown that various host defense mechanisms
induced by chitosan are involved in controlling anthracnose (El Ghaouth et
al., 1994 b). Induced resistance in plants has been enhanced by increasing
the activity of some enzymes, such as chitinase and β-1,3-glucanase
(Fajardo et al., 1998; Zhang and Quantick, 1998), and by increasing levels of
phytoalexins (Reglinski et al., 2004), phenylalanine ammonia lyase (PAL)
activity (Romanazzi et al., 2002) and total phenolics (Aziz et al., 2006).
In the present study, the conventional form of chitosan and all the
submicron chitosan dispersions showed antifungal effects, however,
submicron chitosan dispersions of 600 nm droplets at 1.0% concentration
showed the most promising results in terms of delaying the onset of
anthracnose on dragon fruit plants. Agglutination of conventional chitosan
around the penetration sites on the plant tissues might act as a physical
barrier to prevent the pathogen invading healthy tissues. This phenomenon is
similar to abscission zones on leaves which inhibit the spread of some
pathogens (El Hadrami et al., 2009). Secondly, hydrogen peroxide
accumulates around the isolated zone and elicits the hypersensitive response
which acts as an alarm signal for healthy plant tissues. This second
phenomenon is due to the binding capacity of chitosan with several metals
and initiation of the healing of wounds (Hirano et al., 1999).
It can be concluded from the present investigation that submicron chitosan
dispersions have better fungicidal effects than using chitosan in a
conventional form and, therefore, they could provide an alternative to
synthetic fungicides for controlling anthracnose of dragon fruit plants.
109
CHAPTER 5
MECHANISM OF SUPPRESSION OF Colletotrichum gloeosporioides, THE CAUSAL ORGANISM OF ANTHRACNOSE IN DRAGON FRUIT
PLANTS
5.1 Introduction
Dragon fruit (Hylocereus polyrhizus) is a commercial fruit crop, grown
throughout tropical regions. Disease management is one of the most
important components in the production system since this crop is prone to
many fungal and bacterial diseases, such as stem and fruit rot, stem spots
and cactus virus X. Anthracnose, caused by Colletotrichum gloeosporioides,
has been reported to cause significant losses in the yield and quality of the
crop (Masyahit et al., 2009) and, so far, chemical pesticides have been widely
used to control this disease. The ecologically unnatural and unstable
conditions of monoculture, cost of traditional pesticides as well as rising
environmental risk due to xenobiotics have promoted studies on alternative
strategies in crop protection.
Plants also possess complex structures and inducible reactions which can
successfully protect them against pathogens (Trotel-Aziz et al., 2006). To
detect possible pathogen attack these inducible reactions need the alarm
signals, after which the plant generates a wide range of defense mechanisms
which can be useful tools of protection against the assaulting pathogens. This
plant defense mechanism could involve the production of defense-specific
chemicals, such as jasmonates or salicylic acid or follow the stimulation of
fatty acids and phenylpropanoid pathways. Plant components having
antimicrobial properties, such as pathogenesis-related (PR) proteins and
phytoalexins, have also been reported (Kombrink and Somssich, 1995). Over

110
the past decade, the use of exogenous elicitors to stimulate natural defense
responses has become an important tool (Métraux et al., 1991). Some
distinct oligosaccharides, such as oligomers derived from chitosan and chitin,
algal or microbial β-1,3 glucans, have been shown to enhance non-host plant
resistance against pathogens (Manjunatha et al., 2008; Côté et al., 1998;
Roby et al., 1987).
The use of eco-friendly and biodegradable agents, such as chitosan, is
gaining importance as an alternative safe means to manage pests and
diseases, and to sustain productivity in fruit production systems (Gozzo,
2003). As an antimicrobial agent, chitosan has been tested against
pathogens such as A. alternata, B. cinerea, C. gloeosporioides and R.
stolonifer (Ali and Mahmood, 2008; El Goauth et al., 1992). However,
variation in the extraction methods, as well as different sources of chitinous
material, affect the functional properties and bioactivity of chitosan (Wu et al.,
2004). Chitosan, a deacetylated derivative of chitin, induces various defense
responses in several plants, including phytoalexin production in pea pods
(Hadwiger and Beckman, 1980), synthesis of PR proteins in rice seedlings
(Agrawal et al., 2002) and lignification of wheat leaves (Vander et al., 1998;
Barber et al., 1989). Consequently, there may be inhibition of fungal growth
and defense from further infection (Hadwiger and Beckman, 1980).
The main drawback of using this natural compound is its macromolecule
with high viscosity, which reduces its penetration into tissues/cells and its
antimicrobial properties (Tikhonov et al., 2006). Thus, the use of submicron
dispersions of chitosan is a novel approach to its application for the control
anthracnose of dragon fruit plants. The objective of this study was to
111
investigate the efficacy of submicron dispersions of chitosan on anthracnose
disease of dragon fruit plants and on the production of inducible compounds
and their possible mechanism in controlling anthracnose. In addition, the
effect of submicron chitosan dispersions on growth responses of plants was
determined.
112
5.2 Materials and methods
Conventional chitosan and different droplet sizes of submicron
dispersions (200, 600 and 1000 nm) were prepared as described in Sections
3.2.4 and 3.3. The plant material and experimental site were prepared and
managed as described in Section 4.4.1. The experimental site was Farm B1
at Taman Pertanian, University Putra Malaysia, Serdang, Malaysia.
The size of the experimental site was 69 x 36 metres with a pole system
already installed. Two trials were carried out in order to ensure the
reproducibility of results. The first trial was from December 2011 to
September 2012 and the second from February 2012 to November 2012.
Extra plants were planted on all four sides of the field in order to minimize the
border effect. Five treatments (untreated control, 1.0% conventional chitosan
and 200 nm, 600 nm and 1000 nm submicron chitosan dispersions) were
selected after the preliminary field study (Section 4.5.4) and were evaluated
based on eight parameters, including disease incidence (DI%), lignification,
total phenolic compounds, peroxidase (PO), polyphenol oxidase (PPO),
phenylalanine ammonia lyase (PAL), β-1,3-glucanase and chitinase activities.
Plants were inoculated artificially by using the tooth pick method (Section
4.4.2). The plants were sampled for analysis of enzymes on day 0 and then
at intervals of 3 days until day 30.
The experiments were arranged in a randomized complete block design
(RCBD) with three replicates of ten plants. Data were subjected to analysis of
variance (ANOVA) and tested for significant differences among treatments by
’ M p g T ( M T) P < 0.05 using SAS® software
(Appendix C 5.1 – C 5.35).
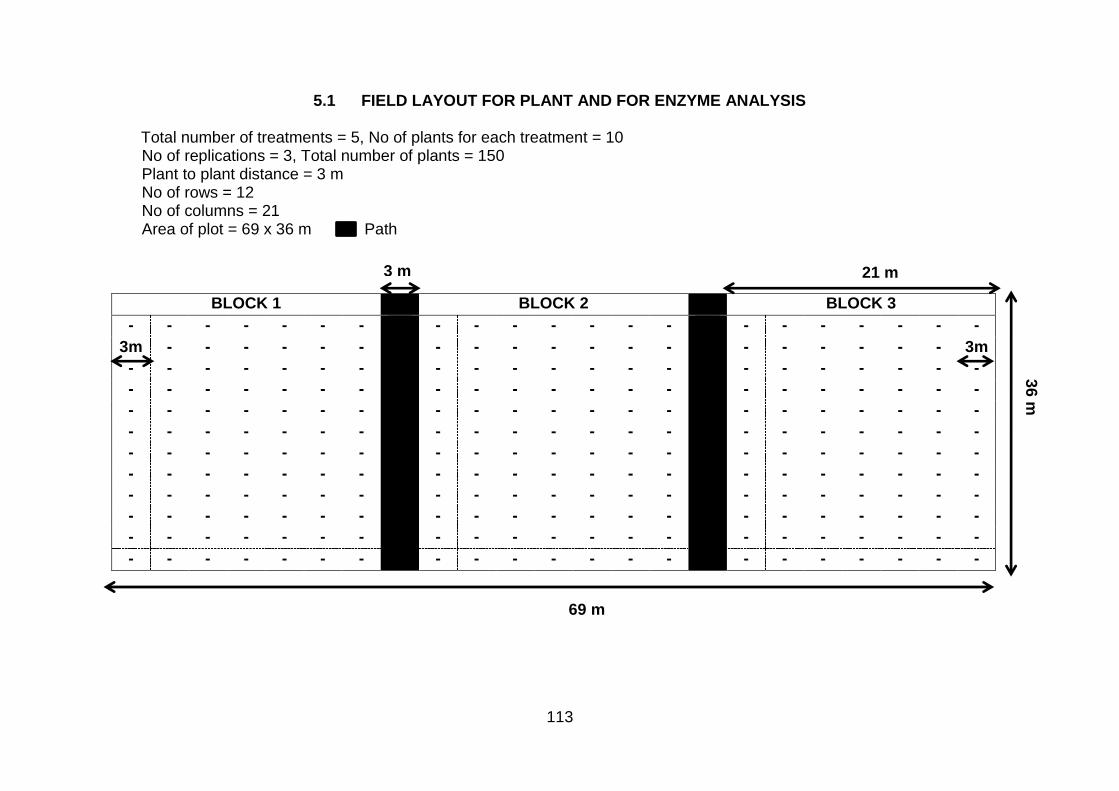
113
5.1 FIELD LAYOUT FOR PLANT AND FOR ENZYME ANALYSIS
Total number of treatments = 5, No of plants for each treatment = 10 No of replications = 3, Total number of plants = 150 Plant to plant distance = 3 m No of rows = 12 No of columns = 21 Area of plot = 69 x 36 m Path
BLOCK 1 BLOCK 2 BLOCK 3
- - - - - - - - - - - - - - - - - - - - -
3m - - - - - - - - - - - - - - - - - - - 3m
- - - - - - - - - - - - - - - - - - - - -
- - - - - - - - - - - - - - - - - - - - -
- - - - - - - - - - - - - - - - - - - - -
- - - - - - - - - - - - - - - - - - - - -
- - - - - - - - - - - - - - - - - - - - -
- - - - - - - - - - - - - - - - - - - - -
- - - - - - - - - - - - - - - - - - - - -
- - - - - - - - - - - - - - - - - - - - -
- - - - - - - - - - - - - - - - - - - - -
- - - - - - - - - - - - - - - - - - - - -
21 m 3 m
69 m
36
m
114
5.2.1 Determination of disease incidence and area under disease
severity curve
Disease incidence (DI %) was recorded at 3 day intervals for one month
as described in Section 4.2.2. AUDPC was calculated using the formula in
Section 4.4.3 to evaluate the efficacy of the treatment.
5.2.2 Determination of lignin compounds
Lignin compounds were extracted using thioglycolic acid (TGA) with
slight modification of the method given by Bruce and West (1982). Briefly, 2 g
of stem tissues were homogenized in 20 ml of 80% methanol. The mixture
was then filtered with Whatman filter paper no. 4. The residues were washed
with 80% methanol and then dried at 60 °C for 24 hours. Dried insoluble
residue served as the sample and was used for lignin determination. The
reaction mixture contained 5 ml of 2N HCl and 0.5 ml of thioglycolic acid
(TGA). The reaction mixture was mixed with 50 mg of sample in glass vials.
The mixture was boiled in a water bath for 4 hours and then centrifuged at
10,000 x g for 30 min. The supernatant was drained and the resulting pellets
were washed in 5 ml of distilled water. The pellets were then suspended in 5
ml of 0.5 N NaOH and shaken on an orbital shaker for 2 hours at 25 °C
followed by 30 min of centrifugation at 10,000 x g. The supernatant was
mixed with 1 ml of lignin-thioglycolic acid and 12N HCl followed by
precipitation at 4 °C for 4 hours. The mixture was centrifuged for 10 min at
10,000 x g and orange-brown pellets were obtained after discarding the
supernatant. An aliquot of 10 ml of 0.5 N NaOH was used to dissolve these
pellets and was centrifuged again for 10 min. The absorption of thioglycolic
115
acid was determined in the supernatant at 280 nm using a UV-Vis
spectrophotometer (Varioskan Flash Multimode Reader, Thermo Fisher
Scientific, USA). The results were expressed as increase in thioglycolic acid
g-1 fresh weight (Mandal, 2010).
5.2.3 Penetration of conventional chitosan and submicron chitosan
dispersions inside the plants and determination of total phenolic
content
Bromocresol purple was used to dye the submicron emulsions of
chitosan. The dye was prepared by adding 100 mg of bromocresol purple to
5 ml of ethanol (Abou-Shoer, 2010) and 20 ml was added per 100 ml of
submicron chitosan dispersions. The solutions were sprayed on the dragon
fruit plants and the plants were destructively sampled after three days. Ultra-
thin slices of the stem were observed under a research microscope, and the
images were captured using a camera (Nikon Eclipse 80i) attached to a light
microscope at 20 x magnification.
The total phenolic content in dragon fruit plants was estimated by the
method of Ramamoorthy and Bono (2007). Samples of stem (2 g) were
homogenised with 10 ml of 80% (v/v) methanol and agitated for 15 min at
70°C. The crude enzyme extract (1 ml) was mixed with 5 ml of purified water
25 μ N F -Ciocalteau reagent and incubated for 5 min at room
temperature (25 ± 3°C). Saturated sodium carbonate (1 ml of 7% Na2CO3)
was added to the mixture, incubated for 1 h at 25°C followed by
measurement of absorbance at 725 nm using a UV-Vis spectrophotometer
(Varioskan Flash Multimode Reader, Thermo Fisher Scientific, USA). A blank
116
reagent was prepared and the total phenolic content in the extract was
measured using a standard curve (Appendix B 5.1) from freshly prepared
gallic acid in 80% ethanol. The results were stated in µg of gallic acid
equivalent per gram fresh weight of plant sample.
5.2.4 Determination of enzymatic activities
5.2.4.1 Extraction of peroxidase and polyphenol oxidase
A crude enzyme extract was prepared by the method described by Liu et
al. (2007) with minor modifications. Plant samples (2 g) from each treatment
were homogenised at 4°C in 10 ml sodium phosphate buffer (100 mM, pH
6.4) containing 0.2 g of polyvinylpyrrolidone (PVP) using a mortar and pestle.
The homogenized samples were centrifuged for 30 min at 12,000 × g and
4°C. The activity of peroxidase and polyphenol oxidase enzymes was
determined in the supernatant obtained after centrifugation.
5.2.4.1.1 Assay of peroxidase (PO) activity
The activity of peroxidase was determined by the oxidation of guaiacol to
tetraguaiacol in the presence of H2O2, which results in the development of a
brown colour. Crude extract (0.1 ml) was mixed with 2 ml of O-
methoxyphenol (guaiacol) in 100 mM sodium phosphate buffer (pH 6.4)
followed by incubation at 30°C for 30 min, then 1 ml of hydrogen peroxide (24
mM) was added. The increase in absorbance was monitored at 470 nm using
a UV-Vis spectrophotometer (Varioskan Flash Multimode Reader, Thermo
Fisher Scientific, USA) for one minute. The PO activity was expressed as U
117
g− fresh weight (Liu et al., 2007) where one unit is defined as the difference
in absorbance at 470 nm per gram fresh weight per minute.
5.2.4.1.2 Assay of polyphenol oxidase (PPO) activity
PPO activity was determined by measuring the conversion of catechol to
quinone mediated by PPO. Crude enzyme extract (0.1 ml) was added in
catechol substrate (3 ml). Catechol substrate was prepared by adding 500
mM of catechol to 100 mM sodium phosphate buffer pH 6.4, and the increase
in absorbance was measured at 398 nm using a spectrophotometer
(Varioskan Flash Multimode Reader, Thermo Fisher Scientific, USA) for 3
minutes. The PPO activity was expressed as U g˗ fresh weight, where one
unit is defined as an increase of activity at OD398 per gram fresh weight per
30 minutes (Liu et al., 2007).
5.2.4.2 Extraction and assay of phenylalanine ammonia-lyase (PAL)
activity
A crude enzyme extract was prepared by the method described by
Morelló et al. (2005) with minor modifications. Plant samples (1 g pericarp
tissue) from each treatment were homogenised for 30 sec at 4°C in 25 ml of
0.05 M potassium phosphate buffer (pH 6.6) containing 0.2 g of Triton X-100
using a mortar and pestle. Polyvinylpolypyrrolidone (PVPP) (25 mg) was
added and the suspension was centrifuged for 30 min at 12,000 × g and 4°C.
The supernatant was kept on ice, filtered through glass wool and used as a
source of crude enzyme.

118
PAL activity in the crude enzyme extracts was assayed by the method of
Zucker (1965) as reported by McCallum and Walker (1990). The assay
mixture consisted of 0.06 M sodium borate buffer (4.1 ml; pH 8.8) and crude
enzyme (0.4 ml) and the reaction was initiated by adding 1 ml of 10 mg ml-1
(final concentration 11 mM) L-phenylalanine. The tubes were incubated at
37°C for 1 h. The reaction was stopped by adding 0.5 ml of 35% (w/w)
trifluoroacetic acid (TFA) and the tubes were centrifuged for 5 min at 5000 ×
g. The cinnamic acid yield was estimated by measuring the absorbance at
290 nm of the supernatant using a spectrophotometer (Varioskan Flash
Multimode Reader, Thermo Fisher Scientific, USA). One unit of PAL activity
is defined as the formation of 1 mmol cinnamic acid per hour.
5.2.4.3 Extraction of β-1,3-glucanase and chitinase
A crude enzyme extract was prepared using the method given by Zheng
et al. (2011). Plant samples from each treatment were homogenized with
0.1M acetic acid buffer (pH 5.0) and centrifuged at 10,000 x g and 4 °C for 5
min. The supernatant was the enzyme extract.
5.2.4.3.1 Assay of β-1,3-glucanase activity
The activity of β-1,3-glucanase was assayed using laminarin as a
substrate (Siefert et al., 1994). The assay mixture consisted of 100 µl of
crude enzyme mixed with 50 µl of 0.4% laminarin, followed by incubation for
1 hour at 37 °C. One ml of 1.0% 3,5-dinitrosalicylic acid was added and the
reaction mixture was boiled for 5 min to stop the reaction, followed by
immediate incubation on ice. The increase in absorbance was measured at
119
500 nm using a UV-Vis spectrophotometer (Varioskan Flash Multimode
Reader, Thermo Fisher Scientific, USA) for 3 min. The β,1-3-glucanase
activity was measured as the amount of reducing glucose released from
laminarin using glucose as a standard and determined from the standard
curve described in Section 4.3.1.2. Enzyme activity is expressed as U g-1
fresh weight, where one unit is defined as the formation of 1 µmol glucose
released from laminarin per hour under these assay conditions.
5.2.4.3.2 Assay of chitinase activity
Chitinase activity was measured using the method described by Tonon et
al. (1998). An aliquot (600 µl) was mixed with 6 mg of glycol chitosan and 1
ml of 0.3 M sodium acetate buffer (pH 5.2) and shaken at 50 rpm for half an
hour. The mixture was then incubated at 37 °C for 2 hours followed by
centrifugation at 12,000 x g for 20 min. The supernatant (500 µl) was mixed
with 2 ml of 0.6 M sodium borate buffer and heated at 100 °C for 7 min. After
g p , E h’ g w h g
acetic acid (1:8 v/v) was added and the mixture was incubated at 37 °C for 2
hours. The absorbance was measured at 540 nm using a UV-Vis
spectrophotometer (Varioskan Flash Multimode Reader, Thermo Fisher
Scientific, USA) for 3 min. A standard curve was prepared using N-acetyl-D-
glucosamine (Appendix B 5.2). Chitinase activity was expressed as U g-1
fresh weight, where one unit is defined as 10-9 mol N-acetyl-D-glucosamine
produced per hour under these assay conditions.
120
5.2.4.4 Determination of vegetative growth of dragon fruit plants
The number and length of new shoots per cutting was recorded after the
main stem reached the height of the pole.
Stem diameter of the main stem was measured using a digital calliper
(CD-6C, Mitutoyo).
5.2.4.5 Chlorophyll content
Chlorophyll was measured using the method described by Ali et al. (2012)
with slight modifications. Stem samples (1 g) were ground with 10 ml of 80%
chilled acetone in a mortar and pestle. The extract was centrifuged for 15 min
at 1157 x g. The absorbance of the supernatant was determined at 646.6,
663.6 and 750 nm using a UV-Vis spectrophotometer (Varioskan Flash
Multimode Reader, Thermo Fisher Scientific, USA) for 3 min. Readings at
646.5 and 663.6 were corrected by subtracting light absorption at 750 nm.
Chlorophyll contents were measured using the following equations:
Ch ph (g ⁄ ) 2.25 A663.6 2.55 A646.6
Ch ph b (g ⁄ ) 2 .3 A646.6 4.9 A663.3
T h ph (g ⁄ ) 7.76 A646.6 7.34 A663.6
Where:
12.25, 2.55, 20.31, 4.91, 17.76 and 7.34 = constant
A663.6 = absorbance at wavelength 663.6
A646.6 = absorbance at wavelength 646.6
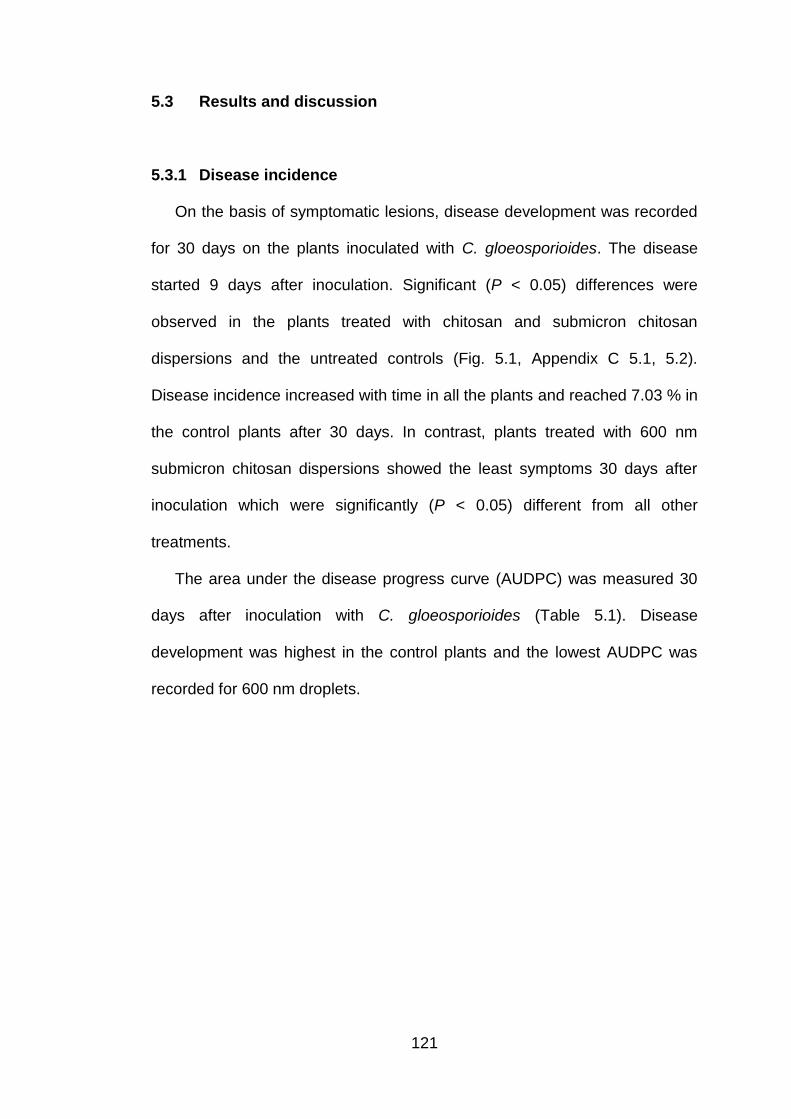
121
5.3 Results and discussion
5.3.1 Disease incidence
On the basis of symptomatic lesions, disease development was recorded
for 30 days on the plants inoculated with C. gloeosporioides. The disease
started 9 days after inoculation. Significant (P < 0.05) differences were
observed in the plants treated with chitosan and submicron chitosan
dispersions and the untreated controls (Fig. 5.1, Appendix C 5.1, 5.2).
Disease incidence increased with time in all the plants and reached 7.03 % in
the control plants after 30 days. In contrast, plants treated with 600 nm
submicron chitosan dispersions showed the least symptoms 30 days after
inoculation which were significantly (P < 0.05) different from all other
treatments.
The area under the disease progress curve (AUDPC) was measured 30
days after inoculation with C. gloeosporioides (Table 5.1). Disease
development was highest in the control plants and the lowest AUDPC was
recorded for 600 nm droplets.
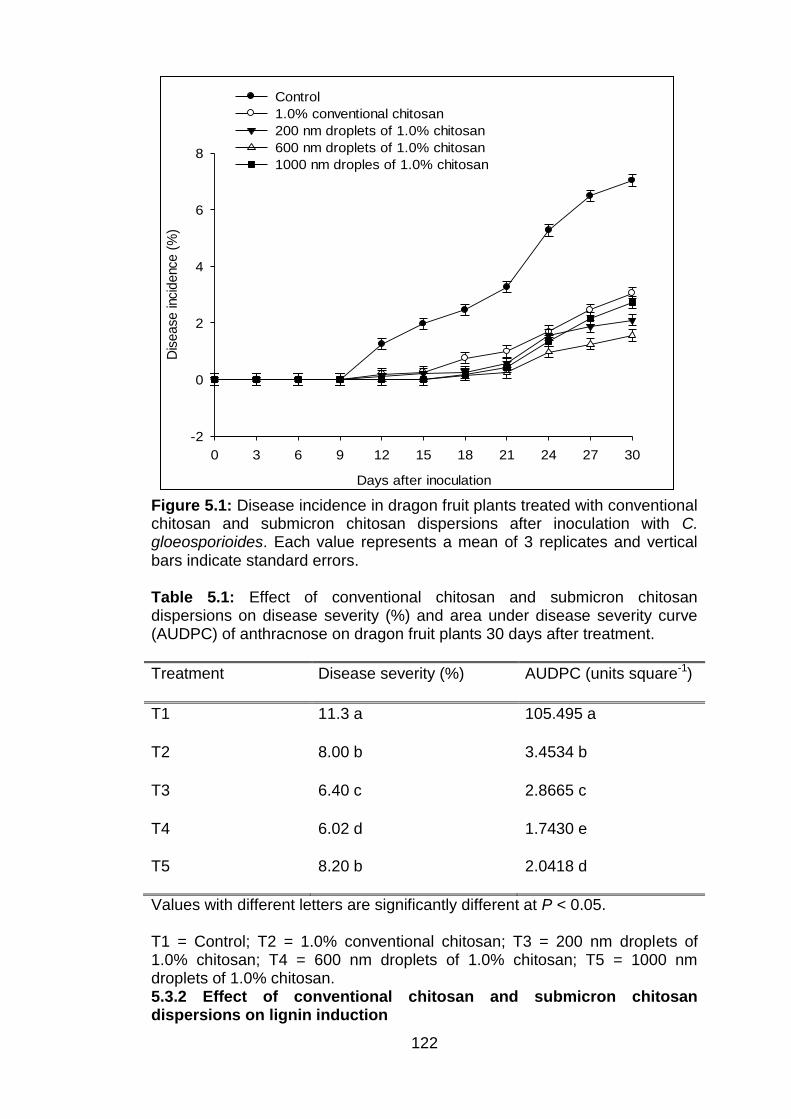
122
Figure 5.1: Disease incidence in dragon fruit plants treated with conventional chitosan and submicron chitosan dispersions after inoculation with C. gloeosporioides. Each value represents a mean of 3 replicates and vertical bars indicate standard errors. Table 5.1: Effect of conventional chitosan and submicron chitosan dispersions on disease severity (%) and area under disease severity curve (AUDPC) of anthracnose on dragon fruit plants 30 days after treatment.
Treatment Disease severity (%) AUDPC (units square-1)
T1 11.3 a 105.495 a
T2 8.00 b 3.4534 b
T3 6.40 c 2.8665 c
T4 6.02 d 1.7430 e
T5 8.20 b 2.0418 d
Values with different letters are significantly different at P < 0.05. T1 = Control; T2 = 1.0% conventional chitosan; T3 = 200 nm droplets of 1.0% chitosan; T4 = 600 nm droplets of 1.0% chitosan; T5 = 1000 nm droplets of 1.0% chitosan. 5.3.2 Effect of conventional chitosan and submicron chitosan dispersions on lignin induction
Days after inoculation
0 3 6 9 12 15 18 21 24 27 30
Dis
ea
se in
cid
ence (
%)
-2
0
2
4
6
8
Control
1.0% conventional chitosan
200 nm droplets of 1.0% chitosan
600 nm droplets of 1.0% chitosan
1000 nm droples of 1.0% chitosan
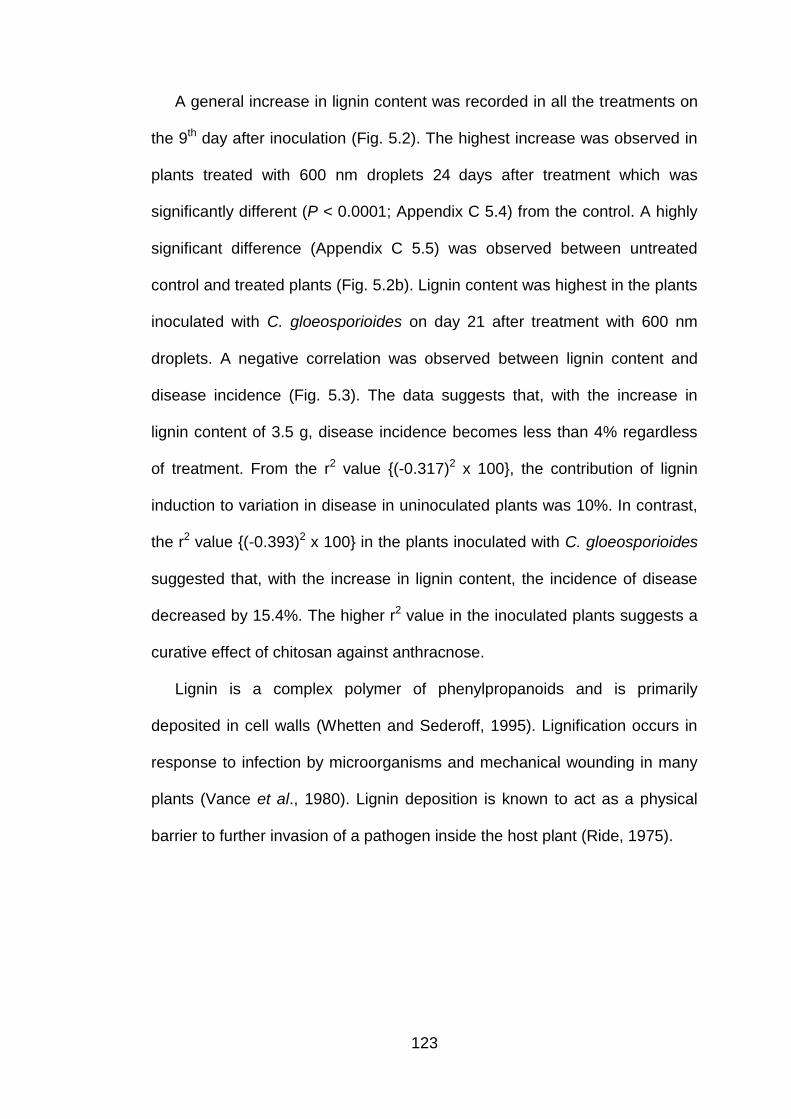
123
A general increase in lignin content was recorded in all the treatments on
the 9th day after inoculation (Fig. 5.2). The highest increase was observed in
plants treated with 600 nm droplets 24 days after treatment which was
significantly different (P < 0.0001; Appendix C 5.4) from the control. A highly
significant difference (Appendix C 5.5) was observed between untreated
control and treated plants (Fig. 5.2b). Lignin content was highest in the plants
inoculated with C. gloeosporioides on day 21 after treatment with 600 nm
droplets. A negative correlation was observed between lignin content and
disease incidence (Fig. 5.3). The data suggests that, with the increase in
lignin content of 3.5 g, disease incidence becomes less than 4% regardless
of treatment. From the r2 value {(-0.317)2 x 100}, the contribution of lignin
induction to variation in disease in uninoculated plants was 10%. In contrast,
the r2 value {(-0.393)2 x 100} in the plants inoculated with C. gloeosporioides
suggested that, with the increase in lignin content, the incidence of disease
decreased by 15.4%. The higher r2 value in the inoculated plants suggests a
curative effect of chitosan against anthracnose.
Lignin is a complex polymer of phenylpropanoids and is primarily
deposited in cell walls (Whetten and Sederoff, 1995). Lignification occurs in
response to infection by microorganisms and mechanical wounding in many
plants (Vance et al., 1980). Lignin deposition is known to act as a physical
barrier to further invasion of a pathogen inside the host plant (Ride, 1975).
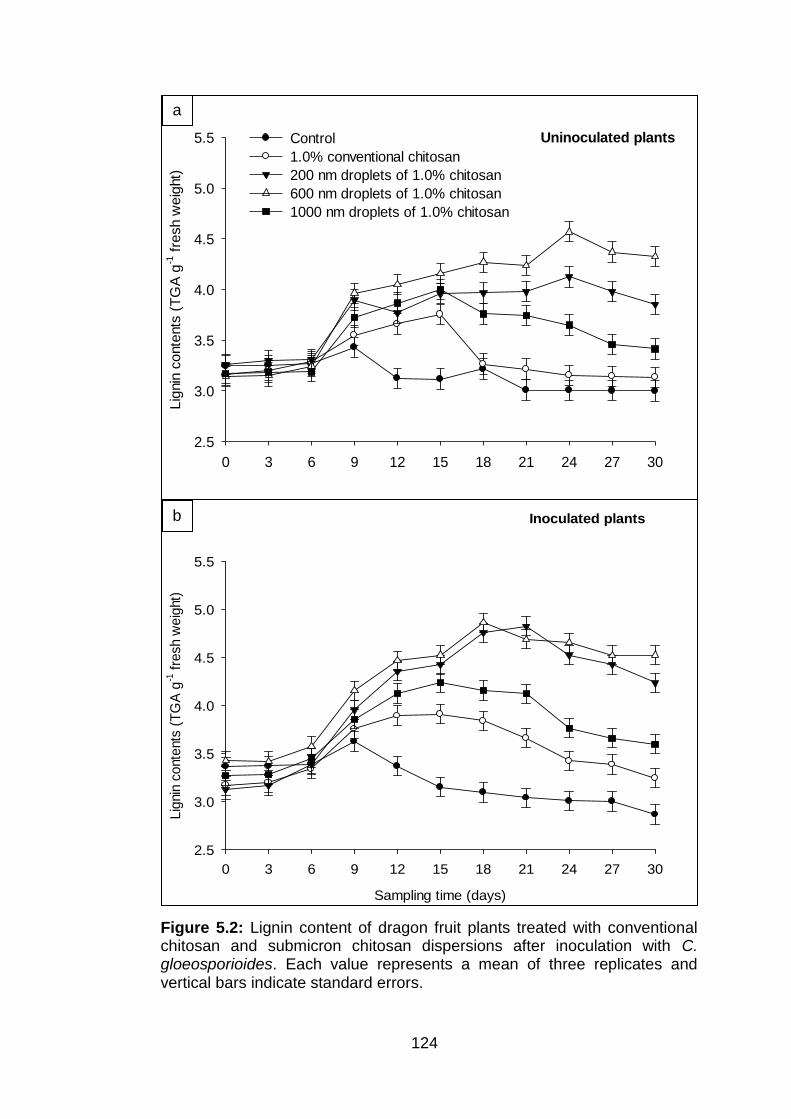
124
Figure 5.2: Lignin content of dragon fruit plants treated with conventional chitosan and submicron chitosan dispersions after inoculation with C. gloeosporioides. Each value represents a mean of three replicates and vertical bars indicate standard errors.
Uninoculated plants
0 3 6 9 12 15 18 21 24 27 30
Lig
nin
conte
nts
(T
GA
g-1 f
resh w
eig
ht)
2.5
3.0
3.5
4.0
4.5
5.0
5.5 Control
1.0% conventional chitosan
200 nm droplets of 1.0% chitosan
600 nm droplets of 1.0% chitosan
1000 nm droplets of 1.0% chitosan
Inoculated plants
Sampling time (days)
0 3 6 9 12 15 18 21 24 27 30
Lig
nin
conte
nts
(T
GA
g-1 f
resh w
eig
ht)
2.5
3.0
3.5
4.0
4.5
5.0
5.5
a
b
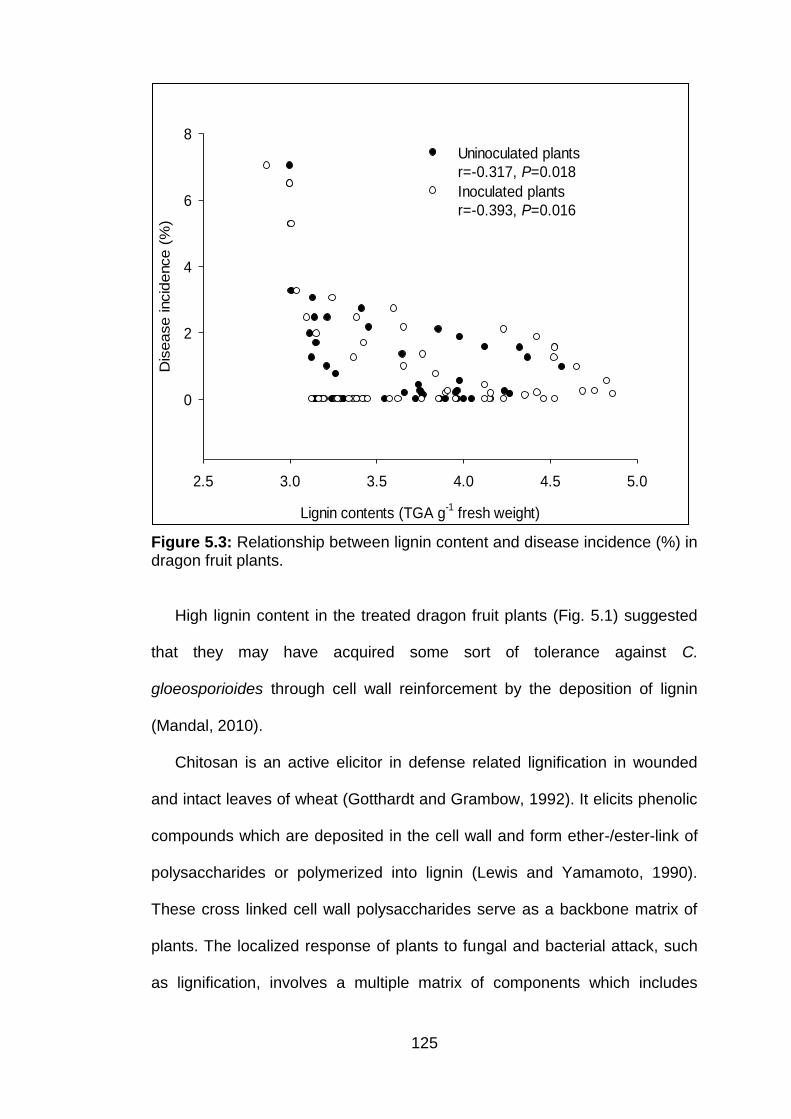
125
Figure 5.3: Relationship between lignin content and disease incidence (%) in dragon fruit plants.
High lignin content in the treated dragon fruit plants (Fig. 5.1) suggested
that they may have acquired some sort of tolerance against C.
gloeosporioides through cell wall reinforcement by the deposition of lignin
(Mandal, 2010).
Chitosan is an active elicitor in defense related lignification in wounded
and intact leaves of wheat (Gotthardt and Grambow, 1992). It elicits phenolic
compounds which are deposited in the cell wall and form ether-/ester-link of
polysaccharides or polymerized into lignin (Lewis and Yamamoto, 1990).
These cross linked cell wall polysaccharides serve as a backbone matrix of
plants. The localized response of plants to fungal and bacterial attack, such
as lignification, involves a multiple matrix of components which includes
Lignin contents (TGA g-1 fresh weight)
2.5 3.0 3.5 4.0 4.5 5.0
Dis
ease incid
ence (
%)
0
2
4
6
8
Uninoculated plants
r=-0.317, P=0.018
Inoculated plants
r=-0.393, P=0.016
126
phenolics and proteins (McLusky et al., 1999). In the present study, the
increase in lignin content in response to chitosan treatment is significant in
respect to cross linking of phenolic acids in cell wall material. The increase in
total phenolics resulted in increased deposition of lignin in plants (Mandal,
2010).
Increase in lignification was significant in wheat plants after chitosan
treatments which reduced infection by Fusarium graminearium (Reddy et al.,
1999). Previous studies showed that the lignified cells are more resistant to
cellulase and pectinase enzymes secreted by fungi (Ride and Pearce, 1979).
Biochemical studies showed that lignin content increased with the increase of
key enzymes such as phenyl ammonia lyase (PAL) during the expression of
resistance to various fungi (Tiburzy and Reisener, 1990).
5.3.3 Penetration of chitosan inside dragon fruit plants and its effects
on total phenolic
Green colour pigments were visible in the stem samples of the control
plants (Fig. 5.4a). The stem samples treated with 200 and 600 nm submicron
droplets showed large patches of purple blue pigments of dyed chitosan
inside the plants (Fig. 5.4c, 5.4d). In contrast, plants treated with 1000 nm
droplets and 1.0% conventional chitosan solutions showed very small purple
brown patches (Fig. 5.4b, 5.4e). This indicates that smaller sized droplets
enter the plants more effectively than larger droplets and conventional
chitosan. This lower permeation inside the plants may be due to the higher
viscosity of the chitosan solution or to incompatibility with the pore size of the
cell wall.

127
Figure 5.4: Visualization of dye-binded conventional chitosan and submicron chitosan dispersions inside stems of dragon fruit plants. Dye absent in a) control but visible in plants treated with b) 1.0% conventional chitosan, c) 200 nm droplets of 1.0% chitosan, d) 600 nm droplets of 1.0% chitosan and e) 1000 nm droplets of 1.0% chitosan. Stem f) showing accumulation of dye at the edge and g) stomata on the surface.
10µm
10µm
10µm 10µm
10µm 10µm
a.
f.
e.
d.
c.
b.
g.
128
The penetration of chitosan inside plants is still unclear. There is no
previous study supporting the uptake and movement of chitosan inside the
plant stem. It may penetrate through the plant epidermis, as the edge of
stems showed more purplish coloured cells (Fig 5.4f), or through natural
openings (stomata) (Fig 5.4 g). Further studies would be required in order to
untangle the mechanism behind binding of the dye with chitosan and also its
penetration and movement inside the plants.
The total phenolic content increased with the progress of disease in all
the plants. There was a significant interaction between treatments and days
for total phenolics in inoculated (Appendix C 5.6) and uninoculated plants
(Appendix C 5.7). An increase was observed on day 9 after treatment in all
the plants which was significantly (P < 0.05) different from the control plants
(Fig. 5.5a). A large increase in total phenolics was observed in the inoculated
plants. The phenolic content in plants increased gradually from day 9 until
day 12, but decreased gradually after day 18 with the progression in disease
in the plants treated with 1.0% conventional chitosan and 200 nm submicron
chitosan dispersion (Fig. 5.5b). The plants treated with 600 nm droplets
showed an increase in total phenolics until day 27 and remained constant
until the end. A negative correlation was observed in total phenolic content
and disease incidence (Fig. 5.6), which suggested that an increase in 0.2
units of total phenolics resulted in a 2% decrease in disease incidence. The
r2 value showed that the total phenolics resulted in 2.7% decrease in disease
in uninoculated plants and 11% decrease in inoculated plants. The
differences in the onset of phenolics in uninoculated and inoculated plants
suggested that the higher concentration of total phenolics may be allied with
129
less disease. A negative correlation between phenol levels and the degree of
disease resistance has been reported previously (Schlosser, 1980).
There is no information available on the antifungal effects of submicron
chitosan dispersions. In the present study, it was thought that the increased
amount of total phenols with 600 nm droplets was due to penetration of
chitosan inside the plants through natural openings and more effective
triggering of the enzymes (Fig. 5.4g). While 200 nm droplets can also
penetrate inside the plant, the amount of chitosan in the droplet may not be
enough to trigger the plant defense mechanism. Stability of smaller droplet
size could be another factor contributing to a slower release of chitosan from
the 200 nm droplets and consequent failure to stimulate the plant defense
mechanism.
There are several reports which have shown that chitosan has some
eliciting properties (Manjunatha et al., 2008; Liu et al., 2007; Ali, 2006;
Bautista-Baños et al., 2006; Ben-Shalom et al., 2002). Growth of a pathogen
can be restricted or slowed down when high levels of phenolic compounds
accumulate at the site of pathogen invasion (Reimers and Leach, 1999). El
Ghaouth et al. (1994b,c) found that there was some elicitation of disease
resistance responses by chitosan in tomato and bell pepper. This may be
due to the induction of various enzymes, the formation of physical barriers
and plugging of intercellular spaces with antifungal phenolic-like compounds.
Liu et al. (2007) reported the induction of phenolic compounds in chitosan
treated tomato plants.
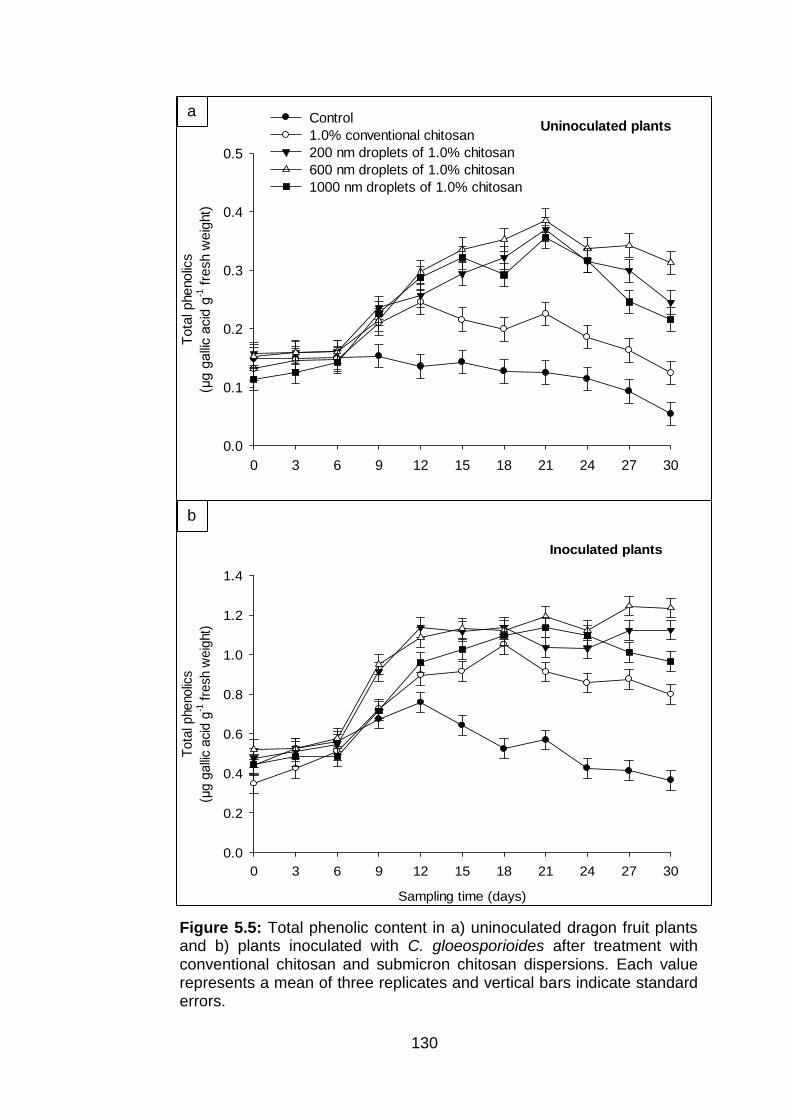
130
Figure 5.5: Total phenolic content in a) uninoculated dragon fruit plants and b) plants inoculated with C. gloeosporioides after treatment with conventional chitosan and submicron chitosan dispersions. Each value represents a mean of three replicates and vertical bars indicate standard errors.
Uninoculated plants
0 3 6 9 12 15 18 21 24 27 30
Tota
l phenolic
s
(µg g
alli
c a
cid
g-1 f
resh w
eig
ht)
0.0
0.1
0.2
0.3
0.4
0.5
Control
1.0% conventional chitosan
200 nm droplets of 1.0% chitosan
600 nm droplets of 1.0% chitosan
1000 nm droplets of 1.0% chitosan
Inoculated plants
Sampling time (days)
0 3 6 9 12 15 18 21 24 27 30
Tota
l phenolic
s
(µg g
alli
c a
cid
g-1 f
resh w
eig
ht)
0.0
0.2
0.4
0.6
0.8
1.0
1.2
1.4
a
b
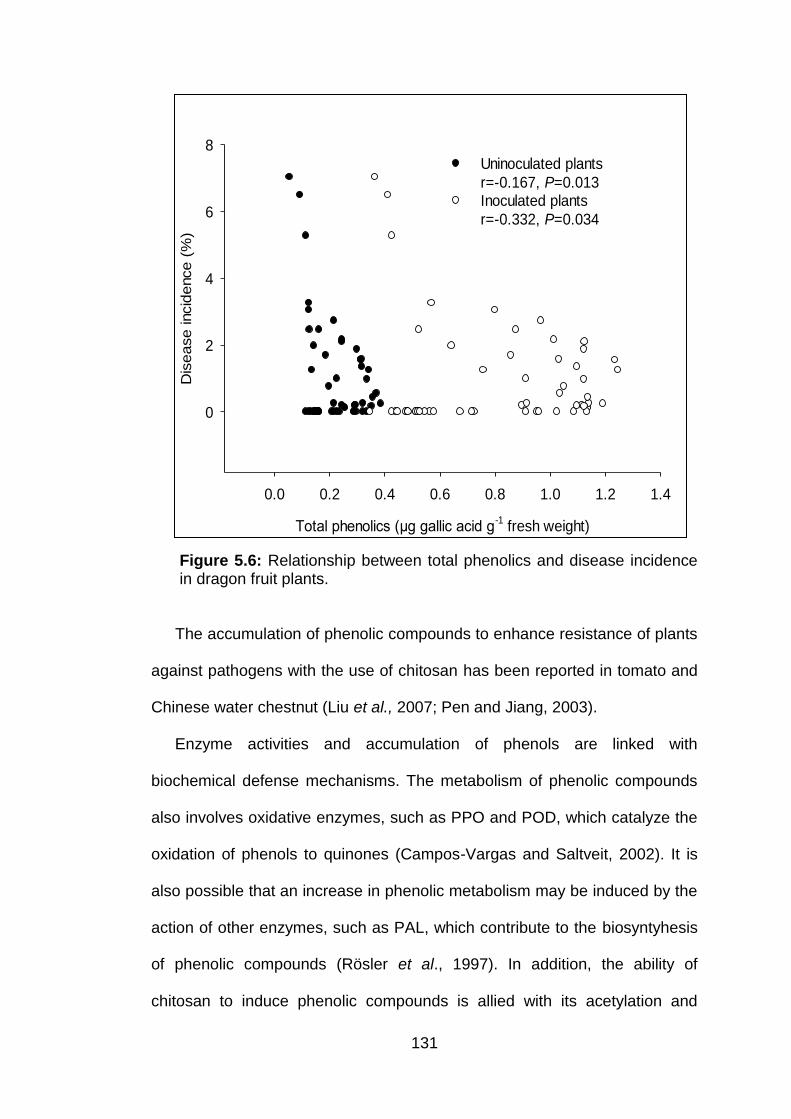
131
Figure 5.6: Relationship between total phenolics and disease incidence in dragon fruit plants.
The accumulation of phenolic compounds to enhance resistance of plants
against pathogens with the use of chitosan has been reported in tomato and
Chinese water chestnut (Liu et al., 2007; Pen and Jiang, 2003).
Enzyme activities and accumulation of phenols are linked with
biochemical defense mechanisms. The metabolism of phenolic compounds
also involves oxidative enzymes, such as PPO and POD, which catalyze the
oxidation of phenols to quinones (Campos-Vargas and Saltveit, 2002). It is
also possible that an increase in phenolic metabolism may be induced by the
action of other enzymes, such as PAL, which contribute to the biosyntyhesis
of phenolic compounds (Rösler et al., 1997). In addition, the ability of
chitosan to induce phenolic compounds is allied with its acetylation and
Total phenolics (µg gallic acid g-1 fresh weight)
0.0 0.2 0.4 0.6 0.8 1.0 1.2 1.4
Dis
ease incid
ence (
%)
0
2
4
6
8
Uninoculated plants
r=-0.167, P=0.013Inoculated plants
r=-0.332, P=0.034
132
polymerization and with the physiology of the plant. Further study at the
molecular level is required to elucidate the mechanism of submicron chitosan
dispersions against fungal pathogens.
5.3.4 Effect of conventional chitosan and submicron chitosan dispersions on enzymatic activities 5.3.4.1 Peroxidase (PO) activity
Significantly more PO activity (P < 0.05) was observed in treated as
compared with untreated plants (Appendix C 5.8, 5.9). Plants treated with
200 nm and 1000 nm submicron chitosan dispersions showed a maximum
increase in PO activity on day 21 (Fig. 5.7a) and on day 24 with 600 nm
submicron chitosan dispersions. Plants inoculated with C. gloeosporioides
showed higher PO activity. There was a constant decrease over time in PO
activity in control plants (P < 0.05) (Fig. 5.7b). The PO activity was negatively
correlated with disease incidence (Fig. 5.8). The data suggests that
regardless of treatment, with an increase in 0.1 U g-1 of PO activity disease
incidence reduced to 3%. From the r2 value {(-0.182)2 x 100}, the contribution
of PO to variation in disease in uninoculated plants was 3%. While the r2
value {(-0.295)2 x 100} in the inoculated plants suggested that with the
increase in PO activity the disease incidence decreased by 8.7%. The higher
r2 value in the inoculated plants suggests that chitosan induced resistance
against anthracnose.
Chitosan being a polycationic polymer may interact with negatively
charged phospholipids, upsetting the plasma membrane integrity of plant
cells and, consequently, increasing the elicitor activity (Amini, 2009; Eikemo
et al., 2003; Paz-Lago et al., 2000). Production of peroxidases in plant
133
tissues is dependent on environmental conditions, possibly the timing of the
treatment, methods of assay and the choice of substrate (Reuveni, 1995).
Induced resistance is a common response of a host plant when inoculated or
treated with avirulent or non-pathogenic isolates or chemicals, prior to or
associated with inoculation of a pathogen (Xue et al., 1998). The involvement
of PO has been implicated in defense responses of many crop/pathogen
interactions (Anguelova et al., 1999; Tonon et al., 1998; Hammerschmidt and
Yang Cashman, 1995; Geiger et al., 1993; Khan et al., 2003; Agrawal et al.,
2002; Kazana et al., 1998; Rybka et al., 1998). Peroxidases oxidize
phenolics to quinones (Campos-Vargas and Saltveit, 2002) and, during this
process, hydrogen peroxide is generated which is toxic to many pathogens
(Peng and Kuc, 1992) and releases highly reactive free radicals (Mader et
al., 1980).
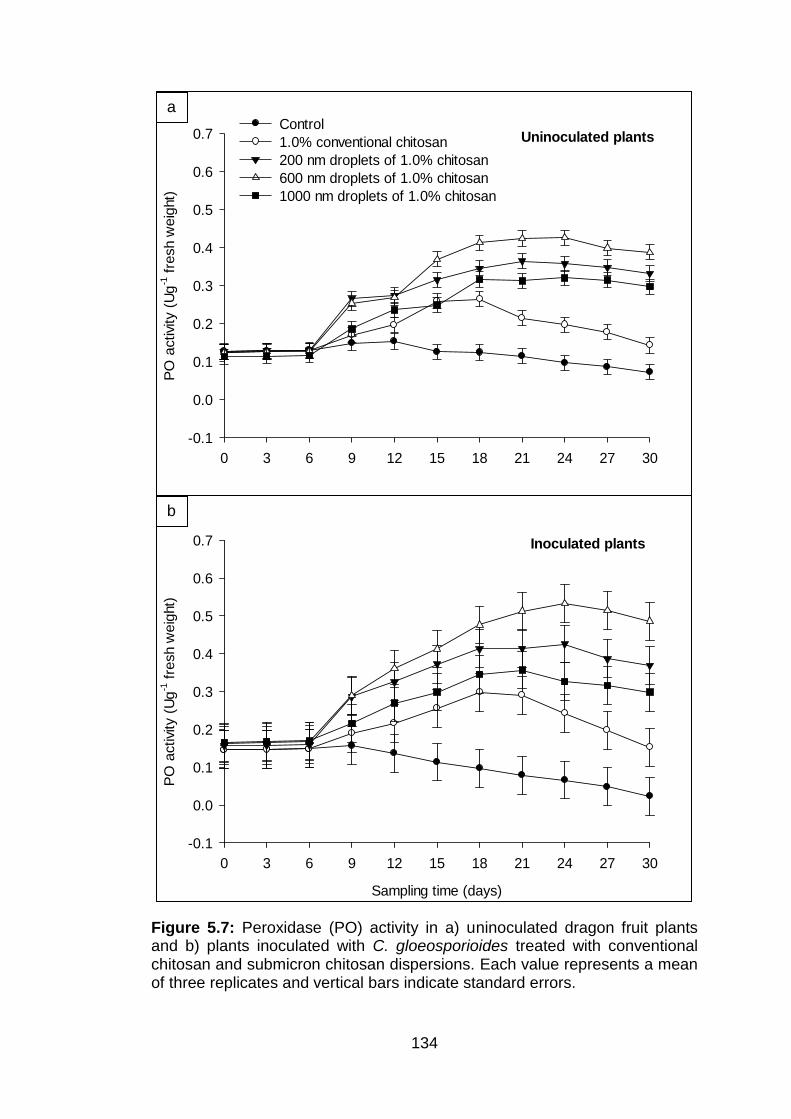
134
Figure 5.7: Peroxidase (PO) activity in a) uninoculated dragon fruit plants and b) plants inoculated with C. gloeosporioides treated with conventional chitosan and submicron chitosan dispersions. Each value represents a mean of three replicates and vertical bars indicate standard errors.
Uninoculated plants
0 3 6 9 12 15 18 21 24 27 30
PO
activi
ty (
Ug
-1 f
resh w
eig
ht)
-0.1
0.0
0.1
0.2
0.3
0.4
0.5
0.6
0.7Control
1.0% conventional chitosan
200 nm droplets of 1.0% chitosan
600 nm droplets of 1.0% chitosan
1000 nm droplets of 1.0% chitosan
Inoculated plants
Sampling time (days)
0 3 6 9 12 15 18 21 24 27 30
PO
activi
ty (
Ug
-1 f
resh w
eig
ht)
-0.1
0.0
0.1
0.2
0.3
0.4
0.5
0.6
0.7
a
b
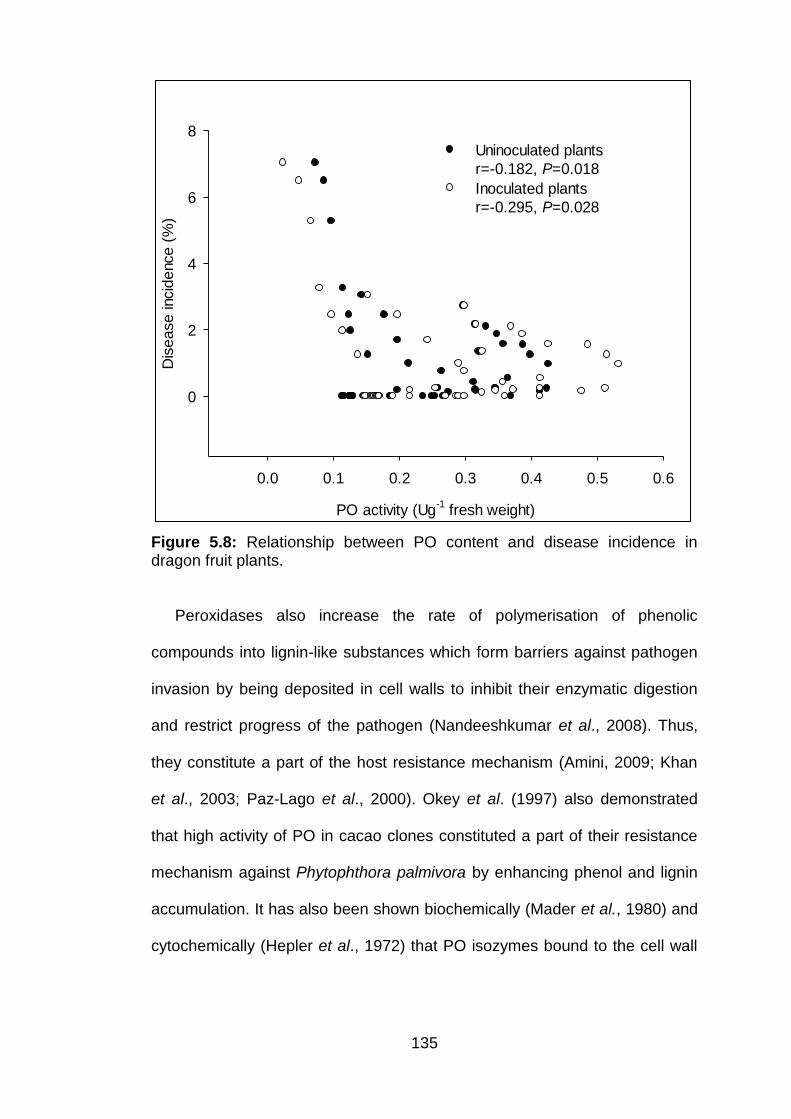
135
Figure 5.8: Relationship between PO content and disease incidence in dragon fruit plants.
Peroxidases also increase the rate of polymerisation of phenolic
compounds into lignin-like substances which form barriers against pathogen
invasion by being deposited in cell walls to inhibit their enzymatic digestion
and restrict progress of the pathogen (Nandeeshkumar et al., 2008). Thus,
they constitute a part of the host resistance mechanism (Amini, 2009; Khan
et al., 2003; Paz-Lago et al., 2000). Okey et al. (1997) also demonstrated
that high activity of PO in cacao clones constituted a part of their resistance
mechanism against Phytophthora palmivora by enhancing phenol and lignin
accumulation. It has also been shown biochemically (Mader et al., 1980) and
cytochemically (Hepler et al., 1972) that PO isozymes bound to the cell wall
PO activity (Ug-1 fresh weight)
0.0 0.1 0.2 0.3 0.4 0.5 0.6
Dis
ease incid
ence (
%)
0
2
4
6
8
Uninoculated plants
r=-0.182, P=0.018
Inoculated plants
r=-0.295, P=0.028
136
play a role in lignification. Liu et al. (2007) found that the levels of PO
increased significantly at 25°C and at 2°C in chitosan-treated tomato fruit.
PO has also been reported to be involved in many processes that lead to
morphological changes associated with disease resistance (Dalisay and Kuc,
1995). Mayer (2006) observed that the susceptibility of plants to pathogens
dramatically increased when there were lower amounts of PO in the plants.
PO played a significant role in increasing the defense of a plant against
pathogens.
Therefore, the current observation on the increased activity of PO
suggests that it is one of the manifestations of resistance mechanisms
induced by 600 nm droplets as compared to other treatments.
5.3.4.2 Polyphenol oxidase (PPO) activity
An initial increase in PPO activity occurred in all the treatments including
the control (Fig. 5.9). Differences between the treated and untreated plants
were significant (P < 0.05; Appendix C 5.10, 5.11) with the highest activity
occurring in plants treated with 200 nm and 600 nm droplets of 1% chitosan.
The plants treated with 1.0% conventional chitosan and 1000 nm submicron
chitosan dispersions showed their highest PPO activity on or after day 18
after treatment (Fig. 5.9a). The activity of PPO was higher in all the treated
plants that had been inoculated with C. gloeosporioides (Fig 5.9b). .
There was a negative correlation between PPO activity and disease
incidence (Fig. 5.10). The value of r2 {(-0.25)2 x 100} showed that the
increase of PPO activity resulted in a 6.25% decrease in disease in
uninoculated plants and {(-0.395)2 x 100} 15.6% decrease in inoculated
plants. This indicates that 0.2 units increase in PPO activity lowered the
137
incidence of disease to 3% in uninoculated and inoculated plants regardless
of the treatment.
Chitosan acts as an eliciting compound as it increases the activity of
oxidative enzymes (Ben-Shalom et al., 2002). Oxidative enzymes, such as
PPO and PO, are responsible for the oxidation of phenolic compounds into
anti-microbial quinones in plant cells infected by phytopathogens, thus
conferring disease resistance during the incompatibility reactions (Chittoor et
al., 1990). The lower disease incidence in plants treated with 600 nm
submicron chitosan dispersions may signify the expression of induced
resistance (Ben-Shalom et al., 2002). The effectiveness in eliciting
compounds involved in reducing disease incidence may indicate that the
induced resistance can be effective, particularly in early stages of a disease
(Amini, 2009; Eikemo et al., 2003; Hoffland et al., 1996).
The significance of PPO activity in disease resistance is its property to
oxidize phenolic compounds to quinones, which are more toxic to pathogens
than the original phenolics (Campos-Vargas and Saltveit, 2002). A high
activity of PPO reported in wheat clones against F. graminearum was
considered to be a mechanism of induced resistance by the induction of
phenols and lignin accumulation (F ό -Rodríguez et al., 2009).
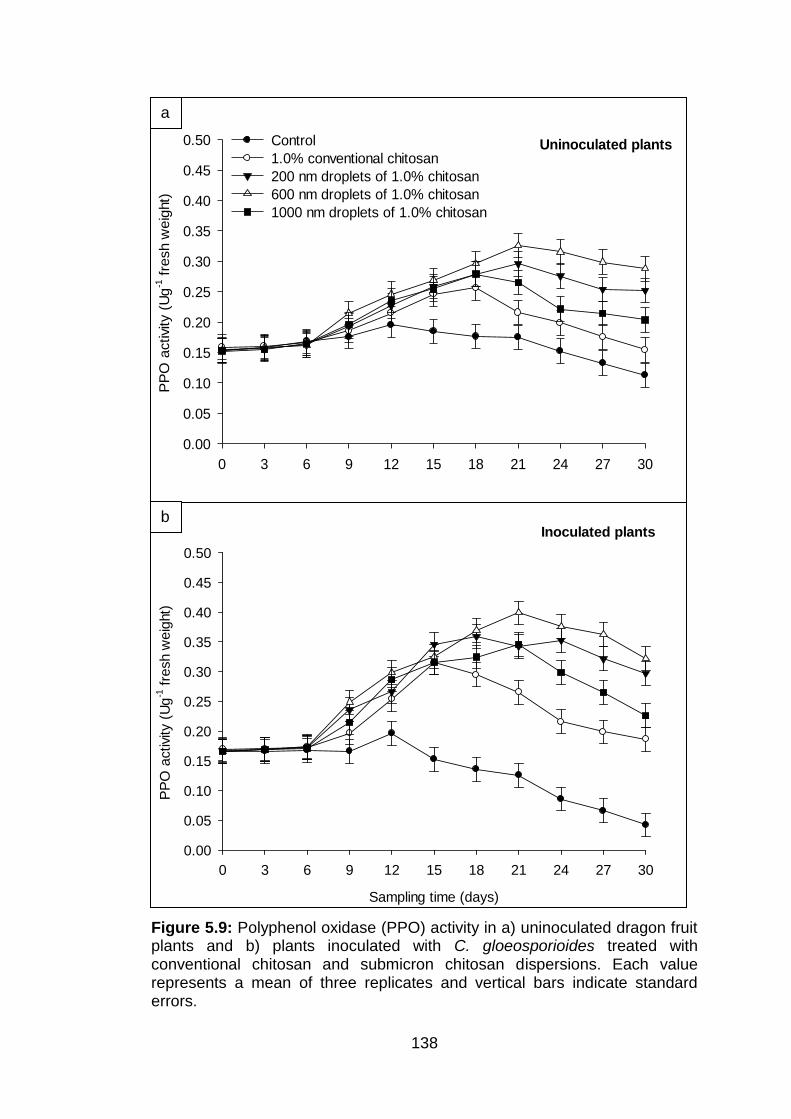
138
Figure 5.9: Polyphenol oxidase (PPO) activity in a) uninoculated dragon fruit plants and b) plants inoculated with C. gloeosporioides treated with conventional chitosan and submicron chitosan dispersions. Each value represents a mean of three replicates and vertical bars indicate standard errors.
Uninoculated plants
0 3 6 9 12 15 18 21 24 27 30
PP
O a
ctivi
ty (
Ug
-1 f
resh w
eig
ht)
0.00
0.05
0.10
0.15
0.20
0.25
0.30
0.35
0.40
0.45
0.50 Control
1.0% conventional chitosan
200 nm droplets of 1.0% chitosan
600 nm droplets of 1.0% chitosan
1000 nm droplets of 1.0% chitosan
Inoculated plants
Sampling time (days)
0 3 6 9 12 15 18 21 24 27 30
PP
O a
ctivi
ty (
Ug
-1 f
resh w
eig
ht)
0.00
0.05
0.10
0.15
0.20
0.25
0.30
0.35
0.40
0.45
0.50
a
b
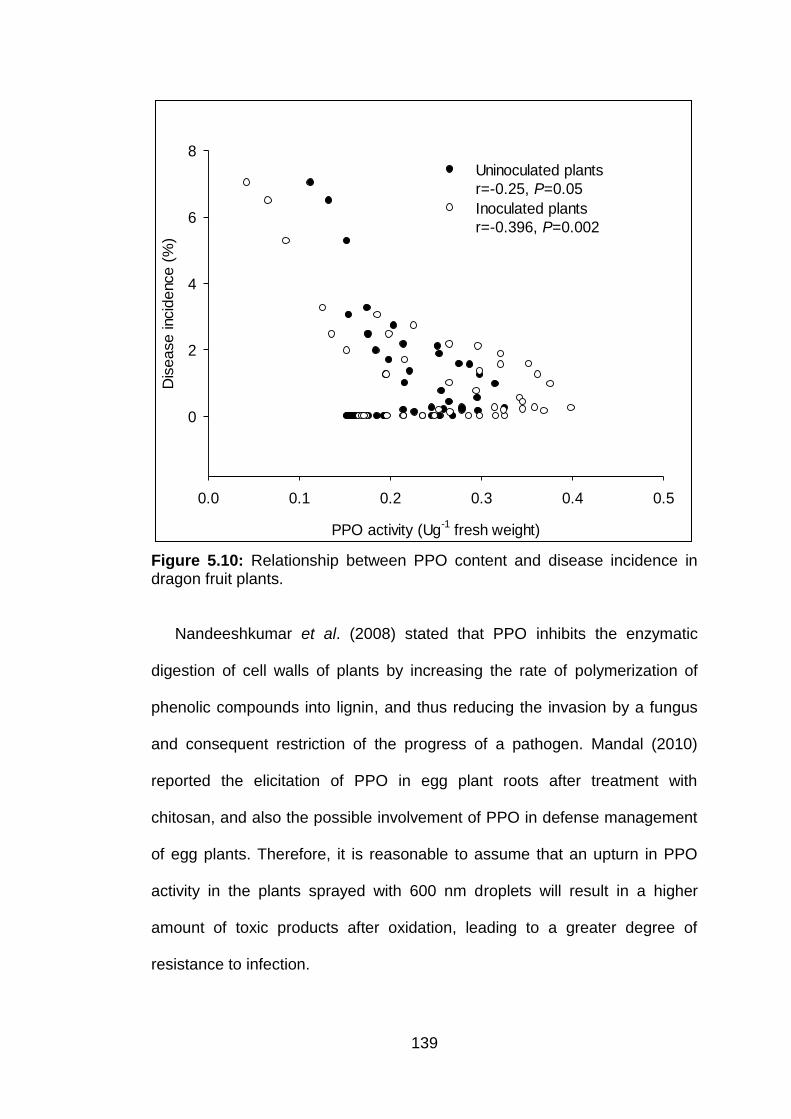
139
Figure 5.10: Relationship between PPO content and disease incidence in dragon fruit plants.
Nandeeshkumar et al. (2008) stated that PPO inhibits the enzymatic
digestion of cell walls of plants by increasing the rate of polymerization of
phenolic compounds into lignin, and thus reducing the invasion by a fungus
and consequent restriction of the progress of a pathogen. Mandal (2010)
reported the elicitation of PPO in egg plant roots after treatment with
chitosan, and also the possible involvement of PPO in defense management
of egg plants. Therefore, it is reasonable to assume that an upturn in PPO
activity in the plants sprayed with 600 nm droplets will result in a higher
amount of toxic products after oxidation, leading to a greater degree of
resistance to infection.
PPO activity (Ug-1 fresh weight)
0.0 0.1 0.2 0.3 0.4 0.5
Dis
ease incid
ence (
%)
0
2
4
6
8
Uninoculated plants
r=-0.25, P=0.05
Inoculated plants
r=-0.396, P=0.002

140
5.3.4.3 Effect of conventional chitosan and submicron chitosan dispersions on phenylalanine ammonia lyase (PAL) activity
PAL activity was significantly (P < 0.05) higher in treated plants (Appendix
C 5.12, 5.13). Conventional chitosan at 1.0% concentration showed a
maximum PAL activity (1.762 U g-1 fresh weight) on day 18 after treatment,
while all the submicron chitosan dispersions showed maximum PAL activity
on day 21 after treatment (Fig. 5.11a). A similar trend in PAL activity was
observed in the plants inoculated with C. gloeosporioides (Fig. 5.11b).
There was a negative correlation between PAL activity and disease
incidence (Fig. 5.12). The r2 value {(-0.657)2 x 100} showed that PAL activity
resulted in a 43% decrease in disease in uninoculated plants and {(-0.811)2
x100} 65.7% decrease in inoculated plants. The differences in r2 values in
uninoculated and inoculated plants suggest that PPO activity increased with
the increase in disease and may be associated with the reduction in disease
incidence.
PAL is a key enzyme in the metabolism of phenylpropanoids, that
catalyses phenylalanine to trans-cinnamic acid. It is the first step in
phenylpropanoids biosynthesis, which leads to secondary metabolites, such
as phytoalexins, lignins and flavonoids (Nandeeshkumar et al., 2008).
Various biotic factors (e.g. infection by fungi, bacteria and viruses) and
abiotic factors (e.g. wounding, UV-B light and high and low temperatures) are
responsible for induction of PAL (Strack, 1997; Dixon and Paiva, 1995;
Hahlbrbrock and Scheel, 1989), which suggests that PAL plays an essential
role in modulating the resistance of plant tissues to such stresses.
Chitosan treatments have been reported to enhance disease resistance
by regulating defense enzymes, such as β-1,3-glucanase, chitinase, PAL,
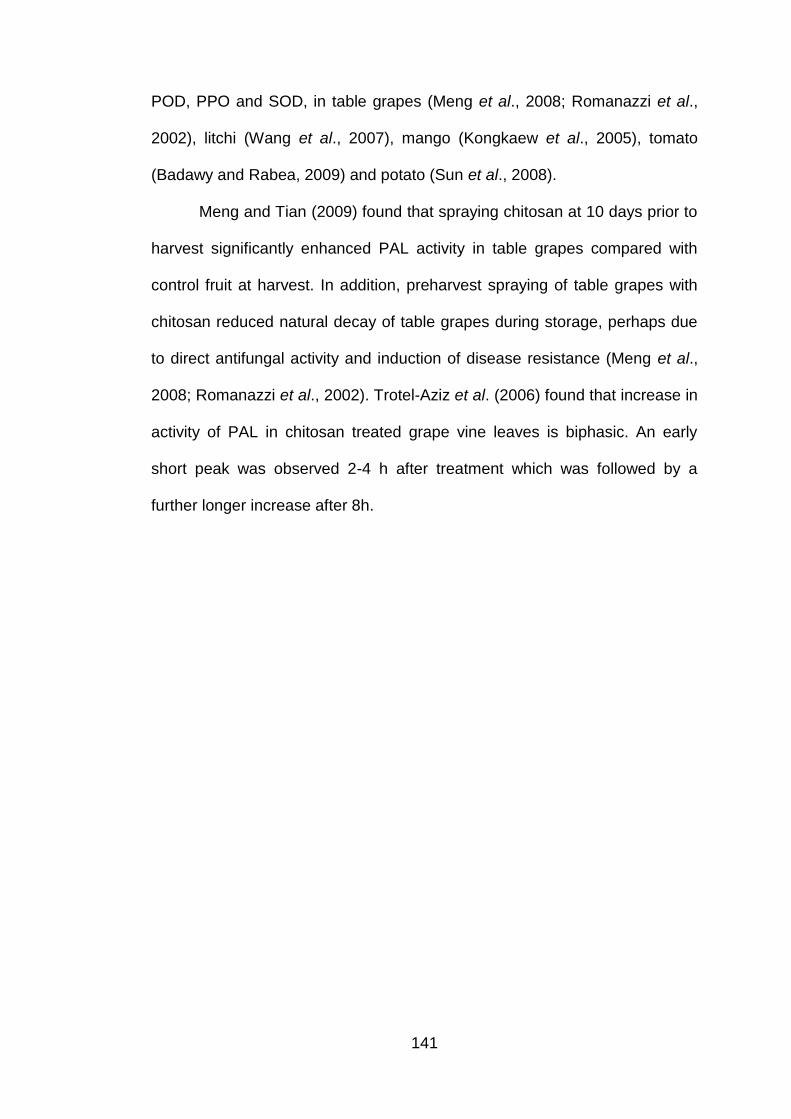
141
POD, PPO and SOD, in table grapes (Meng et al., 2008; Romanazzi et al.,
2002), litchi (Wang et al., 2007), mango (Kongkaew et al., 2005), tomato
(Badawy and Rabea, 2009) and potato (Sun et al., 2008).
Meng and Tian (2009) found that spraying chitosan at 10 days prior to
harvest significantly enhanced PAL activity in table grapes compared with
control fruit at harvest. In addition, preharvest spraying of table grapes with
chitosan reduced natural decay of table grapes during storage, perhaps due
to direct antifungal activity and induction of disease resistance (Meng et al.,
2008; Romanazzi et al., 2002). Trotel-Aziz et al. (2006) found that increase in
activity of PAL in chitosan treated grape vine leaves is biphasic. An early
short peak was observed 2-4 h after treatment which was followed by a
further longer increase after 8h.
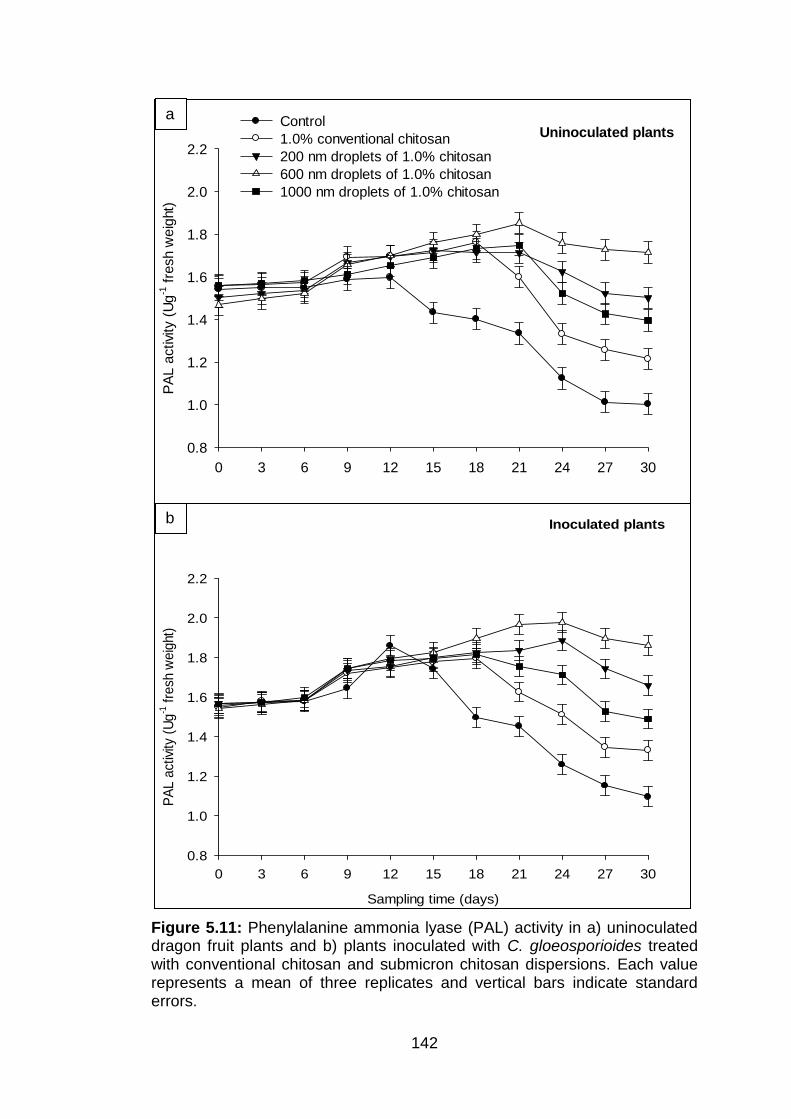
142
Figure 5.11: Phenylalanine ammonia lyase (PAL) activity in a) uninoculated dragon fruit plants and b) plants inoculated with C. gloeosporioides treated with conventional chitosan and submicron chitosan dispersions. Each value represents a mean of three replicates and vertical bars indicate standard errors.
Uninoculated plants
0 3 6 9 12 15 18 21 24 27 30
PA
L a
ctivi
ty (
Ug
-1 f
resh w
eig
ht)
0.8
1.0
1.2
1.4
1.6
1.8
2.0
2.2
Control
1.0% conventional chitosan
200 nm droplets of 1.0% chitosan
600 nm droplets of 1.0% chitosan
1000 nm droplets of 1.0% chitosan
Inoculated plants
Sampling time (days)
0 3 6 9 12 15 18 21 24 27 30
PA
L a
ctiv
ity (
Ug
-1 f
resh
weig
ht)
0.8
1.0
1.2
1.4
1.6
1.8
2.0
2.2
a
b
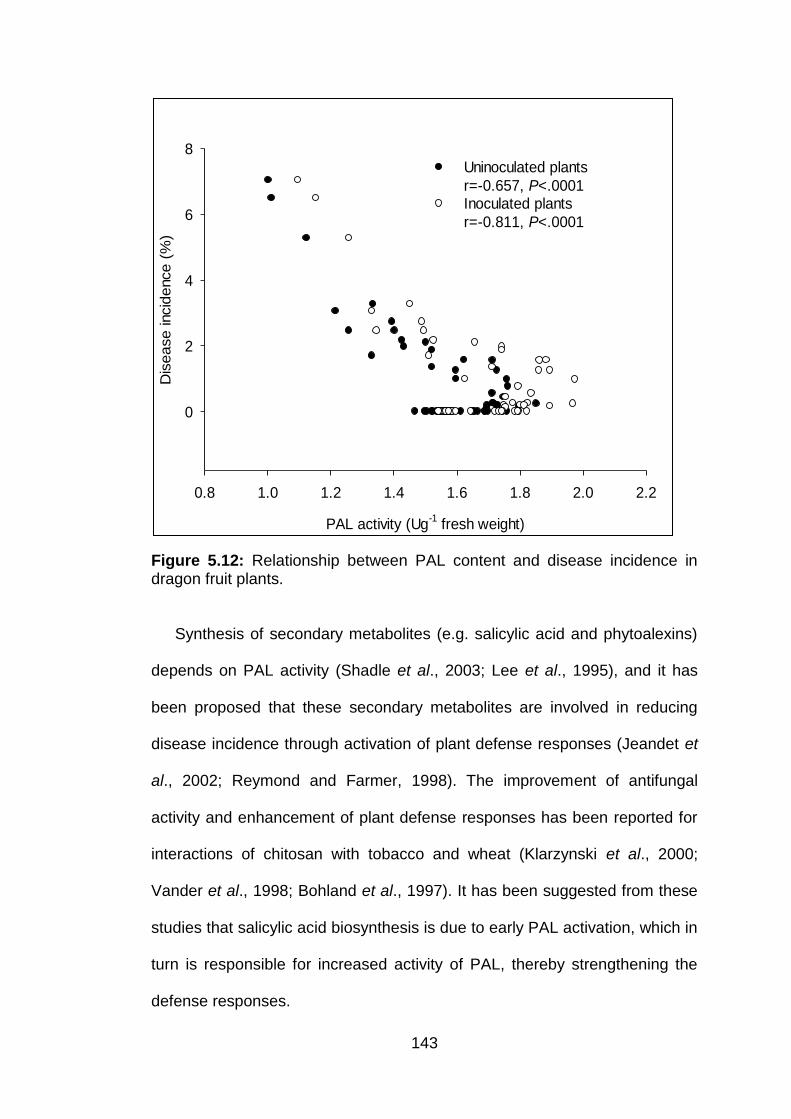
143
Figure 5.12: Relationship between PAL content and disease incidence in dragon fruit plants.
Synthesis of secondary metabolites (e.g. salicylic acid and phytoalexins)
depends on PAL activity (Shadle et al., 2003; Lee et al., 1995), and it has
been proposed that these secondary metabolites are involved in reducing
disease incidence through activation of plant defense responses (Jeandet et
al., 2002; Reymond and Farmer, 1998). The improvement of antifungal
activity and enhancement of plant defense responses has been reported for
interactions of chitosan with tobacco and wheat (Klarzynski et al., 2000;
Vander et al., 1998; Bohland et al., 1997). It has been suggested from these
studies that salicylic acid biosynthesis is due to early PAL activation, which in
turn is responsible for increased activity of PAL, thereby strengthening the
defense responses.
PAL activity (Ug-1 fresh weight)
0.8 1.0 1.2 1.4 1.6 1.8 2.0 2.2
Dis
ease incid
ence (
%)
0
2
4
6
8
Uninoculated plants
r=-0.657, P<.0001Inoculated plants
r=-0.811, P<.0001
144
5.3.4.4 Effect of conventional chitosan and submicron chitosan dispersions on β-1,3-glucanase and chitinase activity
All the chitosan treated plants showed the highest β-1,3-glucanase
activity on day 18 after treatment (Fig. 5.13a) for uninoculated plants and on
day 21 for the plants inoculated with C. gloeosporioides (Fig. 5.13b). The
activity of β-1,3-glucanase activity in control plants decreased after day 12.
There was a significant interaction between treatments and days after
treatment (Appendix C 5.14, 5.15). β-1,3-glucanase activity in dragon fruit
plants was negatively correlated with incidence of disease (Fig. 5.15a). With
every 0.5 unit increase in β-1,3-glucanase activity, the disease incidence
reduced by 2%. The r2 value {(-02.58)2 x 100) showed that β, 1-3 glucanase
activity contributed 6.6% in reduction of disease incidence in uninoculated
plants and {(-0.329)2 x 100} 10% in inoculated plants.
Differences in chitinase activity between all the treatments were
significant (P < 0.05) (Appendix C 5.16, 5.17). The plants treated with 1.0%
conventional chitosan and 200 nm and 1000 nm submicron chitosan
dispersions showed the highest increase in chitinase activity on day 15 after
treatment and then it gradually declined, whereas the plants treated with 600
nm droplets showed highest activity on day 18 (Fig. 5.14a). An increased
chitinase activity in the plants inoculated with C. gloeosporioides was
recorded on day 18. The maximum increase occurred in the plants treated
with 600 nm droplets while the maximum decline in chitinase activity was
recorded in the plants sprayed with water (Fig 5.14b). There was a negative
relationship between chitinase activity and disease incidence (Fig. 5.15b).
The data suggests that regardless of treatment and of inoculation with C.
gloeosporioides, whenever chitinase acitivity exceeds 0.20 units, the
145
incidence of disease is limited to below 3%. The values obtained for r2, {(-
0.276) x 100} and {(-0.337)2 x 100}, showed that, with chitinase activity,
disease decreased by 7.6% and 11.0% in uninoculated and inoculated
plants, respectively.
Some proteins, known as pathogenesis related proteins (PR), are also
induced by stress, such as pathogen attack or wounding (Zheng et al., 2011).
β-1,3-glucanases belong to PR-3, -4, -8 and -11 families and chitinases
belong to the PR-2 family and are associated with defense responses (Van
Loon and Van Strien, 1999). Previous studies have shown that de-novo
synthesis of phenolic compounds has been triggered by chitosan which
serves as the first defensive route to inhibit fungus, while β-1,3-glucanase
serves as a mechanical barrier to inhibit fungal invasion inside the plant
tissue and also protects the tissues against phytotoxic substances produced
by the fungus. A significant increase in the intercellular β-1,3-glucanase and
chitinase was observed in ground nut plants treated with chitosan
(Sathiyabama and Balasubramanian, 1998).
The accumulation of PR proteins in plants may lead to the hydrolysis of β-
1,3-glucan which is the major component of fungal cell walls (Neuhaus,
1999). The stimulation of chitinase and β-1,3-glucanase in pea seeds after
treatment with Penicillium fluorescens resulted in fungal cell wall degradation
(Benhamou, 1996).
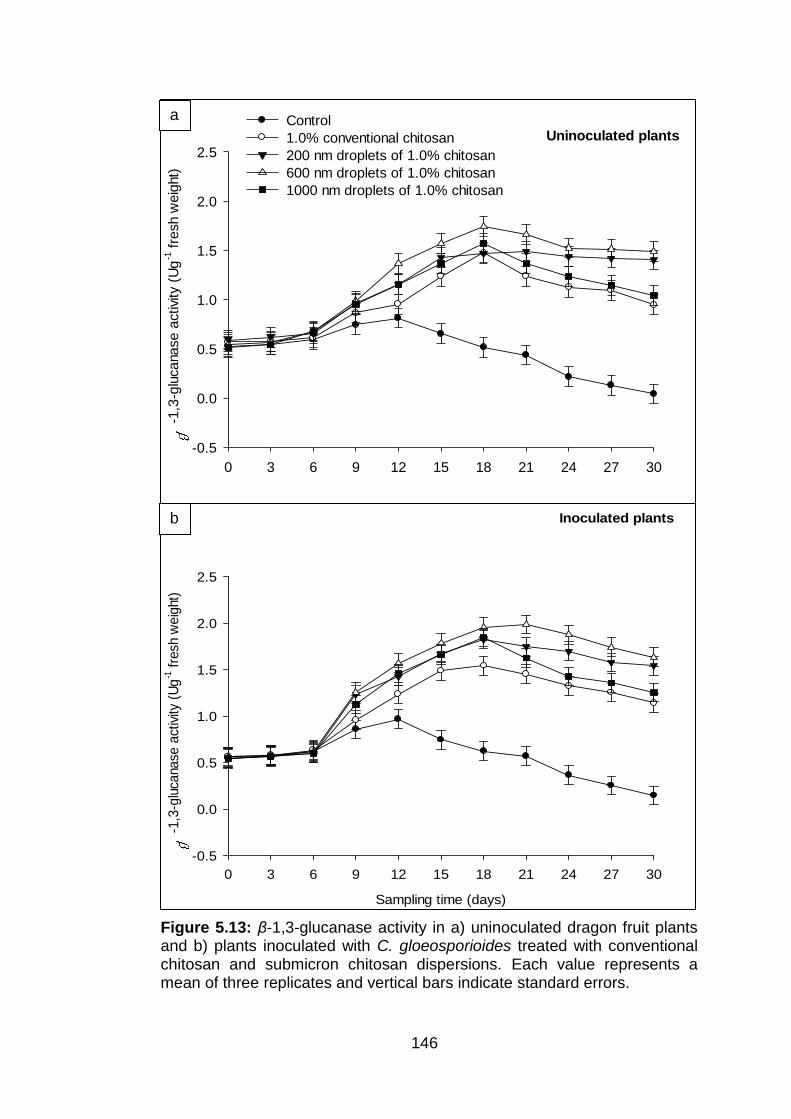
146
Figure 5.13: β-1,3-glucanase activity in a) uninoculated dragon fruit plants and b) plants inoculated with C. gloeosporioides treated with conventional chitosan and submicron chitosan dispersions. Each value represents a mean of three replicates and vertical bars indicate standard errors.
Uninoculated plants
0 3 6 9 12 15 18 21 24 27 30
-1,3
-glu
canase a
ctivi
ty (
Ug
-1 f
resh w
eig
ht)
-0.5
0.0
0.5
1.0
1.5
2.0
2.5
Control
1.0% conventional chitosan
200 nm droplets of 1.0% chitosan
600 nm droplets of 1.0% chitosan
1000 nm droplets of 1.0% chitosan
Inoculated plants
Sampling time (days)
0 3 6 9 12 15 18 21 24 27 30
-1,3
-glu
cana
se a
ctiv
ity (
Ug
-1 f
resh
weig
ht)
-0.5
0.0
0.5
1.0
1.5
2.0
2.5
a
b
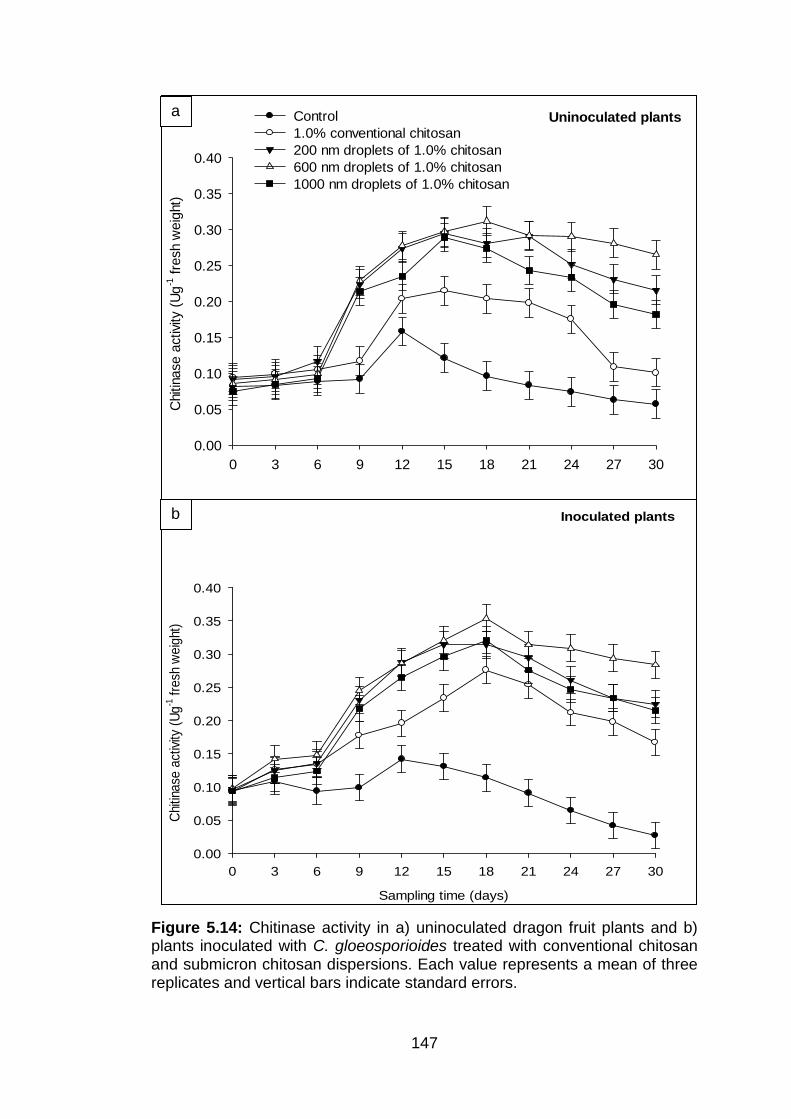
147
Figure 5.14: Chitinase activity in a) uninoculated dragon fruit plants and b) plants inoculated with C. gloeosporioides treated with conventional chitosan and submicron chitosan dispersions. Each value represents a mean of three replicates and vertical bars indicate standard errors.
Uninoculated plants
0 3 6 9 12 15 18 21 24 27 30
Chitin
ase a
ctivi
ty (
Ug
-1 f
resh w
eig
ht)
0.00
0.05
0.10
0.15
0.20
0.25
0.30
0.35
0.40
Control
1.0% conventional chitosan
200 nm droplets of 1.0% chitosan
600 nm droplets of 1.0% chitosan
1000 nm droplets of 1.0% chitosan
Inoculated plants
Sampling time (days)
0 3 6 9 12 15 18 21 24 27 30
Chi
tinase
act
ivity
(U
g-1 f
resh
weig
ht)
0.00
0.05
0.10
0.15
0.20
0.25
0.30
0.35
0.40
a
b
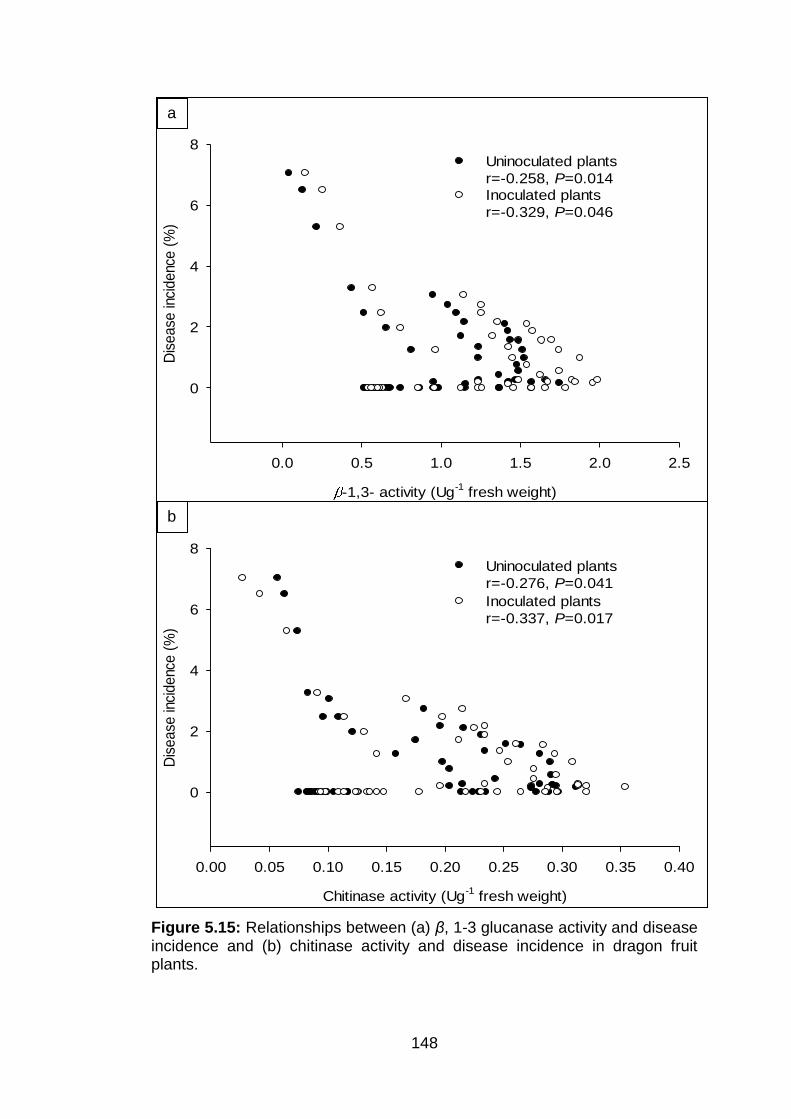
148
Figure 5.15: Relationships between (a) β, 1-3 glucanase activity and disease incidence and (b) chitinase activity and disease incidence in dragon fruit plants.
-1,3- activity (Ug-1 fresh weight)
0.0 0.5 1.0 1.5 2.0 2.5
Dis
ease
inci
denc
e (
%)
0
2
4
6
8
Uninoculated plants
r=-0.258, P=0.014Inoculated plants
r=-0.329, P=0.046
Chitinase activity (Ug-1 fresh weight)
0.00 0.05 0.10 0.15 0.20 0.25 0.30 0.35 0.40
Dis
ease
inci
denc
e (
%)
0
2
4
6
8
Uninoculated plants
r=-0.276, P=0.041
Inoculated plants
r=-0.337, P=0.017
a
b
149
In tomato plants, production of PR proteins induced by chitosan was
responsible for hyphal degradation of Fusarium oxysporum f. sp. radices
lycopersici (Benhamou and Thériault, 1992).
The systemic nature and consistent elicitation of defense enzymes in host
plant tissues by chitosan can be important to retard the resumption of
quiescent infections which typically become active only when the decline in
tissue resistance occurs (Nandeeshkumar et al., 2008; Reglinski et al.,
2004). The actual mechanisms by which chitosan activates plant genes and
inhibits fungal growth are not known yet. However, it is known that for both
functions the optimal polymerization of glucosamine should involve seven or
more units. The altered positive charges along the length of the polymer, due
to alternating orientation of the glucosamine units, and its affinity for DNA
indicate that chitosan may be partially responsible for structural changes in
plant cell nuclei (Kendra et al., 1989; Kendra and Hadwiger, 1987 & 1984).
The control of anthracnose in dragon fruit plants using submicron
chitosan dispersions and the induction of defense enzymes in plants may
offer a new strategy for disease control. This study has shown that 600 nm
submicron chitosan dispersions elicit maximum enzyme activity. This might
be due to the 600 nm droplets being optimal for penetrating plant tissues and
for effective release of the chitosan.
The efficacy of submicron chitosan dispersions suggests that chitosan
acted as a natural fungicide which delayed the onset of disease on dragon
fruit plants. The actual mechanism of chitosan action is still unknown but the
size of submicron dispersions may permit penetration inside the fungus and
the release of the active ingredient from the emulsifier matrix (Lim et al.,
150
1997). Release of chitosan from submicron dispersion depends on the
viscosity of the solution and the interaction of the active ingredient with the
emulsifier (Desai and Park, 2005).
5.3.5 Effect of chitosan on the growth of plants
In terms of number of shoots per cutting, stem diameter and shoot length,
the growth of the uninoculated plants was significantly (P < 0.05) greater than
the plants inoculated with C. gloeosporioides (Table 5.2; Appendix C 5.18-
5.26).
Treatment with 600 nm droplets with 1.0% chitosan gave the highest
number of shoots per cuttings on each sampling day in uninoculated plants,
which was significantly (P < 0.05) higher than for inoculated plants. The
lowest number of shoot cuttings occurred in control plants after day 90. A
significant difference in the stem diameter of uninoculated plants and plants
inoculated with C. gloeosporioides was observed in the treatment with 600
nm droplets of 1.0% chitosan after day 90.
A similar trend was observed for shoot length, with the uninoculated
plants treated with 600 nm droplets of 1.0% chitosan having longer shoots
than with the 200 nm and 1000 nm droplets treatments. Significantly (P <
0.05) longer shoots were observed in uninoculated plants as compared with
inoculated plants in all the treatments.
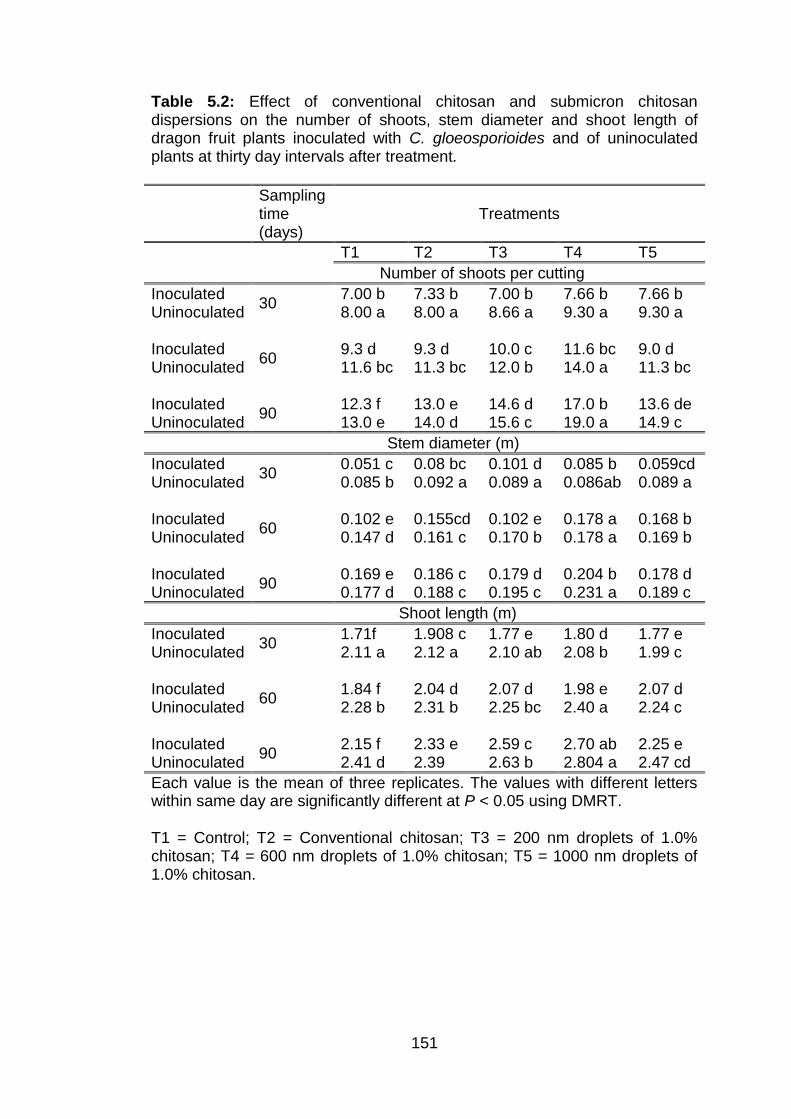
151
Table 5.2: Effect of conventional chitosan and submicron chitosan dispersions on the number of shoots, stem diameter and shoot length of dragon fruit plants inoculated with C. gloeosporioides and of uninoculated plants at thirty day intervals after treatment.
Sampling time (days)
Treatments
T1 T2 T3 T4 T5
Number of shoots per cutting
Inoculated 30
7.00 b 7.33 b 7.00 b 7.66 b 7.66 b Uninoculated 8.00 a 8.00 a 8.66 a 9.30 a 9.30 a Inoculated
60 9.3 d 9.3 d 10.0 c 11.6 bc 9.0 d
Uninoculated 11.6 bc 11.3 bc 12.0 b 14.0 a 11.3 bc Inoculated
90 12.3 f 13.0 e 14.6 d 17.0 b 13.6 de
Uninoculated 13.0 e 14.0 d 15.6 c 19.0 a 14.9 c
Stem diameter (m)
Inoculated 30
0.051 c 0.08 bc 0.101 d 0.085 b 0.059cd Uninoculated 0.085 b 0.092 a 0.089 a 0.086ab 0.089 a Inoculated
60 0.102 e 0.155cd 0.102 e 0.178 a 0.168 b
Uninoculated 0.147 d 0.161 c 0.170 b 0.178 a 0.169 b Inoculated
90 0.169 e 0.186 c 0.179 d 0.204 b 0.178 d
Uninoculated 0.177 d 0.188 c 0.195 c 0.231 a 0.189 c
Shoot length (m)
Inoculated 30
1.71f 1.908 c 1.77 e 1.80 d 1.77 e Uninoculated 2.11 a 2.12 a 2.10 ab 2.08 b 1.99 c Inoculated
60 1.84 f 2.04 d 2.07 d 1.98 e 2.07 d
Uninoculated 2.28 b 2.31 b 2.25 bc 2.40 a 2.24 c Inoculated
90 2.15 f 2.33 e 2.59 c 2.70 ab 2.25 e
Uninoculated 2.41 d 2.39 2.63 b 2.804 a 2.47 cd
Each value is the mean of three replicates. The values with different letters within same day are significantly different at P < 0.05 using DMRT. T1 = Control; T2 = Conventional chitosan; T3 = 200 nm droplets of 1.0% chitosan; T4 = 600 nm droplets of 1.0% chitosan; T5 = 1000 nm droplets of 1.0% chitosan.

152
The superior vegetative growth in the plants treated with submicron
chitosan dispersions as compared to control plants may have occurred
because of the lower disease incidence (Section 4.5.4). These positive
effects of chitosan on plant growth were probably due to the fact that
chitosan provides molecular signals that serve as plant growth promoters and
induce disease resistance (Chookhongkha et al., 2012). Chitosan has been
reported to increase growth of various crops, such as sweet pepper
(Ghoname et al., 2010), sweet basil (Kim, 2005), soybean sprouts (Lee et al.,
2005), strawberry (Abdel-Mawgoud et al., 2010) and cabbage (Hirano, 1988).
For some crops, such as bitter cucumber, chilli, celery and Chinese cabbage,
the response varies with the frequency of application and concentration of
chitosan (Chandrkrachang et al., 2003 and Boonlertnirun et al., 2005).
The improved vegetative growth of plants treated with submicron
dispersions was probably related to the fact that poly D-glucosamine chitosan
enhances carbon sources by stimulating the growth of beneficial microbes in
soil. The highly acidic nature of chitosan may break down mineral elements
in the soil that are unavailable to plants and may enhance the uptake of
nutrients, such as nitrogen, potassium and phosphorus, which results in
higher plant growth (Farouk et al., 2011). Results from the Fourier transform
infrared spectroscopy (FTIR) showed that phosphorus, sulphur and silicon
traces are also present in chitosan, which effectively play important roles in
the vegetative growth of plants (Chookhongkha et al., 2012). Another reason
for the increased plant growth due to chitosan application is the free amino
group in the chitosan chain which provides extra nitrogen to plants (Chibu
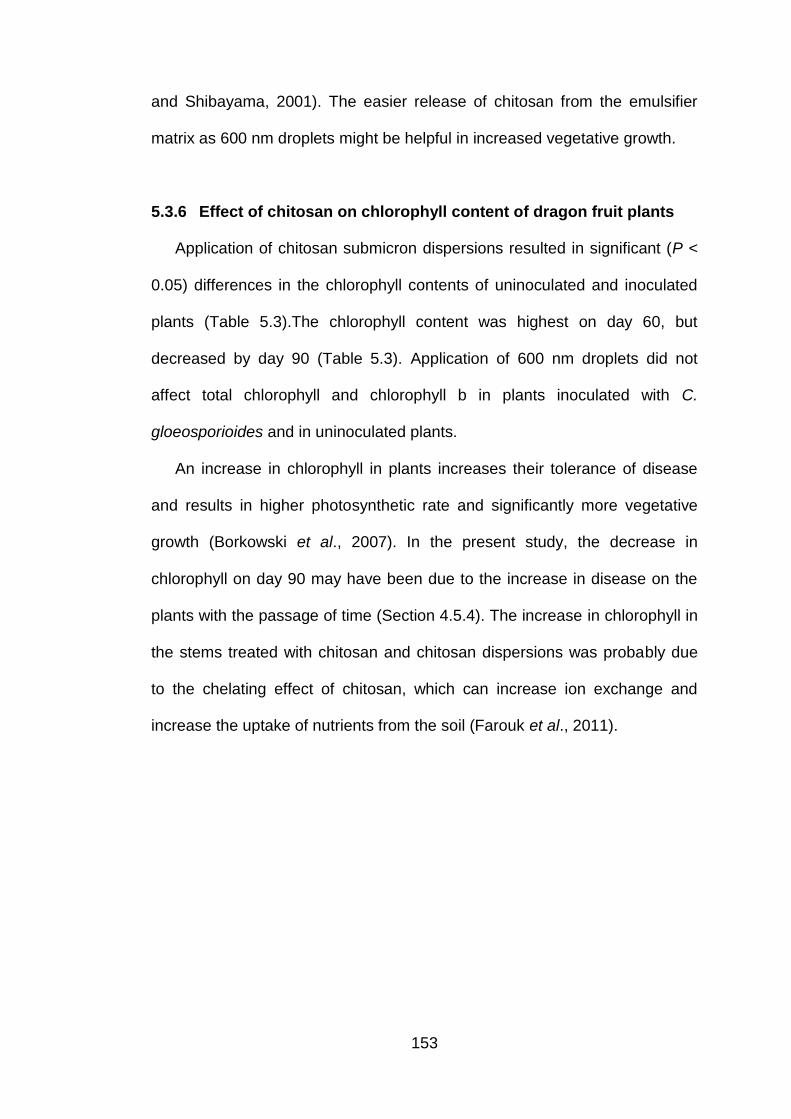
153
and Shibayama, 2001). The easier release of chitosan from the emulsifier
matrix as 600 nm droplets might be helpful in increased vegetative growth.
5.3.6 Effect of chitosan on chlorophyll content of dragon fruit plants
Application of chitosan submicron dispersions resulted in significant (P <
0.05) differences in the chlorophyll contents of uninoculated and inoculated
plants (Table 5.3).The chlorophyll content was highest on day 60, but
decreased by day 90 (Table 5.3). Application of 600 nm droplets did not
affect total chlorophyll and chlorophyll b in plants inoculated with C.
gloeosporioides and in uninoculated plants.
An increase in chlorophyll in plants increases their tolerance of disease
and results in higher photosynthetic rate and significantly more vegetative
growth (Borkowski et al., 2007). In the present study, the decrease in
chlorophyll on day 90 may have been due to the increase in disease on the
plants with the passage of time (Section 4.5.4). The increase in chlorophyll in
the stems treated with chitosan and chitosan dispersions was probably due
to the chelating effect of chitosan, which can increase ion exchange and
increase the uptake of nutrients from the soil (Farouk et al., 2011).
154
Table 5.3: Effect of conventional chitosan and submicron chitosan dispersions on chlorophyll a, chlorophyll b and total chlorophyll in dragon fruit plants inoculated with C. gloeosporioides and uninoculated plants at 30 day intervals after treatment.
Sampling time (days)
Treatments
T1 T2 T3 T4 T5
Chlorophyll a (g ml-1)
Inoculated 30
3.76 c 5.12 b 5.67 b 6.09 ab 5.76 c Uninoculated 3.97 c 5.40 b 5.70 b 6.64 a 5.97 ab Inoculated
60 4.76 g 5.70 f 7.99 d 9.91 b 7.65 de
Uninoculated 5.21 f 7.28 e 8.30 c 10.81 a 7.72 d Inoculated
90 4.49 i 5.34 g 7.14 c 7.60 b 6.43 e
Uninoculated 4.91 h 5.62 f 6.95 c 7.92 a 6.75 d
Chlorophyll b (g ml-1)
Inoculated 30
1.81 d 3.03 c 3.22 b 3.24 b 3.96 a Uninoculated 1.16 e 1.84 d 3.22 b 3.21 b 3.93 a Inoculated
60 2.21 f 4.27 d 5.30 b 6.65 a 4.86 c
Uninoculated 2.83 e 4.03 d 5.43 b 6.69 a 4.86 c Inoculated
90 1.67 h 2.49 f 4.86 b 5.46 a 3.42 e
Uninoculated 2.13 g 2.13 g 4.49 c 5.59 a 3.61 d
Total Chlorophyll (g ml-1)
Inoculated 30
5.58 d 8.15 bc 8.90 b 9.33 ab 9.72 a Uninoculated 5.14 d 7.72 c 8.94 b 9.97 a 9.90 a Inoculated
60 6.71 e 8.76 d 13.39 b 16.5 a 12.5 bc
Uninoculated 8.45 d 11.3 c 13.73 b 17.5 a 12.5 bc Inoculated
90 6.44 g 7.89 e 12.0 b 13.0 a 9.85 d
Uninoculated 7.05 f 7.75 e 11.3 c 13.5 a 10.3 d
Each value is the mean of three replicates. The values with different letters within same day for each parameter tested are significantly different at P < 0.05 using DMRT. T1 = Control; T2 = Conventional chitosan; T3 = 200 nm droplets of 1.0% chitosan; T4 = 600 nm droplets of 1.0% chitosan; T5 = 1000 nm droplets of 1.0% chitosan.
155
The increase in photosynthetic pigments with the use of chitosan has
been reported by El-Tantawy (2009), Khan et al. (2002) and Chibu and
Shibayama (2001). The 600nm droplets showed more accumulation of
photosynthetic pigments probably because of the better penetration of
chitosan droplets inside the plants (see Fig 5.4d), or the amount of chitosan
inside this droplet was enough to induce biochemical reactions inside the
plants. These results are in line with Chibu and Shibayama (2001) who
showed that 0.5% chitosan was beneficial for upland rice and soya bean
while a lower concentration (0.1%) was helpful for the growth of lettuce and
cherry tomatoes.
In conclusion, 600 nm droplets of 1.0% chitosan gave the best results in
all the parameters tested. This formulation and amount of chitosan was
sufficient to combat microbial organisms, resulting in reduction in disease
and vigorous growth of the plants.
156
CHAPTER 6
EFFECT OF SUBMICRON CHITOSAN DISPERSIONS ON POSTHARVEST ANTHRACNOSE OF DRAGON FRUIT DURING STORAGE
6.1 Introduction
Pathogens, transpiration and senescence are the main causes of loss in
quality of fresh vegetables and fruit during postharvest storage (Valero and
Serrano, 2010; Mulas and Schirra, 2007). Among these factors, the
postharvest losses due to microbiological diseases are the most important
because they pose higher economic losses (Adaskaveg and Förster, 2010;
Tripathi and Dubey, 2004; Kader, 2002). It is difficult to estimate the total
amount of postharvest losses due to diseases, however, conservative
estimates place U.S. losses to fruits and vegetables from spoilage are
around 24% of the harvested crop (Goletti, 2003). In less developed
countries, postharvest losses are even greater because of the lack of
adequate refrigeration and poor sanitation. Worldwide, postharvest losses
have been estimated to be 50% of the harvested crop and much of this due
to rots caused by microorganisms (Goletti, 2003).
Dragon fruit is a non-climacteric fruit that is highly prone to diseases
causing enormous postharvest losses during transportation and storage
(Masyahit et al., 2009). About 50% of postharvest losses are due to
anthracnose caused by C. gloeosporioides (Awang et al., 2011).
Control methods, such as chemical control, biological control, physical
methods (ultraviolet illumination, radiofrequency treatment, heat treatments)
and storage technologies, have been devised that are capable of reducing
the growth of pathogens and ultimately inhibiting, or at least lessening, losses
157
(Adaskaveg and Forster, 2010; Smilanick et al., 2008; Fallik and Lurie, 2007;
Mulas and Schirra, 2007; Narayanasamy, 2006; Fallik, 2004; Barkai-Golan,
2001; Schirra et al., 2000). Despite the benefits of these methods, the
complete control of decay is rarely accomplished and, most importantly, they
are costly to run on a commercial scale (Tripathi and Dubey, 2004).
However, chemical control has been found to be effective which can ensure
product protection (Schirra et al., 2011; Fallik and Lurie, 2007). It is allowed
only on a small scale and, in addition, public opinion demands a reduction in
the use of chemical products (Adaskaveg and Forster, 2010). The
appearance of pathogens resistant to fungicides has contributed to greater
attention to developing substitutes for chemicals controlling the
microorganisms responsible for postharvest losses (Tripathi and Dubey,
2004; Janisiewicz and Korsten, 2002; Barkai-Golan, 2001). Therefore, there
is an immediate need for effective and new means of controlling postharvest
diseases that pose less risk to human health and the environment.
During this study a novel technique of using submicron dispersions of
chitosan as an edible coating was used to control postharvest anthracnose of
dragon fruit. The main objective of this part of the study was to test the in
vitro and in vivo efficacy of conventional chitosan in comparison with the
submicron chitosan dispersions to control C. gloeosporioides during storage
of dragon fruit.
158
6.2 Materials and methods
6.2.1 In vitro antifungal assay of conventional chitosan and submicron
chitosan dispersions
Four concentrations (0.5, 1.0, 1.5 and 2.0%) of chitosan were used to
prepare different droplet sizes of submicron dispersions (200, 400, 600, 800
and 1000 nm) as described in Sections 3.2.4 and 3.3, respectively.
6.2.1.1 Inhibition of mycelial growth and conidial germination
The antifungal assay of conventional chitosan and submicron chitosan
dispersions was done using the food poison technique as described in
Sections 3.2.5.1 and 3.2.5.2, respectively.
6.2.1.2 Scanning electron microscopy
Alterations in conidial and mycelial morphology of C. gloeosporioides
were detected using a scanning electron microscope (FEI Quonta 400 FE-
SEM). Samples (1.5 mm3) of C. gloeosporioides from 10 days old control
cultures and cultures grown on media containing submicron chitosan
dispersions were mounted on aluminium stubs and viewed immediately using
a scanning electron microscope.
159
6.2.2 In vivo antifungal assay of conventional chitosan and submicron
chitosan dispersions
Healthy, mature, uniform sized fruit without any detectible signs of
infection were selected to evaluate the antifungal effects of conventional
chitosan and submicron chitosan dispersions. The fruit were rinsed with
purified water followed by air-drying at room temperature for two hours. They
were then dipped in a spore suspension (1 x 10⁵ spores ml-1), followed by
complete surface drying at ambient temperature. After drying, they were
dipped in conventional chitosan or submicron chitosan dispersions and dried
again at room temperature for five hours. Then they were packed in
cardboard boxes and stored at 10 ± 2 °C, 80 ± 5% RH for 28 days.
6.2.2.1 Disease incidence
Disease incidence (DI) based on the anthracnose symptoms on the fruit
surface was recorded weekly for 28 days during cold storage. The data was
expressed as a percentage (Sivakumar et al., 2002).
(%) N b
T b
6.2.2.2 Disease severity
Disease severity (DS) was scored at intervals of 7 days using the scale 1
= 0% of fruit surface rotten, 2 = 1-25% rotten, 3 = 26-50% rotten, 4 = 51-75%
rotten and 5 = 76-100% rotten (Sivakumar et al., 2002).
160
The experiments were arranged in a completely randomized design with
four replicates, each consisting of twenty units. DI and DS data were
transformed using arcsine and square root transformation, respectively.
Presentation of data was done after back transformation. Normality of
residues was checked with UNIVARIATE procedure in SAS. The data was
subjected to analysis of variance and tested for significant differences among
treatments by the ’ p g ( M T) at P < 0.05
(Appendix C 6.1 – C 6.4) using Statistical analysis system SAS® version 9.1.
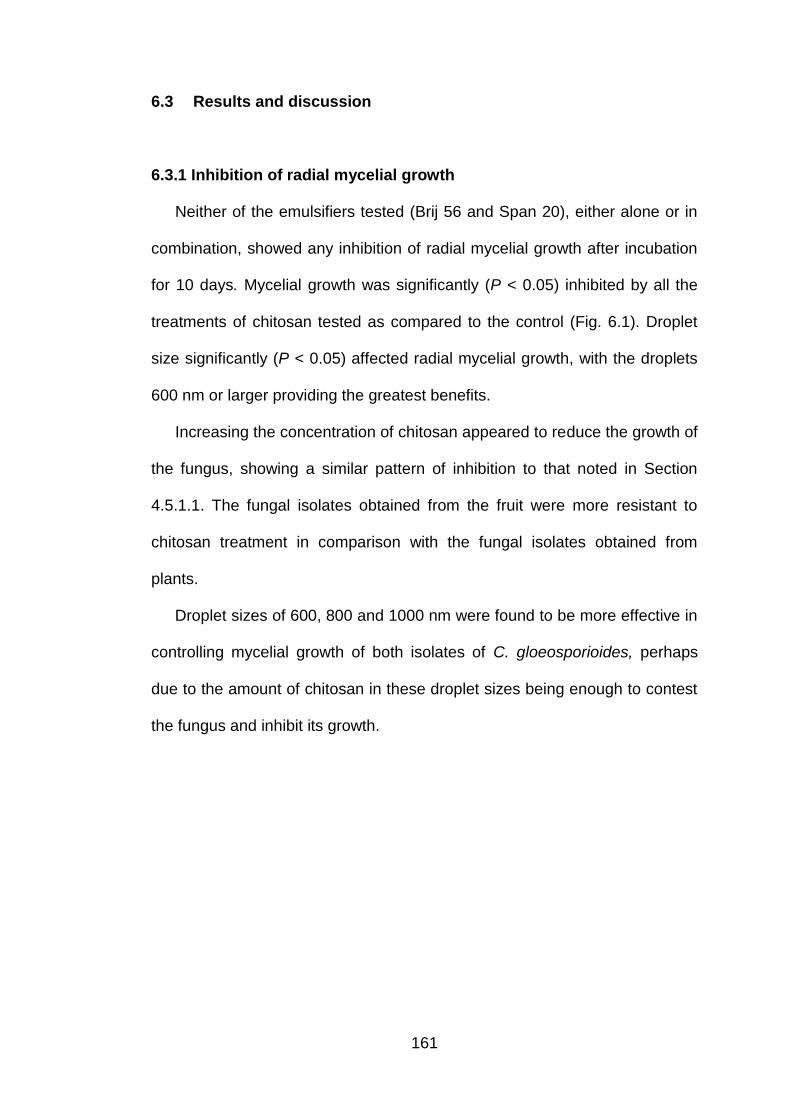
161
6.3 Results and discussion
6.3.1 Inhibition of radial mycelial growth
Neither of the emulsifiers tested (Brij 56 and Span 20), either alone or in
combination, showed any inhibition of radial mycelial growth after incubation
for 10 days. Mycelial growth was significantly (P < 0.05) inhibited by all the
treatments of chitosan tested as compared to the control (Fig. 6.1). Droplet
size significantly (P < 0.05) affected radial mycelial growth, with the droplets
600 nm or larger providing the greatest benefits.
Increasing the concentration of chitosan appeared to reduce the growth of
the fungus, showing a similar pattern of inhibition to that noted in Section
4.5.1.1. The fungal isolates obtained from the fruit were more resistant to
chitosan treatment in comparison with the fungal isolates obtained from
plants.
Droplet sizes of 600, 800 and 1000 nm were found to be more effective in
controlling mycelial growth of both isolates of C. gloeosporioides, perhaps
due to the amount of chitosan in these droplet sizes being enough to contest
the fungus and inhibit its growth.
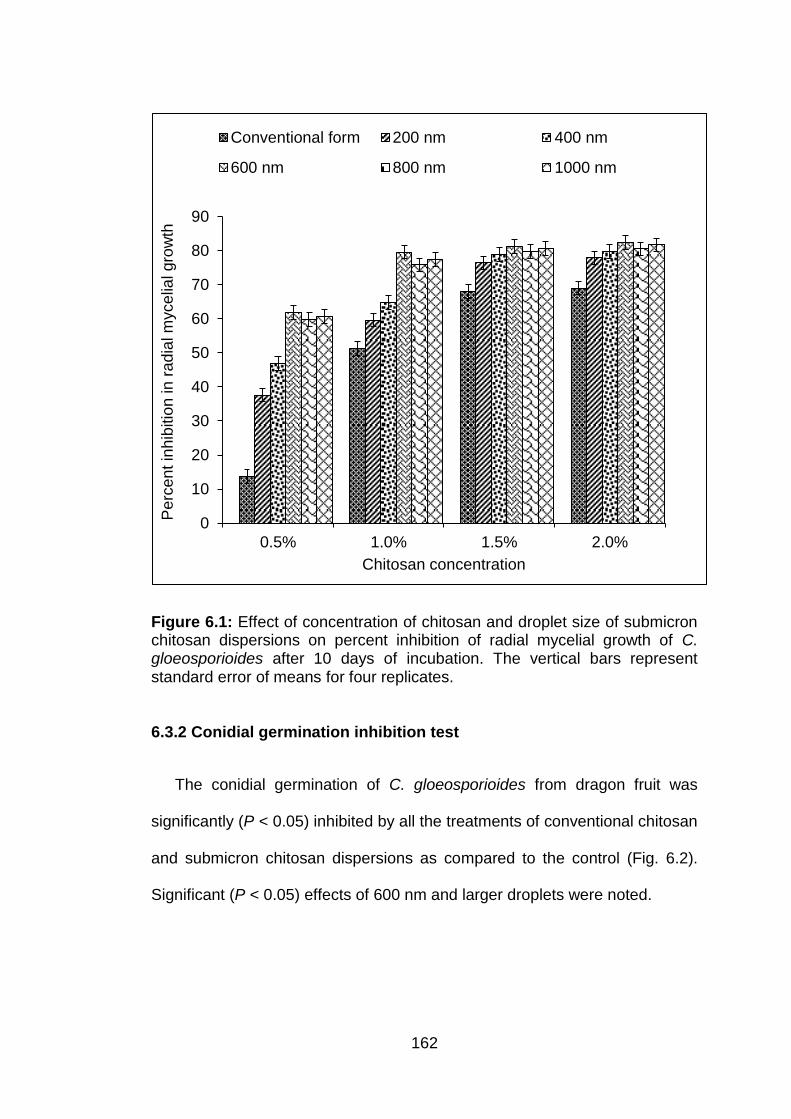
162
Figure 6.1: Effect of concentration of chitosan and droplet size of submicron chitosan dispersions on percent inhibition of radial mycelial growth of C. gloeosporioides after 10 days of incubation. The vertical bars represent standard error of means for four replicates.
6.3.2 Conidial germination inhibition test
The conidial germination of C. gloeosporioides from dragon fruit was
significantly (P < 0.05) inhibited by all the treatments of conventional chitosan
and submicron chitosan dispersions as compared to the control (Fig. 6.2).
Significant (P < 0.05) effects of 600 nm and larger droplets were noted.
0
10
20
30
40
50
60
70
80
90
0.5% 1.0% 1.5% 2.0%
Pe
rcen
t in
hib
itio
n in r
ad
ial m
yce
lial gro
wth
Chitosan concentration
Conventional form 200 nm 400 nm
600 nm 800 nm 1000 nm
163
Figure 6.2: Effect of chitosan concentration and droplet size of submicron chitosan dispersions on conidial germination inhibition (%) of C. gloeosporioides after 7 hours of incubation. The vertical bars represent standard error of means for four replicates.
These results suggest that chitosan helps to inhibit conidial germination of
C. gloeosporioides. Reglinski et al. (2010) reported a reduction in growth of
B. cinerea and a change in morphology of conidia after treatment with
chitosan. These results support the inhibition of the germination of conidia
reported in Figure 4.5a. Conidial inhibition was greater for fungal isolates
from plants than for those from fruit. The differences in the in vitro growth of
fungal isolates may have been due to temperature effects. High temperature
in the field has been shown to cause lysis of fungal spores of Colletotrichum
species on strawberry (Leandro et al., 2003).
0
10
20
30
40
50
60
70
80
90
100
0.5% 1.0% 1.5% 2.0%
Con
idia
l ge
rmin
atio
n inh
ibitio
n (
%)
Chitosan concentration
Conventional form 200 nm 400 nm
600 nm 800 nm 1000 nm
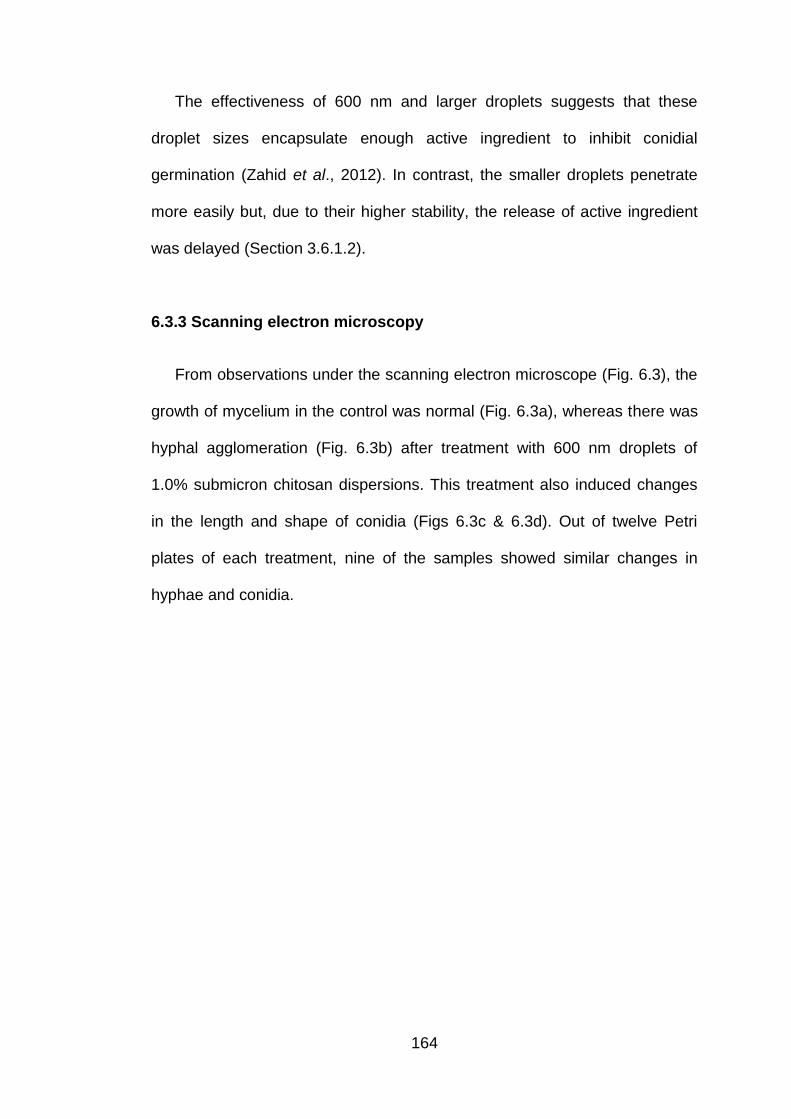
164
The effectiveness of 600 nm and larger droplets suggests that these
droplet sizes encapsulate enough active ingredient to inhibit conidial
germination (Zahid et al., 2012). In contrast, the smaller droplets penetrate
more easily but, due to their higher stability, the release of active ingredient
was delayed (Section 3.6.1.2).
6.3.3 Scanning electron microscopy
From observations under the scanning electron microscope (Fig. 6.3), the
growth of mycelium in the control was normal (Fig. 6.3a), whereas there was
hyphal agglomeration (Fig. 6.3b) after treatment with 600 nm droplets of
1.0% submicron chitosan dispersions. This treatment also induced changes
in the length and shape of conidia (Figs 6.3c & 6.3d). Out of twelve Petri
plates of each treatment, nine of the samples showed similar changes in
hyphae and conidia.
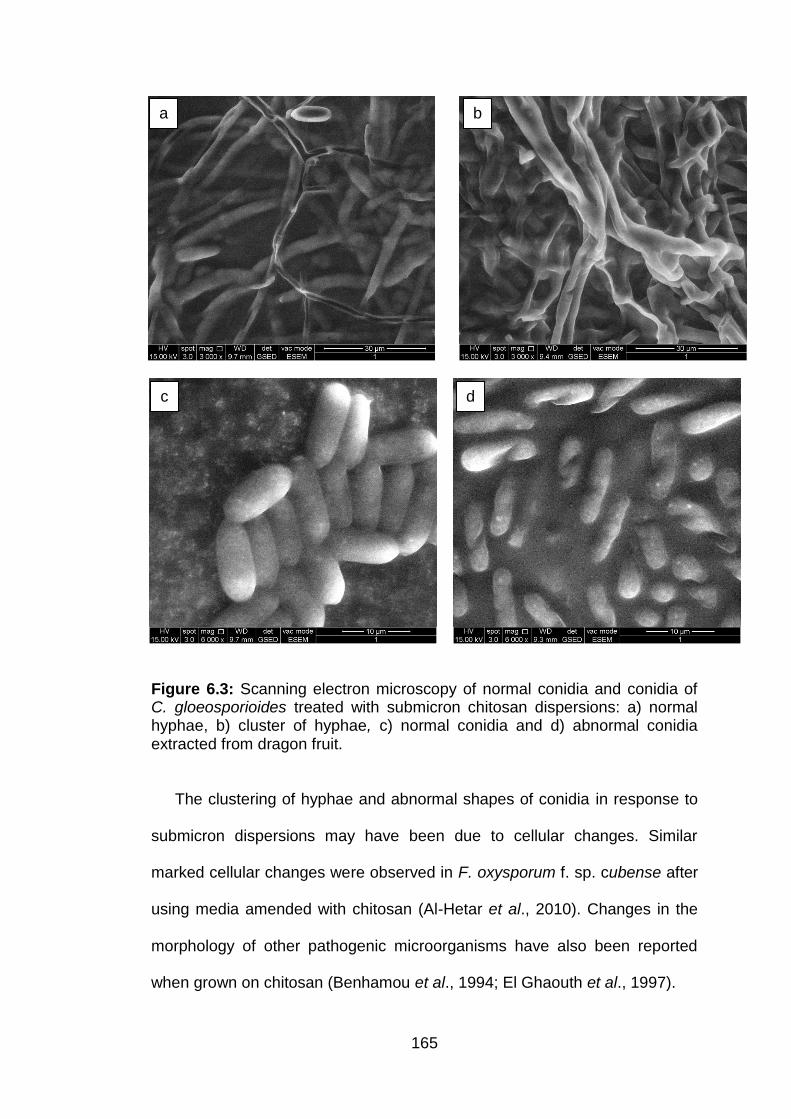
165
Figure 6.3: Scanning electron microscopy of normal conidia and conidia of C. gloeosporioides treated with submicron chitosan dispersions: a) normal hyphae, b) cluster of hyphae, c) normal conidia and d) abnormal conidia extracted from dragon fruit.
The clustering of hyphae and abnormal shapes of conidia in response to
submicron dispersions may have been due to cellular changes. Similar
marked cellular changes were observed in F. oxysporum f. sp. cubense after
using media amended with chitosan (Al-Hetar et al., 2010). Changes in the
morphology of other pathogenic microorganisms have also been reported
when grown on chitosan (Benhamou et al., 1994; El Ghaouth et al., 1997).
d.
c.
a.
b
166
Several mechanisms have been proposed for the antifungal action of
chitosan. Its activity appears to be an interaction between an ammonium
group that provides the positive charge to chitosan and phospholipid head
groups of the fungus, which then confers negative charge to the fungus cell
wall residues and leads to increase in plasma membrane permeability (Leuba
and Sotossel, 1986; Kauss et al. 1989).
The inhibition might be due to direct interaction with chitosan, which enters
the cell wall of the fungus and interacts with DNA, to alter its configuration,
thus blocking the production of mRNA and proteins (Hadwiger and Loschke,
1981). In the present study, conidial germination inhibition and agglomeration
of hyphae supported the concept of toxicity of chitosan towards fungi. The
results may be corroborated by Al-Hetar et al. (2010) who found that the
chelating activity of chitosan inhibited the growth of Fusarium oxysporum f.
sp. cubense in liquid cultures.
6.3.4 In vivo antifungal effects of conventional chitosan and submicron
chitosan dispersions
During the 28 days of storage, disease incidence (DI) was significantly
reduced (P < 0.05) by all of the chitosan treatments compared with the
control (Table 6.1). In control fruit, DI reached 99.9%. The submicron
chitosan dispersions were consistently more effective than conventional
chitosan at reducing DI and 600 nm droplets of 1% chitosan was the best
treatment.
Differences in disease severity (DS) among all treatments were significant
(P < 0.05) after 28 days of storage (Table 6.1). DS score for control fruit
167
reached the maximum value of 5 and all of the chitosan treatments resulted
in reduced DS. DS increased with time in storage and for conventional
chitosan the highest reduction (68.0%) occurred with the 2.0% treatment.
With submicron chitosan dispersions, the highest reduction (75.4%) was with
600 nm droplets of 1.0% chitosan (Table 6.1).
These results suggest that chitosan was effective for disease control and
also demonstrate the fungistatic activity of chitosan. They are in agreement
with the findings of Ali et al. (2010) who reported that, with an increase in
chitosan concentration, there is a reduction in anthracnose on Ekotica II
papaya. In a previous study on carrots, chitosan showed higher antifungal
effects in comparision with synthetic fungicides for the control of Sclerotinia
sclerotiorum (Cheah and Page, 1997).
Although all the submicron chitosan dispersions showed better results
than the conventional chitosan treatments, chitosan at 1.0% with 600 nm
droplets showed the best reduction in DI and DS. The effectiveness of the
600 nm droplets is attributed to the appropriate size required for penetrating
inside the fungus and to faster release of the active compound delaying the
onset of disease (Zahid et al., 2013).
The results of the present study showed that the 1.0% submicron
chitosan dispersion with 600 nm droplets was the most promising for
controlling postharvest anthracnose of dragon fruit caused by C.
gloeosporioides. However, further studies are required to elucidate the
mechanism behind the antimicrobial activity of submicron dispersions.
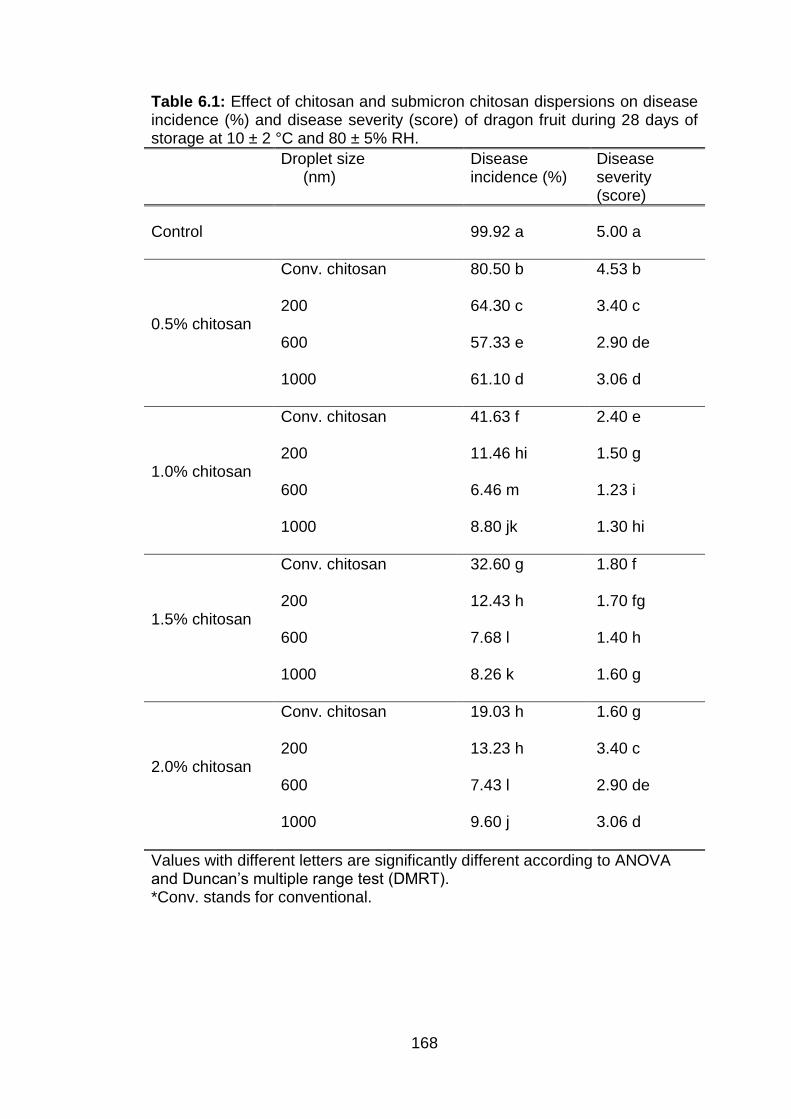
168
Table 6.1: Effect of chitosan and submicron chitosan dispersions on disease incidence (%) and disease severity (score) of dragon fruit during 28 days of storage at 10 ± 2 °C and 80 ± 5% RH.
Droplet size (nm)
Disease incidence (%)
Disease severity (score)
Control 99.92 a 5.00 a
0.5% chitosan
Conv. chitosan 80.50 b 4.53 b
200 64.30 c 3.40 c
600 57.33 e 2.90 de
1000 61.10 d 3.06 d
1.0% chitosan
Conv. chitosan 41.63 f 2.40 e
200 11.46 hi 1.50 g
600 6.46 m 1.23 i
1000 8.80 jk 1.30 hi
1.5% chitosan
Conv. chitosan 32.60 g 1.80 f
200 12.43 h 1.70 fg
600 7.68 l 1.40 h
1000 8.26 k 1.60 g
2.0% chitosan
Conv. chitosan 19.03 h 1.60 g
200 13.23 h 3.40 c
600 7.43 l 2.90 de
1000 9.60 j 3.06 d
Values with different letters are significantly different according to ANOVA ’ p g ( M T). *Conv. stands for conventional.
169
CHAPTER 7
EFFECT OF SUBMICRON CHITOSAN DISPERSIONS ON PHYSICO-CHEMICAL CHARACTERISTICS AND ANTIOXIDANT PROPERTIES OF
DRAGON FRUIT DURING STORAGE
7.1 Introduction
Fresh vegetables and fruit are alive after harvesting and also continue
most biochemical and physiological processes during storage. The
physiological activity is mainly noticed as softening changes that occur during
fruit ripening (Valero and Serrano, 2010). Respiration and transpiration are
the most important processes causing postharvest losses in the quantity and
quality of fresh vegetables and fruit. Thus, in order to delay the ripening
process and senescence, the respiratory and metabolic activities of fruit must
be restrained after harvesting (Kays, 1991).
There have been many storage techniques developed to minimise the
rates of respiration and transpiration, including low temperature, controlled
atmosphere and hypobaric storage, but most of them have their own
limitation of use (Zhang et al., 2010; Artés-Hernández et al., 2007).
Dragon fruit being a non-climacteric fruit has no peak of ethylene or
carbon dioxide production (Le Bellec et al., 2006). At ambient temperature,
the fruit stays fresh for a few days after which its physical appearance
deteriorates and disease infestation sets in resulting in spoilage within 6 to 7
days. Lau et al. (2008) reported that fruits remained fresh and disease-free
for 6 days when stored at 10°C with 90% relative humidity, but started
deteriorating and rotting after the 15th day. Therefore, there is a need for new
170
and effective means to control the metabolic activities of fruit resulting in
reduction of fruit decay.
Thus, during this study the novel technique of using edible coatings
obtained from natural products such as chitosan has been adopted to
maintain quality and extend storage life of dragon fruit. As described
previously, submicron chitosan dispersions help reduce infection of the fruit
(Chapter 6). It is now necessary to determine whether it alters the physiology
of disease free fruit. Therefore the main objectives of the present study were:
1. To evaluate the effect of conventional chitosan and submicron
chitosan dispersions on quality attributes of dragon fruit, such as
weight loss, soluble solids concentration and titratable acidity
during storage.
2. To observe the effect of submicron chitosan dispersions on
preservation of antioxidants in coated and uncoated dragon fruit
during storage.
171
7.2 Materials and methods
7.2.1 Fruit samples
Mature dragon fruit (purplish pink colour) grown in a commercial orchard
located at Puchong, Selangor, State of Malaysia were harvested and
transported to the laboratory within two hours.
7.2.2 Coating solutions
Chitosan and submicron chitosan dispersions were prepared as
described in Sections 3.2.4 and 3.3, respectively.
Treatments for the fruit consisted of untreated control, 1.0% conventional
chitosan, 200 nm, 600 nm and 1000 nm submicron chitosan dispersions of
1.0% chitosan, and the experiment was laid out in a completely randomized
design (CRD). These treatments were selected on the basis of the results
obtained from in vivo antifungal effects of submicron dispersions (Section
6.3.4). The treatments were replicated four times with twenty fruit per
replication. Data collected were subjected to analysis of variance (ANOVA)
using statistical analysis system SAS® v 9. . ’ p g
test (DMRT) was carried out for mean separation and statistical significance
was assessed at P < 0.05. All the experiments were repeated twice and the
data were pooled before analysis.
172
7.2.3 Physicochemical quality changes in fruit coated with
conventional chitosan and submicron chitosan dispersions
7.2.3.1 Sample preparation
Mature, healthy and uniform fruit were rinsed with purified water and then
dipped in solutions of conventional chitosan or submicron chitosan
dispersions for 2-3 minutes in order to apply the solution uniformly over the
whole fruit surface. The fruit in the control treatment were only dipped in
purified water. After dipping, the fruit were allowed to dry at ambient
temperature and then were packed in cardboard boxes and stored at 10 ± 2
°C, 80 ± 5% RH for 28 days. The data were recorded before treatment (Day
0) and at seven day intervals for 28 days.
7.2.3.2 Determination of physical quality
Weight loss was determined by weighing 20 fruit from each treatment
using a digital balance (model GF-6100, A&D Co. Ltd., Japan). The same
fruit were used for determining weight loss from day 0 at intervals of 7 days
until the end of the experiment. The difference between initial and final weight
was considered as the total weight loss during the storage interval and was
expressed as percentage weight loss using the standard AOAC (1984)
method by the equation:
% gh 2
where W1 = Initial weight of the fruit (day 0); W2 = Weight of fruit after 7 days
of storage
173
Fruit firmness was determined on 4 fruit in each treatment with an Instron
texture analyser (Instron 2519-104, Norwood, MA) having an 8 mm plunger
tip. Firmness was evaluated by subjecting fruit to a puncture test at a
constant speed of 20 mm min-1. The maximum amount of force required to
penetrate the fruit was recorded on each fruit at three random positions and
the average of these results on fruit firmness was expressed in Newtons (N).
After performing the firmness assay, the same fruit were used for
determination of chemical quality and antioxidant activity.
7.2.3.3 Determination of chemical quality
Soluble solids concentration (SSC) of dragon fruit pulp was determined
using a Palette Digital Refractometer (Model: PR-32α, A g C , L . J p ).
Fruit pulp (10 g) was sampled from a mixture of 4 fruit in each treatment
homogenized in a kitchen blender with 40 ml of purified water. The mixture
was centrifuged at 5000 × g for 5 min and then filtered through cotton wool. A
drop of the filtrate was placed on the prism glass of the refractometer to
obtain the % SSC reading. The refractometer was calibrated with purified
water to give a 0% reading before analysis. The readings were multiplied by
the dilution factor to obtain the SSC of the dragon fruit pulp.
Titratable acidity was measured using the remaining filtrate of SSC. A 5 ml
aliquot of filtrate was titrated with 0.1 N NaOH until the pH reached 8.1.
Titration was not done until the colour changed to pink as the sample was
already pink and pH 8.1 of the sample acted as an indicator to determine the
total acidity (Yusoff, 2006).
174
The titratable acidity was measured using the following equation:
T b N H
gh p . N
7.2.3.4 Determination of antioxidants
The total phenolic content was estimated using the Folin Ciocalteau (FC)
spectrophotometric method, established by Ramamoorthy and Bono (2007).
Fruit pulp (50 g) was homogenized in a kitchen blender and squeezed
through a muslin cloth to obtain fruit juice. Fruit juice (0.1 ml) was mixed with
1.5 ml of 7% sodium carbonate and 0.5 ml of FC. Volume of the mixture was
adjusted to 10 ml by adding purified water. The mixture was incubated at 40
°C for 2 hours. The absorbance was recorded at 750 nm using a UV-Vis
Spectrophotometer (Varioskan Flash Multimode Reader, Thermo Fisher
Scientific, USA). The results were stated in mg gallic acid equivalent per 100
g of fresh weight of fruit, using values calculated from the standard curve in
Section 5.2.3.
The spectrophotometric method developed by Froehlicher et al. (2009)
was adopted to measure the total flavonoids in dragon fruit. Samples (0.5
mg) of ground fruit pulp were mixed with 1.5 ml of methanolic AlCl3.6H2O in
sealed tubes and kept in the dark for 15 min. The absorbance was measured
at 430 nm using a UV-Vis Spectrophotometer (Varioskan Flash Multimode
Reader, Thermo Fisher Scientific, USA). A standard curve was prepared
using quercetin stock solution (Appendix B 7.1) and the results were
expressed as µg of quercetin equivalent to one g fresh weight of fruit sample.
175
Lycopene extraction was done by the method developed by Fish et al.
(2002). Briefly, 0.6 ml of fruit juice (from juice extracted for total phenolics)
was mixed with 10 ml of hexane, 5 ml of 0.05% butylated hydroxytoluene in
acetone and 5 ml of 95% ethanol. The reaction mixture was agitated at 180
rpm for 15 min on ice. Then, 3 ml of ice cold water was added and it was
shaken again for 5 minutes. The absorbance was recorded at 503 nm using
a UV-Vis Spectrophotometer (Varioskan Flash Multimode Reader, Thermo
Fisher Scientific, USA). The amount of lycopene was calculated using the
formula of Javanmardi et al. (2006).
L p (x ⁄ ) A5 3 3. 2
Where,
x= amount of hexane
y= weight of fruit
The results were expressed in µg g-1 fresh weight of fruit sample.
The total antioxidants activity was measured by ferric reducing antioxidant
power (FRAP) assay using the juice extracted for total phenolics. The FRAP
reagent contained 2.5 ml of 10 mM 2,4,6-tripyridyl-s-triazine (TPTZ) in 40 mM
HCL, 2.5 ml of 20 mM FeCl3 and 25 ml of 0.03 mM acetate buffer pH 3.6. The
reaction mixture consisted of 40 µl of fruit extract mixed with 3 ml of FRAP
reagent and was incubated at 37°C for 4 min. Absorbance was recorded at
593 nm and the reducing power was estimated using the standard curve for
ferrous sulphate (FeSO4) (Appendix B 7.2). The results were expressed as
the concentration of antioxidants having a ferric reducing activity equivalent
to 1 mg FeSO4 g-1 fresh weight of fruit sample (Ahmed and Baig, 2009).
176
7.2.4 Gaseous exchange analysis
7.2.4.1 Determination of respiration rate
The rates of respiration and ethylene evolution were measured using the
methods described by Ali (2006), with slight modification. Briefly, respiration
was measured by placing one dragon fruit in a 1 litre plastic container for 1 h
and a gas tight hypodermic syringe was used to withdraw 1 ml of gas sample
from the headspace and analysed with a gas chromatograph (GC) (Claru-
500, Perkin Elmer, USA) equipped with a stainless steel column (Porapak R
80/100). Helium at a flow rate of 20 ml min-1 served as the carrier gas. The
oven, injector and thermal conductivity detector (TCD) were set at 60, 100
and 200°C, respectively. Calibration was done using one ml of 1.0% CO2 gas
(Scotty Gases, Beltifonte, PA USA) as standard. The amount of CO2
production was expressed in ml kg-1 h-1.
7.2.4.2 Determination of ethylene evolution
Ethylene evolution was measured by taking a 1 ml gas sample from each
jar using a hypodermic syringe and injecting it into a GC fitted with a stainless
steel column (Porapak T, 100/120) and a flame ionisation detector (FID).
Nitrogen, hydrogen and air flow rates were 20 ml min-1. The nitrogen served
as a carrier gas. Oven, injector and FID were set at 150, 200 and 200°C,
p v . h g ( μ -1) (Scotty Gases, Beltifonte, PA
USA) was injected for calibration, and served as an external standard gas.
The amount of ethylene was expressed in µl kg-1 h-1.
177
The experiment was conducted using a completely randomized design
(CRD) with four replicates in each treatment. Each replicate consisted of
twenty fruit. The data were subjected to analysis of variance (ANOVA) using
SAS® software, while least DMRT was used to compare differences among
treatments at 95% confidence level for each variable. The whole experiment
was repeated twice, and data were pooled before analysis.
178
7.3 Results and discussion
7.3.1 Physical quality of fruit treated with conventional chitosan and
submicron chitosan dispersions
7.3.1.1 Weight loss
There were significant differences (P < 0.05) in weight loss among the
treatments during the 28 days of storage compared to the control (Fig. 7.1).
In control fruit, the weight loss reached a maximum of 27.8%. Weight loss
increased with time in storage and the smallest weight loss (15.4%) was
observed with 1.0% conventional chitosan treatments, but differences
compared with 600 nm (18.1%) and 1000 nm (17.2%) droplets were not
significant (Fig. 7.1).
Weight loss during ripening is a common and unavoidable phenomenon
for all fruits and vegetables. When first picked from a tree, the fruit remains
‘ ’ for a few days or even weeks, during which it undergoes a series of
‘b kg ’ metabolic processes in preparation for ripening. During this
time, the fruit continues to respire and transpire, losing some of its substrate
and water which results in some weight loss. The basic mechanism of weight
loss in fresh fruit and vegetables is due to vapour pressure differentials, and
coatings maintain the quality of fruit by maintaining the turgidity through water
retention in the fruit (Chien et al., 2007b).
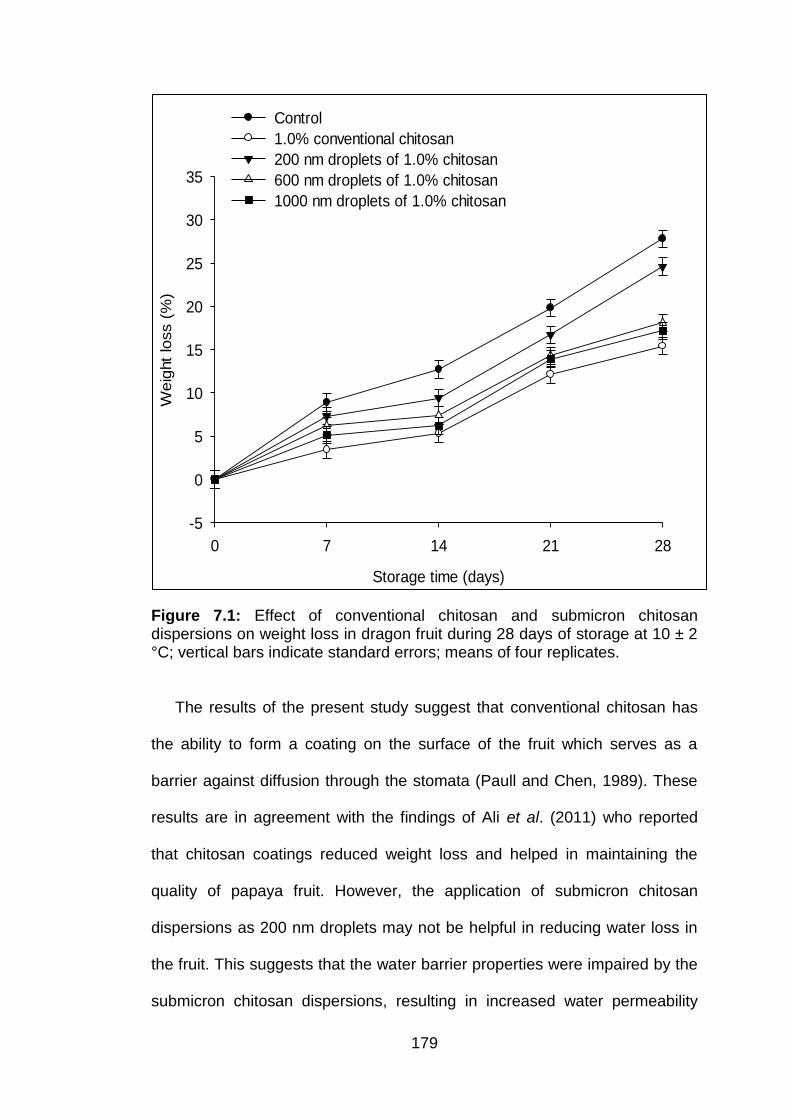
179
Figure 7.1: Effect of conventional chitosan and submicron chitosan dispersions on weight loss in dragon fruit during 28 days of storage at 10 ± 2 °C; vertical bars indicate standard errors; means of four replicates.
The results of the present study suggest that conventional chitosan has
the ability to form a coating on the surface of the fruit which serves as a
barrier against diffusion through the stomata (Paull and Chen, 1989). These
results are in agreement with the findings of Ali et al. (2011) who reported
that chitosan coatings reduced weight loss and helped in maintaining the
quality of papaya fruit. However, the application of submicron chitosan
dispersions as 200 nm droplets may not be helpful in reducing water loss in
the fruit. This suggests that the water barrier properties were impaired by the
submicron chitosan dispersions, resulting in increased water permeability
Storage time (days)
0 7 14 21 28
Weig
ht
loss (
%)
-5
0
5
10
15
20
25
30
35
Control
1.0% conventional chitosan
200 nm droplets of 1.0% chitosan
600 nm droplets of 1.0% chitosan
1000 nm droplets of 1.0% chitosan
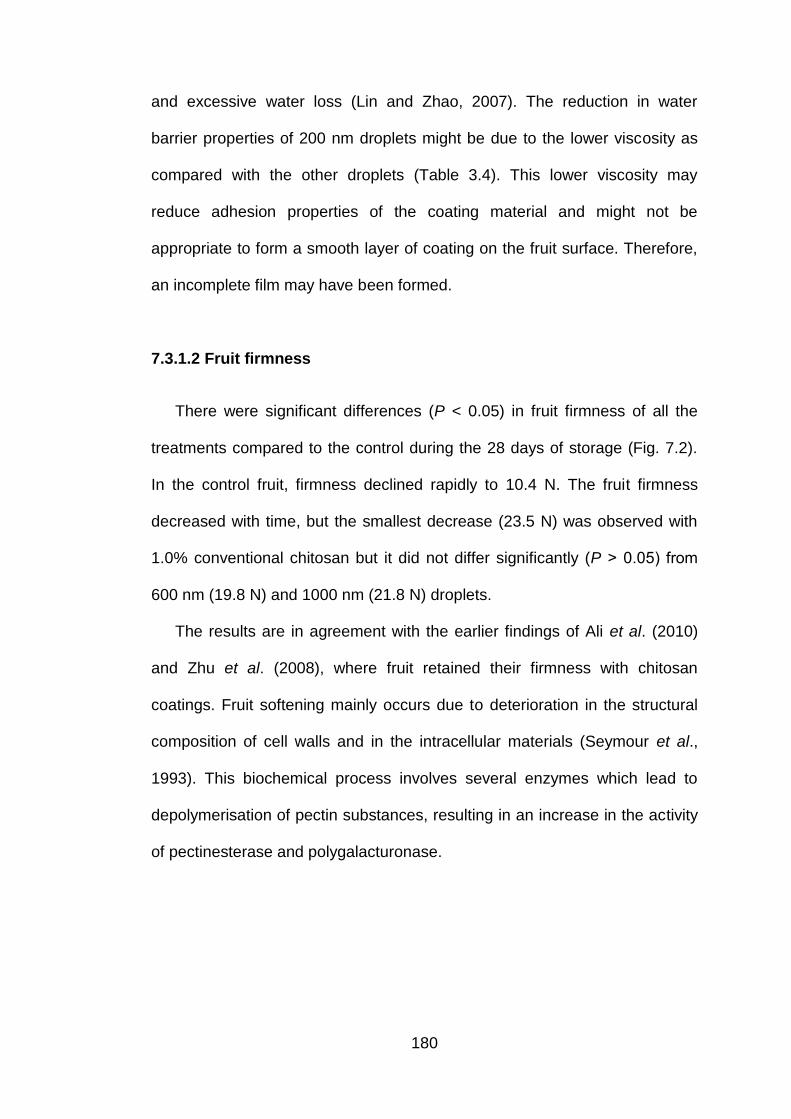
180
and excessive water loss (Lin and Zhao, 2007). The reduction in water
barrier properties of 200 nm droplets might be due to the lower viscosity as
compared with the other droplets (Table 3.4). This lower viscosity may
reduce adhesion properties of the coating material and might not be
appropriate to form a smooth layer of coating on the fruit surface. Therefore,
an incomplete film may have been formed.
7.3.1.2 Fruit firmness
There were significant differences (P < 0.05) in fruit firmness of all the
treatments compared to the control during the 28 days of storage (Fig. 7.2).
In the control fruit, firmness declined rapidly to 10.4 N. The fruit firmness
decreased with time, but the smallest decrease (23.5 N) was observed with
1.0% conventional chitosan but it did not differ significantly (P ˃ . 5)
600 nm (19.8 N) and 1000 nm (21.8 N) droplets.
The results are in agreement with the earlier findings of Ali et al. (2010)
and Zhu et al. (2008), where fruit retained their firmness with chitosan
coatings. Fruit softening mainly occurs due to deterioration in the structural
composition of cell walls and in the intracellular materials (Seymour et al.,
1993). This biochemical process involves several enzymes which lead to
depolymerisation of pectin substances, resulting in an increase in the activity
of pectinesterase and polygalacturonase.
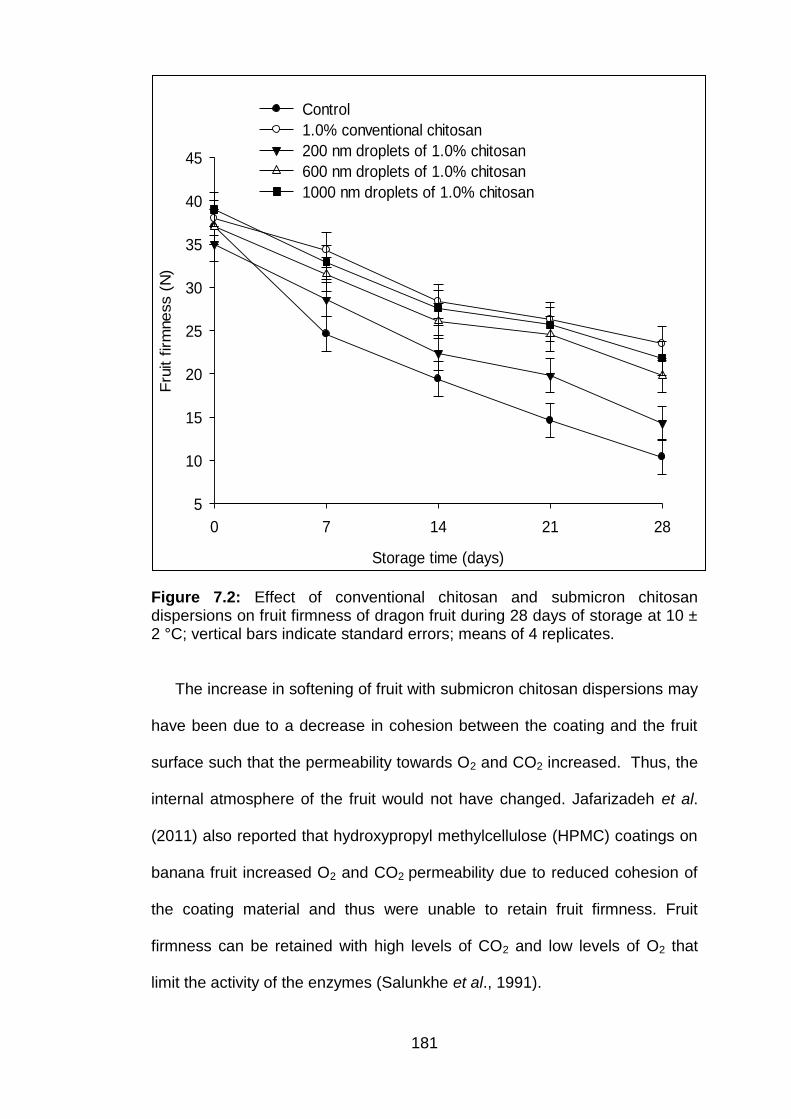
181
Figure 7.2: Effect of conventional chitosan and submicron chitosan dispersions on fruit firmness of dragon fruit during 28 days of storage at 10 ± 2 °C; vertical bars indicate standard errors; means of 4 replicates.
The increase in softening of fruit with submicron chitosan dispersions may
have been due to a decrease in cohesion between the coating and the fruit
surface such that the permeability towards O2 and CO2 increased. Thus, the
internal atmosphere of the fruit would not have changed. Jafarizadeh et al.
(2011) also reported that hydroxypropyl methylcellulose (HPMC) coatings on
banana fruit increased O2 and CO2 permeability due to reduced cohesion of
the coating material and thus were unable to retain fruit firmness. Fruit
firmness can be retained with high levels of CO2 and low levels of O2 that
limit the activity of the enzymes (Salunkhe et al., 1991).
Storage time (days)
0 7 14 21 28
Fru
it f
irm
ness (
N)
5
10
15
20
25
30
35
40
45
Control
1.0% conventional chitosan
200 nm droplets of 1.0% chitosan
600 nm droplets of 1.0% chitosan
1000 nm droplets of 1.0% chitosan
182
7.3.2 Chemical quality of fruit treated with conventional chitosan and
submicron chitosan dispersions
7.3.2.1 Soluble solids concentration
There was a greater increase in SSC content in the untreated control fruit
as compared with the treated fruit (Fig. 7.3). In control fruit, SSC reached a
maximum of 60.0% after 28 days of storage. The lowest increase in SSC
(39.8%) was observed with 1.0% conventional chitosan.
Figure 7.3: Effect of conventional chitosan and submicron chitosan dispersions on soluble solids concentration of dragon fruit during 28 days of storage at 10 ± 2 °C; vertical bars indicate standard errors; means of four replicates.
Storage time (days)
0 7 14 21 28
Solu
ble
solid
s c
oncentr
ation (
%)
10
12
14
16
18
20
Control
1.0% conventional chitosan
200 nm droplets of 1.0% chitosan
600 nm droplets of 1.0% chitosan
1000 nm droplets of 1.0% chitosan
183
The increase in SSC values reflected the carbohydrate metabolism in the
climacteric fruit, particularly conversion of starch to glucose (Bashir and Abu-
Goukh, 2003). A higher SSC value is observed when there is higher
respiration, which results in the hydrolysis of sugars and organic acids
(Jafarizadeh, et al., 2011). It is suggested that chitosan treatments formed a
semi-permeable film around the fruit, which suppressed ethylene evolution
and maintained their SSC content (Ali et al., 2010).
7.3.2.2 Titratable acidity
Major organic acids in ripe dragon fruit are citric and L-lactic acids. There
was a major decrease in TA in the control (Fig. 7.4) and a slower decrease in
treated fruit. The decrease in TA in control fruit reached the lowest value
(0.12) after 28 days of storage. The smallest decrease (0.45) in TA occurred
with 1.0% conventional chitosan coating but it did not differ significantly (P ˃
0.05) with 600 nm (0.41) and 1000 nm (0.44) droplets.
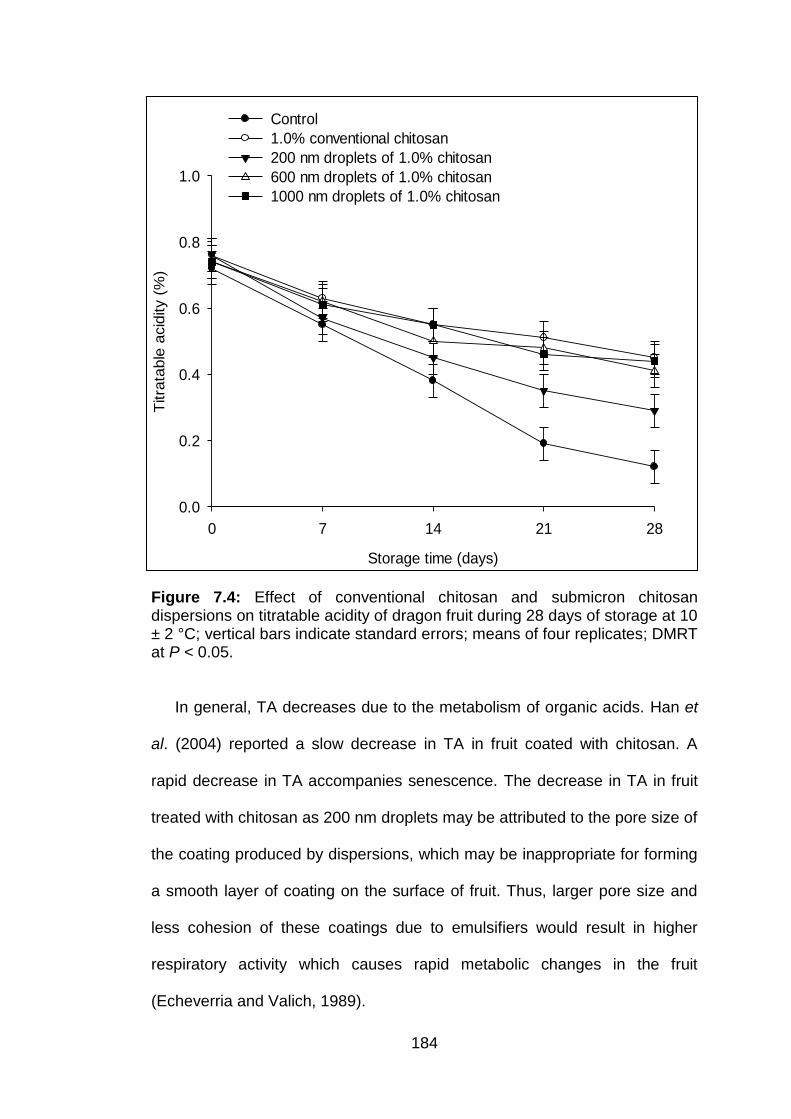
184
Figure 7.4: Effect of conventional chitosan and submicron chitosan dispersions on titratable acidity of dragon fruit during 28 days of storage at 10 ± 2 °C; vertical bars indicate standard errors; means of four replicates; DMRT at P < 0.05.
In general, TA decreases due to the metabolism of organic acids. Han et
al. (2004) reported a slow decrease in TA in fruit coated with chitosan. A
rapid decrease in TA accompanies senescence. The decrease in TA in fruit
treated with chitosan as 200 nm droplets may be attributed to the pore size of
the coating produced by dispersions, which may be inappropriate for forming
a smooth layer of coating on the surface of fruit. Thus, larger pore size and
less cohesion of these coatings due to emulsifiers would result in higher
respiratory activity which causes rapid metabolic changes in the fruit
(Echeverria and Valich, 1989).
Storage time (days)
0 7 14 21 28
Titra
table
acid
ity (
%)
0.0
0.2
0.4
0.6
0.8
1.0
Control
1.0% conventional chitosan
200 nm droplets of 1.0% chitosan
600 nm droplets of 1.0% chitosan
1000 nm droplets of 1.0% chitosan
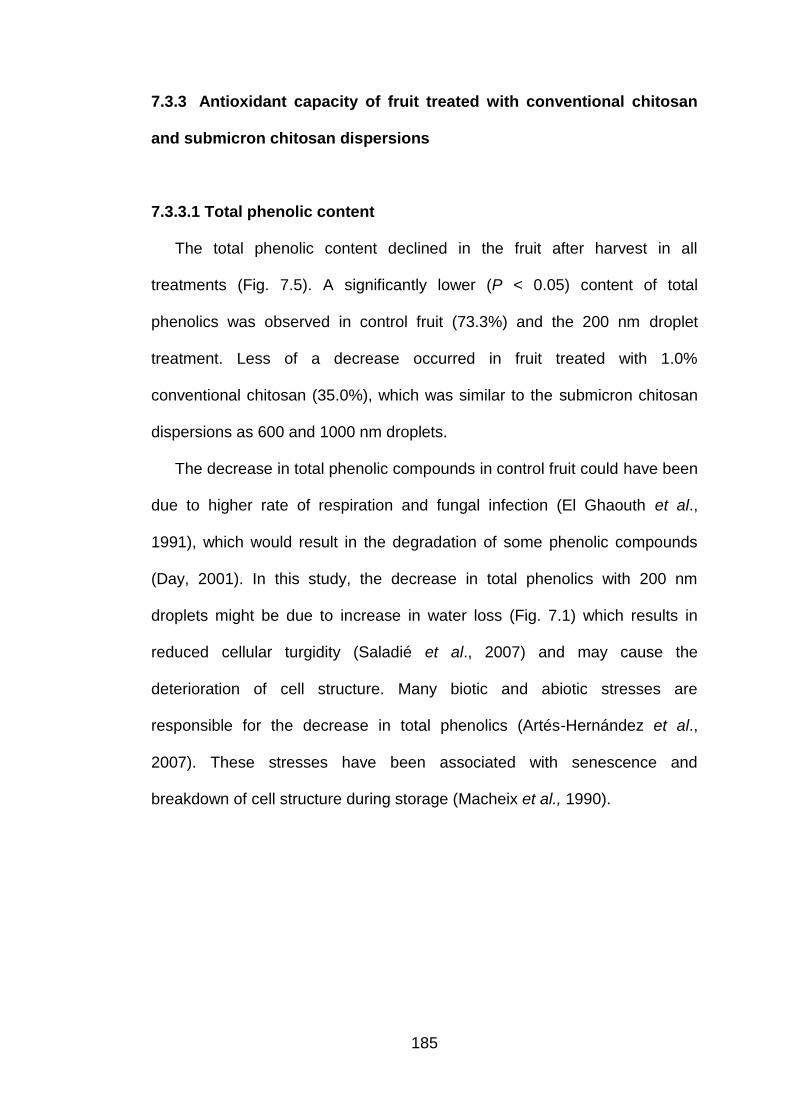
185
7.3.3 Antioxidant capacity of fruit treated with conventional chitosan
and submicron chitosan dispersions
7.3.3.1 Total phenolic content
The total phenolic content declined in the fruit after harvest in all
treatments (Fig. 7.5). A significantly lower (P < 0.05) content of total
phenolics was observed in control fruit (73.3%) and the 200 nm droplet
treatment. Less of a decrease occurred in fruit treated with 1.0%
conventional chitosan (35.0%), which was similar to the submicron chitosan
dispersions as 600 and 1000 nm droplets.
The decrease in total phenolic compounds in control fruit could have been
due to higher rate of respiration and fungal infection (El Ghaouth et al.,
1991), which would result in the degradation of some phenolic compounds
(Day, 2001). In this study, the decrease in total phenolics with 200 nm
droplets might be due to increase in water loss (Fig. 7.1) which results in
reduced cellular turgidity (Saladié et al., 2007) and may cause the
deterioration of cell structure. Many biotic and abiotic stresses are
responsible for the decrease in total phenolics (Artés-Hernández et al.,
2007). These stresses have been associated with senescence and
breakdown of cell structure during storage (Macheix et al., 1990).
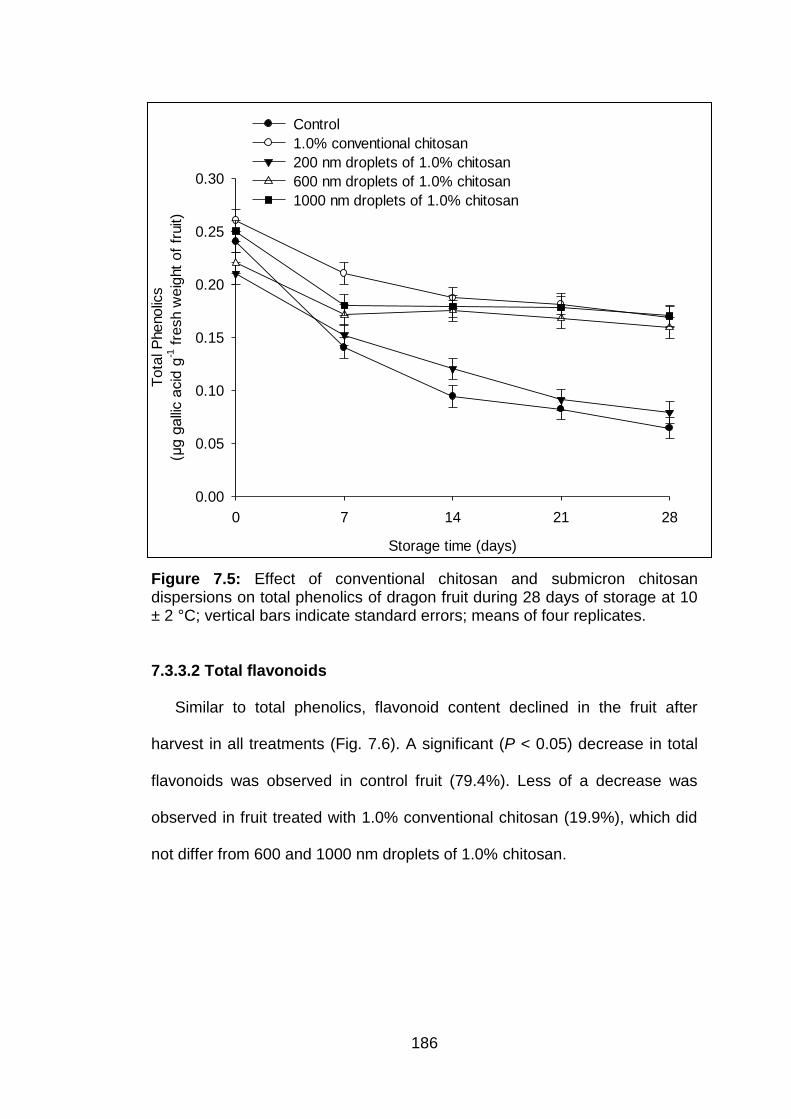
186
Figure 7.5: Effect of conventional chitosan and submicron chitosan dispersions on total phenolics of dragon fruit during 28 days of storage at 10 ± 2 °C; vertical bars indicate standard errors; means of four replicates.
7.3.3.2 Total flavonoids
Similar to total phenolics, flavonoid content declined in the fruit after
harvest in all treatments (Fig. 7.6). A significant (P < 0.05) decrease in total
flavonoids was observed in control fruit (79.4%). Less of a decrease was
observed in fruit treated with 1.0% conventional chitosan (19.9%), which did
not differ from 600 and 1000 nm droplets of 1.0% chitosan.
Storage time (days)
0 7 14 21 28
Tota
l P
henolic
s
(µg g
alli
c a
cid
g-1 f
resh w
eig
ht
of
fruit)
0.00
0.05
0.10
0.15
0.20
0.25
0.30
Control
1.0% conventional chitosan
200 nm droplets of 1.0% chitosan
600 nm droplets of 1.0% chitosan
1000 nm droplets of 1.0% chitosan
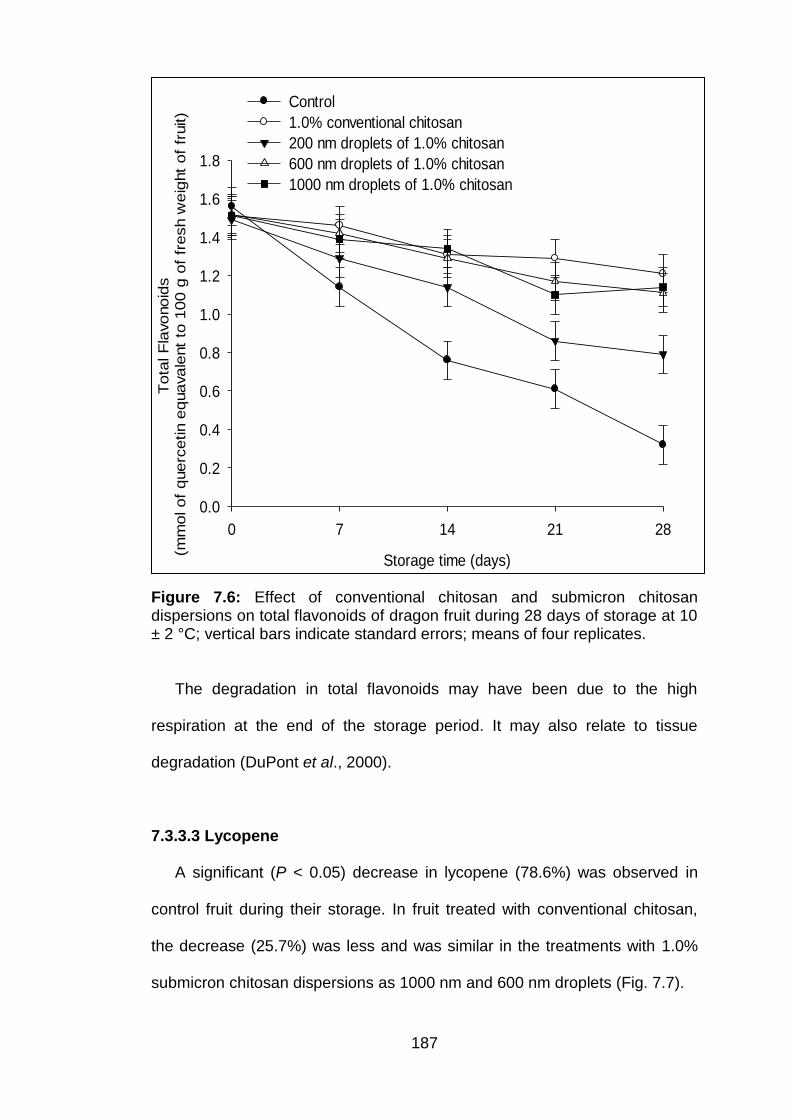
187
Figure 7.6: Effect of conventional chitosan and submicron chitosan dispersions on total flavonoids of dragon fruit during 28 days of storage at 10 ± 2 °C; vertical bars indicate standard errors; means of four replicates.
The degradation in total flavonoids may have been due to the high
respiration at the end of the storage period. It may also relate to tissue
degradation (DuPont et al., 2000).
7.3.3.3 Lycopene
A significant (P < 0.05) decrease in lycopene (78.6%) was observed in
control fruit during their storage. In fruit treated with conventional chitosan,
the decrease (25.7%) was less and was similar in the treatments with 1.0%
submicron chitosan dispersions as 1000 nm and 600 nm droplets (Fig. 7.7).
Storage time (days)
0 7 14 21 28
Tota
l F
lavonoid
s
(mm
ol of
querc
etin e
quavale
nt
to 1
00 g
of
fresh w
eig
ht
of
fruit)
0.0
0.2
0.4
0.6
0.8
1.0
1.2
1.4
1.6
1.8
Control
1.0% conventional chitosan
200 nm droplets of 1.0% chitosan
600 nm droplets of 1.0% chitosan
1000 nm droplets of 1.0% chitosan
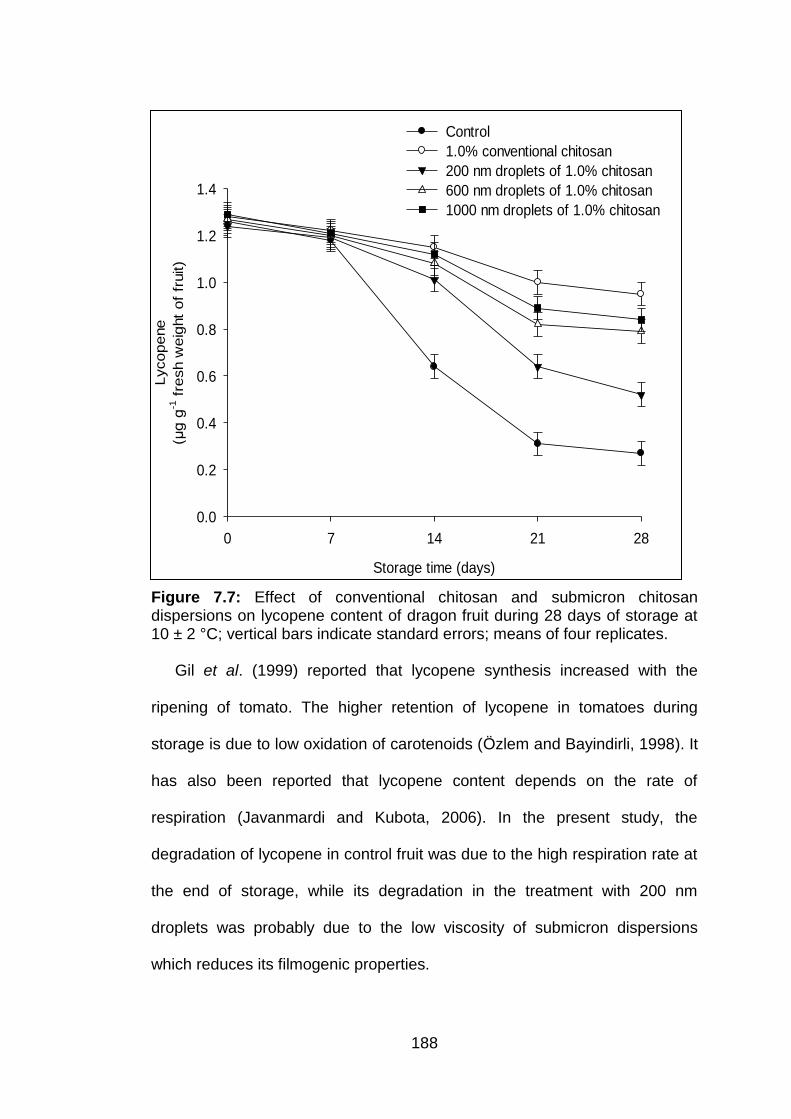
188
Figure 7.7: Effect of conventional chitosan and submicron chitosan dispersions on lycopene content of dragon fruit during 28 days of storage at 10 ± 2 °C; vertical bars indicate standard errors; means of four replicates.
Gil et al. (1999) reported that lycopene synthesis increased with the
ripening of tomato. The higher retention of lycopene in tomatoes during
storage is due to low oxidation of carotenoids (Özlem and Bayindirli, 1998). It
has also been reported that lycopene content depends on the rate of
respiration (Javanmardi and Kubota, 2006). In the present study, the
degradation of lycopene in control fruit was due to the high respiration rate at
the end of storage, while its degradation in the treatment with 200 nm
droplets was probably due to the low viscosity of submicron dispersions
which reduces its filmogenic properties.
Storage time (days)
0 7 14 21 28
Lycopene
(µg g
-1 f
resh w
eig
ht
of
fruit)
0.0
0.2
0.4
0.6
0.8
1.0
1.2
1.4
Control
1.0% conventional chitosan
200 nm droplets of 1.0% chitosan
600 nm droplets of 1.0% chitosan
1000 nm droplets of 1.0% chitosan
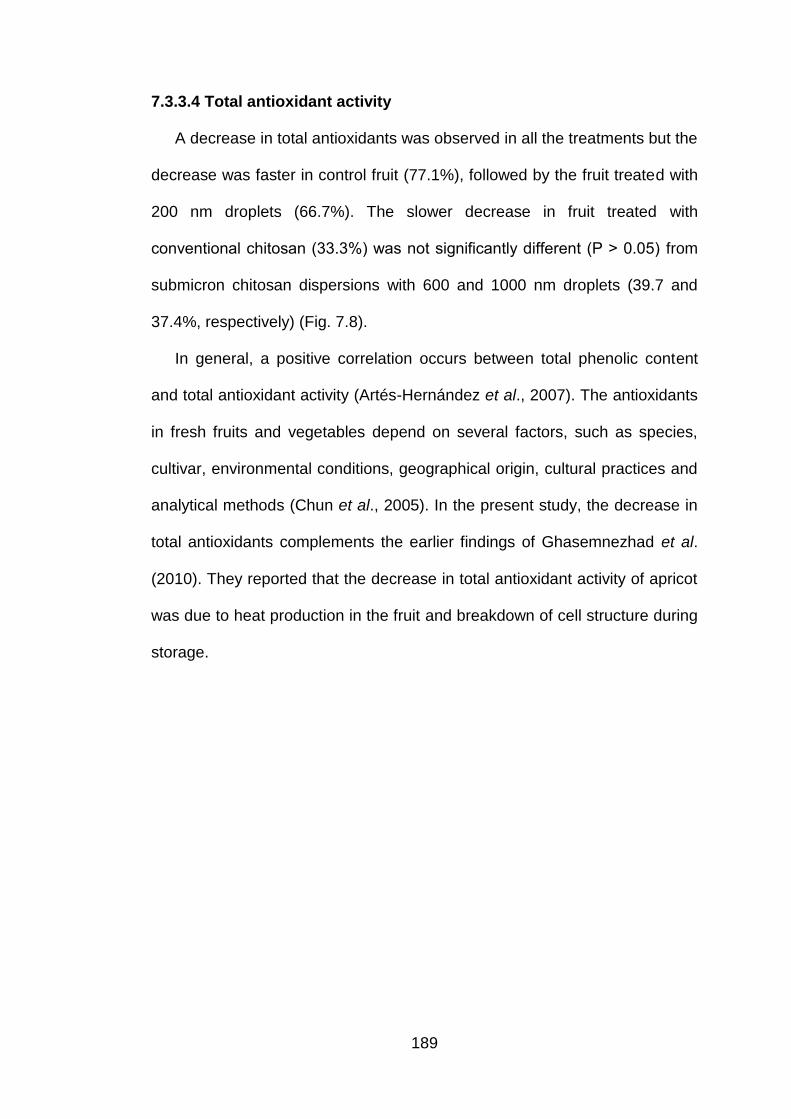
189
7.3.3.4 Total antioxidant activity
A decrease in total antioxidants was observed in all the treatments but the
decrease was faster in control fruit (77.1%), followed by the fruit treated with
200 nm droplets (66.7%). The slower decrease in fruit treated with
v h (33.3%) w g (P ˃ . 5) from
submicron chitosan dispersions with 600 and 1000 nm droplets (39.7 and
37.4%, respectively) (Fig. 7.8).
In general, a positive correlation occurs between total phenolic content
and total antioxidant activity (Artés-Hernández et al., 2007). The antioxidants
in fresh fruits and vegetables depend on several factors, such as species,
cultivar, environmental conditions, geographical origin, cultural practices and
analytical methods (Chun et al., 2005). In the present study, the decrease in
total antioxidants complements the earlier findings of Ghasemnezhad et al.
(2010). They reported that the decrease in total antioxidant activity of apricot
was due to heat production in the fruit and breakdown of cell structure during
storage.
190
Figure 7.8: Effect of conventional chitosan and submicron chitosan dispersions on total antioxidants of dragon fruit during 28 days of storage at 10 ± 2 °C; vertical bars indicate standard errors; means of 4 replicates.
This study has shown that the good retention of total phenols, total
flavonoids and lycopene in fruit treated with 1.0% conventional chitosan and
the submicron chitosan dispersions as 1000 nm and 600 nm droplets is
important for maintaining the total antioxidants capacity.
Storage time (days)
0 7 14 21 28
Tota
l antioxid
ants
activity
(Activity o
f F
eS
O4 m
g g
-1 f
resh w
eig
ht
of
fruit)
0.2
0.4
0.6
0.8
1.0
1.2
1.4
1.6
1.8
2.0
2.2
Control
1.0% conventional chitosan
200 nm droplets of 1.0% chitosan
600 nm droplets of 1.0% chitosan
1000 nm droplets of 1.0% chitosan
191
7.3.4 Gaseous exchange analysis
7.3.4.1 Respiration rate
No peaks of respiration and ethylene were recorded in the fruit during 28
days of storage. A continuous decrease in carbon dioxide (CO2) production
was observed in all treatments (Fig. 7.9 a). A sudden increase in CO2 was
observed after 14 days in control fruit and the increase in CO2 concentration
was 98.0% on the 28th day. An increase in CO2 was observed in all other
treatments after 21 days.
7.3.4.2 Ethylene evolution
A decrease in ethylene concentration was observed in all treatments (Fig.
7.9 b) until day 21 after which it remained constant or slightly increased. The
changes in the ethylene production of the control fruit were more pronounced
than in the other treatments. On day 28, ethylene production in the control
had increased and was significantly (P < 0.05) higher than in the other
treatments.
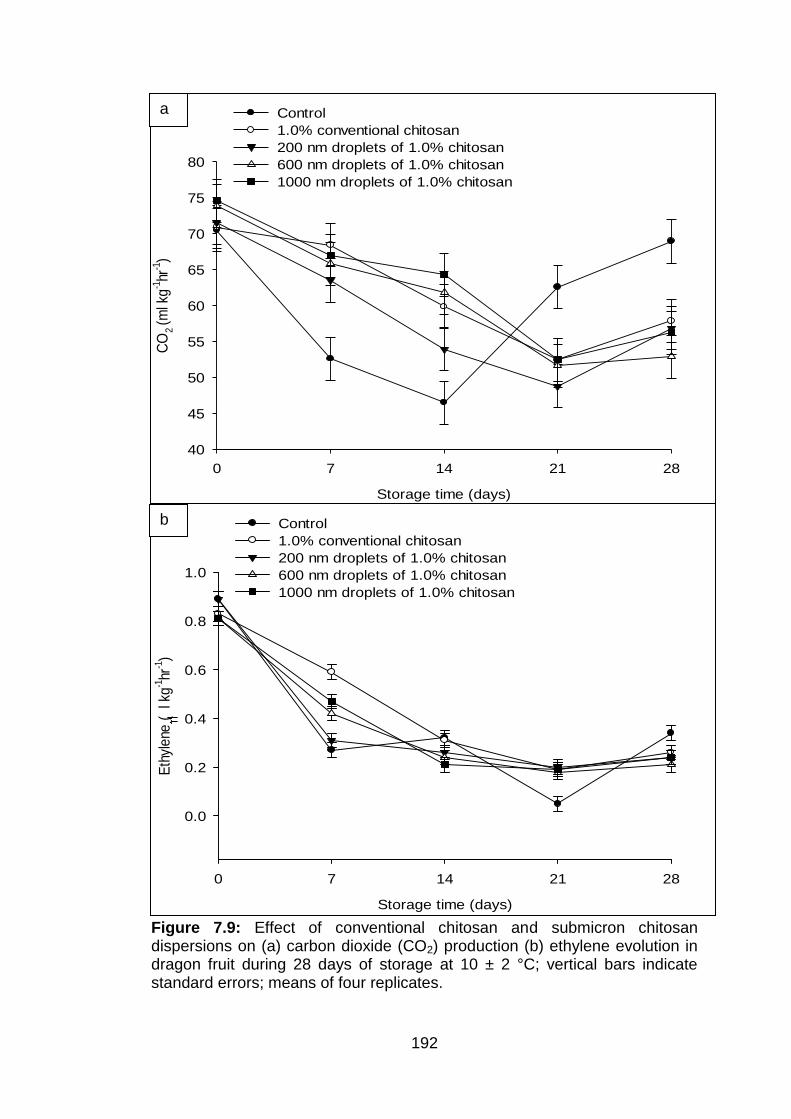
192
aa
Figure 7.9: Effect of conventional chitosan and submicron chitosan dispersions on (a) carbon dioxide (CO2) production (b) ethylene evolution in dragon fruit during 28 days of storage at 10 ± 2 °C; vertical bars indicate standard errors; means of four replicates.
Storage time (days)
0 7 14 21 28
CO
2 (m
l kg
-1hr
-1)
40
45
50
55
60
65
70
75
80
Control
1.0% conventional chitosan
200 nm droplets of 1.0% chitosan
600 nm droplets of 1.0% chitosan
1000 nm droplets of 1.0% chitosan
Storage time (days)
0 7 14 21 28
Eth
ylene
(l k
g-1hr
-1)
0.0
0.2
0.4
0.6
0.8
1.0
Control
1.0% conventional chitosan
200 nm droplets of 1.0% chitosan
600 nm droplets of 1.0% chitosan
1000 nm droplets of 1.0% chitosan
a
b
193
This pattern of respiration and ethylene production could be due to the
growth of fungus on the skin of the fruit (Pérez-Tello et al., 2001). An
increase in respiration due to disease has previously been reported in
strawberries (El Ghaouth et al., 1991) and in longan fruit (Jiang and Li, 2001).
Minor differences in the decrease in quality of the fruit treated with
submicron chitosan dispersions when compared with conventional chitosan
could be due to the low viscosity of submicron chitosan dispersions that may
have reduced the filmogenic properties of the solutions (Navarro-Tarazaga et
al., 2008).
The results of the present study showed that 1.0% conventional chitosan
helped to maintain the quality of fruit and was comparable with the submicron
chitosan dispersions as 600 and 1000 nm droplets. In addition, these
dispersions did not show any detrimental effects on the quality of the fruit.
194
CHAPTER 8
CONCLUSION
Four chitosan solutions of different molecular weight were tested against
C. gloeosporioides during this study and the low molecular weight chitosan
showed best antifungal activity. Using low molecular weight chitosan led to
application of less time for sonication in preparing submicron chitosan
dispersions. Besides the use of less energy, it maintained a higher zeta
potential due to its lower degree of acetylation which helped the stability of
the dispersions. The low viscosity of low molecular weight chitosan
submicron dispersions may allow it to penetrate into the cells more easily.
Submicron chitosan dispersions based on low molecular weight chitosan
showed promising effects in controlling C. gloeosporioides isolated from
dragon fruit plants in comparsion with locally prepared chitosan. This could
be attributed to its low degree of acetylation and high cationic nature which
interacts with the negative charges of the fungal cell wall and causes leakage
in the fungal cells.
The maximum reduction in disease of dragon fruit plants with the use of
600 nm droplets could be endorsed with the curative effect of chitosan, as it
was helpful in reducing the disease even when applied one week after
inoculation. This reduction in disease could also be ascribed to the multi-
mode action of chitosan which has the potential to elicit the production of
inducible compounds, such as total phenolics, PO, PPO, PAL and PR
proteins, and consequently enhances the resistance of the plant against
anthracnose. There are different threshold levels of these enzymes in
195
inoculated and uninoculated plants which suggests that higher
concentrations of these enzymes may be associated with lower disease
incidence.
Droplets at 600 nm reduced the onset of disease and this resulted in
increased vegetative growth. This increase in vegetative growth might be due
to the increased chlorophyll content. As chlorophyll is the major
photosynthetic pigment of the plant, the increase in chlorophyll increased the
vigour of the plants and consequently their vegetative growth.
Postharvest application of submicron chitosan dispersions showed that
600 nm droplets of 1.0% chitosan caused a reduction in disease incidence
and disease severity. It is proposed that the matrix of this droplet size
contains enough of the active ingredient which penetrates the fungal cell wall
and causes leakage from the fungal cells.
Fruits coated with 600 nm droplets of 1.0% chitosan exhibited less weight
loss, maintained fruit firmness, had slower increase in soluble solids and
retained antioxidant properties without any negative effects.
The findings of this study suggest that use of 600 nm droplets of 1.0%
chitosan is an inexpensive method with potential to control pre- and
postharvest anthracnose of dragon fruit. Future studies should be conducted
at the genetic level to observe the effect of these submicron dispersions on
the production of inducible compounds against anthracnose. These
submicron chitosan dispersions should also be tested on a commercial scale
in relation to the development of new formulations and their application to a
range of crops.
196
REFERENCES Abdel-Mawgoud, A.M.R., Tantawy, A.S., El-Nemr M.A. and Sassine, Y.N.
(2010). Growth and yield responses of strawberry plants to Chitosan application. European Journal of Scientific Research, 39: 170-177.
Abou-Shoer, M. (2010). A simple colorimetric method for the evaluation of chitosan. American Journal of Analytical Chemistry, 2: 91-94.
Adaskaveg, J.E. and Förster, H. (2010). New developments in postharvest fungicide registrations for edible horticultural crops and use strategies in the United States. In: Prusky, D. and Gullino, M.L. (eds.). Postharvest Pathology. Springer, New York, pp. 107-116.
Adaskaveg, J.E., Förster, H. and Sommer, N.F. (2002). Principles of postharvest pathology and management of decays of edible horticultural crops. A. Kader (ed.). Postharvest Technology of Horticultural Crops, University of California, Oakland, USA. pp. 163-195.
Agnihotri, S.A., Mallikarjuna, N.N. and Aminabhavi, T.M. (2004). Recent advances on chitosan-based micro- and nanoparticles in drug delivery. Journal of Controlled Release, 100: 5-28.
Agrawal, S., Kandimalla, E.R., Yu, D., Ball, R., Lombardi, G., Lucas, T., Dexter, D.L., Hollister, B.A. and Chen, S.F. (2002). GEM 231, a second-generation antisense agent complementary to protein kinase A RIalpha subunit, potentiates antitumor activity of irinotecan in human colon, pancreas, prostate and lung cancer xenografts. International Journal of Oncology, 21: 65-72.
Agrios, G.N. (2004). Plant Pathology. 5th Edition. Elsevier Academic Press, Oxford, UK. 922 pp.
Ag ό, E., Íg , M.S., , . A b g , L. (2003). Present and future role of chitin and chitosan in food. Macromolecular Bioscience, 3: 521-530.
Ahmed, S. and Baig, S.H. (2009). Ascorbic acid, carotenoids, total phenolic content and antioxidant activity of various genotypes of Brassica oleracea encephala. Journal of Medical and Biological Sciences, 3: 1-8.
Ait Barka, E., Eullaffroy, P., Clément, C. and Vernet, G. (2004). Chitosan improves development, and protects Vitis vinifera L. against Botrytis cinerea. Plant Cell Reports, 22: 608-614.
Al-Hetar, M.Y., Zainal Abidin, M.A., Sariah, M. and Wong, M.Y. (2010). Antifungal activity of chitosan against Fusarium oxysporum f. sp. Cubense. Journal of Applied Polymer Science, 120: 2434-2439.
Ali, A. (2006). Anthracnose incidence, biochemical changes, postharvest quality and gas exchange of chitosan coated papaya. PhD Thesis. Universiti Putra Malaysia, Serdang, Malaysia.
Ali, A. and Mahmud, T.M.M. (2008). The potential use of locally prepared chitosan to control in vitro growth of Colletotrichum gloeosporioides isolated from papaya fruits. Acta Horticulturae, 804: 177-182.
Ali, A., Mahmud, T.M.M., Sijam, K. and Siddiqui, Y. (2010). Potential of chitosan coating in delaying the postharvest anthracnose (Colletotrichum gloeosporioides Penz.) of Eksotika II papaya. International Journal of Food Science and Technology, 45: 2134-2140.
197
Ali, A., Mahmud, T.M.M., Sijam, K. and Siddiqui, Y. (2011). Effect of chitosan coatings on the physicochemical characteristics of Eksotika II papaya (Carica papaya L.) fruit during cold storage. Food Chemistry, 124: 620-626.
Ali, M.M., Al-Ani, A., Eamus, D. and Tan, D.K.Y. (2012). A new image processing based technique to determine chlorophyll in plants. American-Eurasian Journal of Agriculture & Environmental Science, 12: 1323-1328.
Allan, C.R. and Hadwiger, L.A. (1979). The fungicidal effect of chitosan on fungi of varying cell wall composition. Experimental Mycology, 3: 285-287.
Amini, J. (2009). Induced resistance in tomato plants against Fusarium wilt invoked by nanopathogenic Fusarium, chitosan and bion. The Plant Pathology Journal, 25: 256-262.
Amselem, S. and Friedman, D. (1998). In Submicron emulsions in drug targeting and delivery; Benita, S., Ed.; Harwood Academic Publishers: New York, pp: 153-173.
Andres, Y., Giraud, L., Gerente, C. and Le Cloirec, P. (2007). Antibacterial effects of chitosan powder: mechanisms of action. Environmental Technology, 24: 1357-1363.
Andrews, J.M. (2001). Determination of minimum inhibitory concentrations. Journal of Antimicrobial Chemotherapy, 48: 5-16.
Anguelova, V.S., van der Westhuizen, A. and Pretorius, Z.A. (1999). Intercellular proteins and β-1, 3-glucanases activity associated with leaf rust resistance in wheat physiology. Planta, 106: 393-401.
Antonietti, M. and Landfester, K. (2002). Polyreactions in miniemulsions. Progress in Colloid and Polymer Science, 27: 689-757.
Arlorio, M., Ludwig, A., Boller, T. and Bofante, P. (1992). Inhibition of fungal growth by plant chitinase and β-1, 3-glucanases. A morphological study. Protoplasma, 171: 34-43.
Artés-Hernández, F., Rivera-Cabrera, F. and Jader, A.A. (2007). Quality retention and potential shelf-life of fresh-cut lemons as affected by cut type and temperature. Postharvest Biology and Technology, 43: 245-254.
Asua, J.M. (2002). Miniemulsion polymerization. Progress in Polymer Science, 27: 1283-1346.
Awang, Y., Ghani, M.A.A. and Sijam, K. (2010). Effects of Colletotrichum gloeosporioides and Monilinia fructicola on quality of red flesh dragon fruit (Hylocereus polyrhizus). Acta Horticulturae, 880: 431-438.
Awang, Y., Ghani, M.A.A., Sijam, K. and Mohamad, R.B. (2011). Effect of calcium chloride on anthracnose disease and postharvest quality of red-flesh dragon fruit (Hylocereus polyrhizus). African Journal of Microbiology Research, 5: 5250-5259.
Ayers, W.A., Papavizas, G.C. and Diem, A.F. (1966). Polygalacturonate trans-eliminase and polygalacturonase production by Rhizoctonia solani. Phytopathology, 56: 1006-1011.
Aziz, A., Tortel-Aziz, P., Dhuicq, L., Jeandet, P., Couderchet, M. and Vernet, G. (2006). Chitosan oligomers and copper sulfate induce grapevine defense reactions and resistance to gray mold and downy mildew. Phytopathology, 96: 1188-1194.
198
Backman, P.A. (1997). Variation in Pathogenicity, Morphology and RAPD Markers of Colletotrichum graminicola from Turfgrass Hosts. MSc Dissertation. The Pennsylvania State University, State College, Paris.
Badawy, M.E.I. and Rabea, E.I. (2009). Potential of the biopolymer chitosan with different molecular weight to control postharvest gray mold of tomato fruit. Postharvest Biology and Technology, 51: 110-117.
Badawy, M.E.I., Rabea, E.I., Rogge, T.M., Stevens, C.V., Smagghe, G. and Steurbaut, W. (2004). Synthesis and fungicidal activity of new N,O acyl chitosan derivatives. Biomacromolecules, 5: 589-595.
Bailey J.A. and Jeger, M.J. (1992). Colletotrichum: Biology, Pathology and Control. Wallingford: Commonwealth Mycological Institute, pp. 388.
, J.A., ’C , .J. N h, C. ( 992). I g Colletotrichum spieces. In: Bailey, J.A. and Jeger, M.J. (eds.). Colletotrichum: Biology, Pathology and Control. Oxfordshire: CABI Publishing, pp. 88-120.
Barber, M.S., Bertram, R.E. and Ride, J.P. (1989). Chitin oligosaccharides elicit lignification in wounded wheat leaves. Physiological and Molecular Plant Pathology, 34: 3-12.
Barkai-Golan, R. (2001). Postharvest Diseases of Fruit and Vegetables: Development and Control. Elsevier Sciences, Amasterdam, The Netherlands.
Barkai-Golan, R. and Phillips, D.J. (1991). Postharvest heat treatments of fresh fruits and vegetables for decay control. Plant Disease, 75: 1085-1089.
Barnett, H.L. and Hunter, B.B. (1972). Illustrated genera of imperfect fungi. Burgess Publishing Co., Broken Arrow, OK, USA. p. 241.
Bashir, H.A. and Abu-Goukh, A.A. (2003). Compositional changes during guava ripening. Food Chemistry, 80: 557-563.
Bauer, W.D., Bateman, D.F. and Whalen, C.H. (1977). Purification of an endo-β-1, 4 galactanase produced by Sclerotinia sclerotiorum: Effects on isolated plant cell walls and potato tissue. Phytopathology, 82: 1185-1193.
Bautista-Baños, S., Hernández-Lauzardo, A.N., Velázquez-del Valle, M.G., Hernández-López, M., Ait Barka, E., Bosquez-Molina, E. and Wilson, C.L. (2006). Chitosan as a potential natural compound to control pre and postharvest diseases of horticultural commodities. Crop Protection, 25: 108-118.
Bautista-Baños, S., Hernández-López, M. and Bosquez-Molina, E. (2004). Growth inhibition of selected fungi by chitosan and plant extracts. Mexican Journal of Phytopathology, 22: 178-186.
Bautista-Baños, S., Hernández-López, M., Bosquez-Molina, E. and Wilson C. L. (2003). Effects of chitosan and plant extracts on growth of Colletotrichum gloeosporioides, anthracnose levels and quality of papaya fruit. Crop Protection, 22: 1087-1092.
Bellerbeck, V.G., De Roques, C.G., Bessiere, J.M., Fonvieille, J.L. and Dargent, R. (2001). Effect of Cymbopogon nardus (L) W. Watson essential oil on the growth and morphogenesis of Aspergillus niger. Canadian Journal of Microbiology, 47: 9-17.
Benhamou, N. (1996). Elicitor-induced plant defense pathways. Trends in Plant Science, 1: 233-240.
199
Benhamou, N. and Thériault, G. (1992). Treatment with chitosan enhances resistance of tomato plants to the crown and root pathogen Fusarium oxysporum f. sp. radicis-lycopersici. Physiology and Molecular Plant Pathology. 41: 34-52.
Benhamou, N., Kloepper, J.W. and Tuzun, S. (1998). Induction of resistance against Fusarium wilt of tomato by combination of chitosan with an endophytic bacterial strain: ultrastructure and cytochemistry of the host response. Planta, 204: 153-168.
Benhamou, N., Lafontaine, P. J. and Nicole, M. (1994). Induction of systemic resistance to Fusarium crown and root rot in tomato plants by seed treatment with chitosan. Phytopathology. 84: 1432-1444.
Benjakul, S., Visessanguan, W., Tanaka, M., Ishizaki, S., Suthidham, R. and Sungpech, O. (2000). Effect of chitin and chitosan on gelling properties of surimi from barred garfish (Hemiramphus far). Journal of the Science of Food and Agriculture, 81: 102-108.
Bennett, A.B., Chetelat, R., Klann, E., Lasbrook, C., Martin, R. and Gilchrist. D. (1993). Physiologically-directed molecular and biochemical approaches to plant improvement. Transaction of Malaysian Society of Plant Physiology, 3: 200-209.
Ben-Shalom, N., Aki, C., Ardi, R. and Pinto, R. (2002). Elicitation effects of chitin oligomers and chitosan sprayed on the leaves of cucumber (Cucumis sativus) and bean (Phaseolus vulgaris) plants. Israel Journal of Plant Sciences, 50: 199-206.
Ben-Shalom, N., Ardi, R., Pinto, R., Aki, C. and Fallik, E. (2003). Controlling gray mould caused by Botrytis cinerea in cucumber plants by means of chitosan. Crop Protection, 22: 275-283.
Bergstrom, G.C. and Nicholson, R.L. (1999). The biology of corn anthracnose: knowledge to exploit for improved management. Plant Disease, 83, 596-608.
Bhaskara Reddy, B.M.V., Angers, P., Castaigne, F. and Arul, J. (2000). Chitosan effects on blackmold rot and pathogenic factors produced by Alternaria alternata in postharvest tomatoes. Journal of the American Society for Horticultural Science, 125: 742-747.
Bhaskara Reddy, M.V., Arul, J., Angers, P. and Couture, L. (1999). Chitosan treatment of wheat seeds induces resistance to Fusarium graminearum and improves seed quality. Journal of Agricultural and Food Chemistry, 47: 1208-1216.
Bhaskara-Reddy, M.V., Essaid, A.B., Castaigne, F. and Arul, J. (1997). Effect of chitosan on growth and toxin production by Alternaria alternata f. sp. lycopersici. 94th Annual International Conference organized by American Society of Horticultural Sciences, Vol. 32, Salt Lake City, Utah, USA, 237 pp. (Abs).
Bibette, J. (1990). Rheology of foams and highly concentrated emulsions. I. Elastic properties and yield stress of cylindrical model system. PhD Thesis. University Bordeaux I, Bordeaux, France.
Bishop, C.D. and Reagan, J. (1998). Control of the storage pathogen Botrytis cinerea on Dutch white cabbage (Brassica oleracea var. capitata) by the essential oil of Melaleuca alternifolia. Journal of Essential Oil Research, 10: 57-60.
200
Bohland, C., Balkenhohl, T., Lores, G., Feussner, I. and Grambow, H. (1997). Differential induction of lipoxygenase isoforms in wheat upon treatment with rust fungus elicitor, chitin oligosaccharides, chitosan and methyl jasmonate. Plant Physiology, 114: 679-685.
Boonlertnirun, S., Sarobol, E. and Sooksathan, (2005). Studies on chitosan concentration and frequency of foliar application on rice yield potential cv Suphunburi 1. 31st Congress on Science and Technology of Thailand, October18-20, Suranaree University of Technology, Thailand, 40-44.
Borkowski, J., Dyki, B., Felczynska, A. and Kowalczyk, W. (2007). Effect of biochikol 020 pc (chitosan) on the plant growth, fruity yield and healthiness of tomato plant roots and stems. Polish Chitin Society. Monograph, 12: 217-223.
Bornet, A. and Teissedre, P.L. (2005). Applications and interest of chitin, chitosan and their derivations in enology. Journal International des Sciences de la Vignet du Vin, 39: 199-207.
Bowen, K. L. (2007). Plant disease epidemiology, In: Plant pathology, Concepts and Laboratory Exercises, Trigiano, R.N., Windhman, M.T. and Windhman, A. S. (Eds.). 2nd Edn., CRC Press, New York. Pp: 281-294.
Bradford, M.M. (1976). A rapid and sensitive for the quantitation of microgram quantities of protein utilizing the principle of protein-dye binding. Analytical Biochemistry, 72: 248-254.
Bruce, R.J. and West, C.A. (1982). Elicitation of lignin biosynthesis and isoperoxidase activity by pectic fragments in suspension cultures of castor bean. Plant Physiology, 91: 889-897.
, . M , . . (2 ). E g v . In: Nielloud, F., Marti-Mestres, G. (eds.). Pharmaceutical Emulsions and Suspensions. Marcel Dekker, New York, pp. 191-228.
Byrde, R.J.W. and Fielding, A.H. (1968). Pectin methyl trans-eliminase as the macerating factor of Sclerotinia fructigena and its significance in the brown rot of apple. Journal of General Microbiology, 52: 287-297.
Byrnes, K.J. and Carroll, R.B. (1986). Fungi causing stalk rot of conventional-tillage and no-tillage corn in Delaware. Plant Disease, 70: 238-239.
Campbell, C.L. and Madden, L.V. (1990). Introduction to Plant Disease Epidemiology. Wiley-Inter science, New York.
Campos-Vargas, R. and Saltveit, M.E. (2002). Involvement of putative chemical wound signals in the induction of phenolic metabolism in wounded lettuce. Physiologia Plantarum, 114: 73-84.
Cantos, E., Tudela, J.A., Gill, M.I. and Espin, J.C. (2002). Phenolic compounds and related enzymes are not rate-limiting in browning development of fresh cut potatoes. Journal of Agricultural and Food Chemistry, 50: 3015-3023.
Chandrkrachang, S. (2002). The applications of chitin and chitosan in agriculture in Thailand. In: Suchiva, K., Chandrkrachang, S., Methacanon, P. and Peter, M.G. (eds.), Advances in Chitin Science, Vol. 5, Bangkok pp. 458-462.
Chandrkrachang, S., Sompongchaikul, P. and Sangtain, S. (2005). Profitable spin-off from using chitosan in orchid farming in Thailand. Journal of Metals Materials and Minerals, 15: 45-48
201
Chandrkrachang, S., Sompongchaikul, P. and Teuntai, S. (2003). Effect of chitosan applying in multicultural crop plantation. National Chitin - Chitosan Conference. July 17-18, 2003, Chulalongkorn University, Bangkok, Thailand, 158-160.
Charigkapakorn, N. (2000). Control of chilli anthracnose by different biofungicides. AVRDC Report, 1-5.
Chau, F.K. (1981). A study of anthracnose, caused by Colletotrichum gloeosporioides Penz. on papaya fruit (Carica papaya L.) under normal and low pressure storage. Master Thesis. University of Hawaii.
Chau, K.F. and Alvarez, A.M. (1983). A histological study of anthracnose on Carica papaya [Colletotrichum gloeosporioides, papayas]. Phytopathology, 73: 1113-1116.
Cheah, L.H., Page, B.B.C. and Sheperd, R. (1997). Chitosan coating for inhibition of Sclerotinia in carrots. New Zealand Journal of Crop and Horticultural Science, 25: 89-92.
Cheah, L.S. and Zulkarnain, W.M. (2008). Status of pitaya cultivation in Malaysia. Paper presented at Seminar on Pitaya Production, Market and Export-Challenges and Prospects, Oct. 20, Putrajaya, Malaysia.
Chen, C., Liau, W. and Tsai, G. (1998). Antibacterial effects of N-sulfonated and N-sulfobenzoyl chitosan and application of oyster preservation. Journal of Food Protection, 61: 1124-1128.
Chibu, H. and H. Shibayama, (2001). Effects of chitosan applications on the growth of several crops. In: Uragami, T., Kurita, K. and Fukamizo, T. (eds.). Chitin and Chitosan in Life Science, Yamaguchi, pp. 235-239.
Chien, P.J., Sheu, F. and Lin, H.R. (2007a). Coating citrus (Murcott tangor) fruit with low molecular weight chitosan increases postharvest quality and shelf life. Food Chemistry, 100: 1160-1164.
Chien, P.J., Sheu, F. and Yang, F.H. (2007b). Effects of edible chitosan coating on quality and shelf-life of sliced mango fruit. Journal of Food Engineering, 78: 225-229.
Chittoor, J.M., Leach, J.E. and White, F.F. (1990). Induction of peroxidase during defense against pathogens. In: Datta, S.K. and Muthukrishnan, S. (eds.). Pathogenesis: Related Proteins in Plants, CRC Press, Boca Raton, FL. pp. 291.
Chookhongkha, N., Miyagawa, S., Jirakiattikul, Y. and Photchanachai, S. (2012). Chilli growth and seed productivity as affected by chitosan. Proceedings of International Conference on Agriculture Technology and Food Sciences (ICATFS’ 2012). Nov. 17-18, 2012. pp. 146-149.
Chun, O.K., Kim, D.O., Smith, N., Schroeder, D., Han, J.T. and Lee, C.Y. (2005). Daily consumption of phenolics and total antioxidant capacity from fruit and vegetables in the American diet. Journal of Science Food and Agriculture, 85: 1715-1724.
Cooke, B.M. (2006). Disease assessment and yield loss. In: Cooke, B.M., Jones, D.G. and Kaye, B. (eds.). The Epidemiology of Plant Diseases 2nd ed., Springer, Netherlands. pp. 43-80.
Cooper, R.M. and Wood, R.K.S. (1975). Regulation of synthesis of cell wall degrading enzymes by Verticillium albo-atrum and Fusarium oxysporum f. sp. lycopersici. Physiological and Molecular Plant Pathology, 5: 135-156.
202
Cos, P., Bruyne, D.T., Hermans, N., Apers, S., Berghe, D.V. and Vlietinck, A.J. (2004). Proanthocyanidins in health care: current and new trends. Current Medicinal Chemistry, 11: 1345-59.
Côté, F., Laflamme, L., Payet, M.D. and Gallot-Payet, N. (1998). Oligosaccharide elicitors in host-pathogen interactions. Generation, perception, and signal transduction. Subcellular Biochemistry, 29: 385-342.
Cowan, A.K., Cairns, A.L.P. and Bartels-Rahm, B. (1999). Regulation of abscisic acid metabolism: Towards a metabolic basis for abscisic acid-cytokinin antagonism. Journal of Experimental Botany, 50: 595-603.
Crane, J.H. and Balerdi, C.F. (2005). Pitaya growing in the Florida home landscape. Institute of Food and Agricultural Sciences, University of Florida. http://miamidade.ifas.ufl.edu/pdrfs/tropical_fruit/THE%20PITAYA%20in%
Crnko, G.S., Stall, W.M. and White, J.M. (1992). Sweet corn weeds control evolutions on minerals and organic soils. Proceedings of the Florida State Horticultural Society, 105: 326-330.
Cronin, M.J., Yohalem, D.S., Harris, R.F. and Andrews, J.H. (1996). Putative mechanism and dynamics of inhibition of apple scab pathogen Venturia inequalis by compost extracts. Soil Biology and Biochemistry, 28: 1241-1249.
Cuero, R.G., Osuji, G. and Washington, A. (1991). N-carboxymethyl chitosan inhibition of aflatoxin production: role of zinc. Biotechnology Letters, 13: 441-444.
Dalisay, R.F. and Kuc, J.A. (1995). Persistence of reduced penetration by Colletotrichum lagenarium into cucumber leaves with induced systemic resistance and its relation to enhanced peroxidase and chitinase activities. Physiological and Molecular Plant Pathology, 47: 329-338.
Davis, R.H. (2011). Effectiveness of Different Molecular Weights and Concentrations of Chitosan on Enteric Viral Surrogates. Master's Thesis, University of Tennessee.
Day, B. (2001). Modified atmosphere packaging of fresh fruits and vegetables-an overview. Acta Horticulturae, 553: 585-590.
De Ascensao, A.R.D.C.F. and Dubery, I.A. (2000). Panama disease: Cell wall reinforcement in banana roots in response to elicitors from Fusarium oxysporum f. sp. cubense race four. Phytopathology, 90: 1173-1180.
Desai, K.G.H. and Park, H.J. (2005). Preparation and characterization of drug-loaded chitosan-tripolyphosphate microspheres by spray drying. Drug Development Research, 64: 114-128.
Dixon, R.A. and Harrison, M.J. (1990). Activation, structure and organization of genes involved in microbial defense in plants. Advances in Genetics, 28:165-234.
Dixon, R.A. and Paiva, N.L. (1995). Stress-induced phenylpropanoid metabolism. Plant Cell, 7: 1085-1097.
Do Amaral, M. and Asua, J.M. (2004). Synthesis of large, high-solid-content latexes by miniemulsion polymerization. Journal of Polymer Science, A. Polymer. Chemistry, 42: 4222-4227.
203
Doupnik, B., Jr., Boosalis, M.G., Wicks, G. and Smika D. (1975). Ecofallow reduces stalk rot in grain sorghum. Phytopathology, 65: 1021-1022.
Droby, S., Cohen, L., Wiess, B., Dans, A. and Wisniewski, M. (2001). Microbial control of postharvest diseases of fruits and vegetables-current status and future outlook. Acta Horticulturae, 553: 371-376.
Droby, S., Vinokur, V., Weiss, B., Cohen, L., Daus, A., Goldsmith, E. and Porat, R. (2002). Induction of resistance to Penicillium digitatum in grapefruit by the yeast biocontrol agent Candida oleophila. Biological Control, 92: 393-399.
Du, J., Gemma, H. and Iwahori, S.J. (1997). Effects of chitosan coating on the storage of peach, Japanese pear and Kiwi fruit. Journal of Japanese Society of Horticultural Sciences, 66:15.
Dubey, N.K. and Kishore, N. (1988). Exploitation of higher plant products as natural fumigants. Proceedings of the Fifth International Congress on Plant Pathology, Kyoto, Japan, p. 423 (Abstract).
Dubos, B. (1984). Biocontrol of Botryris on grapevines by antagonistic strain of Trichoderma harzianum. In: Klub, M.J. and Reedy, C.A. (eds.). Current Perspectives in Microbial Ecology. Elsevier Science Publishers, Amsterdam, pp. 370-373.
DuPont, M.S., Mondin, Z., Williamson, G. and Keith, R.P. (2000). Effect of variety, processing, and storage on the flavonoid glycoside content and composition of lettuce and endive. Journal of Agricultural and Food Chemistry, 48: 3957-3964.
Echeverria, E. and Valich, J. (1989). Enzymes of sugar and acid metabolism in stored Valencia oranges. Journal of the American Society for Horticultural Science, 114: 445-449.
Eckert, J.W. and Ogawa, J.M. (1985). The chemical control of post-harvest diseases: subtropical and tropical fruits. Annual Review of Phytopathology, 23: 421-454.
Edwards, S.G. and Seddon, B. (1992). Bacillus brevis as biocontrol agent against Botrytis cinerea on protected Chinese cabbage. In: Verhoeff, K., Malathrakis, N.E. and Williamson, B. (eds.). Recent Advances in Botrytis Research. Pudoc, Wageningen, pp. 267-271.
Eikemo, H., Stensvand, A. and Tronsmo, A.M. (2003). Induced resistance as a possible means to control disease of strawberry caused by Phytophthora spp. Plant Disease, 87: 345-350.
El Ghaouth, A., Arul, J., Asselin, A, and Benhamou. N. (1992). Antifungal activity of chitosan on postharvest pathogens: Induction of morphological and cytological alterations in Rhizopus stolonifer. Mycological Research, 96: 769-779.
El Ghaouth, A., Arul, J., Grenier, J. and Benhamou, N. (1994a). Effect of chitosan on cucumber plants: Suppression of Phythium aphanidermatum and induction of defense reaction. Phytopathology, 84: 313-320.
El Ghaouth, A., Arul, J., Ponnampalam, R. and Boulet, M. (1991). Chitosan coating effect on storability and quality of fresh strawberries. Journal of Food Science, 56: 1618-1620.
204
El Ghaouth, A., Arul, J., Wilson, C. and Benhamou, N. (1997). Biochemical and cytochemical aspects of the interactions of chitosan and Botrytis cinerea in bell pepper fruit. Postharvest Biology and Technology, 12: 183-194.
El Ghaouth, A., Arul, J., Wilson, C., Asselin, A. and Benhamou, N. (1994b). Ultrastructural and cytochemical aspects of the effect of chitosan on decay of bell pepper fruit. Physiological and Molecular Plant Pathology, 44: 417-432.
El Ghaouth, A., Wilson, C.L., Chalutz. E., Droby, S., Stevens, C., Lu, J.Y., Khan, V. and Arul, J. (1994c). Potential of induced resistance to control postharvest diseases of fruits and vegetables. Plant Disease, 78: 837-845.
El Hadrami, A., El Hadrami, I. and Daayf, F. (2009). Suppression of induced plant defense responses by fungal pathogens. In: Bouarab, K., Brisson, N. and Daayf, F. (eds.). Molecular-Plant Microbe Interaction. CABI: Wallingford, UK, Chapter 10, pp. 231-268.
El Hassni, M., El Hadrami, A., Daayf, F., Chérif, M., Ait Barka, E. and El Hadrami, I. (2004). Chitosan, antifungal product against Fusarium oxysporum f. sp. albedinis and elicitor of defence reactions in date palm roots. Phytopathologia Mediterranea, 43: 195-204.
El-Aasser, M.S. and Miller, C.M. (1997). Preparation of latexes using miniemulsions. In: Asua, J.M. (ed.). Polymeric Dispersions: Principles and Applications. Kluwer Academic Publishers, Dordrecht. pp. 109-126.
Elad, Y. (2000). Biological control of foliar pathogen by means of Trichoderma harzianum and potential modes of action. Crop Protection, 19: 709-714.
Elad, Y. and Shtienberg, D. (1994). Effects of compost water extracts on grey mould, Botrytis cinerea. Crop Protection, 13: 109-114.
Elad, Y., Kirshner, B., Nitzani, Y. and Sztejnberg, A. (1998). Management of powdery mildew and gray mold of cucumber by Trichoderma harzianum T39 and Ampelomyces quisqualis AQ10. BioControl, 43: 241-251.
El-Tantawy, E.M. (2009). Behaviour of tomato plants as affected by spraying with chitosan and aminofort as natural stimulator substances under application of soil organic amendments. Pakistan Journal of Biological Sciences, 12: 1164-1173.
Fajardo, J.E., McCollum, T.G., McDonald, R.E. and Mayer, T. (1998). Differential induction of proteins in orange flavedo by biologically based elicitors and challenged by Penicillium digitatum Sacc. Biological Control, 13: 143-151.
Falcón-Rodríguez, A.B., Cabrera, J.C., Ortega, E. and Martínez-Téllez, M.A. (2009). Concentration and physicochemical properties of chitosan derivatives determine the induction of defense responses in roots and leaves of tobacco (Nicotiana tabacum) plants. American Journal of Agricultural and Biological Sciences, 4: 192-200.
205
Fallik, E. (2004). Pre-storage hot water treatments (immersion, rinsing and brushing). Postharvest Biology and Technology, 32: 125-134.
Fallik, E. (2010). Hot water treatments of fruits and vegetables for postharvest storage. In: Janick, J. (ed.). Horticultural Reviews. John Wiley & Sons, Inc., Hoboken, NJ, USA. Vol. 38.
Fallik, E. and Lurie, S. (2007). Thermal control of fungi in the reduction of postharvest decay. In: Tang, J., Mitcham, E., Wang, S. and Lurie, S. (eds.). Heat Treatment for Postharvest Pest Control: Theory and Practice. CAB International, Wallingford, UK., pp. 162-181.
Fan, X., Annous, B.A., Beaulieu, J.C. and Sites, J.E. (2008). Effect of hot water surface pasteurization of whole fruit on shelf life and quality of fresh-cut cantaloupe. Journal of Food Science, 73: 91-98.
Fang, S.W., Li, C.F. and Shih, D.Y.C. (1994). Antifungal activity of chitosan and its preservative effect on low-sugar candied kumquat. Journal of Food Protection, 56: 136-140.
Farouk, S., Mosa, A.A., Taha, A.A., Ibrahim, H.M. and El-Gahmery, A.M. (2011). Protective effect of humic acid and chitosan on radish (Raphanus sativus, L. var. sativus) plants subjected to cadmium stress. Journal of Stress Physiology and Biochemistry, 7: 99-116.
Fernando, T.H.P.S., Jayasinghe, C.K. and Wijesundera, R.L.C. (2001). Cell wall degrading enzyme secretion by Colletotrichum acutatum, the causative fungus of secondary leaf fall of Hevea brasiliensis. Mycology Research, 105: 195-201.
Fischer, L., Scheckermann, C. and Wanger, F. (1995). Purification and characterization of thermo tolerant β-galactosidase from Thermomyces lanuginosus. Applied and Environmental Microbiology, 61: 1497-1501.
Fish, W.W., Perkins-Veazie, P. and Collins, J.K. (2002). A quantitative assay for lycopene that utilizes reduced volumes of organic solvents. Journal of Food Composition and Analysis, 15: 309-317.
Fisk, C.L., Silver, A.M., Strik, B.C. and Zhao, Y. (2008). Postharvest quality of hardy Kiwifruit (Actinidia arguta ‘A ’) w h packaging and storage conditions. Postharvest Biology and Technology, 47: 338-345.
Fokkema, N.J. and Schippers, B. (1986). Phyllosphere versus rhizosphere as environments for saprophytic colonization. In: Fokkema, N.J. and Van den Heuvel, J. (eds.). Microbiology of the Phyllosphere. Cambridge University Press, Cambridge. pp. 137-159.
F g , A., E q , J., G ’ , C. S , C. (2 ). S the relation between phase behavior and emulsification methods with nanoemulsion formation. Progress in Colloid and Polymer Science, 115: 36-39.
Forgiarini, A., Esquen , J., G ’ , C. S , C. (2 ). F of nano-emulsions by low-energy emulsification methods at constant temperature. Langmuir, 17: 2076-2083.
F g , A., E q , J., G ’ , C. S . C. (2 b). F and stability of nano-emulsions in mixed nonionic surfactant systems. Progress in Colloid and Polymer Science, 118: 184-189.
206
Freeman, S., Katan, T. and Shabi, E. (1998). Characterization of Colletotrichum species responsible for anthracnose diseases of various fruits. Plant Disease, 82: 596-605.
Freitas, C. and Müller, R.H. (1998). Effect of light and temperature on zeta potential and physical stability of solid lipid nanoparticles (SLNTM) dispersions. International Journal of Pharmaceutics, 168: 221-229.
Froehlicher, T., Hennebelle, T., Martin-Nizard, F., Cleenewerck, P, Hilbert, J., Trotin, F. and Grec, S. (2009). Phenolic profiles and antioxidative effect of hawthorn cell suspensions, fresh fruits and medicinal dried parts. Food Chemistry, 115: 897-903.
Fry, S.C. (1987). Intracellular feruloylation of pectic polysaccharides. Planta, 171: 205-211.
Gagnon, H. and Ibrahim, R.K. (1997). Effects of various elicitors on the accumulation and secretion of isoflavonoids in white lupin. Phytochemistry, 44: 1463-1467.
Gainvors, A., Frézier, H., Lemaresquier, H. Lequart, C., Aigle, M. and Belarbi, A. (1994). Detection of polygalacturonase, pectin-lyase and pectin-esterase activities in Saccharomyces cerevisiae strain. Yeast, 10: 1311-1319.
Geiger, J.P., Nicole, M., Topan, A., Roby, D., Benhamou, N., Rio, B. and Nandris, D. (1993). Lignification: A defence reaction of trees to rotting fungi. In: Fritig, B. and Legrand, M. (eds.). Mechanism of Plant Defence Responses. Netherlands: Kluwer Academic Publishers. pp. 355.
Gerasimenko, D.V., Avdienko, I.D., Bannikova, G.E., Zueva, O.Y. and Varlamov, V.P. (2004). Antibacterial effects of water-soluble low molecular-weight chitosans on different microorganisms. Applied Biochemistry and Microbiology, 40: 253-257.
Ghasemnezhad, M., Shiri, M.A. and Sanavi, M. (2010). Effect of chitosan coatings on some quality indices of apricot (Prunus armeniaca L.) during cold storage. Caspian Journal of Environmental Science, 9: 25-33.
Ghoname, A.A., El-Nemr, M.A., Abdel-Mawgoud, A.M.R. and El-Tohamy, W.A. (2010). Enhancement of sweet pepper crop growth and production by application of biological, organic and nutritional solutions. Research Journal of Agriculture and Biological Sciences, 6: 349-355.
Gil, R., Merav, C., Zamir, D. and Hirschberg, J. (1999). Regulation of carotenoid biosynthesis during tomato fruit development: expression of a gene for lycopene epsilon-cyclase in down-regulated during ripening and is elevated in mutantDelta. The Plant Journal, 17: 341-351.
Goletti, F. (2003). Current status and future challenges for the postharvest sector in developing countries. Acta Horticulturae, 628: 41-48.
Gopinath, K., Radhkrishnan, N.V. and Jayaraj, J. (2006). Effect of propiconazole and difenoconazole on the control of anthracnose of chilli fruits caused by Colletotrichum capsici. Crop Protection, 25: 1024-1031.
207
Gotthardt, U. and Grambow, H.J. (1992). Near-isogenic wheat suspension cultures: establishment, elicitor induced per oxidase activity and potential use in the study of host/pathogen-interaction. Journal of Plant Physiology, 139: 659-665.
Gozzo, F. (2003). Systemic acquired resistance in crop protection: from nature to a chemical approach. Journal of Agricultural and Food Chemistry, 51: 4487-4503.
Gueguen, Y., Chemardin, P., Labrot, P., Arnaud, A. and Galzy, P. (1997). Purification and characterization of an interacellular β-glucosidase from a new strain of Leuconostoc mesenteroides isolated from cassava. Journal of Applied Microbiology, 82: 469-476.
Guerra-Sánchez, M.G., Vega-Pérez, J., Velázquez-del Valle, M.G. and Hernández-Lauzardo A.N. (2009). Antifungal activity and release of compounds on Rhizopus stolonifer (Ehrenb. Fr.) Vuill. by effect of chitosan with different molecular weights. Pesticide Biochemistry and Physiology, 93: 18-22.
Guilbert, S., Gontard, N., and Gorris, L.G.M. (1996). Prolongation of the shelf- life of perishable food products using biodegradable films and coatings. Lebensmittel- Wissenschaft und-Technologie, 29: 10-17.
Guo, Z., Chen, R., Xing, R., Liu, S., Yu, H., Wang, P., Li C., and Li, P. (2006). Novel derivatives of chitosan and their antifungal activities in vitro. Carbohydrate Research, 341: 351-354.
Guyot, A., Graillat, C. and Favero, C. (2003). Anionic surfmers in mini-emulsion polymerisation. Comptes Rendus Chimie, 6: 1319-1327.
Hadwiger L.A. and Loschke, D.C. (1981). Molecular communication in host-parasite interactions: hexosamine polymers (chitosan) as regulator compounds in race-specific and other interactions. Phytopathology, 71: 756–762.
Hadwiger, L.A., Beckman, J.M. (1980). Chitosan as a component of Pea Fusarium solani interaction. Plant Physiology, 66: 205-211.
Hadwiger, L.A., Beckman, J.M. and Adams, M.J. (1981). Localization of fungal components in the Pea-Fusarium interaction detected immunochemically with anti-chitosan and anti-fungal cell wall antisera. Plant Physiology, 67: 170-175.
Hadwiger, L.A., Kendra, D.F., Fristensky, B.W. and Wagoner, N. (1986). Chitosan both activates genes in plants and inhibits RNA synthesis in fungi. In: Muzzarelli, R.A., Jeuniaux, C. and Gooday, G.W. (eds.). Chitin in Nature and Technology. Plenum Press, New York, pp. 209-214.
Hahlbrock, K. and Scheel, D. (1989). Physiology and molecular biology of phenylpropanoid metabolism. Annual Review of Plant Physiology and Plant Molecular Biology, 40: 347-369.
Hammerschmidt, R. (2005). Phenols and plant–pathogen interactions: The saga continues. Physiological and Molecular Plant Pathology, 66: 77-78.
Hammerschmidt, R. and Yang-Cashman. (1995). Induced resistance in cucurbits. In: Hammerschmidt, R. and Kuc, J. (eds.). Induced Resistance to Disease in Plants. Dordrecht, The Netherlands: Kluwer Academic. pp. 63-85.
208
Han, C., Zhao, Y., Leonard, S.W. and Traber, M.G. (2004). Edible coatings to improve storability and enhance nutritional value of fresh and frozen strawberries (Fragaria ananassa) and raspberries (Rubus idaeus). Postharvest Biology and Technology, 33: 67-78.
Hejazi, R. and Amiji, M. (2003). Chitosan based gastrointestinal delivery system. Journal of Control Release, 89: 151-165.
Hepler, P.K., Rice, R.M. and Terranova, W.A. (1972). Cytochemical localization of peroxidase activity in wound vessel members of Coleus. Canadian Journal of Botany, 50: 977-983.
Hernández-Lauzardo, A.N., Bautista-Baños, S., Velázquez-del Valle, M.G., Méndez-Montealvo, M.G., Sánchez-Rivera M.M., and Bello-Pérez, L. A. (2008). Antifungal effects of chitosan with different molecular weights on in vitro development of Rhizopus stolonifer (Ehrenb: Fr.) Vuill. Carbohydrate Polymers, 73: 541-547.
Hidalgo, P.J., Ubera, J.L., Santos, J.A., LaFont, F., Castelanos, C., Palomino, A. and Roman, M. (2002). Essential oils in Culamintha sylvatica. Bromf. ssp. ascendens (Jorden) P.W. Ball wild and cultivated productions and antifungal activity. Journal of Essential Oil Research, 14: 68-71.
Hirano, S. (1988). The activation of plant cells and their self-defense function against pathogens in connection with chitosan. Nippon NogeikagakuKaishi, 62: 293-295 (in Japanese with English summary).
Hirano, S. (1989). Production and application of chitin and chitosan in Japan. The use of chitosan in cosmetics. In: Skjak-Braek, G., Anthosen, T. and Standford, P. (eds.). Chitin and Chitosan. Sources,Chemistry, Biochemistry. Physical Properties and Applications. Elsevier Applied Science, London and New York. pp. 37-43.
Hirano, S. and Nagao, N. (1989). Effect of chitosan, pectic acid, lysozyme and chitinase on growth of several phytopathgens. Agricultural and Biological Chemistry, 53: 3065-3066.
Hirano, S., Nakahira, T., Nakagawa, M. and Kim, S.K. (1999). The preparation and applications of functional fibres from crab shell chitin. Journal of Biotechnology, 70: 373-377.
Hoa, N.V. (2008). Current research activities and the development of good agricultural practice (GAP) for pitaya in Vietnam. Paper presented at Seminar on Pitaya Production, Market and Export – Challenges and Prospects, October 20, 2008, Putrajaya, Malaysia.
Hoagland, P.D. and Parris, N. (1996). Chitosan/pectin laminated films. Journal of Agricultural and Food Chemistry, 44: 1915-1919.
Hoffland, E., Hakulinen, J. and Pelt, J.A. (1996). Comparisons of systemic resistance induced by avirulent and pathogenic Pseudomonas sp. Phytopathology, 86: 757-762.
Hongpattarakere, T. and Riyaphan, O. (2008). Effect of deacetylation conditions on antimicrobial activity of chitosan prepared from carapace of black tiger shrimp (Penaeus monodon). Songlanakarin Journal of Science and Technology, 30: 1-9.
Ikotun, T. (1984). Production of oxalic acid by Penicillium oxalicum in culture and ininfected yam tissue and interaction with macerating enzymes. Mycopathology, 88: 9-14.
209
Izquierdo, P., Esquena, J., Tadros, F.T., Dederen, C., Garacia, M.J., Azemar, N. and Solans, C. (2002). Formation and stability of nano-emulsions prepared using the phase inversion temperature method. Langmuir, 18: 26-30.
Jafari, M.S., He, Y. and Bhandari, B. (2007). Production of sub-micron emulsions by ultrasound and microfluidization techniques. Journal of Food Engineering, 82: 478-488.
Jafarizadeh, M.H., Osman, A., Tan, C.P., and Rahman, A.R. (2011). Development of an edible coating based on chitosan-glycerol to delay ‘ g ’ b (Musa sapientum cv. Berangan) ripening process. International Food Research Journal, 18: 989-997.
Janisiewicz, W.J. and Korsten, L. (2002). Biological control of postharvest diseases of fruits. Annual Review of Phytopathology, 40: 411-441.
Jansson, D. (2010). Development and characterization of chitosan-plasmid nanoparticles. MSc Thesis. Tampere University of Technology.
Javanmardi, J. and Kubota, C. (2006). Variation of lycopene, antioxidant activity, total soluble solids and weight loss of tomato during postharvest storage. Postharvest Biology and Technology, 41: 151-155.
Jayaraj, J. and Radakrishnan, N.V. (2003). Development of UV-induced carbendazin-resistant mutants of Trichoderma harzianum for integrated control of damping-off disease of cotton by Rhizoctonia solani. Plant Disease Protection, 110: 449-460.
Jeandet, P., Douillet-Breuil, A.C., Bessis, R., Debord, S., Sbaghi, M. and Adrian, M. (2002). Phytoalexins from the Vitaceae: biosynthesis, phytoalexin gene expression in transgenic plants, antifungal activity and metabolism. Journal of Agricultural and Food Chemistry, 50: 2731-2741.
Jiang, Y.M. and Li, Y.B. (2001). Effect of chitosan coatings on postharvest life and quality of longan fruit. Food Chemistry, 73: 139-143.
Jirak-Peterson, J.C. and Esker, P.D. (2011). Tillage, crop rotation and hybrid effects on residue and corn anthracnose occurrence in wisconsin. Plant Disease, 95: 601-610.
Junang, L., Aixian, J., Guoying, Z., and Yuanhao, H. (2009). Antifungal activity of chitosan against Colletotrichum gloeosporioides. Proceedings of 3rd International Conference on Bioinformatics and Biomedical Engineering (ICBBE 2009). Beijing, China. pp. 1-4.
Kader, A.A. (2002). Postharvest Technology of Horticultural Crops. Oakland: University of California, Division of Agriculture and Natural Resources Publication, 3311, p. 535.
Kanakaratne, N.S. and Adikaram, N.K.B. (1990). Cell wall degrading enzyme production by Colletotrichum gloeosporioides, the cause of mango anthracnose. Ceylon Journal of Science, 21: 41-54.
Karbstein, H. and Schubert, H. (1995). Developments in continuous mechanical production of oil-in-water micro-emulsions. Chemical Engineering and Technology, 24: 205-211.
Kauss, H., Jeblick, W. and Domard, A. (1989). The degrees of polymerization and N-acetylation of chitosan determine its ability to elicit callose formation in suspension cells and protoplasts of Catharanthus roseus. Planta, 178: 385-392.
210
Kays, S. (1991). Postharvest Physiology of Perishable Plant Products. Van Nostrand Reinhold, New York, pp. 355-407.
Kays, S.J. (1997). Postharvest Physiology of Perishable Plant Products. Chapter 1, Science and Practice of Postharvest Plant Physiology. Exon Press, United States of America, pp. 1-22.
Kazana, K., Goulter, K.C., Way, H.M. and Manners, J.M. (1998). Expression of pathogenesis-related peroxidase of Stylosanthes humilis in transgenic tobacco and canola and its effect on disease development. Plant Science, 136: 207-217.
Kendra, D.F. and Hadwiger, L.A. (1984). Characterization of smallest chitosan oligomer that is maximally antifungal to Fusarium solani and elicits pisatin formation in Pisum sativum. Experimental Mycology. 8: 276-281.
Kendra, D.F. and Hadwiger, L.A. (1987). Calcium and calmodulin may not regulate the disease resistance and pisatin formation responses of Pisum sativum to chitosan or Fusarium solani. Physiological and Molecular Plant Pathology, 31: 337-348.
Kendra, D.F., Christian, D. and Hadwiger, L.A. (1989). Chitosan oligomers from Fusarium solani/ pea int , h β-glucanase digestion of sporelings and from fungal wall chitin actively inhibit fungal growth and enhance disease resistance. Physiological and Molecular Plant Pathology, 35: 215-230.
Khan, S.H., Aked, J. and Magan, N. (2001). Control of the anthracnose pathogen of banana (Colletotrichum musae) using antioxidants alone and in combination with thiabendazole or imazalil. Plant Pathology, 50: 601-608.
Khan, W., Prithiviraj, B. and Smith, D.L. (2003). Chitosan and chitin oligomers increase phenylalanine ammonia-lyase and tyrosine ammonia-lyase activities in soybean leaves. Journal of Plant Physiology, 160: 859-863.
Khan, W.M., Prithiviraj, B. and Smiyh, D.L. (2002). Effect of foliar application of chitin oligosaccharides on photosynthesis of maize and soybean. Photosynthetica, 40: 621-624.
Kim, H.J. (2005). Characterization of bioactive compounds in essential oils, fermented anchovy sauce, and edible plants, and, induction of phytochemicals from edible plants using methyl jasmonate (MeJA) and chitosan. PhD Thesis, Clemson University, USA, pp. 178.
Klarzynski, O., Plesse, B., Joubert, J.M., Yvin, J.C., Kopp, M., Kloareg, B. and Fritig, B. (2000). Linear β-1,3-glucans are elicitors of defense responses in tobacco. Plant Physiology, 124: 1027-1037.
Klein, J.D. and Lurie, Z. (1991). Postharvest heat treatment and fruit quality. Post-harvest News Information, 2: 15-19.
Kobayashi, I., Nakajima, M., Nabetani, H., Kikuchi, Y., Shohno, A. and Satoh, K. (2001). Preparation of micron-scale monodisperse oil-in-water microspheres by microchannel emulsification. Journal of American Oil Chemists’ Society, 78: 797-802.
Köller, W., Allan, C.R. and Kolattukudy, P.E. (1982). Role of cutinase and cell wall degrading enzymes in infection of Pisum sativum by Fusarium solani f. sp. pisi. Physiological Plant Pathology, 20: 47-60.
211
Kombrink, E. and Somssich, I.E. (1995). Defense responses of plants to pathogens. Advances in Botanical Research, 21: 1-34.
Kongkaew, K., Niyomlao, W., Fuggate, P. and Chandrachang, S. (2005). Preharvest chitosan sprays for the control of postharvest diseases and q ‘N k ’ g g g . 31st Congress of Science and Technology of Thailand, Suranaree University of Technology.
Kortekamp, A. and Zyprian, E. (2003). Characterization of Plasmopara-resistance in grapevine using in vitro plants. Journal of Plant Physiology, 160: 1393-1400.
Kranz, J. (1988). Measuring plant disease. In: Kranz, J. and Rotem, J. (eds.). Experimental Techniques in Plant Disease Epidemiology. Springer, Berlin. pp. 35-50.
Kremer-Köhne, S. (1999). Hot water treatment of avocado fruit to induce cold tolerance. South African Avocado Growers’ Association Yearbook, 22: 48-50.
Kulpinsky, P., Nishimura, S.I. and Tokura, S. (1997). Preparation and characterization of functionalized chitosan fibers. Advances in Chitin Science, 2: 334–338.
Kumah, P., Appiah, F. and Opoku-Debrah, J.K. (2011). Effect of hotwater treatment on quality and shelf-life of Keitt mango. Agriculture and Biology Journal of North America, 2: 806-817.
Kurita, K (1998). Chemistry and application of chitin and chitosan. Polymer and Degradation Stability, 59: 117.
Laflamme, P., Benhamou, N., Bussieres, G. and Dessureault, M (1999). Differential effect of chitosan on root rot fungal pathogens in forest nurseries. Canadian Journal of Botany, 77: 1460-1468.
Lagaly, G. (1984). Energetische Wechselwirkungen in Dispersionen und Emulsionen. In: Asche, H., Essig, D., Schmidt, P.C. (eds.). Technologie von Salben, Suspensionen und Emulsionen, APV Paperback Series, Vol. 10. Wissenschaftliche Verlagsgesellschaft, Stuttgart. pp. 32-61.
L , ., E b , J. h , . (2 4). P p polymerizable miniemulsions by ultrasonication. Journal of Coating Technology and Research, 1: 65–68.
Lanfontaine, P. J. and Benhamou, N. (1996). Chitosan treatment: An emerging strategy for enhancing resistance of greenhouse tomato plants to infection by Fusarium oxysporium f.sp. radices-lycopersici. Biocontrol Science and Technology, 6: 111-124.
Lang, G. and Clausen, T. (1989). The use of chitosan in cosmetics. In: Skjak-Braek, G. Thorleif Anthosen, T., Standford, P. (eds.). Chitin and Chitosan. Sources, Chemistry, Biochemistry. Physical Properties and Applications. Elsevier Applied Science, London and New York, pp. 139-147.
Lau, C.Y., Othman, F. and Eng, L. (2008). The effect of heat treatment, different packaging methods and storage temperatures on shelf life of dragon fruit (Hylocereus spp.). www.doa.sarawak.gov.my/images/arc_dragon.pdf. (Accessed on 6 April 2009).
212
Le Bellec, F., Vaillant, F. and Imbert, E. (2006). Pitahaya (Hylocereus spp.): A new fruit crop, a market with a future. Fruits, 61: 237-250.
Leandro, L.F.S., Gleason, M.L., Nutter, F.W., Jr, Wegulo, S.N. and Dixon, P.M. (2003). Influence of temperature and wetness duration on conidia and appressoria of Colletotrichum acutatum on symptomless strawberry leaves. Phytopathology, 93: 513-520.
L , M., A , A., h , . G , P. ( 987). Y β-glucosidases. Biotechnology and Genetic Engineering Review, 5: 269-295.
Lee, G.W.J. and Tadros, T.F. (1982). Formation and stability of emulsions produced by dilution of emulsifyable concentrates. Part I. An investigation of the dispersion on dilution of emulsifyable concentrates containing cationic and nonionic surfactants. Colloids and Surfaces, 5: 105-115.
Lee, H., Leon, J. and Raskin, I. (1995). Biosynthesis and metabolism of salicylic acid. Proceedings of the National Academy of Sciences of the United States of America, 92: 4076-4079.
Lee, Y.S., Kim, Y.H. and Kim, S.B. (2005). Changes in the respiration, growth, and vitamin C content of soybean sprouts in response to chitosan of different molecular weights. Horticultural Science, 40: 1333-1335.
Leroux, P. (2004). Chemical control of Botrytis and its resistance to chemical fungicides. In: Elad, Y., Williamson, B., Tudzynski, P. and Delen, N. (eds.). Botrytis: Biology, Pathology and Control. Kluwer Academic: Dordrecht, The Netherlands, pp. 195-222.
Leuba J.L. and Stössel P. (1986) Chitosan and other polyamines: antifungal activity and interaction with biological membranes. In: Muzzarelli, R., Jeauniaux, C., and Gooday, G.W. (Eds.), Chitin in Nature and Technol. Plenum Press, New York. pp. 215–222.
Lewis, N.G. and Yamamoto, Y. (1990). Lignin: occurrence, biogenesis and biodegradation. Annual Reviews in Plant Physiology and Plant Molecular Biology, 41: 455- 496.
Li, H. and Yu, T. (2000). Effect of chitosan on incidence of brown rot, quality and physiological attributes of postharvest peach fruit. Journal of Science, Food and Agriculture, 81: 269-274.
Lifshitz, I.M. and Slyozov, V.V. (1961). The kinetics of precipitation from supersaturated solid solutions. Journal of Physics and Chemistry of Solids, 19: 35-50.
Lim, L.Y., Wan, L.S.C. and Thai, P.Y. (1997). Chitosan microspheres prepared by emulsification and ionotropic gelation. Drug Development and Industrial Pharmacy, 23: 981-985.
Lima, G., De Curtis, F., Castoria, R., Pacifica, S. and De Cicco, V. (1998). Additives and natural products against postharvest pathogens compatibility with antagonistic yeasts. In: Plant Pathology and Sustainable Agriculture. Proceedings of the Sixth SIPaV Annual Meeting, Campobasso, 17-18 September, 1998.
213
Limpanavech, P., Pichyangkura, R., Khunwasi, C., Chadchawan, S., Lotrakul, P., Bunjongrat, P., Chaidee, A. and Akaraeakpanya, T. (2003). The effects of polymer type, concentration and %DD of bicatalyte modified chitosan on flora production of Dendrobium ‘E k ’. N Ch -Chitosan Conference. July 17-18, Chulalongkorn University, Bangkok, Thailand, pp. 60-64.
Lin, D. and Zhao, Y. (2007). Innovation in the development and application of edible coatings for fresh and minimally processed fruits and vegetables. Comprehensive Reviews in Food Science and Food Safety, 6: 60-75.
Lipps, P.E. (1983). Survival of Colletotrichum graminicola on corn. Phytopathology, 66: 1336-1342.
Lipps, P.E. and Deep, I.W. (1991). Influence of tillage and crop rotation on yield, stalk rot, and recovery of Fusarium and Trichoderma spp. from corn. Plant Disease, 75: 828-833.
Liu, J., Tian, S., Meng, X. and Xu, Y. (2007). Effects of chitosan on control of postharvest diseases and physiological responses of tomato fruit. Postharvest Biology and Technology, 44: 300-306.
Liu, X. D., Nishi, N., Tokura, S. and Sakari, N. (2001). Chitosan coated cotton fiber: preparation and physical properties. Carbohydrate Polymers, 44: 233-238.
Liu, X., Guan, Y., Ma, Z., and Liu, H. (2004). Langmuir surface modification and characterization of magnetic polymer nanospheres prepared by miniemulsion polymerization. Langmuir, 20: 10278-10282.
Lobo, L. and Svereika, A. (2003). Coalescense during emulsification 2. Role of small molecules surfactants. Journal of Colloid and Interface Science, 261: 498-507.
Luders, L. and McMahon, G. (2006). The Pitaya or dragon fruit (Hylocereus undatus). Crops, Forestry and Horticulture, Darwin, pp. 1-4.
Macheix, J.J., Fleuriet, A. and Billot, J. (1990). Fruit phenolics. Florida: CRC Press, Inc.
Mader, M., Ungemach, J. and Schloss, P. (1980). The role of peroxidase isoenzyme groups of Nicotiana tabacum in hydrogen peroxide formation. Planta, 147: 467-470.
Makino, Y. and Hirata, T. (1997). Modified atmosphere packaging of fresh produce with a biodegradable laminate chitosan-cellulose and polycaprolactone. Postharvest Biology and Technology, 10: 247-254.
Mandal, S. (2010). Induction of phenolics, lignin and key defense enzymes in eggplant (Solanum melongena L.) roots in response to elicitors. African Journal of Biotechnology, 9: 8038-8047.
Manjunatha, G., Roopa, K.S., Geetha, N.P. and Shetty, H.S. (2008). Chitosan enhances disease resistance in pearl millet against downy mildew caused by Sclerospora graminicola and defence-related enzyme activation. Pest Management Science, 64:1250-1257.
Maqbool, M. (2012). Efficacy of novel edible composite coatings based on gum Arabic and chitosan to enhance storage life of banana. PhD Thesis. The University of Nottingham, Malaysia Campus, Malaysia.
Mari, M. and Guizzardi, M. (1998). The postharvest phase: emerging technologies for the control of fungal disease. Phytoparasitica, 26: 59-66.
214
Mari, M., Bertolini, P. and Pratella, G.C. (2003). Non-conventional methods for the control of postharvest pear diseases. Journal of Applied Microbiology, 94: 761-766.
Martìnez-Camacho, A.P., Cortez-Rocha, M.O., Ezquerra-Brauer, J.M., Graciano-Verdugo, A.Z., Rodriguez-Félix, F., Castillo-Ortega, M.M., Yépiz-Gómez, M.S. and Plascencia-Jatomea, M. (2010). Chitosan composite films: Thermal, structural, mechanical and antifungal properties. Carbohydrate polymers, 82: 305-315.
Masyahit, M., Sijam, K., Awang, Y. and Satar, M.G.M. (2008). Fungi Associated with Diseases on Dragon Fruit (Hylocereus spp.) in Peninsular Malaysia. Pekan Pahang Publishers, Malaysia, pp. 234-237.
Masyahit, M., Sijam, K., Awang, Y. and Satar, M.G.M. (2009). The first report of the occurrence of anthracnose disease caused by Colletotrichum gloeosporioides (Penz.) Penz. & Sacc. on dragon fruit (Hylocereus spp.) in Peninsular Malaysia. American Journal of Applied Sciences, 6: 902-912.
Mayer, A.M. (2006). Polyphenol oxidases in plants and fungi: Going places? A review. Phytochemistry, 67: 2318-2331.
McCallum, J.A. and Walker, J.R.L. (1990). Phenolic biosynthesis during grain development in wheat: changes in phenylalanine ammonia-lyase activity and soluble phenolic content. Journal of Cereal Science, 11: 35-49.
McClements, D.J. (2005). Food emulsions in practice. In: McClements, D.J. (ed.). Food Emulsions: Principles, Practices, and Techniques. Boca Raton, CRC Press, pp. 515-543.
McLusky, S.R., Bennett, M.H., Beale, M.H., Lewis, M.J., Gaskin, P. and Mansfield, J.W. (1999). Cell wall alterations and localized accumulation of feruloyl-30-methoxytyramine in onion epidermis at sites of attempted penetration by Botrytis allii are associated with actin polarisation, peroxidase activity and suppression of flavonoid biosynthesis. The Plant Journal, 17: 523-534.
McNaught, D.A., and Wilkinson, A. (1997). IUPAC compendium of chemical terminology. 2nd ed., Blackwell Scientific Publications, Oxford. pp. 464.
Melanie, L., Ivey, L., Nava-Diaz C. and Miller, S.A. (2004). Identification and management of Colletotrichum acutatum on immature bell peppers. Plant Disease, 88: 1198-1204.
Meng, X. and Tian, S. (2009). Effects of preharvest application of antagonistic yeast combined with chitosan on decay and quality of harvested table grape fruit. Journal of Science of Food and Agriculture, 89: 1838-1842.
Meng, X.H., Li, B.Q., Liu, J. and Tian, S.P. (2008). Physiological responses and quality attributes of table grape fruit to chitosan preharvest spray and postharvest coating during storage. Food Chemistry, 106: 501-508.
Métraux, J.P., Ahl-Goy, P., Staub, T., Speich, J. and Steinemann, A. (1991). lnduced resistance in cucumber in response to 2,6- dichloroisonicotinic acid and pathogens. In: Hennecke, H. and Verma, D.P.S. (eds.). Advances in Molecular Genetics of Plant-Microbe
215
Interactions. Dordrecht, The Netherlands: Kluwer Academic Publishers, pp. 432-439.
Morelló, J.R., Romero, M.P., Ramo, T. and Motilva, M.J. (2005). Evaluation of L-phenylalanine ammonia-lyase activity and phenolic profile in olive drupe (Olea europea L.) from fruit setting period to harvesting time. Plant Science, 168: 65-72.
Mulas, M. and Schirra, M. (2007). The effect of heat conditioning treatments on the postharvest quality of horticultural crops. Stewart Postharvest Reviews, 1: 1-6.
Muñoz, Z., Moret, A. and Garcés, S. (2009). Assessment of chitosan for inhibition of Colletotrichum sp. on tomatoes and grapes. Crop Protection, 28: 36-40.
Muzarelli, R.A.A. (1989). Amphoteric derivatives of chitosan and their biological significance. In: Gudmund, S.B., Thorleif, A. and Paul, S. (eds.). Chitin and Chitosan. Sources, Chemistry, Biochemistry. Physical Properties and Applications. Elsevier Applied Science, London and New York, pp. 87-99.
Muzzarelli, R., Tarsi, R., Filippini, O., Giovanetti, E., Biagini, G. and Varaldo, P.E. (1990). Antimicrobial properties of N-carboxybutyl chitosan. Antimicrobial Agents and Chemotherapy, 34: 2019-2023.
Muzzarelli, R.A.A. (1996). Chitosan-based dietary foods. Carbohydrate Polymers, 29: 309-316.
Muzzarelli, R.A.A., Muzzarelli, C., Tarsi, R., Miliani, M., Gabbanelli, F. and Cartolari, M. (2001). Fungistatic activity of modified chitosans against Saprolegnia parasitica. Biomacromolecules, 2: 165-169.
Nandeeshkumar, P., Sudisha, J., Ramachandra, K., Prakash, H., Niranjana, S. and Shekar, S. (2008). Chitosan induced resistance to downy mildew in sunflower Plasmopara halstedii. Physiological and Molecular Plant Pathology, 72: 188-194.
Narayanasamy, P. (2006). Postharvest pathogens and disease management. John Wiley & Sons, Hoboken, N.J. USA.
Navarro-Tarazaga, M.L., Sothornvit, R. and Perez-Gago, M.B. (2008). Effect of plasticizer type and amount on hydroxyl-propyl methylcellulose-beeswax edible film properties and postharvest quality of coated plums (cv. Angeleno). Journal of Agricultural and Food Chemistry, 56: 9502-9509.
Ncube, N.S., Afolayan, A.J. and Okoh, A.I. (2008). Assessment techniques of antimicrobial properties of natural compounds of plant origin: current methods and future trends. African Journal of Biotechnology, 7: 1797-1806.
Neuhaus, J.M. (1999). Plant chitinases (PR-3, PR-4, PR-8, PR-11). In: Dattan, S.K. and Muthukrishnan, S. (eds.). Pathogenesis-Related Proteins in Plants. CRC Press, pp. 77-105.
Nguyen, D.L. (2006). Current difficulties and solutions for enhancing production and export of Vietnamese fruit. Proceedings of International Seminar on Enhancing Export Competitiveness of Asian Fruits, May 18-19, Bangkok, Thailand, pp. 34-46.
216
Nicolaos, G., Crauste-Manciet, S., Farinotti, D. and Brossard. (2003). Improvement of cefpodoxime proxetil oral absorption in rats by an oil-in-water submicron emulsion. International Journal of Pharmaceutics, 263: 165-171.
Nishimura, Y. (1997). Physiological effects of chitosan administered for long period. Food Style. 21: 50-52.
Nitschke, J., Altenbach, H.J., Malolepszy, T. and Mölleken, H. (2011). A new method for the quantification of chitin and chitosan in edible mushrooms. Carbohydrate Research, 346: 1307-1310.
No, H.K. and Meyers, S.P. (1997). Preparation of chitin and chitosan. In: Muzzarelli, R.A.A. and Peter, M.G. (eds.). Chitin Handbook. European Chitin Society, Grottammare AP, Italy, pp. 475-489.
Northover, J., and Zhou, T. (2002). Control of rhizopus rot of peaches with postharvest treatments of tebuconazole, fludioxonil, and Pseudomonas syringae. Canadian Journal of Plant Pathology, 24: 144-153.
Okey, E.N., Duncan, E.J, Sirju-charran, G. and Sreenivasan, T.N. (1997). Phytophthora canker resistance in cacao-role of peroxidase, polyphenol oxidase and phenylalanine ammonia-lyase. Phytopathology, 145: 295-299.
Ortega, X., Velasquez, J.C. and Pérez, L.M. (2005). IP3 production in the hypersensitive response of lemon seedlings against Alternaria alternata involves active protein tyrosine kinases but not a G-protein. Biological Research, 38: 89-99.
Öz T ş , L. ( 998). C ph g and edible coating effects on storage life and quality of tomatoes. Journal of Food Processing and Preservations, 22: 303-320.
Palmateer, A.J., Ploetz, R.C., Santen, E. and Correll, J.C. (2007). First report of anthracnose caused by Colletotrichum gloeosporioides on Pitaya. Plant Disease, 91: 631-631.
Paull, R.E. and Chen, N.J. (1989). Waxing and plastic wraps influence water loss from papaya fruit during storage and ripening. Journal of American Society for Horticultural Sciences, 114: 937-942.
Paull, R.E., Nishijima, W., Reyes, M. and Cavaletto, C. (1997). Postharvest handling and losses during marketing of papaya (Carica papaya L.). Postharvest Biology and Technology, 11: 165-179.
Paz-Lago, D., Borges Jr., A., Gutierrez, A., Borges, A., Cabrera, G., Ramirez, M.A. and Falcon, A. (2000). Tomato-Fusarium oxysporum interactions: II-Chitosan and MSB induced resistance against FOL in young tomato plants. Cultivos Tropicales, 21: 17-20.
Pearce, R.B. and Ride, J.P. (1982). Chitin and related compounds as elicitors of the lignification response in wounded wheat leaves. Physiology and Molecular Plant Pathology, 20: 119-123.
Pen, L.T. and Jiang, Y .M. (2003). Effects of chitosan coating on shelf life and quality of fresh-cut Chinese water chestnut. Lebensmittel-Wissenschaft und-Technologie, 36: 359-364.
Peng, M. and Kuc, J. (1992). Peroxidase generated hydrogen peroxide as a source of antifungal activity in vitro and on Tobacco leaf disks. Phytopathology, 82: 696-699.
217
Pennisi, E. (1992). Sealed in plastic edible film. Science News, 141: 12-13. Pérez-Tello, G.O., Silva-Espinoza, B.A., Vargass-Arispuro, I., Briceño-Torres,
B.O. and Martinez-Tellez, M.A. (2001). Effect of temperature on enzymatic and physiological factors related to chilling injury in carambola fruit (Averrhoa carambola L.). Biochemical and Biophysical Research Communications, 287: 846-851.
Pinto, L.R., Acosta, E.T.R., Távora, F.F.F., Silva, P.M.B. and Porto, V.C. (2010). Effect of repeated cycles of chemical disinfection on the roughness and hardness reline acrylic resins. Gerodonotology, 27: 147-153.
Plascencia-Jatomea, M., Viniegra, G., Olayo, R., Castillo-Ortega, M.M. and Shirai, K. (2003). Effect of chitosan and temperature on spore germination of Aspergillus niger. Macromolecular Bioscience, 3: 582-586.
Prapagdee, B., Kotchadat, K., Kumsopa, A., Visarathanonth, N. (2007). The role of chitosan in protection of soybean from sudden death syndrome caused by Fusarium solani f. sp. glycines. Bioresource Technology, 98: 1353-1358.
Prospieszny, H. and Zielinska, L. (1997). Ultrastructure of leaf cells treated with chitosan. Advances in Chitin Science, 2: 139-144.
Raafat, D., von Bargen, K., Haas, A. and Sahl, H.G. (2008). Insights into the mode of action of chitosan as an antibacterial compound. Applied and Environmental Microbiology, 74: 3764-3773.
Rabea, E.L., El-Badawy, E.L., Rogge, T.M., Steven, C.V. and Steurbaut, W. (2003). Chitosan an antimicrobial agent: Application and mode of action. Biomacromolecules, 4: 1457-1465.
Ragsdale, N.N. and Sisler, H.D. (1994). Social and political implications of managing plant diseases with decreased availability of fungicides in the United States, Annual Review of Phytopathology, 32: 545-557.
Rajendran, N.N., Natrajan, R., Kumar, R.S. and Selvaraj, S. (2010). Acyclovir-loaded chitosan nanoparticles for ocular delivery. Asian Journal of Pharmaceutical Sciences, 4: 220-226.
Ramamoorthy, P.K. and Bono, A. (2007). Antioxidant activity, total phenolic and flavonoid content of Morinda citrifolia fruit extracts from various extraction processes. Journal of Engineering Science and Technology, 2: 70-80.
Rappussi, M.C.C., Pascholati, S.F., Benato, E.A. and Cia, P. (2009). Chitosan reduces infection by Guigardia citricarpa in postharvest ‘ ’ g . Brazilian Archives of Biology and Technology, 52: 513-521.
Raveh, E., Weiss, J., Nerd A, and Mizrahi, Y. (1993). Pitayas (Genus Hylocereus). In: Janick, J. and J.E. Simon (eds.). A New Fruit Crop for the Negev Desert of Israel, New York. pp. 491-495.
Reddy, B.M.V., Arul, J., Angers, P. and Couture, L. (1999). Chitosan treatment of wheat seed induces resistance to Fusarium graminearum and improves soil quality. Journal of Agricultural and Food Chemistry, 47: 1208-1216.
218
Reddy, M.V., Angers, P., Castaigne, F. and Arul, J. (2000). Chitosan effects on blackmold rot and pathogenic factors produced by Alternaria alternata in postharvest tomatoes. Journal of American Society for Horticultural Science, 125: 742-747.
Reddy, M.V., Asselin, A. and Arul. J. (1997). Effect of chitosan on tissue maceration and enzyme production by Erwinia carotovora in potato. Horticultural Science, 32: 511 (Abstract).
Reglinski, T., Elmer, P.A.G., Taylor, J.T., Wood, P.N. and Hoyte, S.M. (2010). Inhibition of Botrytis cinerea growth and suppression of botrytis bunch rot in grapes using chitosan. Plant Pathology, 59: 882-890.
Reglinski, T., Taylor, J.T. and Dick, M.A. (2004). Chitosan induces resistance to pitch canker in Pinus radiata. New Zealand Journal of Forestry Science, 34: 49-58.
Reimers, P.J. and Leach, I.E. (1999). Race-specific resistance to Xanthomonas oryzae pv. Oryzae conferred by bacterial blight resistance gene Xa-10 in rice Oryzae sativa involves accumulation of a lignin-like substance in host tissues. Physiological and Molecular Plant Pathology, 38: 39-55.
Ren, H., Endo, H. and Hayashi, T. (2001). Antioxidative and antimutagenic activities and polyphenol content of pesticide-free and organically cultivated green vegetable using water-soluble chitosan as a soil modifier and leaf surface spray. Journal of the Science of Food and Agriculture. 81: 1426-1432.
Reuveni, R. (1995). Biochemical markers as tools for screening resistance against plant pathogens. In: Reuveni, R. (ed.). Novel Approaches to Integrated Pest Management. Lewis Publisheres, Boca Raton, FL. pp. 21-45.
Reymond, P. and Farmer, E.E. (1998). Jasmonate and salicylate as global signals for defense gene expression. Current Opinion in Plant Biology, 1: 404-411.
Rhoades, J. and Roller, S. (2000). Antimicrobial actions of degraded and native chitosan against spoilage organisms in laboratory media and foods. Applied and Environmental Microbiology, 66: 80-86.
Riddick, T.M. (1968). Zeta-Meter Manual. Zeta, New York. Ride, J.P. (1975). Lignification in wounded wheat leaves in response to fungi
and its possible role in resistance. Physiological Plant Pathology, 5: 125-134.
Ride, J.P. and Pearce, R.B. (1979). Lignification and papilla formation at sites of attempted penetration of wheat leaves by non-pathogenic fungi. Physiological Plant Pathology, 15: 79-92.
Rinaudo, M., Pavlov, G. and Desbrieres, (1999). Solubilization of chitosan in strong acid medium. International Journal of Polymer Analysis and Characterization, 5: 267-276.
Roby, D. Gadelle, A. and Toppan, A. (1987). Chitin oligosaccharides as elicitors of chitinase activity in melon plants. Biochemical and Biophysical Research Communications, 143: 885-892.
Roller, S. and Covill, N. (1999). The antifungal properties of chitosan in laboratory media in apple juice. International Journal of Food Microbiology, 47: 67-77.
219
Romanazzi, G., Karabulut, O.A. and Smilanick, J.L. (2007). Combination of chitosan and ethanol to control postharvest gray mold of table grapes. Postharvest Biology and Technology, 43: 134-140.
Romanazzi, G., Nigro, F., Ippolito, A., Di Venere, D. and Salerno, M. (2002). Effects of pre- and postharvest chitosan treatments to control storage grey mold of table grapes. Journal of Food Science, 67: 1862-1867.
Rösler, J., Krekel, F., Amrhein, N. and Schmid, J. (1997). Maize phenylalanine ammonia-lyase has tyrosine ammonia-lyase activity. Plant Physiology, 113: 175-179.
Rosslenbroich, H.J. and Stuebler, D. (2000). Botrytis cinerea – History of chemical control and novel fungicides for its management. Crop Protection, 19: 557-561.
Rupasinghe, H.P.V. (2008). The role of polyphenols in quality, postharvest handling, and processing of fruits. In: Paliyath, G., Murr, D.P., Handa, A.K. and Lurie, S. (eds.). Postharvest Biology and Technology of Fruits, Vegetables and Flowers. Wiley-Blackwell Publishing, Iowa, USA, pp. 260-281.
Rusu-Balaita, L., Desbrières, J. and Rinaudo, M. (2003). Formation of a biocompatible polyelectrolyte complex: Chitosan-hyaluronan complex stability. Polymer Bulletin, 50: 91-98.
Rybka, K., Arseniuk, E., Wisnies, J. and Racczynska, B. (1998). Comparative studies on the activities of chitinase, β-1, 3-glucanase, peroxidase and phenylalanine ammonia lyase in the leaves of triticale and wheat infected with Stagonospora nodrum. Acta Physiology Planta, 20: 59-66.
Sadurní, N., Solans, C., Nủria, A. and Maria, J.G. (2005). Studies on the formation of O/W nano-emulsions, by low-energy emulsification methods, suitable for pharmaceutical applications. European Journal of Pharmaceutical Sciences, 26: 438-445.
Saladié, M., Matas, A.J., Isaacson, T., Jenks, M.A., Goodwin, S.M, Niklas, K.J., Xiaolin, R., Labavitch, J.M., Shackel, K.A., Fernie, A.R., Lytovchenko, A., ÓNeil, M.A., Watkin, C.B. and Rose, J.K.C. (2007). A reevaluation of the key factors that influence tomato fruit softening and integrity. Plant Physiology, 144: 1012-1028.
Salunkhe, D.K., Boun, H.R. and Reddy, N.R. (1991). Storage processing and nutritional quality of fruits and vegetables. Boston, M.A. USA, CRC Press Inc. pp. 156-161.
Sandford, P. (1989). Chitosan: commercial uses and potential applications. In: Skjak-Braek, G., Anthosen, T. and Standford, P. (eds.). Chitin and Chitosan. Sources, Chemistry, Biochemistry. Physical Properties and Applications. Elsevier Applied Science, London and New York, pp. 51-69.
Sapers, G.M. (1992). Chitosan enhances control of enzymatic browning in apple and pear juice by filtration. Journal of Food Protection, 57:1192-1193.
Sashai, A.S. and Manocha, M.S. (1993). Chitinases of fungi and plants: their involvement in morphogenesis and host-parasite interaction. FEMS Microbiology Reviews, 11: 317-338.
220
Sathiyabama, M. and Balasubrramanian, R. (1998). Chitosan induces resistance components in Arachis hypogaea against leaf rust caused by Puccinia arachidis Speg. Crop Protection, 17: 307-313.
Schafer, W. (1994). Molecular mechanisms of fungal pathogenicity to plants. Annual Reviews of Phytopathology, 32: 461-477.
S h , M., ’Aq , S., C b , P. A g , A. (2 ). C postharvest diseases of fruit by heat and fungicides: Efficacy, residue levels, and residue persistence. A Review. Journal of Agricultural and Food Chemistry, 59: 8531-8542.
S h , M., ’h w , G., -Yehoshua, S. and Fallik, E. (2000). Host pathogen interaction modulated by heat treatment. Postharvest Biology and Technology, 21: 71-85.
Schlosser, E.W. (1980). Preformed internal chemical defense. In: Horsfall, J.G. and Cowling, E.B. (eds.). Plant Disease: An Advanced Treatise. Academic Press, New York, 5: 161-177.
Schuhmann, R. (1995). Physikalische Stabilität parenteraler Fettemulsionen—Entwicklung eines Untersuchungsschemas unter besonderem Aspekt analytischer Möglichkeiten. PhD Thesis. Freie Universität Berlin, Berlin.
Schulz, M.B. and Daniels, R. (2000). Hydroxypropylmethylcellulose (HPMC) as emulsifier for submicron emulsions: Influence of molecular weight and substitution type on the droplet size after high-pressure homogenization. European Journal of Pharmaceutics and Biopharmaceutics. 49: 321-236.
Sekiguchi, S., Miura, Y., Kaneko, H., Nishimura, S.L., Nishi, N., Iwase, M., and Tokura, S. (1994). Molecular weight dependency of antimicrobial activity by chitosan oligomers. In: Nishinari, K. and Doi, E. (eds.). Food Hydrocolloids: Structures, Properties, and Functions. pp. 71-76.
Senaratne, L.K., Wijesundera, R.L.C. and Liyanage, A.S. (1991). Morphological and physiological characters of two isolates of Colletotrichum gloeosporioides from rubber (Hevea brasiliensis). Mycological Research, 95: 1085-1089.
Seo, H.J., Mitsuhashi, K. and Tanibe, H. (1992). In: Brine, C.J., Sandford, P. A. and Zikakis, J.P. (eds.). Advances in Chitin and Chitosan. Elsevier Applied Science: New York, 1992. pp. 34-40.
Seymour, G.B., Taylor, J.E. and Tucker, G.A. (1993). Biochemistry of Fruit Ripening. London, New York: Chapman and Hall.
Shadle, G.L., Wesley, V., Korth, K.L., Chen, F., Lamb, C. and Dixon, R.A. (2003). Phenylpropanoid compounds and disease resistance in transgenic tobacco with altered expression of l-phenylalanine ammonia-lyase. Phytochemistry, 64: 153-161.
Shahidi, F., Kamil, J.K., Jeon, Y.J. and Kim, S.K. (2001). Antioxidant role of chitosan in a cooked cod (Gadus morhua) model system. Journal of Food Lipids. 9: 57-64.
Siefert, F., Langebartels, C., Boller, T., Grossmann, K. (1994). Are ethylene and 1-aminocyclopropane-1-carboxylic acid involved in the induction of chitinase and β-1,3-glucanase activity in sunflower cell-suspension cultures. Planta, 192: 224-232.
221
Sijam, K., Awang, Y. and Satar, M.G.M. (2008). Fungi associated with diseases on dragon fruit (Hylocereus spp.) in Peninsular Malaysia. Proceedings of the Microbes: Biotechnology Engine for Health and Wealth Creation. Hyatt Regency Resort, Kuantan, Pahang Darul Makmur, Malaysia, August 16-19, Malaysian Society for Microbiology, pp. 234-237.
Singh, J. and Tripathi, N.N. (1999). Inhibition of storage fungi of black gram (Vigna mungo L.) by some essential oils. Flavour and Fragrance Journal, 14: 42-44.
Sivakumar, D., Hewarathgamagae, N.K., Wijeratnam, R.S.W. and Wijesundera, R.L.C. (2002). Effect of ammonium carbonate and sodium bicarbonate on anthracnose of papaya. Phytoparasitica, 30: 1-7.
Smilanick, J.L., Mansour, M.F., Mlikota Gabler, F. and Sorenson, D. (2008). Control of citrus postharvest green mold and sour rot by potassium sorbate combined with heat and fungicides. Postharvest Biology and Technology, 47: 226-238.
Solans, C., Esquena, J., Forgiarini, A.M., Uson, N., Morales, D. and Izquierdo, P. (2002). Nanoemulsions: formation and properties. In: Mittal, K.L. and Shah, D.O. (eds.). Surfactants in Solution: Fundamentals and Applications. New York, Marcel Dekker, pp. 525.
Solans, C., Izquierdo, P., Nolla, J., Azemar, N. and Garcia-Celma, M.J. (2005). Nano-emulsions. Current Opinion in Colloid and Interface Science, 10(3-4): 102-110.
Sommer, N.F. (1985). Strategies for control of postharvest diseases of selected commodities. In: Kader, A.A., Kasmire, R.F., Mitchell, F.G., Reid, M.S., Sommer, N.F. and Thompson, J.F. (eds.). Postharvest Technology of Horticultural Crops. Cooperative Extension, University of California, Davis, CA, USA. pp. 83-99.
Sonneville-Aubrun, O., Simonne , J.T. L’A , F. (2 4). N -emulsions: A new vehicle for skincare products. Advances in Colloid and Interface Science, 108-109: 145-149.
Spadaro, D. and Gullino, M.L. (2004). State of the art and the future prospects of the biological control of postharvest fruit and diseases. International Journal of Food Microbiology, 91: 185-194.
Stone, A.G., Vallard, G.E., Cooperband, L.R., Rotenberg, D., Darby, H.M., James, R.V., Steveson, W.R. and Goodman, R.M. (2003). Effect of organic amendments on soil borne and foliar disease in field-grown snap bean and cucumber. Plant Disease. 87: 1037-1042.
Stössel, O. and Leuba, J.L. (1984). Effect of chitosan, chitin and some amino sugars on growth of various soil borne phytopathogenic fungi. Journal of Phytopathology, 111: 82-90
Strack, D. (1997). Phenolic metabolism. In: Dey, P.M., Harborne, J.B. (eds.). Plant Biochemistry. Academic Press, San Diego, pp. 387-416.
Sun, X.J., Bi, Y., Li, Y.C., Han, R.F. and Ge, Y.H. (2008). Postharvest chitosan treatment induces resistance in potato against Fusarium sulphureum. Agricultural Sciences in China, 7: 615-621.
Sutton, B.C. (1992). The genus Glomerella and its anamorph Colletotrichum. In: Bailey, J.A. and Jeger, M.J. (eds.). Colletotrichum Biology, Pathology and Control. CAB International, Wallingford, pp. 402.
222
Taba, S., Mikami, D., Takaesu, K., Ooshiro, A., Moromizato, Z., Nakasone, S. and Kawano. S. (2006). Anthracnose of pitaya (Hylocereus undatus) by Colletotrichum gloeosporioides. Japanese Journal of Phytopathology, 72: 25-27.
Tadros, T., Izquierdo, R., Esquena, J. and Solans, C. (2004). Formation and stability of nano-emulsions. Advances in Colloid and Interface Science 108-109: 303-318.
Taha, E.I., Al-Saidan, S., Samy, A.M. and Khan, M.A. (2004). Preparation and in vitro characterization of self-nanoemulsified drug delivery system (SNEDDS) of all-trans-retinol acetate. International Journal of Pharmaceutics, 285: 109-119.
Takahashi, L.M., Rosa, D.D., Basseto, M.A., de Souza, H.G. and Furtado, E.L. (2008). First report of Colletotrichum gloeosporioides on Hylocereus megalanthus in Brazil. Australasian Plant Disease Notes, 3: 96-97.
Teddy, F.T. (2008). Dragon fruit: Enter the dragon. Agri Business Week, http://www.agribusinessweek.com/dragon-fruit-enter-the-dragon/ 17 Sep 2008.
Tejchgraber, P., Popper, L. and Knorr, D. (1991). Chitosan as an elicitor for the production of chitinase, an antifungal enzyme from soybean seeds. Agro Food Industry Hi-Tech, 11-14.
Terry, L.A., and Joyce, D.C. (2004). Elicitors of induced disease resistance in postharvest horticultural crops: A brief review. Postharvest Biology and Technology, 32: 1-13.
Tiburzy, R. and Reisener, H.J. (1990). Resistance of wheat to Puccinia graminis f. sp. tritici: Association of the hypersensitive reaction with cellular accumulation of lignin like material and callose. Physiological and Molecular Plant Pathology, 36: 109-120.
Tikhonov, V.E., Stepnova, E.A., Babak, V.G., Yamskov, I.A., Palma-Guerrero, J., Jansson, Hans-Börje, Lopez-Llorca, L.V., Salinas, J. Gerasimenko, D.V., Avdienko, I.D. and Varlamov, V.P. (2006). Bactericidal and antifungal activities of a low molecular weight chitosan and its N-/2(3)-(dodec-2-enyl) succinoyl/-derivatives. Carbohydrate Polymers, 64: 66-72.
Tonon, C., Andreu, A., Aued, M.E., van Damme, M., Huarte, M. and Daleo, G.R. (1998). Defense reactions in potato cultivars following infection with two races of Phytophthora infestans. American Journal of Potato Research, 41: 319-325.
Tränkner, A. (1991). Use of agricultural and municipal organic wastes to develop suppressiveness to plant pathogens. In: Tjamos, E.C., Papavizas, G.C. and Cook, R.J. (eds.). Biological Control of Plant Diseases: Progress and Challenges for the Future. Plenum Press, New York, pp. 35-42.
Traver, T. (2006) Food nanotechnology. A scientific status summary synopsis. Food Technology, 60: 22-26.
Tripathi, P. and Dubey, N.K. (2004). Exploitation of natural products as an alternative strategy to control postharvest fungal rotting of fruit and vegetables. Postharvest Biology and Technology, 32: 235-245.
223
Trotel-Aziz, P., Couderchet, M., Vernet, G. and Aziz, A. (2006). Chitosan stimulates defense reactions in grapevine leaves and inhibits development of Botrytis cinerea. European Journal of Plant Pathology, 114: 405-413.
Tsai, G.J. and Su, W.H. (1999). Antibacterial activity of shrimp chitosan against Escherichia coli. Journal of Food Protection, 62: 239-243.
Tsai, G.J., Su, W.H., Chen, H.C. and Pan, C.L. (2002). Antimicrobial activity of shrimp chitin and chitosan from different treatments and applications of fish preservation. Fish Science, 68: 170-177.
Tsai, G.J., Zhang, S.L. and Shieh, P.L. (2004). Antimicrobial activity of a low molecular weight chitosan obtained from cellulase digestion of chitosan. Journal of food Protection, 67: 396-398.
Tsugita, T., Takahashi, K., Muraoka, T. and Fukui, H. (1993). The application of chitin/chitosan for agriculture (in Japanese). Proceedings of Special Session of 7th Symposium on Chitin and Chitosan, Japanese Society for Chitin and Chitosan. Fukui, Japan, p. 21-22.
Tucker, G.A. and Grierson, D. (1987). Fruit ripening. In: Davies, D.D. (ed.). The Biochemistry of Plants a Comprehensive Treatise. Volume 12. Academic Press. pp. 265-318.
Uchida, Y., Izume, M., and Ohtakara, A. (1989). Preparation of chitosan oligomers with purified chitosanase and its application. In: Skjak-Braek, G., Anthonsen, T., and Sandford, P. (eds.). Chitin and Chitosan: Sources, Chemistry, Biochemistry, Physical Properties and Applications. Elsevier London, pp. 373-382.
Ueno, K., Yamaguchi, T., Sakairi, N., Nishi, N. and Tokura, S. (1997). Antimicrobial activity by fractionated chitosan oligomers. In: Domard, A. Roberts, G.A.F. and Varum, K.M. (eds.). Advances in Chitin Science. Vol 11, Jacques Andres, Lyon, pp. 156-161.
UNDP, (2003). Thinking the unthinkable. Bratislava. United Nations Development Programme Bureau for Development Policy Montreal Protocol Unit.
Urban, J. and Tränkner, A. (1993). Control of grey mould (Botrytis cinerea) with fermented compost/water extracts. WPRS Bull., 16: 8-11.
ś , N., G , M.J. S , C. (2 4). F w -in-oil (W/O) nano-emulsions in a water/mixed non-ionic surfactant/oil systems prepared by a low-energy emulsification method. Colloids and Surfaces A: Physicochemical and Engineering Aspects, 250: 415-421.
Utama, I.M.S., Wills, R.B.H., Ben-Yehoshua, S. and Kuek, C. (2002). In vitro efficacy of plant volatiles for inhibiting the growth of fruit and vegetable decay microorganisms. Journal of Agricultural and Food Chemistry, 50: 6371-6377.
Valero, D. and Serrano, M. (2010). Postharvest Biology and Technology for Preserving Fruit Quality. Boca Raton: CRC-Taylor & Francis, pp. 269.
Valgas, C., de Souza, S.M., Smania, E.F.A. and Smania Jr., A. (2007). Screening methods to determine antibacterial activity of natural products. Brazilian Journal of Microbiology, 38: 369-380.
Vamos-Vigyazo, L. (1981). Polyphenol oxidase and peroxidase in fruits and vegetables. Critical Reviews in Food Science and Nutrition, 15: 1320-1325.
224
Van den Ende, G. and Linskens, H.F. (1974). Cutinolytic enzymes in relation to pathogenesis. Annual Reviews of Phytopathology, 12: 247-258.
Van Loon, L.C. and Van Strien, E A. (1999). The families of pathogenesis-related proteins, their activities, and comparative analysis of PR-1 type proteins. Physiological and Molecular Plant Pathology, 55: 85-97.
Vance, C.P., Kirk, T.K., Sherwood, R.T. (1980). Lignification as a mechanism of disease resistance. Annual Reviews Phytopathology, 18: 259-288.
Vander, P., Kjell, M.V., Domard, A., El-Gueddari, N.E. and Moersch-Bacher, B.M. (1998). Comparison of the ability of partially N-acetylated chitosans and oligosaccharides to elicit resistance in wheat leaves. Plant Physiology, 118: 1353-1359.
Wade, H.E. and Lamondia, J.A. (1994). Chitosan inhibits Rhizoctonia fragariae but not strawberry black root rot. Advances in Strawberry Research, 13: 26-31
Wagner, C. (1961). Theorie der Alterung von Niederschlagen dursch Umlosen (Ostwald-Reifung). Zeitschrift fuer Elektrochemie, 65: 581.
Waller, J.M. (1992). Colletotrichum diseases of perennial and other cash crops. In: Bailey, J.A. and Jeger, M.J. (eds.). Colletotrichum: Biology, Pathology and Control. CABI, Wallingford.
Walstra, P. (1996). Emulsion stability. In: Becher, P. (ed.). Encyclopedia of Emulsion Technology, vol. 4. Marcel Dekker, New York, pp. 1-62.
Wang, L., Li, X., Zhang, G., Dong J. and Eastoe, J. (2007). Oil in water nano-emulsions for pesticide formulations. Journal of Colloid and Interface Science, 314: 230-235.
Wells, M.L. and Goldberg, E.D. (1992). Marine submicron particles. Marine Chemistry, 40: 5-18.
Weltzien, H.C. (1992). Biocontrol of foliar fungal diseases with compost extracts. In: Andrews, J.H. and Hirano, S.S. (eds.). Microbial Ecology of Leaves. Plenum Press, New York. pp. 35-42.
Whetten, R. and Sederoff, R. (1995). Lignin biosynthesis. Plant Cell, 7: 1001-1013.
Wijesundera, R.L.C., Bailley, J.A. and Byrde, R.J.W. (1984). Production of pectin lyase by Colletotrichum lindemuthianum in culture and infected bean (Phaseolus vulgaris) tissue. Journal of General Microbiology, 130: 285-290.
Wijesundera, R.L.C., Bailley, J.A., Byrde, R.J.W. and Fielding, A.H. (1989). Cell wall degrading enzymes of Colletotrichum lindemuthianum, their role in the development of bean anthracnose. Physiological and Molecular Plant Pathology, 34: 403-413.
Wilson, C.L. and Wisniewski, M.E. (1989). Biological control of postharvest diseases of fruits and vegetables: an emerging technology. Annual Reviews of Phytopathology, 27: 425-441.
Win, N.K.K., Jitareerat, P. and Kanlayanarat, S. (2005). Preharvest chitosan spraying on leaf spot disease and growth of orchid (Dendrobium missteen). Proceedings of APEC Symposium on Assuring Quality and Safety of Fresh Produce. August 1-3, 2005. Bangkok, Thailand, pp. 457-461

225
Winhab, E.J., Dressler, M., Feigl, K., Fischer, P. and Megias-Alguacil, D. (2005). Emulsion processing – from single-drop deformation to design of complex processes and products. Chemical Engineering Science, 8-9: 2101-2113.
Woods, F., Aynaou, R., Brown, J., Simonne, E., Tuzun, S. and Land, T. (1996). Chitosan delays postharvest ripening of bell peppers. Research Reports, 11: 6.
Wu T., S. Zivanovic, F.A. Draughon and C.E. Sams, (2004). Chitin and chitosan-value-added products from mushroom waste. Journal of Agricultural and Food Chemistry, 52: 7905-7910.
Wu, H.L., Ramachandran, C., Weiner, N.D. and Roessler, B.J. (2001). Topical transport of hydrophilic compounds using water-in-oil nano-emulsions International Journal of Pharmaceutics, 220: 63-75.
Xu, J., Zhao, X., Han, X. and Du, Y. (2007). Antifungal activity of oligochitosan against Phytophthora capsici and other plant pathogenic fungi in vitro. Pesticide Biochemistry and Physiology, 87: 220-228.
Xue, L., Charest, P. M. and Jabaji-Hare. (1998). Systemic induction of p x , ,3, β-glucanases, chitinases and resistance in bean plants by binucleate Rhizoctonia species. Phytopathology, 88: 359-365.
Yao, H., Tian, S. and Wang, Y. (2004). Sodium bicarbonate enhances biocontrol efficacy of yeast on fungus spoilage of pears. International Journal of Food Microbiology, 93: 297-304.
Yimyong, S., Datsenka, T.U., Handa, A.K. and Seraypheap, K. (2011). Hot water treatment delays ripening- b h ‘ k g’ mango fruit during storage. Journal of the American Society for Horticultural Science, 136: 441-451.
Young, S. (2008). New Zealand Agrichemical Manual (Agri Media Ltd: Christchurch, New Zealand).
Yusoff, M.M (2006). Effects of plant support system and intercropping with long bean (Vigna sinensis) on growth, yield and fruit quality of red dragon fruit (Hylocereus polyrhizus). MSc Thesis. Universiti Putra Malaysia, Serdang, Malaysia.
Zahid, N., Ali, A., Manickum, S., Siddiqi, Y and Maqbool, M. (2013). Effectiveness of submicron chitosan dispersion in controlling anthracnose and maintaining quality of dragon fruit. Postharvest Biology and Technology, DOI; 10.1016/j.postharvbio.2013.06.027.
Zahid, N., Ali, A., Manickum, S., Siddiqi, Y. and Maqbool, M. (2012). Potential of chitosan loaded nanoemulsions to control different Colletotrichum spp. and maintain quality of tropical fruits during cold storage. Journal of Applied Microbiology, 113: 925-939.
Zhang, D. and Quantick, P.C. (1997). Effects of chitosan coating on enzymatic browning and decay during postharvest storage of litchi (Litchi sinensis Sonn.) fruit. Postharvest Biology and Technology, 12: 195–202.
Zhang, D. and Quantick, P.C. (1998). Antifungal effects of chitosan coating on fresh strawberries and raspberries during storage. Journal of Horticultural Science and Biotechnology, 73: 763-767.
226
Zhang, M., Tan, T., Yuan, H. and Rui, C. (2003). Insecticidal and fungicidal activities of chitosan and oligo-chitosan. Journal of Bioactive and Compatible Polymer, 18: 391-400.
Zhao. L.Q., Wang, C.X. and Hu, Z.F. (2004). Research for rectorite as natural cosmetics and health-care material. Chinese Journal of Non-metal Industry, 6: 18-22.
Zheng, L.Y. and Zhu, J.F. (2003). Study on antimicrobial activity of chitosan with different molecular weight. Carbohydrate Polymers, 54: 527-530.
Zheng, Y., Shen, L., Yu, M., Fan, B., Zhao, D., Liu, L. and Sheng, J. (2011). Nitric oxide synthase as a postharvest response in pathogen resistance of tomato fruit. Postharvest Biology and Technology, 60: 38-46.
Zhu, S. and Ma, B. (2007). Benzothiadiazole- or methyl jasmonate-induced resistance to Colletotrichum musae in harvested banana fruit is related to elevated defence enzyme activities. Journal of Horticultural Science and Biotechnology, 82: 500-506.
Zhu, X., Wang, Q.M., Cao, J.K. and Jiang, W.B. (2008). Effects of chitosan coating on postharvest quality of mango (Mangifera indica L.cv. Tainong) fruits. Journal of Food Processing and Preservation, 32: 770-784.
Ziani, K., Fernandez-Pan, I., Royo, M. and Mate, J.I. (2009). Antifungal activity of films and solutions based on chitosan against typical seed fungi. Food Hydrocolloids, 23: 2309-2314.
Zucker, M. (1965). Induction of phenylalanine deaminase by light and its relation to chlorogenic acid synthesis in potato tuber tissue. Plant Physiology, 40: 779-784.
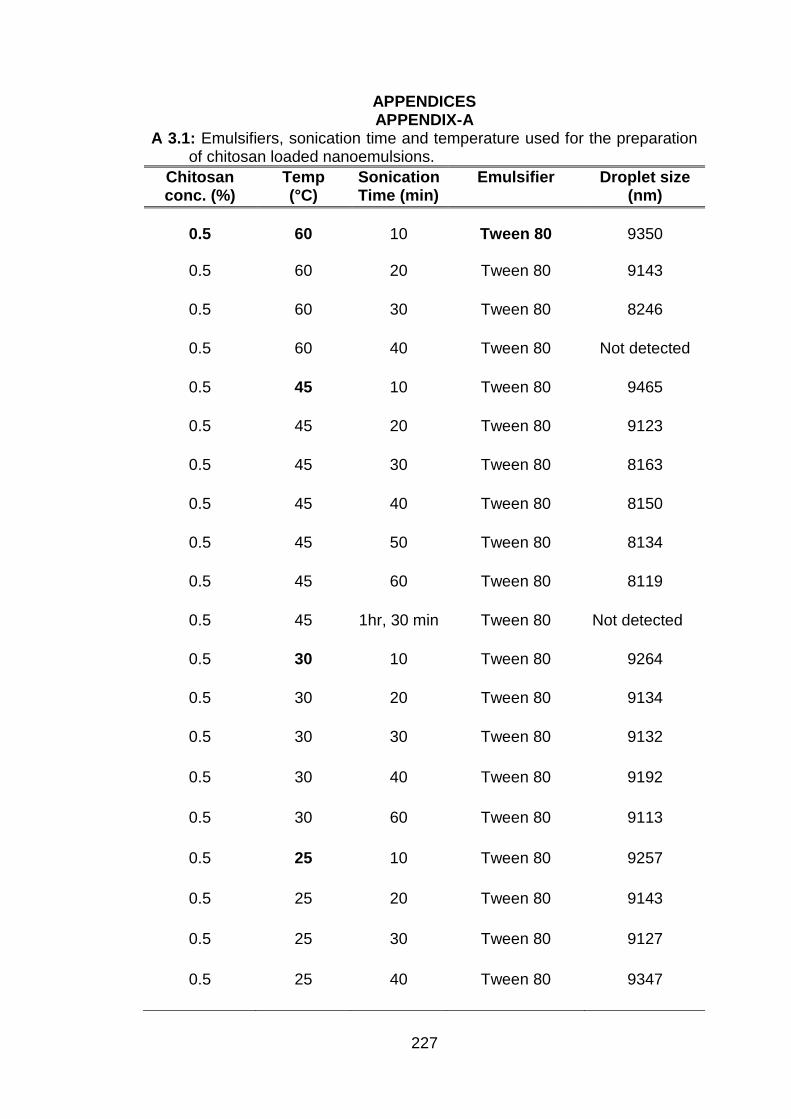
227
APPENDICES APPENDIX-A
A 3.1: Emulsifiers, sonication time and temperature used for the preparation of chitosan loaded nanoemulsions.
Chitosan conc. (%)
Temp (°C)
Sonication Time (min)
Emulsifier Droplet size (nm)
0.5 60 10 Tween 80 9350
0.5 60 20 Tween 80 9143
0.5 60 30 Tween 80 8246
0.5 60 40 Tween 80 Not detected
0.5 45 10 Tween 80 9465
0.5 45 20 Tween 80 9123
0.5 45 30 Tween 80 8163
0.5 45 40 Tween 80 8150
0.5 45 50 Tween 80 8134
0.5 45 60 Tween 80 8119
0.5 45 1hr, 30 min Tween 80 Not detected
0.5 30 10 Tween 80 9264
0.5 30 20 Tween 80 9134
0.5 30 30 Tween 80 9132
0.5 30 40 Tween 80 9192
0.5 30 60 Tween 80 9113
0.5 25 10 Tween 80 9257
0.5 25 20 Tween 80 9143
0.5 25 30 Tween 80 9127
0.5 25 40 Tween 80 9347
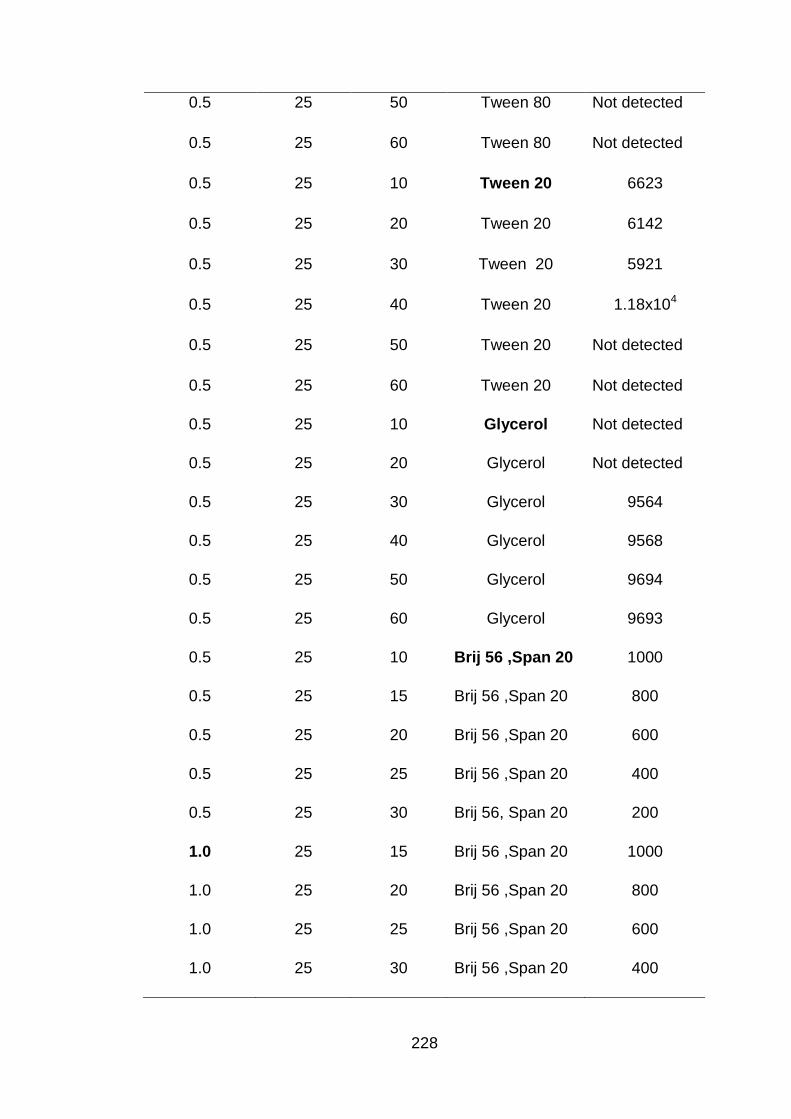
228
0.5 25 50 Tween 80 Not detected
0.5 25 60 Tween 80 Not detected
0.5 25 10 Tween 20 6623
0.5 25 20 Tween 20 6142
0.5 25 30 Tween 20 5921
0.5 25 40 Tween 20 1.18x10⁴
0.5 25 50 Tween 20 Not detected
0.5 25 60 Tween 20 Not detected
0.5 25 10 Glycerol Not detected
0.5 25 20 Glycerol Not detected
0.5 25 30 Glycerol 9564
0.5 25 40 Glycerol 9568
0.5 25 50 Glycerol 9694
0.5 25 60 Glycerol 9693
0.5 25 10 Brij 56 ,Span 20 1000
0.5 25 15 Brij 56 ,Span 20 800
0.5 25 20 Brij 56 ,Span 20 600
0.5 25 25 Brij 56 ,Span 20 400
0.5 25 30 Brij 56, Span 20 200
1.0 25 15 Brij 56 ,Span 20 1000
1.0 25 20 Brij 56 ,Span 20 800
1.0 25 25 Brij 56 ,Span 20 600
1.0 25 30 Brij 56 ,Span 20 400
229
1.0 25 35 Brij 56, Span 20 200
1.5 25 10 Brij 56 ,Span 20 1000
1.5 25 15 Brij 56 ,Span 20 800
1.5 25 20 Brij 56 ,Span 20 600
1.5 25 25 Brij 56 ,Span 20 400
1.5 25 30 Brij 56, Span 20 200
2.0 25 10 Brij 56 ,Span 20 1000
2.0 25 15 Brij 56 ,Span 20 800
2.0 25 20 Brij 56 ,Span 20 600
2.0 25 25 Brij 56 ,Span 20 400
2.0 25 30 Brij 56, Span 20 200
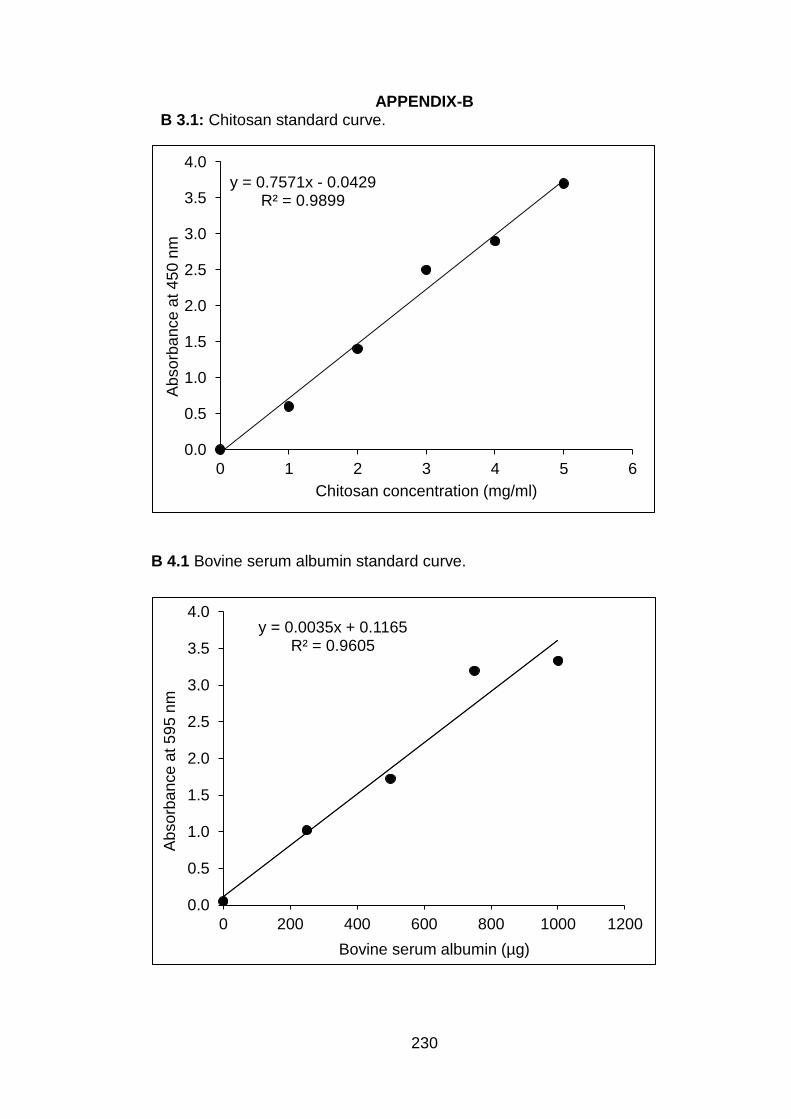
230
APPENDIX-B B 3.1: Chitosan standard curve.
B 4.1 Bovine serum albumin standard curve.
y = 0.0035x + 0.1165 R² = 0.9605
0.0
0.5
1.0
1.5
2.0
2.5
3.0
3.5
4.0
0 200 400 600 800 1000 1200
Ab
so
rba
nce
at 5
95
nm
Bovine serum albumin (µg)
y = 0.7571x - 0.0429 R² = 0.9899
0.0
0.5
1.0
1.5
2.0
2.5
3.0
3.5
4.0
0 1 2 3 4 5 6
Ab
so
rba
nce
at 4
50
nm
Chitosan concentration (mg/ml)
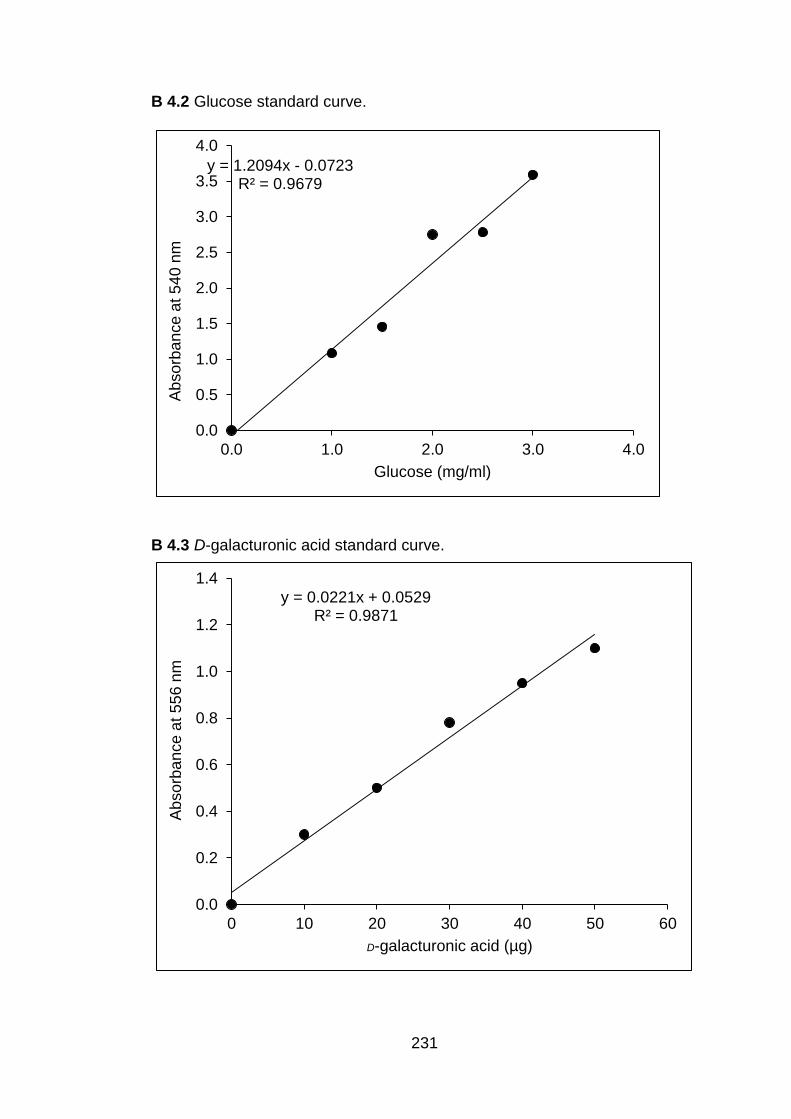
231
B 4.2 Glucose standard curve.
B 4.3 D-galacturonic acid standard curve.
y = 1.2094x - 0.0723 R² = 0.9679
0.0
0.5
1.0
1.5
2.0
2.5
3.0
3.5
4.0
0.0 1.0 2.0 3.0 4.0
Ab
so
rba
nce
at 5
40
nm
Glucose (mg/ml)
y = 0.0221x + 0.0529 R² = 0.9871
0.0
0.2
0.4
0.6
0.8
1.0
1.2
1.4
0 10 20 30 40 50 60
Ab
so
rba
nce
at 5
56
nm
D-galacturonic acid (µg)
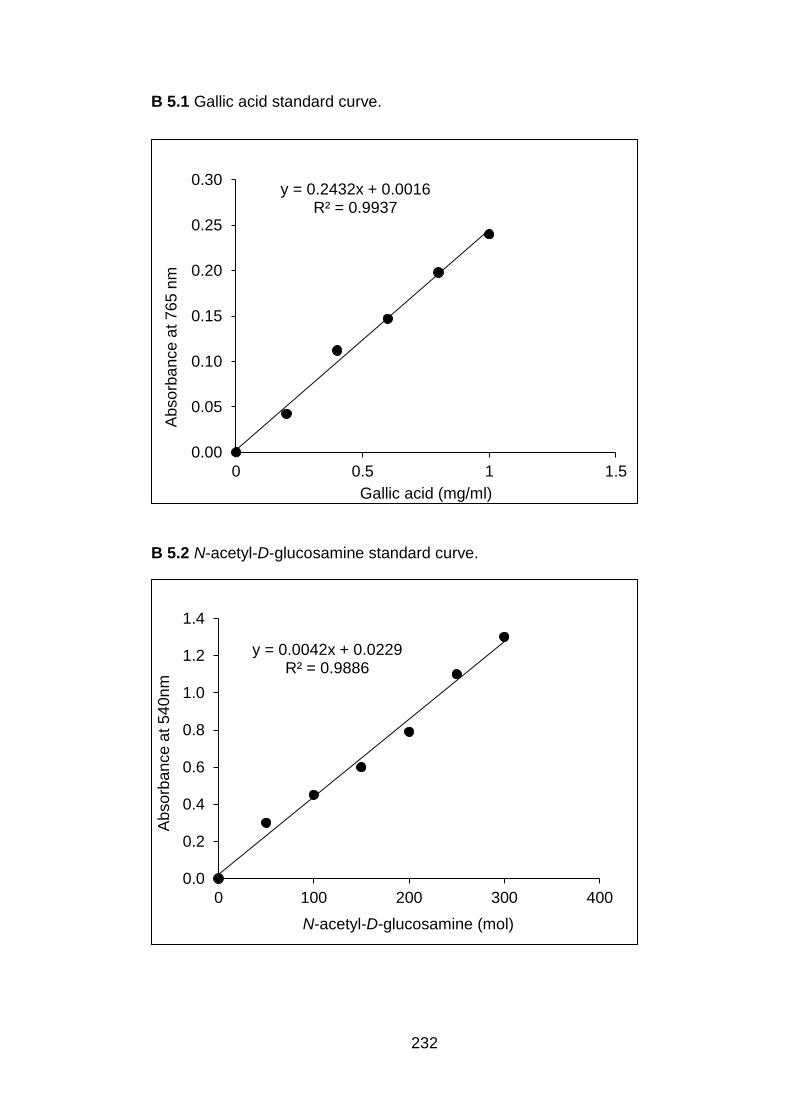
232
B 5.1 Gallic acid standard curve.
B 5.2 N-acetyl-D-glucosamine standard curve.
y = 0.2432x + 0.0016 R² = 0.9937
0.00
0.05
0.10
0.15
0.20
0.25
0.30
0 0.5 1 1.5
Ab
so
rba
nce
at 7
65
nm
Gallic acid (mg/ml)
y = 0.0042x + 0.0229 R² = 0.9886
0.0
0.2
0.4
0.6
0.8
1.0
1.2
1.4
0 100 200 300 400
Ab
so
rba
nce
at 5
40
nm
N-acetyl-D-glucosamine (mol)
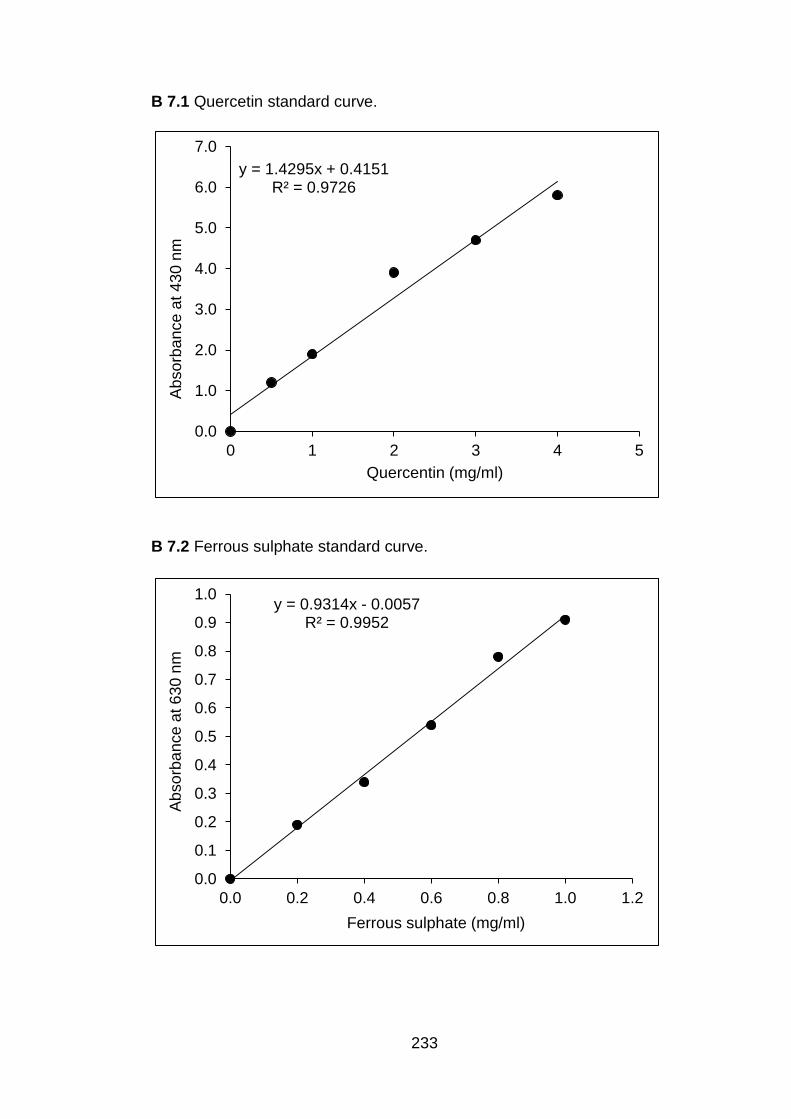
233
B 7.1 Quercetin standard curve.
B 7.2 Ferrous sulphate standard curve.
y = 1.4295x + 0.4151 R² = 0.9726
0.0
1.0
2.0
3.0
4.0
5.0
6.0
7.0
0 1 2 3 4 5
Ab
so
rba
nce
at 4
30
nm
Quercentin (mg/ml)
y = 0.9314x - 0.0057 R² = 0.9952
0.0
0.1
0.2
0.3
0.4
0.5
0.6
0.7
0.8
0.9
1.0
0.0 0.2 0.4 0.6 0.8 1.0 1.2
Ab
so
rba
nce
at 6
30
nm
Ferrous sulphate (mg/ml)
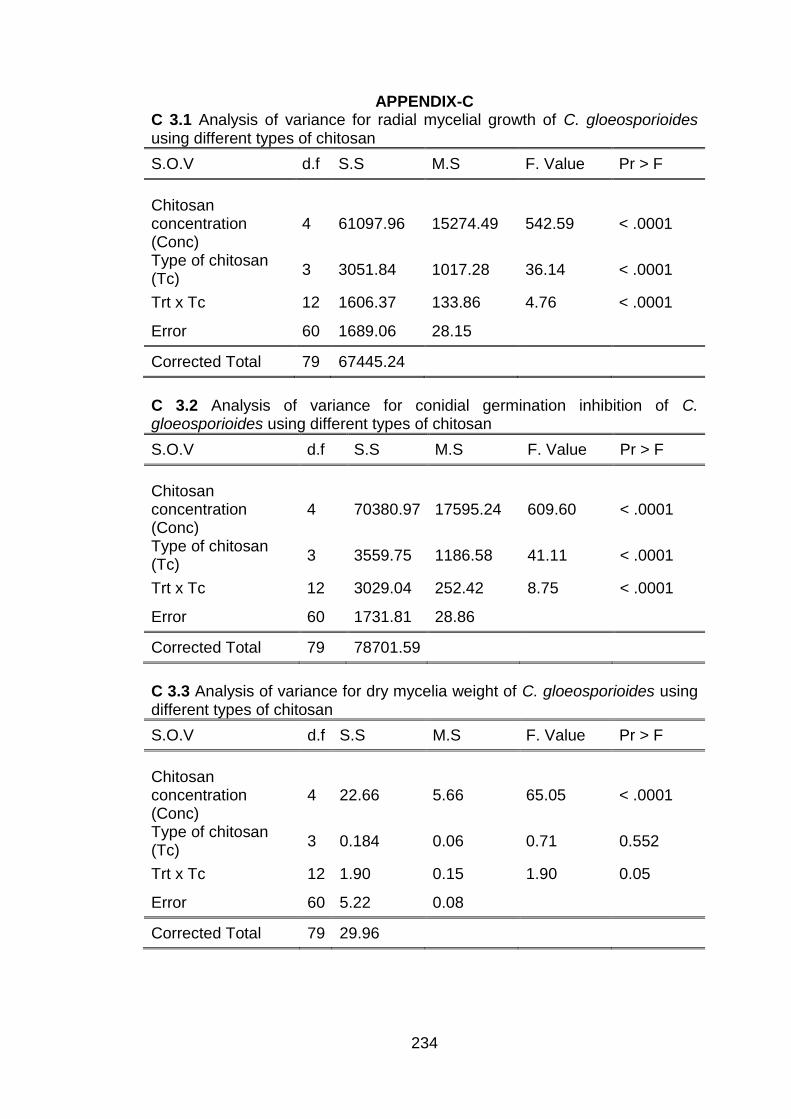
234
APPENDIX-C C 3.1 Analysis of variance for radial mycelial growth of C. gloeosporioides using different types of chitosan
S.O.V d.f S.S M.S F. Value Pr > F
Chitosan concentration (Conc)
4 61097.96 15274.49 542.59 < .0001
Type of chitosan (Tc)
3 3051.84 1017.28 36.14 < .0001
Trt x Tc 12 1606.37 133.86 4.76 < .0001
Error 60 1689.06 28.15
Corrected Total 79 67445.24
C 3.2 Analysis of variance for conidial germination inhibition of C. gloeosporioides using different types of chitosan
S.O.V d.f S.S M.S F. Value Pr > F
Chitosan concentration (Conc)
4 70380.97 17595.24 609.60 < .0001
Type of chitosan (Tc)
3 3559.75 1186.58 41.11 < .0001
Trt x Tc 12 3029.04 252.42 8.75 < .0001
Error 60 1731.81 28.86
Corrected Total 79 78701.59
C 3.3 Analysis of variance for dry mycelia weight of C. gloeosporioides using different types of chitosan
S.O.V d.f S.S M.S F. Value Pr > F
Chitosan concentration (Conc)
4 22.66 5.66 65.05 < .0001
Type of chitosan (Tc)
3 0.184 0.06 0.71 0.552
Trt x Tc 12 1.90 0.15 1.90 0.05
Error 60 5.22 0.08
Corrected Total 79 29.96
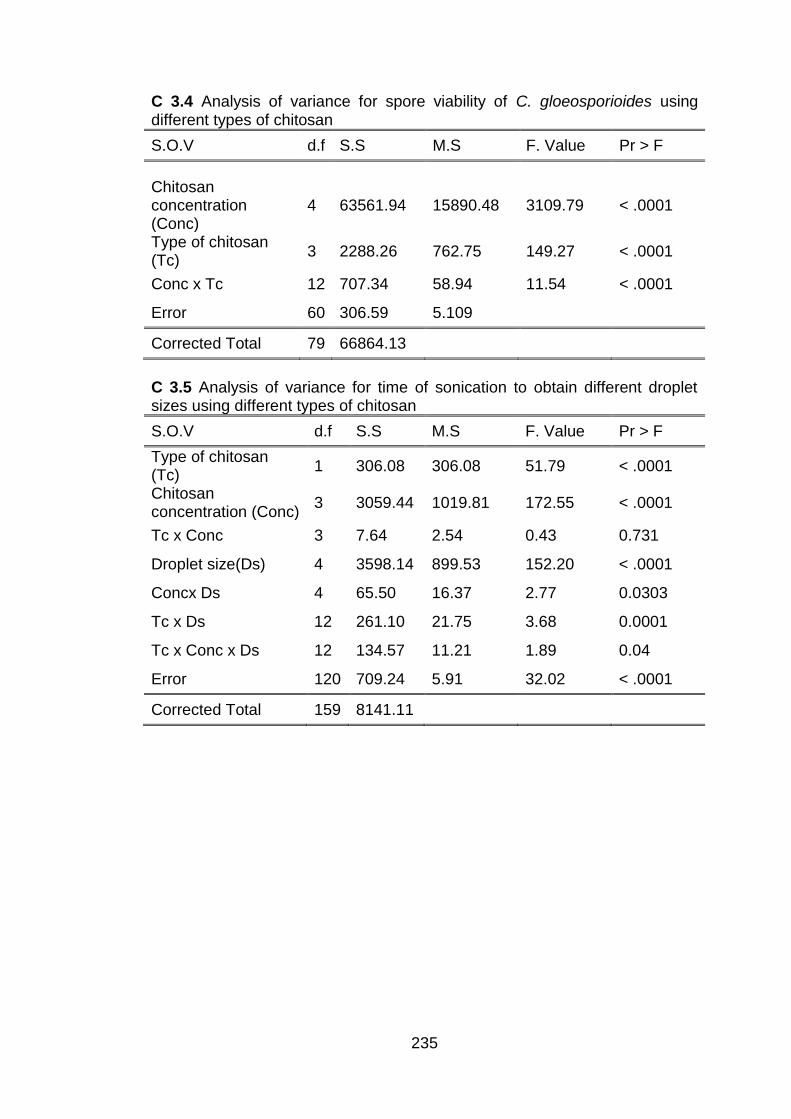
235
C 3.4 Analysis of variance for spore viability of C. gloeosporioides using different types of chitosan
S.O.V d.f S.S M.S F. Value Pr > F
Chitosan concentration (Conc)
4 63561.94 15890.48 3109.79 < .0001
Type of chitosan (Tc)
3 2288.26 762.75 149.27 < .0001
Conc x Tc 12 707.34 58.94 11.54 < .0001
Error 60 306.59 5.109
Corrected Total 79 66864.13
C 3.5 Analysis of variance for time of sonication to obtain different droplet sizes using different types of chitosan
S.O.V d.f S.S M.S F. Value Pr > F
Type of chitosan (Tc)
1 306.08 306.08 51.79 < .0001
Chitosan concentration (Conc)
3 3059.44 1019.81 172.55 < .0001
Tc x Conc 3 7.64 2.54 0.43 0.731
Droplet size(Ds) 4 3598.14 899.53 152.20 < .0001
Concx Ds 4 65.50 16.37 2.77 0.0303
Tc x Ds 12 261.10 21.75 3.68 0.0001
Tc x Conc x Ds 12 134.57 11.21 1.89 0.04
Error 120 709.24 5.91 32.02 < .0001
Corrected Total 159 8141.11
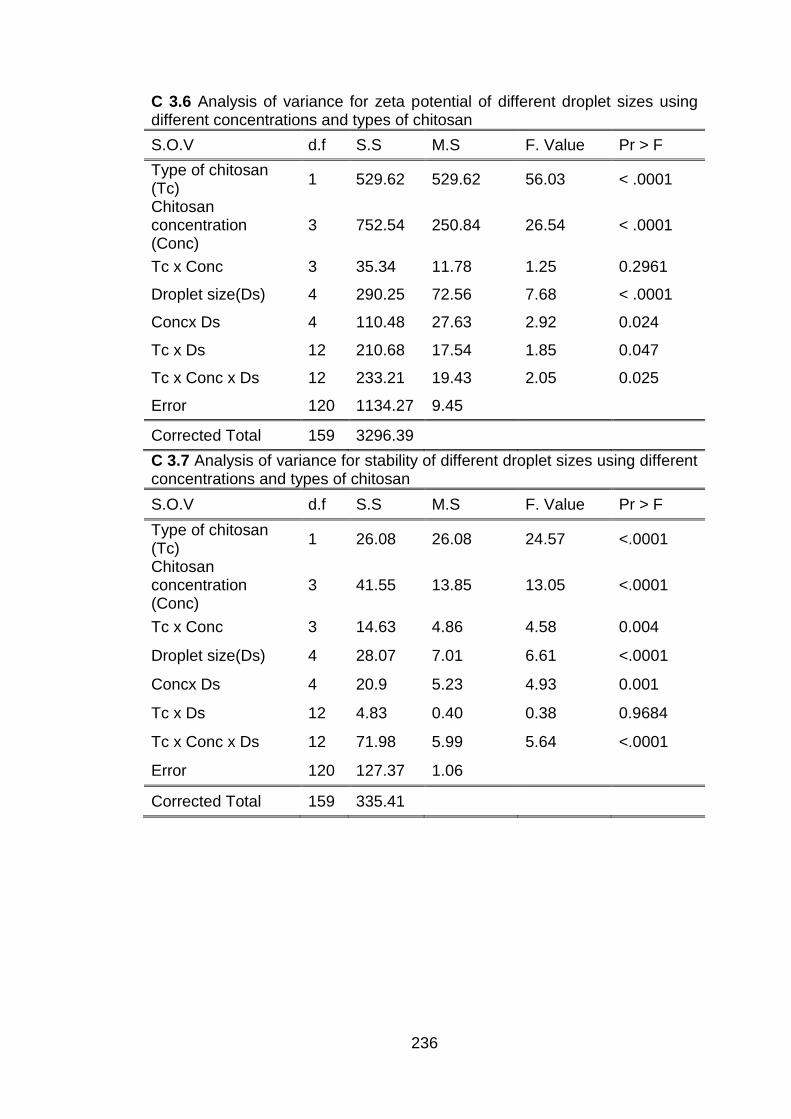
236
C 3.6 Analysis of variance for zeta potential of different droplet sizes using different concentrations and types of chitosan
S.O.V d.f S.S M.S F. Value Pr > F
Type of chitosan (Tc)
1 529.62 529.62 56.03 < .0001
Chitosan concentration (Conc)
3 752.54 250.84 26.54 < .0001
Tc x Conc 3 35.34 11.78 1.25 0.2961
Droplet size(Ds) 4 290.25 72.56 7.68 < .0001
Concx Ds 4 110.48 27.63 2.92 0.024
Tc x Ds 12 210.68 17.54 1.85 0.047
Tc x Conc x Ds 12 233.21 19.43 2.05 0.025
Error 120 1134.27 9.45
Corrected Total 159 3296.39
C 3.7 Analysis of variance for stability of different droplet sizes using different concentrations and types of chitosan
S.O.V d.f S.S M.S F. Value Pr > F
Type of chitosan (Tc)
1 26.08 26.08 24.57 <.0001
Chitosan concentration (Conc)
3 41.55 13.85 13.05 <.0001
Tc x Conc 3 14.63 4.86 4.58 0.004
Droplet size(Ds) 4 28.07 7.01 6.61 <.0001
Concx Ds 4 20.9 5.23 4.93 0.001
Tc x Ds 12 4.83 0.40 0.38 0.9684
Tc x Conc x Ds 12 71.98 5.99 5.64 <.0001
Error 120 127.37 1.06
Corrected Total 159 335.41
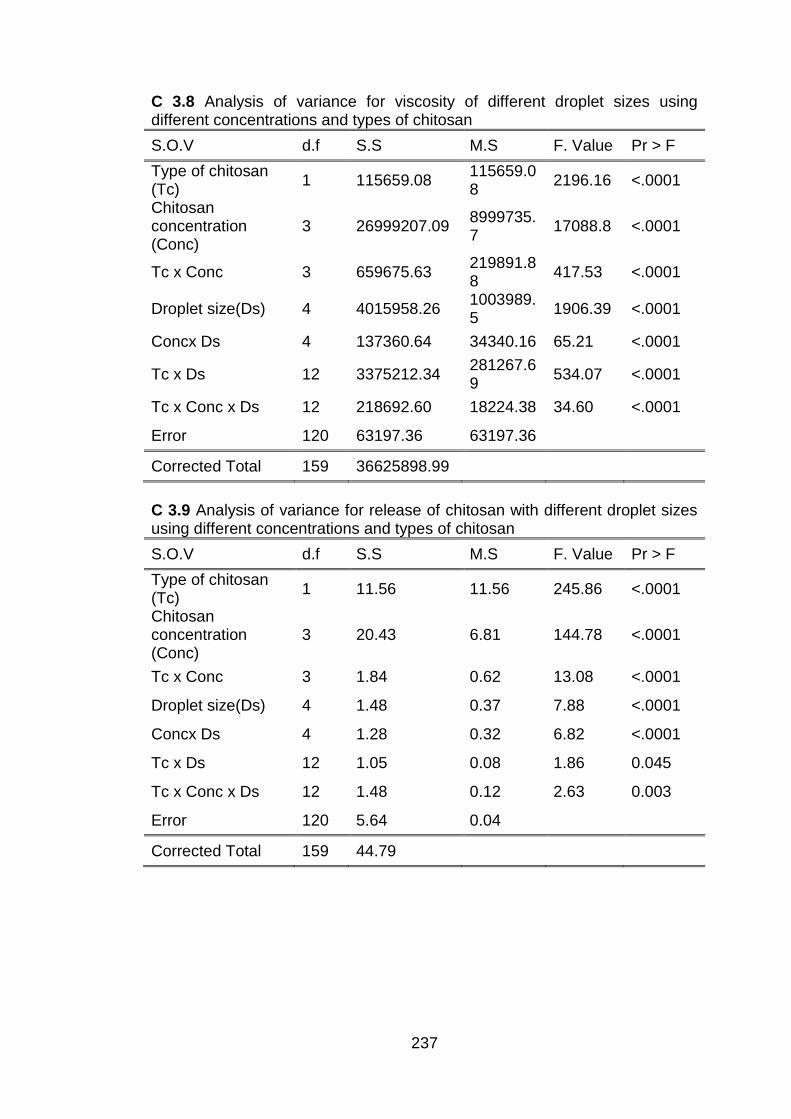
237
C 3.8 Analysis of variance for viscosity of different droplet sizes using different concentrations and types of chitosan
S.O.V d.f S.S M.S F. Value Pr > F
Type of chitosan (Tc)
1 115659.08 115659.08
2196.16 <.0001
Chitosan concentration (Conc)
3 26999207.09 8999735.7
17088.8 <.0001
Tc x Conc 3 659675.63 219891.88
417.53 <.0001
Droplet size(Ds) 4 4015958.26 1003989.5
1906.39 <.0001
Concx Ds 4 137360.64 34340.16 65.21 <.0001
Tc x Ds 12 3375212.34 281267.69
534.07 <.0001
Tc x Conc x Ds 12 218692.60 18224.38 34.60 <.0001
Error 120 63197.36 63197.36
Corrected Total 159 36625898.99
C 3.9 Analysis of variance for release of chitosan with different droplet sizes using different concentrations and types of chitosan
S.O.V d.f S.S M.S F. Value Pr > F
Type of chitosan (Tc)
1 11.56 11.56 245.86 <.0001
Chitosan concentration (Conc)
3 20.43 6.81 144.78 <.0001
Tc x Conc 3 1.84 0.62 13.08 <.0001
Droplet size(Ds) 4 1.48 0.37 7.88 <.0001
Concx Ds 4 1.28 0.32 6.82 <.0001
Tc x Ds 12 1.05 0.08 1.86 0.045
Tc x Conc x Ds 12 1.48 0.12 2.63 0.003
Error 120 5.64 0.04
Corrected Total 159 44.79
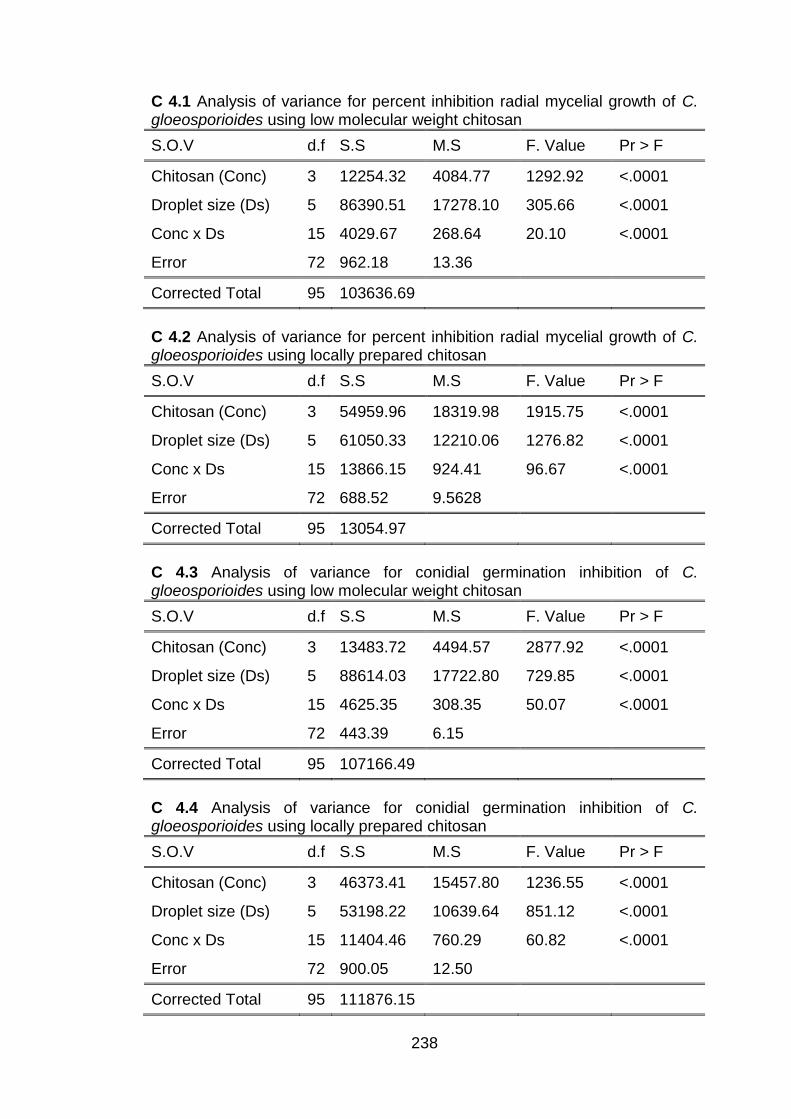
238
C 4.1 Analysis of variance for percent inhibition radial mycelial growth of C. gloeosporioides using low molecular weight chitosan
S.O.V d.f S.S M.S F. Value Pr > F
Chitosan (Conc) 3 12254.32 4084.77 1292.92 <.0001
Droplet size (Ds) 5 86390.51 17278.10 305.66 <.0001
Conc x Ds 15 4029.67 268.64 20.10 <.0001
Error 72 962.18 13.36
Corrected Total 95 103636.69
C 4.2 Analysis of variance for percent inhibition radial mycelial growth of C. gloeosporioides using locally prepared chitosan
S.O.V d.f S.S M.S F. Value Pr > F
Chitosan (Conc) 3 54959.96 18319.98 1915.75 <.0001
Droplet size (Ds) 5 61050.33 12210.06 1276.82 <.0001
Conc x Ds 15 13866.15 924.41 96.67 <.0001
Error 72 688.52 9.5628
Corrected Total 95 13054.97
C 4.3 Analysis of variance for conidial germination inhibition of C. gloeosporioides using low molecular weight chitosan
S.O.V d.f S.S M.S F. Value Pr > F
Chitosan (Conc) 3 13483.72 4494.57 2877.92 <.0001
Droplet size (Ds) 5 88614.03 17722.80 729.85 <.0001
Conc x Ds 15 4625.35 308.35 50.07 <.0001
Error 72 443.39 6.15
Corrected Total 95 107166.49
C 4.4 Analysis of variance for conidial germination inhibition of C. gloeosporioides using locally prepared chitosan
S.O.V d.f S.S M.S F. Value Pr > F
Chitosan (Conc) 3 46373.41 15457.80 1236.55 <.0001
Droplet size (Ds) 5 53198.22 10639.64 851.12 <.0001
Conc x Ds 15 11404.46 760.29 60.82 <.0001
Error 72 900.05 12.50
Corrected Total 95 111876.15
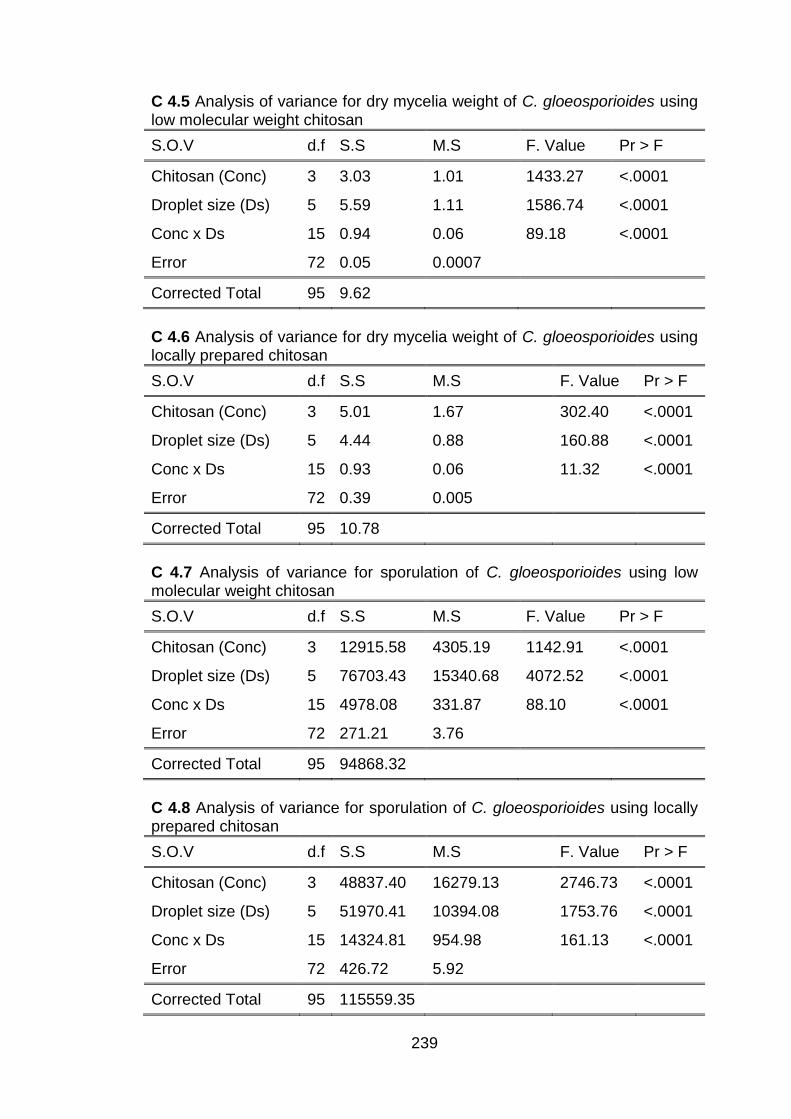
239
C 4.5 Analysis of variance for dry mycelia weight of C. gloeosporioides using low molecular weight chitosan
S.O.V d.f S.S M.S F. Value Pr > F
Chitosan (Conc) 3 3.03 1.01 1433.27 <.0001
Droplet size (Ds) 5 5.59 1.11 1586.74 <.0001
Conc x Ds 15 0.94 0.06 89.18 <.0001
Error 72 0.05 0.0007
Corrected Total 95 9.62
C 4.6 Analysis of variance for dry mycelia weight of C. gloeosporioides using locally prepared chitosan
S.O.V d.f S.S M.S F. Value Pr > F
Chitosan (Conc) 3 5.01 1.67 302.40 <.0001
Droplet size (Ds) 5 4.44 0.88 160.88 <.0001
Conc x Ds 15 0.93 0.06 11.32 <.0001
Error 72 0.39 0.005
Corrected Total 95 10.78
C 4.7 Analysis of variance for sporulation of C. gloeosporioides using low molecular weight chitosan
S.O.V d.f S.S M.S F. Value Pr > F
Chitosan (Conc) 3 12915.58 4305.19 1142.91 <.0001
Droplet size (Ds) 5 76703.43 15340.68 4072.52 <.0001
Conc x Ds 15 4978.08 331.87 88.10 <.0001
Error 72 271.21 3.76
Corrected Total 95 94868.32
C 4.8 Analysis of variance for sporulation of C. gloeosporioides using locally prepared chitosan
S.O.V d.f S.S M.S F. Value Pr > F
Chitosan (Conc) 3 48837.40 16279.13 2746.73 <.0001
Droplet size (Ds) 5 51970.41 10394.08 1753.76 <.0001
Conc x Ds 15 14324.81 954.98 161.13 <.0001
Error 72 426.72 5.92
Corrected Total 95 115559.35
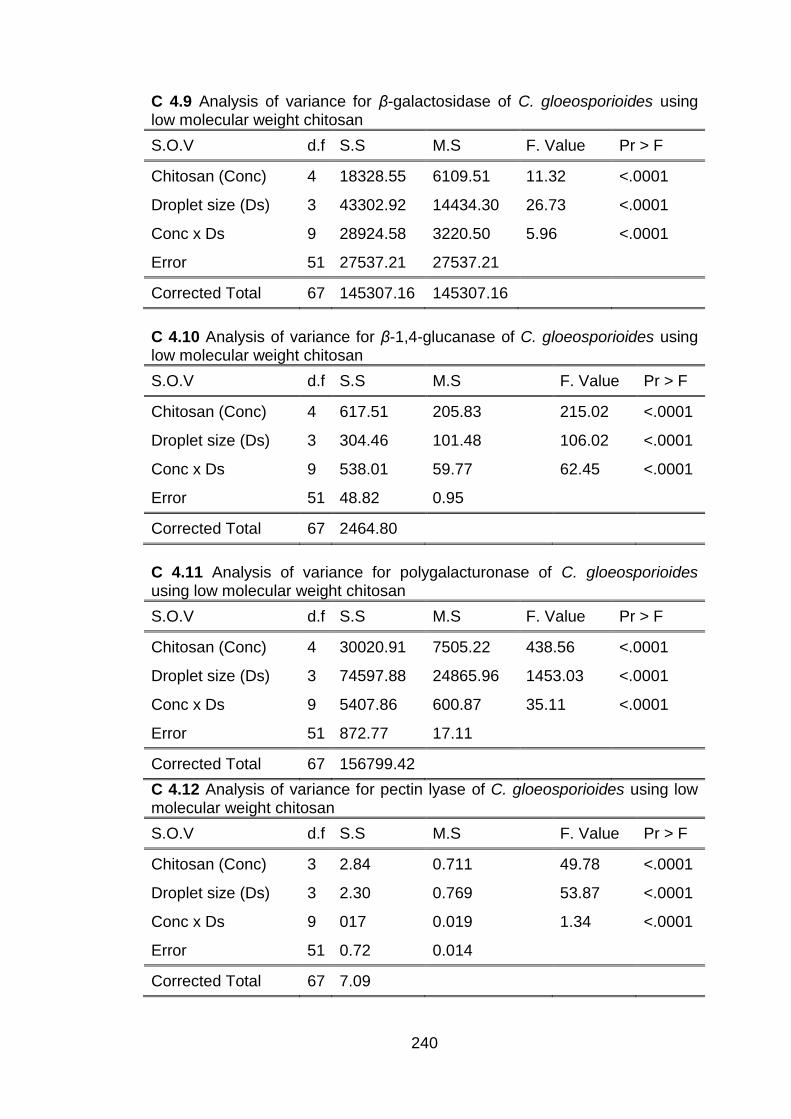
240
C 4.9 Analysis of variance for β-galactosidase of C. gloeosporioides using low molecular weight chitosan
S.O.V d.f S.S M.S F. Value Pr > F
Chitosan (Conc) 4 18328.55 6109.51 11.32 <.0001
Droplet size (Ds) 3 43302.92 14434.30 26.73 <.0001
Conc x Ds 9 28924.58 3220.50 5.96 <.0001
Error 51 27537.21 27537.21
Corrected Total 67 145307.16 145307.16
C 4.10 Analysis of variance for β-1,4-glucanase of C. gloeosporioides using low molecular weight chitosan
S.O.V d.f S.S M.S F. Value Pr > F
Chitosan (Conc) 4 617.51 205.83 215.02 <.0001
Droplet size (Ds) 3 304.46 101.48 106.02 <.0001
Conc x Ds 9 538.01 59.77 62.45 <.0001
Error 51 48.82 0.95
Corrected Total 67 2464.80
C 4.11 Analysis of variance for polygalacturonase of C. gloeosporioides using low molecular weight chitosan
S.O.V d.f S.S M.S F. Value Pr > F
Chitosan (Conc) 4 30020.91 7505.22 438.56 <.0001
Droplet size (Ds) 3 74597.88 24865.96 1453.03 <.0001
Conc x Ds 9 5407.86 600.87 35.11 <.0001
Error 51 872.77 17.11
Corrected Total 67 156799.42
C 4.12 Analysis of variance for pectin lyase of C. gloeosporioides using low molecular weight chitosan
S.O.V d.f S.S M.S F. Value Pr > F
Chitosan (Conc) 3 2.84 0.711 49.78 <.0001
Droplet size (Ds) 3 2.30 0.769 53.87 <.0001
Conc x Ds 9 017 0.019 1.34 <.0001
Error 51 0.72 0.014
Corrected Total 67 7.09
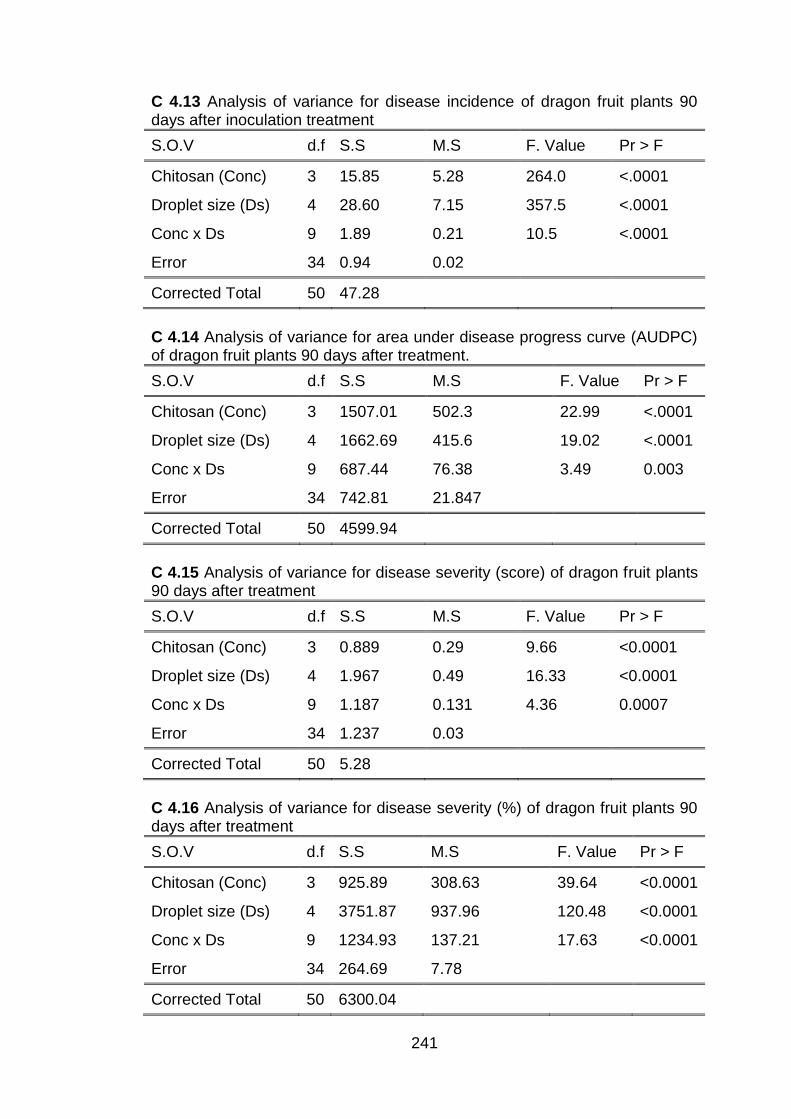
241
C 4.13 Analysis of variance for disease incidence of dragon fruit plants 90 days after inoculation treatment
S.O.V d.f S.S M.S F. Value Pr > F
Chitosan (Conc) 3 15.85 5.28 264.0 <.0001
Droplet size (Ds) 4 28.60 7.15 357.5 <.0001
Conc x Ds 9 1.89 0.21 10.5 <.0001
Error 34 0.94 0.02
Corrected Total 50 47.28
C 4.14 Analysis of variance for area under disease progress curve (AUDPC) of dragon fruit plants 90 days after treatment.
S.O.V d.f S.S M.S F. Value Pr > F
Chitosan (Conc) 3 1507.01 502.3 22.99 <.0001
Droplet size (Ds) 4 1662.69 415.6 19.02 <.0001
Conc x Ds 9 687.44 76.38 3.49 0.003
Error 34 742.81 21.847
Corrected Total 50 4599.94
C 4.15 Analysis of variance for disease severity (score) of dragon fruit plants 90 days after treatment
S.O.V d.f S.S M.S F. Value Pr > F
Chitosan (Conc) 3 0.889 0.29 9.66 <0.0001
Droplet size (Ds) 4 1.967 0.49 16.33 <0.0001
Conc x Ds 9 1.187 0.131 4.36 0.0007
Error 34 1.237 0.03
Corrected Total 50 5.28
C 4.16 Analysis of variance for disease severity (%) of dragon fruit plants 90 days after treatment
S.O.V d.f S.S M.S F. Value Pr > F
Chitosan (Conc) 3 925.89 308.63 39.64 <0.0001
Droplet size (Ds) 4 3751.87 937.96 120.48 <0.0001
Conc x Ds 9 1234.93 137.21 17.63 <0.0001
Error 34 264.69 7.78
Corrected Total 50 6300.04
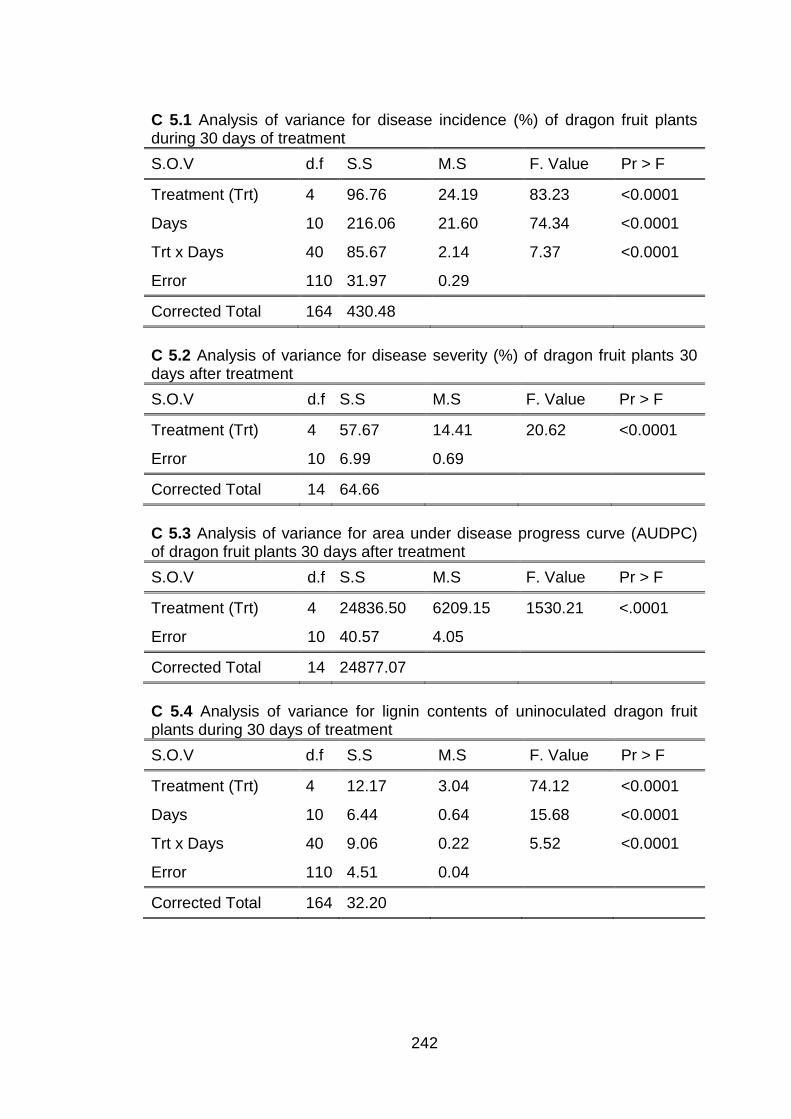
242
C 5.1 Analysis of variance for disease incidence (%) of dragon fruit plants during 30 days of treatment
S.O.V d.f S.S M.S F. Value Pr > F
Treatment (Trt) 4 96.76 24.19 83.23 <0.0001
Days 10 216.06 21.60 74.34 <0.0001
Trt x Days 40 85.67 2.14 7.37 <0.0001
Error 110 31.97 0.29
Corrected Total 164 430.48
C 5.2 Analysis of variance for disease severity (%) of dragon fruit plants 30 days after treatment
S.O.V d.f S.S M.S F. Value Pr > F
Treatment (Trt) 4 57.67 14.41 20.62 <0.0001
Error 10 6.99 0.69
Corrected Total 14 64.66
C 5.3 Analysis of variance for area under disease progress curve (AUDPC) of dragon fruit plants 30 days after treatment
S.O.V d.f S.S M.S F. Value Pr > F
Treatment (Trt) 4 24836.50 6209.15 1530.21 <.0001
Error 10 40.57 4.05
Corrected Total 14 24877.07
C 5.4 Analysis of variance for lignin contents of uninoculated dragon fruit plants during 30 days of treatment
S.O.V d.f S.S M.S F. Value Pr > F
Treatment (Trt) 4 12.17 3.04 74.12 <0.0001
Days 10 6.44 0.64 15.68 <0.0001
Trt x Days 40 9.06 0.22 5.52 <0.0001
Error 110 4.51 0.04
Corrected Total 164 32.20
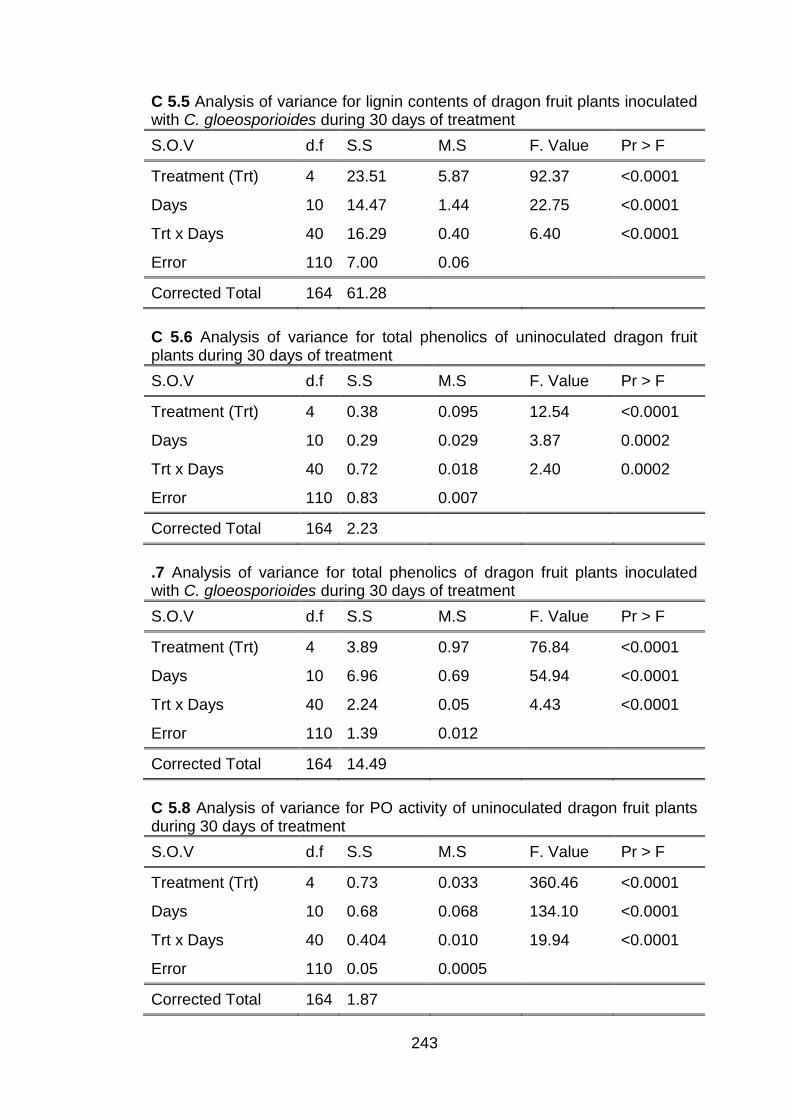
243
C 5.5 Analysis of variance for lignin contents of dragon fruit plants inoculated with C. gloeosporioides during 30 days of treatment
S.O.V d.f S.S M.S F. Value Pr > F
Treatment (Trt) 4 23.51 5.87 92.37 <0.0001
Days 10 14.47 1.44 22.75 <0.0001
Trt x Days 40 16.29 0.40 6.40 <0.0001
Error 110 7.00 0.06
Corrected Total 164 61.28
C 5.6 Analysis of variance for total phenolics of uninoculated dragon fruit plants during 30 days of treatment
S.O.V d.f S.S M.S F. Value Pr > F
Treatment (Trt) 4 0.38 0.095 12.54 <0.0001
Days 10 0.29 0.029 3.87 0.0002
Trt x Days 40 0.72 0.018 2.40 0.0002
Error 110 0.83 0.007
Corrected Total 164 2.23
.7 Analysis of variance for total phenolics of dragon fruit plants inoculated with C. gloeosporioides during 30 days of treatment
S.O.V d.f S.S M.S F. Value Pr > F
Treatment (Trt) 4 3.89 0.97 76.84 <0.0001
Days 10 6.96 0.69 54.94 <0.0001
Trt x Days 40 2.24 0.05 4.43 <0.0001
Error 110 1.39 0.012
Corrected Total 164 14.49
C 5.8 Analysis of variance for PO activity of uninoculated dragon fruit plants during 30 days of treatment
S.O.V d.f S.S M.S F. Value Pr > F
Treatment (Trt) 4 0.73 0.033 360.46 <0.0001
Days 10 0.68 0.068 134.10 <0.0001
Trt x Days 40 0.404 0.010 19.94 <0.0001
Error 110 0.05 0.0005
Corrected Total 164 1.87
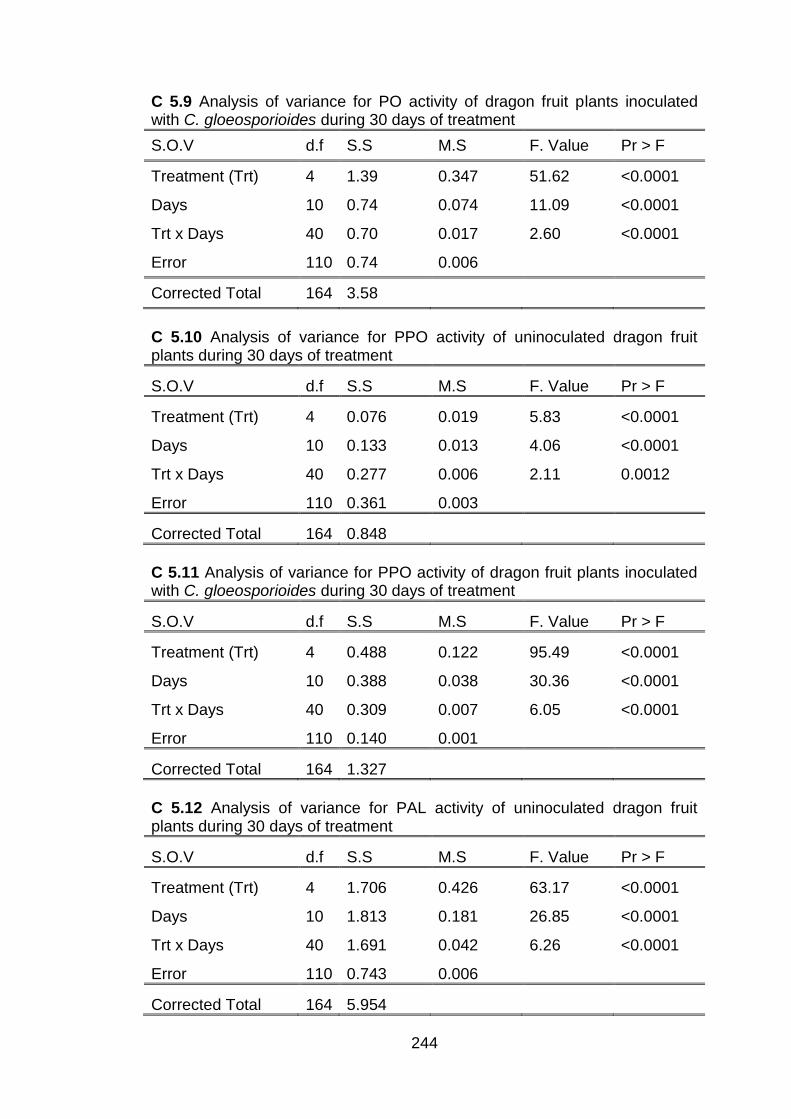
244
C 5.9 Analysis of variance for PO activity of dragon fruit plants inoculated with C. gloeosporioides during 30 days of treatment
S.O.V d.f S.S M.S F. Value Pr > F
Treatment (Trt) 4 1.39 0.347 51.62 <0.0001
Days 10 0.74 0.074 11.09 <0.0001
Trt x Days 40 0.70 0.017 2.60 <0.0001
Error 110 0.74 0.006
Corrected Total 164 3.58
C 5.10 Analysis of variance for PPO activity of uninoculated dragon fruit plants during 30 days of treatment
S.O.V d.f S.S M.S F. Value Pr > F
Treatment (Trt) 4 0.076 0.019 5.83 <0.0001
Days 10 0.133 0.013 4.06 <0.0001
Trt x Days 40 0.277 0.006 2.11 0.0012
Error 110 0.361 0.003
Corrected Total 164 0.848
C 5.11 Analysis of variance for PPO activity of dragon fruit plants inoculated with C. gloeosporioides during 30 days of treatment
S.O.V d.f S.S M.S F. Value Pr > F
Treatment (Trt) 4 0.488 0.122 95.49 <0.0001
Days 10 0.388 0.038 30.36 <0.0001
Trt x Days 40 0.309 0.007 6.05 <0.0001
Error 110 0.140 0.001
Corrected Total 164 1.327
C 5.12 Analysis of variance for PAL activity of uninoculated dragon fruit plants during 30 days of treatment
S.O.V d.f S.S M.S F. Value Pr > F
Treatment (Trt) 4 1.706 0.426 63.17 <0.0001
Days 10 1.813 0.181 26.85 <0.0001
Trt x Days 40 1.691 0.042 6.26 <0.0001
Error 110 0.743 0.006
Corrected Total 164 5.954
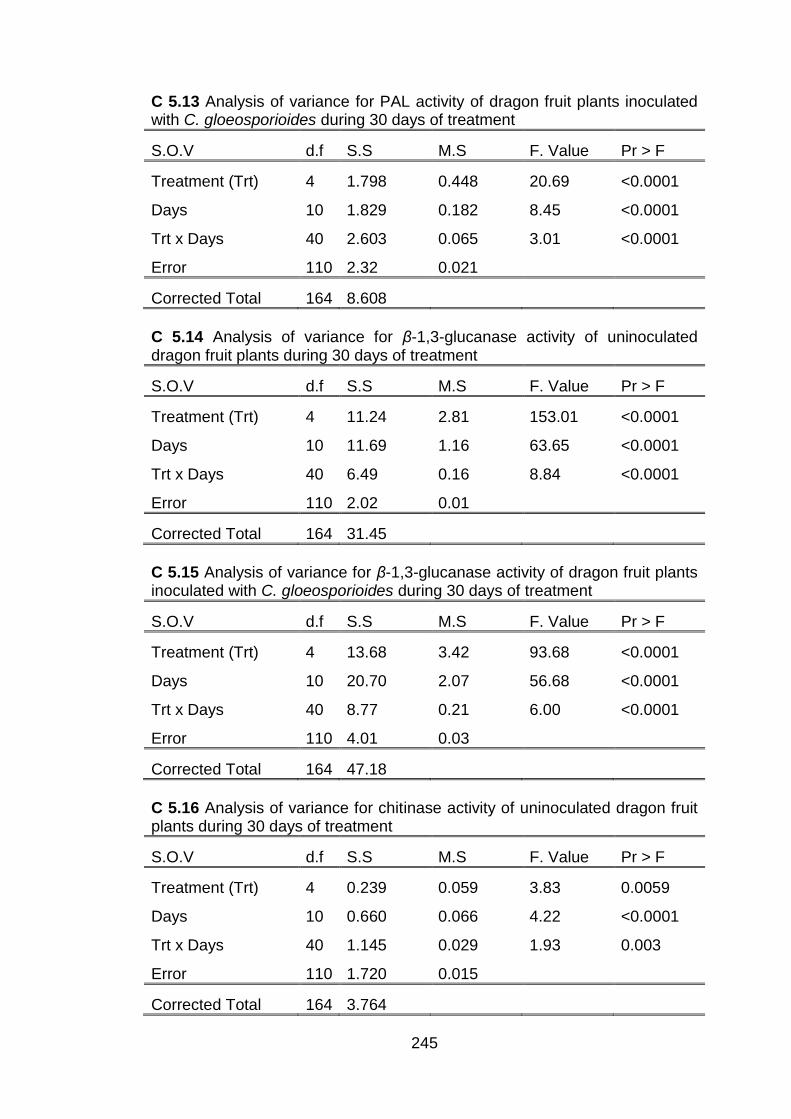
245
C 5.13 Analysis of variance for PAL activity of dragon fruit plants inoculated with C. gloeosporioides during 30 days of treatment
S.O.V d.f S.S M.S F. Value Pr > F
Treatment (Trt) 4 1.798 0.448 20.69 <0.0001
Days 10 1.829 0.182 8.45 <0.0001
Trt x Days 40 2.603 0.065 3.01 <0.0001
Error 110 2.32 0.021
Corrected Total 164 8.608
C 5.14 Analysis of variance for β-1,3-glucanase activity of uninoculated dragon fruit plants during 30 days of treatment
S.O.V d.f S.S M.S F. Value Pr > F
Treatment (Trt) 4 11.24 2.81 153.01 <0.0001
Days 10 11.69 1.16 63.65 <0.0001
Trt x Days 40 6.49 0.16 8.84 <0.0001
Error 110 2.02 0.01
Corrected Total 164 31.45
C 5.15 Analysis of variance for β-1,3-glucanase activity of dragon fruit plants inoculated with C. gloeosporioides during 30 days of treatment
S.O.V d.f S.S M.S F. Value Pr > F
Treatment (Trt) 4 13.68 3.42 93.68 <0.0001
Days 10 20.70 2.07 56.68 <0.0001
Trt x Days 40 8.77 0.21 6.00 <0.0001
Error 110 4.01 0.03
Corrected Total 164 47.18
C 5.16 Analysis of variance for chitinase activity of uninoculated dragon fruit plants during 30 days of treatment
S.O.V d.f S.S M.S F. Value Pr > F
Treatment (Trt) 4 0.239 0.059 3.83 0.0059
Days 10 0.660 0.066 4.22 <0.0001
Trt x Days 40 1.145 0.029 1.93 0.003
Error 110 1.720 0.015
Corrected Total 164 3.764
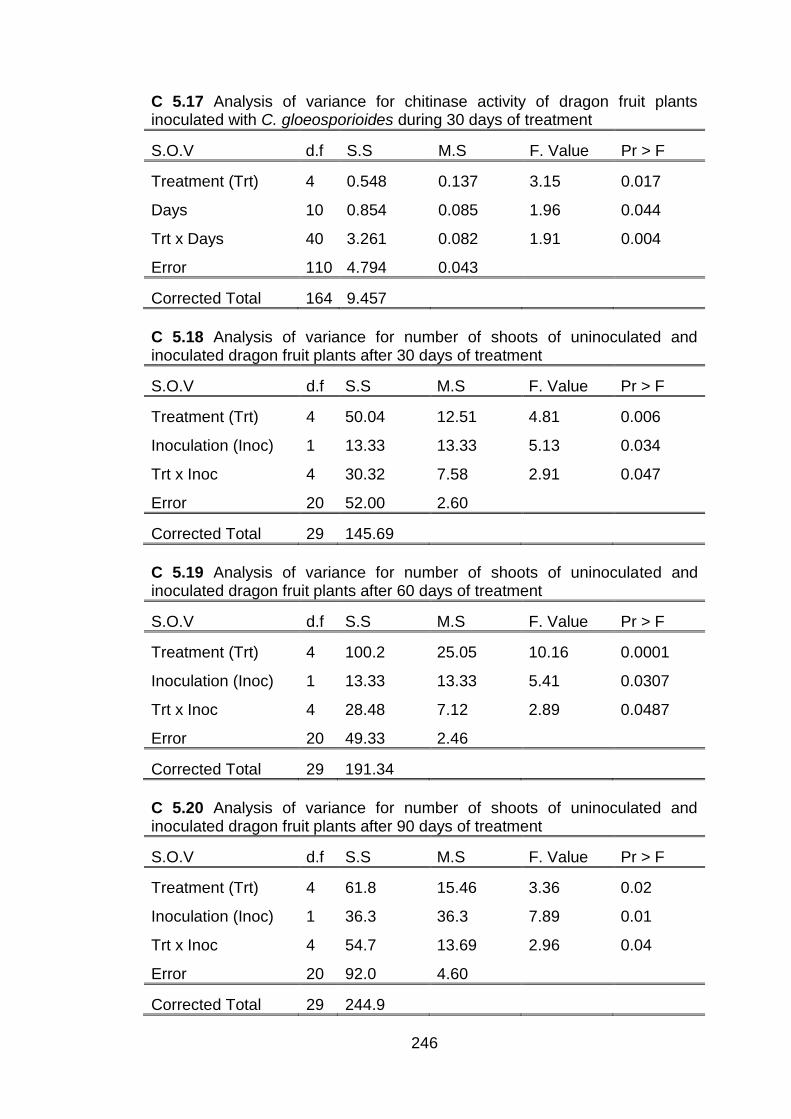
246
C 5.17 Analysis of variance for chitinase activity of dragon fruit plants inoculated with C. gloeosporioides during 30 days of treatment
S.O.V d.f S.S M.S F. Value Pr > F
Treatment (Trt) 4 0.548 0.137 3.15 0.017
Days 10 0.854 0.085 1.96 0.044
Trt x Days 40 3.261 0.082 1.91 0.004
Error 110 4.794 0.043
Corrected Total 164 9.457
C 5.18 Analysis of variance for number of shoots of uninoculated and inoculated dragon fruit plants after 30 days of treatment
S.O.V d.f S.S M.S F. Value Pr > F
Treatment (Trt) 4 50.04 12.51 4.81 0.006
Inoculation (Inoc) 1 13.33 13.33 5.13 0.034
Trt x Inoc 4 30.32 7.58 2.91 0.047
Error 20 52.00 2.60
Corrected Total 29 145.69
C 5.19 Analysis of variance for number of shoots of uninoculated and inoculated dragon fruit plants after 60 days of treatment
S.O.V d.f S.S M.S F. Value Pr > F
Treatment (Trt) 4 100.2 25.05 10.16 0.0001
Inoculation (Inoc) 1 13.33 13.33 5.41 0.0307
Trt x Inoc 4 28.48 7.12 2.89 0.0487
Error 20 49.33 2.46
Corrected Total 29 191.34
C 5.20 Analysis of variance for number of shoots of uninoculated and inoculated dragon fruit plants after 90 days of treatment
S.O.V d.f S.S M.S F. Value Pr > F
Treatment (Trt) 4 61.8 15.46 3.36 0.02
Inoculation (Inoc) 1 36.3 36.3 7.89 0.01
Trt x Inoc 4 54.7 13.69 2.96 0.04
Error 20 92.0 4.60
Corrected Total 29 244.9
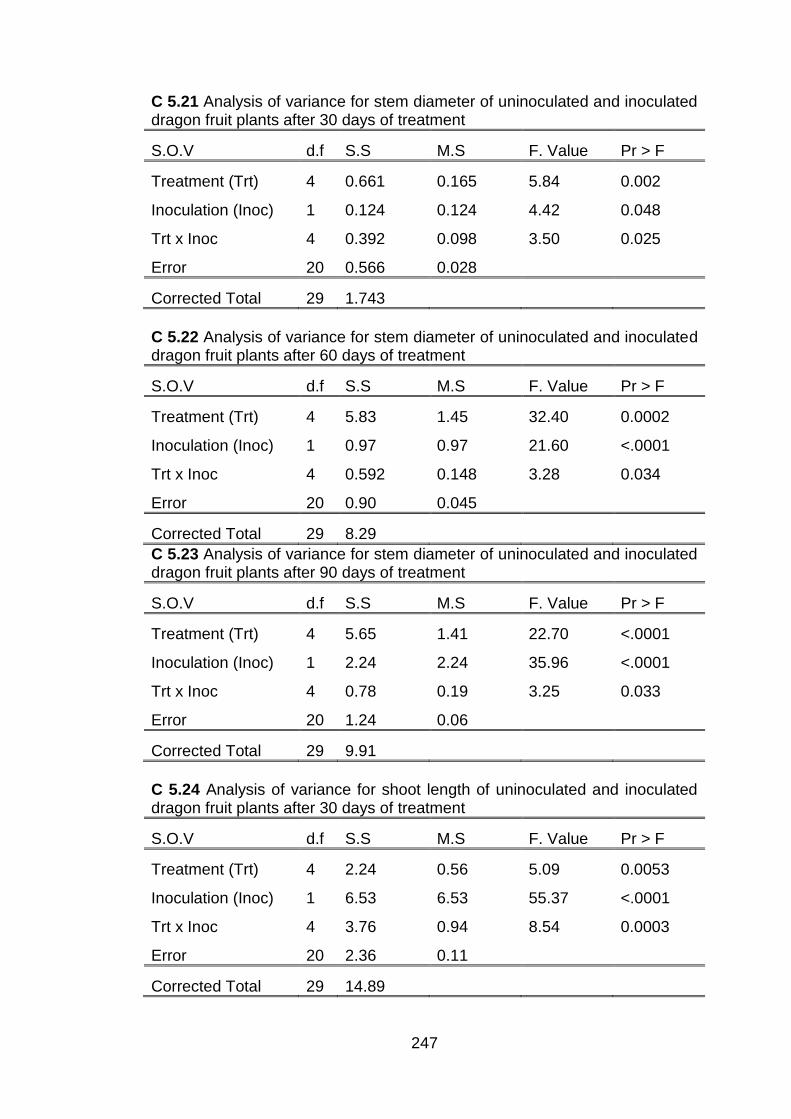
247
C 5.21 Analysis of variance for stem diameter of uninoculated and inoculated dragon fruit plants after 30 days of treatment
S.O.V d.f S.S M.S F. Value Pr > F
Treatment (Trt) 4 0.661 0.165 5.84 0.002
Inoculation (Inoc) 1 0.124 0.124 4.42 0.048
Trt x Inoc 4 0.392 0.098 3.50 0.025
Error 20 0.566 0.028
Corrected Total 29 1.743
C 5.22 Analysis of variance for stem diameter of uninoculated and inoculated dragon fruit plants after 60 days of treatment
S.O.V d.f S.S M.S F. Value Pr > F
Treatment (Trt) 4 5.83 1.45 32.40 0.0002
Inoculation (Inoc) 1 0.97 0.97 21.60 <.0001
Trt x Inoc 4 0.592 0.148 3.28 0.034
Error 20 0.90 0.045
Corrected Total 29 8.29
C 5.23 Analysis of variance for stem diameter of uninoculated and inoculated dragon fruit plants after 90 days of treatment
S.O.V d.f S.S M.S F. Value Pr > F
Treatment (Trt) 4 5.65 1.41 22.70 <.0001
Inoculation (Inoc) 1 2.24 2.24 35.96 <.0001
Trt x Inoc 4 0.78 0.19 3.25 0.033
Error 20 1.24 0.06
Corrected Total 29 9.91
C 5.24 Analysis of variance for shoot length of uninoculated and inoculated dragon fruit plants after 30 days of treatment
S.O.V d.f S.S M.S F. Value Pr > F
Treatment (Trt) 4 2.24 0.56 5.09 0.0053
Inoculation (Inoc) 1 6.53 6.53 55.37 <.0001
Trt x Inoc 4 3.76 0.94 8.54 0.0003
Error 20 2.36 0.11
Corrected Total 29 14.89
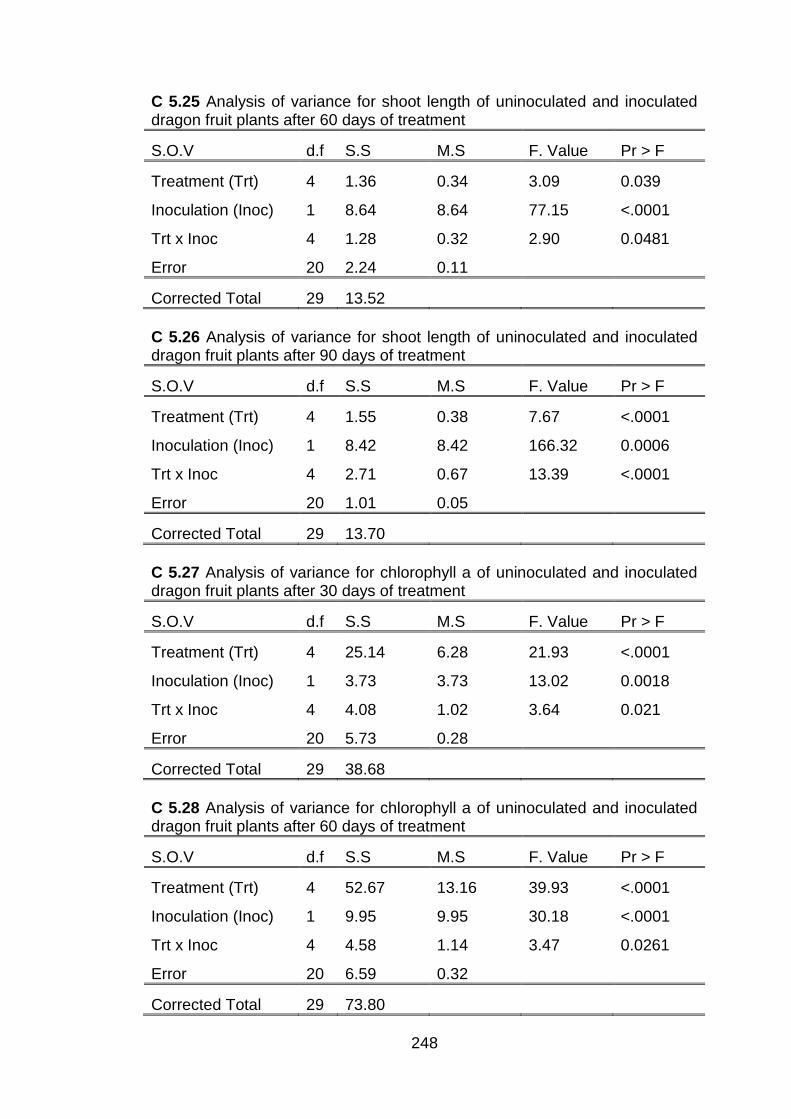
248
C 5.25 Analysis of variance for shoot length of uninoculated and inoculated dragon fruit plants after 60 days of treatment
S.O.V d.f S.S M.S F. Value Pr > F
Treatment (Trt) 4 1.36 0.34 3.09 0.039
Inoculation (Inoc) 1 8.64 8.64 77.15 <.0001
Trt x Inoc 4 1.28 0.32 2.90 0.0481
Error 20 2.24 0.11
Corrected Total 29 13.52
C 5.26 Analysis of variance for shoot length of uninoculated and inoculated dragon fruit plants after 90 days of treatment
S.O.V d.f S.S M.S F. Value Pr > F
Treatment (Trt) 4 1.55 0.38 7.67 <.0001
Inoculation (Inoc) 1 8.42 8.42 166.32 0.0006
Trt x Inoc 4 2.71 0.67 13.39 <.0001
Error 20 1.01 0.05
Corrected Total 29 13.70
C 5.27 Analysis of variance for chlorophyll a of uninoculated and inoculated dragon fruit plants after 30 days of treatment
S.O.V d.f S.S M.S F. Value Pr > F
Treatment (Trt) 4 25.14 6.28 21.93 <.0001
Inoculation (Inoc) 1 3.73 3.73 13.02 0.0018
Trt x Inoc 4 4.08 1.02 3.64 0.021
Error 20 5.73 0.28
Corrected Total 29 38.68
C 5.28 Analysis of variance for chlorophyll a of uninoculated and inoculated dragon fruit plants after 60 days of treatment
S.O.V d.f S.S M.S F. Value Pr > F
Treatment (Trt) 4 52.67 13.16 39.93 <.0001
Inoculation (Inoc) 1 9.95 9.95 30.18 <.0001
Trt x Inoc 4 4.58 1.14 3.47 0.0261
Error 20 6.59 0.32
Corrected Total 29 73.80
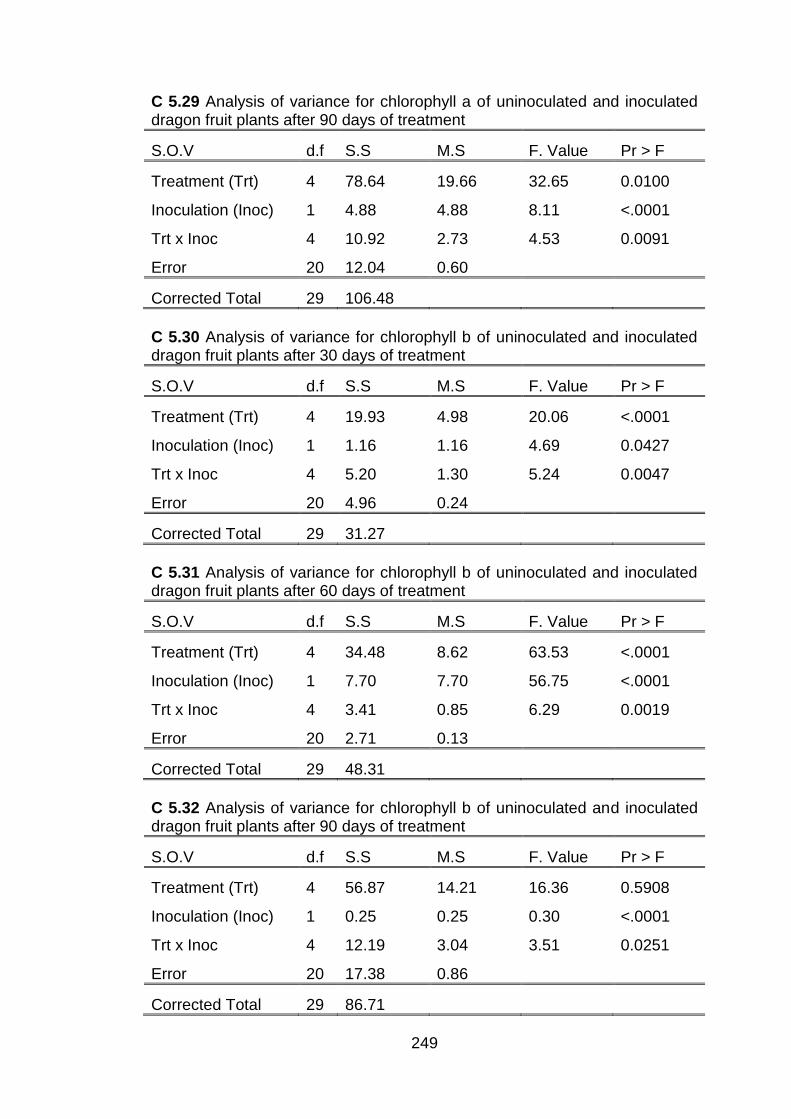
249
C 5.29 Analysis of variance for chlorophyll a of uninoculated and inoculated dragon fruit plants after 90 days of treatment
S.O.V d.f S.S M.S F. Value Pr > F
Treatment (Trt) 4 78.64 19.66 32.65 0.0100
Inoculation (Inoc) 1 4.88 4.88 8.11 <.0001
Trt x Inoc 4 10.92 2.73 4.53 0.0091
Error 20 12.04 0.60
Corrected Total 29 106.48
C 5.30 Analysis of variance for chlorophyll b of uninoculated and inoculated dragon fruit plants after 30 days of treatment
S.O.V d.f S.S M.S F. Value Pr > F
Treatment (Trt) 4 19.93 4.98 20.06 <.0001
Inoculation (Inoc) 1 1.16 1.16 4.69 0.0427
Trt x Inoc 4 5.20 1.30 5.24 0.0047
Error 20 4.96 0.24
Corrected Total 29 31.27
C 5.31 Analysis of variance for chlorophyll b of uninoculated and inoculated dragon fruit plants after 60 days of treatment
S.O.V d.f S.S M.S F. Value Pr > F
Treatment (Trt) 4 34.48 8.62 63.53 <.0001
Inoculation (Inoc) 1 7.70 7.70 56.75 <.0001
Trt x Inoc 4 3.41 0.85 6.29 0.0019
Error 20 2.71 0.13
Corrected Total 29 48.31
C 5.32 Analysis of variance for chlorophyll b of uninoculated and inoculated dragon fruit plants after 90 days of treatment
S.O.V d.f S.S M.S F. Value Pr > F
Treatment (Trt) 4 56.87 14.21 16.36 0.5908
Inoculation (Inoc) 1 0.25 0.25 0.30 <.0001
Trt x Inoc 4 12.19 3.04 3.51 0.0251
Error 20 17.38 0.86
Corrected Total 29 86.71
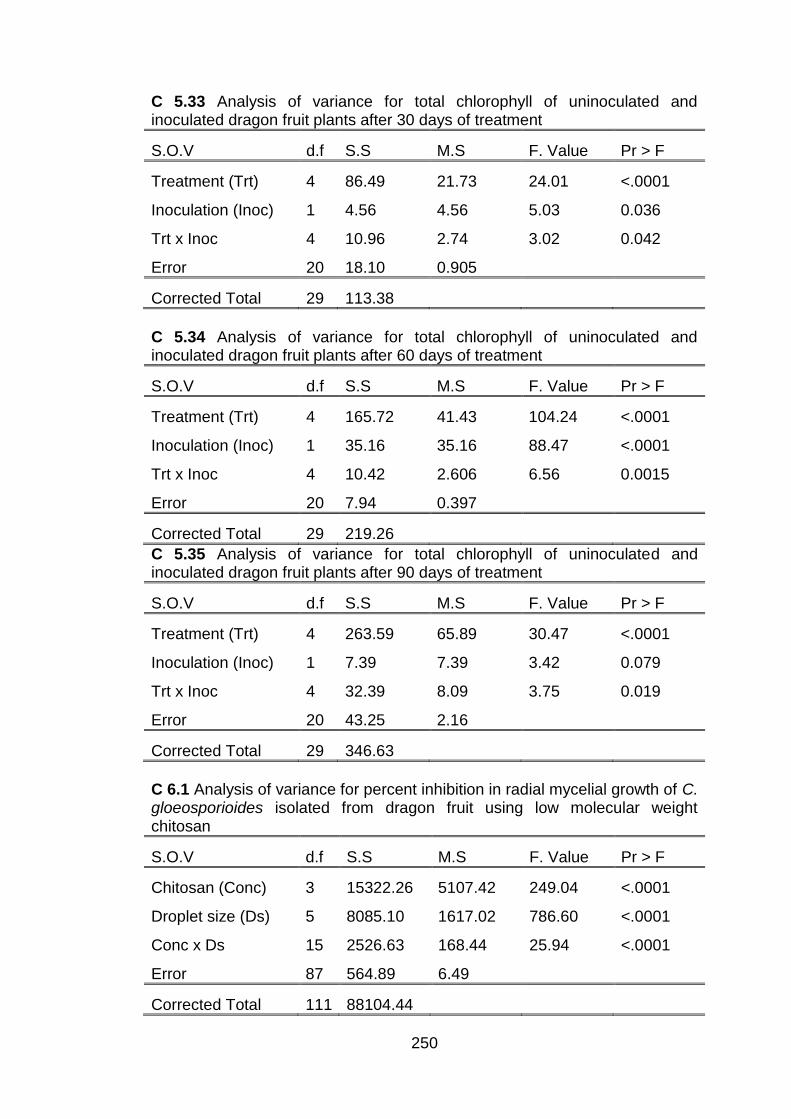
250
C 5.33 Analysis of variance for total chlorophyll of uninoculated and inoculated dragon fruit plants after 30 days of treatment
S.O.V d.f S.S M.S F. Value Pr > F
Treatment (Trt) 4 86.49 21.73 24.01 <.0001
Inoculation (Inoc) 1 4.56 4.56 5.03 0.036
Trt x Inoc 4 10.96 2.74 3.02 0.042
Error 20 18.10 0.905
Corrected Total 29 113.38
C 5.34 Analysis of variance for total chlorophyll of uninoculated and inoculated dragon fruit plants after 60 days of treatment
S.O.V d.f S.S M.S F. Value Pr > F
Treatment (Trt) 4 165.72 41.43 104.24 <.0001
Inoculation (Inoc) 1 35.16 35.16 88.47 <.0001
Trt x Inoc 4 10.42 2.606 6.56 0.0015
Error 20 7.94 0.397
Corrected Total 29 219.26
C 5.35 Analysis of variance for total chlorophyll of uninoculated and inoculated dragon fruit plants after 90 days of treatment
S.O.V d.f S.S M.S F. Value Pr > F
Treatment (Trt) 4 263.59 65.89 30.47 <.0001
Inoculation (Inoc) 1 7.39 7.39 3.42 0.079
Trt x Inoc 4 32.39 8.09 3.75 0.019
Error 20 43.25 2.16
Corrected Total 29 346.63
C 6.1 Analysis of variance for percent inhibition in radial mycelial growth of C. gloeosporioides isolated from dragon fruit using low molecular weight chitosan
S.O.V d.f S.S M.S F. Value Pr > F
Chitosan (Conc) 3 15322.26 5107.42 249.04 <.0001
Droplet size (Ds) 5 8085.10 1617.02 786.60 <.0001
Conc x Ds 15 2526.63 168.44 25.94 <.0001
Error 87 564.89 6.49
Corrected Total 111 88104.44
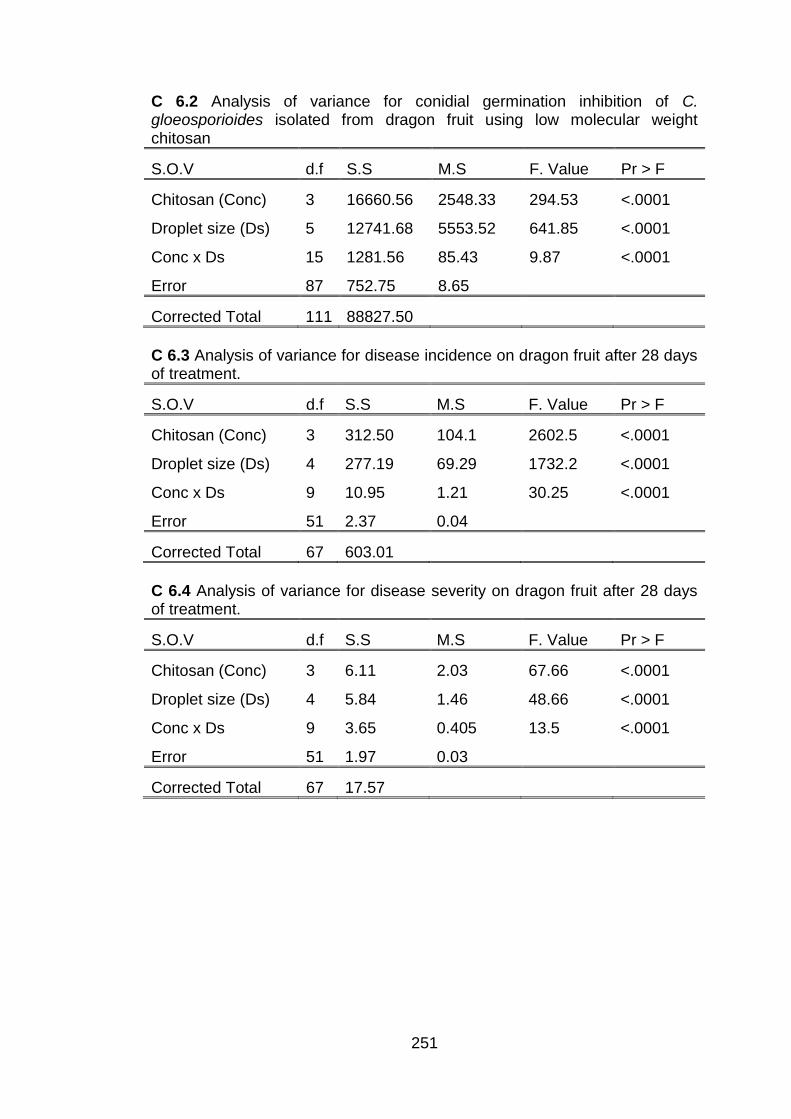
251
C 6.2 Analysis of variance for conidial germination inhibition of C. gloeosporioides isolated from dragon fruit using low molecular weight chitosan
S.O.V d.f S.S M.S F. Value Pr > F
Chitosan (Conc) 3 16660.56 2548.33 294.53 <.0001
Droplet size (Ds) 5 12741.68 5553.52 641.85 <.0001
Conc x Ds 15 1281.56 85.43 9.87 <.0001
Error 87 752.75 8.65
Corrected Total 111 88827.50
C 6.3 Analysis of variance for disease incidence on dragon fruit after 28 days of treatment.
S.O.V d.f S.S M.S F. Value Pr > F
Chitosan (Conc) 3 312.50 104.1 2602.5 <.0001
Droplet size (Ds) 4 277.19 69.29 1732.2 <.0001
Conc x Ds 9 10.95 1.21 30.25 <.0001
Error 51 2.37 0.04
Corrected Total 67 603.01
C 6.4 Analysis of variance for disease severity on dragon fruit after 28 days of treatment.
S.O.V d.f S.S M.S F. Value Pr > F
Chitosan (Conc) 3 6.11 2.03 67.66 <.0001
Droplet size (Ds) 4 5.84 1.46 48.66 <.0001
Conc x Ds 9 3.65 0.405 13.5 <.0001
Error 51 1.97 0.03
Corrected Total 67 17.57
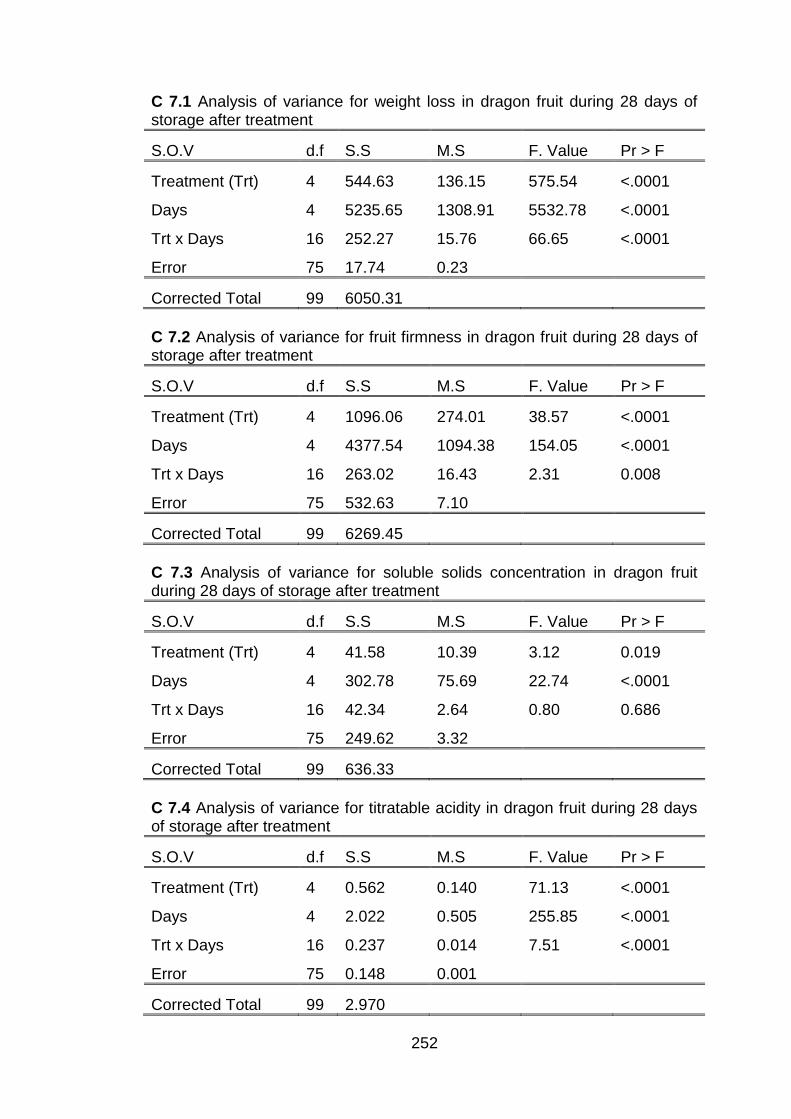
252
C 7.1 Analysis of variance for weight loss in dragon fruit during 28 days of storage after treatment
S.O.V d.f S.S M.S F. Value Pr > F
Treatment (Trt) 4 544.63 136.15 575.54 <.0001
Days 4 5235.65 1308.91 5532.78 <.0001
Trt x Days 16 252.27 15.76 66.65 <.0001
Error 75 17.74 0.23
Corrected Total 99 6050.31
C 7.2 Analysis of variance for fruit firmness in dragon fruit during 28 days of storage after treatment
S.O.V d.f S.S M.S F. Value Pr > F
Treatment (Trt) 4 1096.06 274.01 38.57 <.0001
Days 4 4377.54 1094.38 154.05 <.0001
Trt x Days 16 263.02 16.43 2.31 0.008
Error 75 532.63 7.10
Corrected Total 99 6269.45
C 7.3 Analysis of variance for soluble solids concentration in dragon fruit during 28 days of storage after treatment
S.O.V d.f S.S M.S F. Value Pr > F
Treatment (Trt) 4 41.58 10.39 3.12 0.019
Days 4 302.78 75.69 22.74 <.0001
Trt x Days 16 42.34 2.64 0.80 0.686
Error 75 249.62 3.32
Corrected Total 99 636.33
C 7.4 Analysis of variance for titratable acidity in dragon fruit during 28 days of storage after treatment
S.O.V d.f S.S M.S F. Value Pr > F
Treatment (Trt) 4 0.562 0.140 71.13 <.0001
Days 4 2.022 0.505 255.85 <.0001
Trt x Days 16 0.237 0.014 7.51 <.0001
Error 75 0.148 0.001
Corrected Total 99 2.970
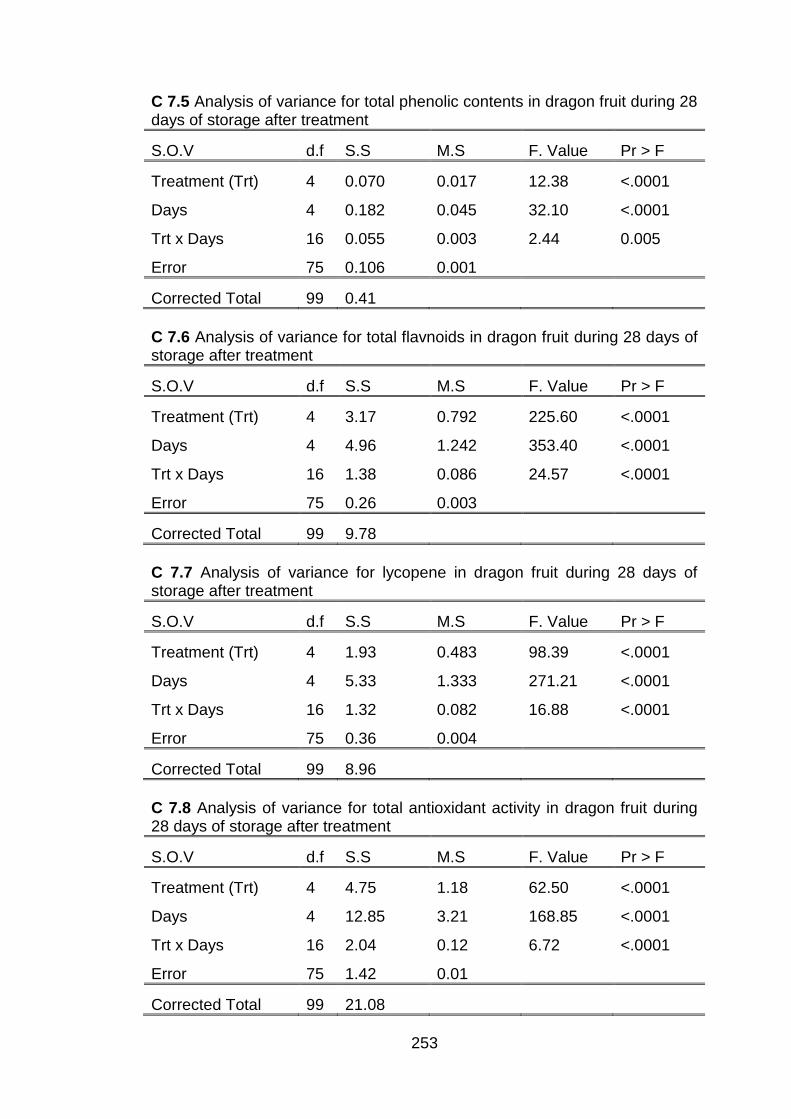
253
C 7.5 Analysis of variance for total phenolic contents in dragon fruit during 28 days of storage after treatment
S.O.V d.f S.S M.S F. Value Pr > F
Treatment (Trt) 4 0.070 0.017 12.38 <.0001
Days 4 0.182 0.045 32.10 <.0001
Trt x Days 16 0.055 0.003 2.44 0.005
Error 75 0.106 0.001
Corrected Total 99 0.41
C 7.6 Analysis of variance for total flavnoids in dragon fruit during 28 days of storage after treatment
S.O.V d.f S.S M.S F. Value Pr > F
Treatment (Trt) 4 3.17 0.792 225.60 <.0001
Days 4 4.96 1.242 353.40 <.0001
Trt x Days 16 1.38 0.086 24.57 <.0001
Error 75 0.26 0.003
Corrected Total 99 9.78
C 7.7 Analysis of variance for lycopene in dragon fruit during 28 days of storage after treatment
S.O.V d.f S.S M.S F. Value Pr > F
Treatment (Trt) 4 1.93 0.483 98.39 <.0001
Days 4 5.33 1.333 271.21 <.0001
Trt x Days 16 1.32 0.082 16.88 <.0001
Error 75 0.36 0.004
Corrected Total 99 8.96
C 7.8 Analysis of variance for total antioxidant activity in dragon fruit during 28 days of storage after treatment
S.O.V d.f S.S M.S F. Value Pr > F
Treatment (Trt) 4 4.75 1.18 62.50 <.0001
Days 4 12.85 3.21 168.85 <.0001
Trt x Days 16 2.04 0.12 6.72 <.0001
Error 75 1.42 0.01
Corrected Total 99 21.08
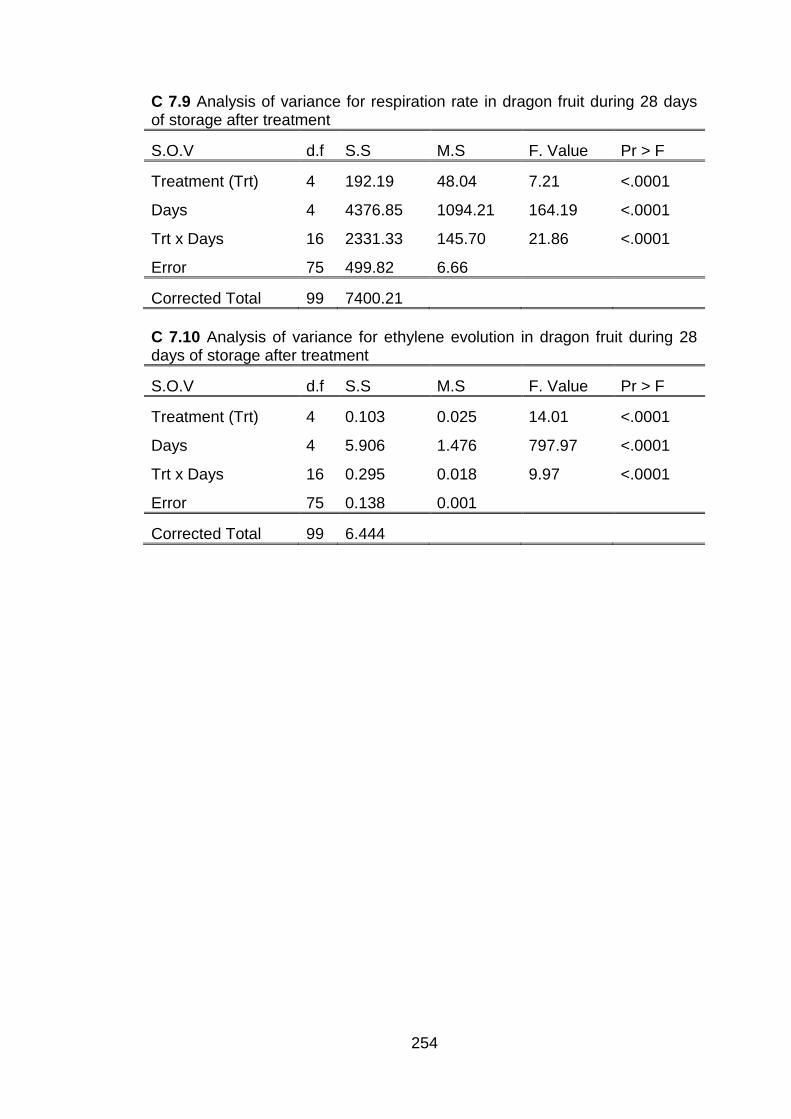
254
C 7.9 Analysis of variance for respiration rate in dragon fruit during 28 days of storage after treatment
S.O.V d.f S.S M.S F. Value Pr > F
Treatment (Trt) 4 192.19 48.04 7.21 <.0001
Days 4 4376.85 1094.21 164.19 <.0001
Trt x Days 16 2331.33 145.70 21.86 <.0001
Error 75 499.82 6.66
Corrected Total 99 7400.21
C 7.10 Analysis of variance for ethylene evolution in dragon fruit during 28 days of storage after treatment
S.O.V d.f S.S M.S F. Value Pr > F
Treatment (Trt) 4 0.103 0.025 14.01 <.0001
Days 4 5.906 1.476 797.97 <.0001
Trt x Days 16 0.295 0.018 9.97 <.0001
Error 75 0.138 0.001
Corrected Total 99 6.444
255
BIODATA OF AUTHOR Noosheen Zahid was born in Multan, Punjab, Pakistan on 31st December, 1980. She had her primary education at The Junior School Multan and continued her secondary education at Nishat High School Multan. After completing secondary education, she continued her intermediate studies at Govt. Degree College for Women Multan. In October, 2000, she joined University College of Agriculture, Bahauddin Zakariya University Multan, Pakistan and completed her B.Sc. (Hons.) Agriculture with specialization in Plant Breeding and Genetics as a major subject. For her M.Sc. (Hons.) Agriculture (Plant Breeding and Genetics), she joined Department of Plant Breeding and Genetics, Faculty of Agriculture, University of Agriculture Faisalabad, Pakistan and completed her degree in August, 2006, with 71.0% aggregate marks. On October 2006, she was offered to join Agricultural Biotechnology Reseach Institute, (AARI), Faisalabad as an Assistant Research Officer. During her tenure she worked on Genome mapping study for stripe and leaf rust in bread wheat and also worked on Wheat maize hybridization. She resigned from here job on 15th April 2007 and joined as a Scientific officer in Biotechnolgy at Central cotton Research Institiute (CCRI), Multan, Pakistan on 16th April 2007. During her stay at CCRI she worked on inter-specific hybridization to transfer desirable characters of wild species of cotton to cultivated cotton for commercial exploitation. She was happily married in year 2009, to Mehdi Maqbool which is still continued. In August, 2010 she was offered a scholarship for her PhD studies from The School of Biosciences, Faculty of Science, The University of Nottingham, Malaysia Campus, which she accepted and continued her postgraduate studies. During her research period she has published a few research papers in highly reputable journals and proceedings and also presented (oral, poster) in many conferences, seminars and symposiums.
256
LIST OF PUBLICATIONS Refereed Journals: Noosheen Zahid, Asgar Ali, Sivakumar Manickam, Yasmeen Siddiqui, Peter G. Alderson and Mehdi Maqbool, 2014. Efficacy of curative applications of submicron chitosan dispersions on anthracnose intensity and vegetative growth of dragon fruit plants. Crop Protection, 62: 129-134. Asgar Ali, Noosheen Zahid, Sivakumar Manickam, Yasmeen Siddiqui, Peter G. Alderson and Mehdi Maqbool, 2014. Induction of lignin and pathogenesis related proteins in dragon fruit plants in response to submicron chitosan dispersions. Crop Protection, 63: 83-88. Noosheen Zahid, Asgar Ali, Sivakumar Manickam, Yasmeen Siddiqui, Mehdi Maqbool, 2014. Regulation of inducible enzymes and suppression of anthracnose using submicron chitosan dispersions. Crop Protection (Accepted). Chen Khan Cheong, Asgar Ali and Noosheen Zahid, 2014. Composite Effect of Propolis and Gum Arabic to Control Postharvest Anthracnose and Maintain Quality of Papaya during Storage. International Journal of agriculture and biotechnology. (In Press). Asgar Ali, Noosheen Zahid, Sivakumar Manickum, Yasmeen Siddiqi and Mehdi Maqbool, 2013. Effectiveness of submicron chitosan dispersion in controlling anthracnose and maintaining quality of dragon fruit. Postharvest Biology and Technology, 86: 147-153. Noosheen Zahid, A. Ali, Y. Siddiqui and M. Maqbool, 2013. Efficacy of ethanolic extract of propolis in maintaining postharvest quality of dragon fruit during storage. Postharvest Biology and Technology, 79: 69-72. Asgar Ali, Noosheen Zahid, Sivakumar Manickam, Yasmeen Siddiqui and Peter G. Alderson, 2013. Double layer coatings: A new technique for maintaining physico-chemical characteristics and antioxidant properties of dragon fruit during storage. Food Bioprocess and Technology, DOI 10.1007/s11947-013-1224-3. Noosheen Zahid, Asgar Ali, Sivakumar Manickum, Yasmeen Siddiqi and Mehdi Maqbool, 2012. Potential of chitosan loaded nanoemulsions to control different Colletotrichum spp. and maintain quality of tropical fruits during cold storage. Journal of Applied Microbiology, 113: 925-939. Refereed Proceedings: Noosheen Zahid, S. Manickam and Asgar Ali. (2012). Using ethanolic extract of propolis as a natural fungicide to control postharvest anthracnose of dragon fruits. Proceedings 11th International Annual Symposium on Sustainability Science and Management, 9-11 July, 2012, organized by Universiti Malaysia Terengganu (UMT). p. 125 – 128.
257
Noosheen Zahid, S. Manickam and Asgar Ali. (2012). Application of chitosan in the form of nanoemulsions to control Colletotrichum gloeosporioides of dragon fruits. Proceedings 11th International Annual Symposium on Sustainability Science and Management, 9-11 July, 2012, organized by Universiti Malaysia Terengganu (UMT). p. 121 – 124. Noosheen Zahid, S. Manickam, P.G. Alderson, A. Ali and M. Maqbool. 2012. In vitro control of Colletotrichum gloeosporioides by using chitosan loaded . P g ‘7 h I P h v
Symposium (IPS 2012), 25-29 June, 2012, organized by MARDI Malaysia and
ISHS, PWTC Kuala Lumpur, Malaysia. Acta Horticulturae (In press)
Noosheen Zahid, A. Ali. P.G. Alderson, S. Manickam and M. Maqbool. 2012. Dual mode of action of ethanolic extract of propolis (EEP) for the control of postharvest anthracnose in dragon fruits. Proceedings 7th
International Postharvest Symposium (IPS 2012), 25-29 June, 2012, organized
by MARDI Malaysia and ISHS, PWTC Kuala Lumpur, Malaysia. Acta Horticulturae (In press) Noosheen Zahid and Asgar Ali. (2011). Chitosan based nanoemulsions act as a green fungicide against C. gloeosporioides of dragon fruit. Proceedings ‘ v 2 G h C F ’, 22 - 26 June, 2011, organized by The Graduate School, The University of Nottingham Malaysia Campus, Jalan Broga, 43500 Semenyih, Selangor, Malaysia. p. 168-172. Oral Presentations: Noosheen Zahid. (2012). Submicron Dispersios of Chitosan: A Green Technology against Colletotrichum gloeosporioides through Scanning Electron Microscopy (SEM). 23rd Malaysian Society of Plant Physiology Conference: Plant Physiology in Addressing Green Economy, Bayview Hotel, Langkawi, 18th – 20th December 2012 Noosheen Zahid. 2012. Application of chitosan in the form of nanoemulsions to control Colletotrichum gloeosporioides of dragon fruits. 11th International Annual Symposium on Sustainability Science and Management (UMTAS 2 2), ‘G g h T h g H b g’, J 9-11, 2012, organized by the Faculty of Agrotechnology and Food Science (FASM) Universiti Malaysia Terengganu (UMT), Kuala Terengganu, Malaysia. Noosheen Zahid. 2012. Effect of chitosan loaded nanoemulsions on pre and postharvest anthracnose of dragon fruit. Postgraduate Students Conference, 12th June, 2012, organized by the School of Biosciences, Faculty of Science, The University of Nottingham Malaysia Campus, Malaysia.
258
Noosheen Zahid. 2011. Chitosan based nanoemulsions act as a green
fungicide against C. gloeosporioides g . ‘ v 2 G h C F ’, 22 - 26 June, 2011, The Graduate School, The University of Nottingham Malaysia Campus, Jalan Broga, 43500 Semenyih, Selangor, Malaysia Noosheen Zahid. 2011. Development of biofungicide based on chitosan nanoemulsions for the control of anthracnose in dragon fruit (Hylocereus polyrhizus) plants. Postgraduate Students Conference, 8th June, 2011, organized by the School of Biosciences, Faculty of Science, The University of Nottingham Malaysia Campus, Malaysia. Poster Presentations: Noosheen Zahid, Sivakumar Manickam and Asgar Ali, 2012. Submicron dispersions of chitosan for controlling anthracnose of dragon fruit plants. 5th Integrated Pest Management Symposium: New Frontier Towards Sustainable Agro Ecosystem, Kota Kinabalu, Sabah, Malaysia 18th – 20th December 2012 Noosheen Zahid, Sivakumar Manickam, Peter G. Alderson, Asgar Ali. (2012). Chitosan loaded nano-emulsions and their efficacy to control anthracnose of dragon fruit plants. 7th International Postharvest Symposium, organized by Malaysian Agricultural Research and Development Institute (MARDI) and Universiti Putra Malaysia (UPM) under the auspices of the International Society for Horticultural Science (ISHS), PWTC, Kuala Lumpur, 25th – 29th June 2012.
Noosheen Zahid, P. G. Alderson, Sivakumar Manickam, Asgar Ali. (2012).
Dual mode of action of ethanolic extract of propolis (EEP) for the control of postharvest anthracnose in dragon fruits. 7th International Postharvest Symposium, organized by Malaysian Agricultural Research and Development Institute (MARDI) and Universiti Putra Malaysia (UPM) under the auspices of the International Society for Horticultural Science (ISHS), PWTC, Kuala Lumpur, 25th – 29th June 2012. Noosheen Zahid and Asgar Ali, 2012. Value addition of sea waste: chitosan as an antimicrobial agent. 3rd Postgraduate Research Showcase, 18th May, 2012, organized by The Graduate School, The University of Nottingham Malaysia Campus, Malaysia. Noosheen Zahid, Asgar Ali and Sivakumar Manickam, 2011. Nanoemulsions Encapsulated With Chitosan: A Green Alternative of Synthetic Fungicides. Postgraduate Research Showcase, 18th May, 2011, organized by The Graduate School, The University of Nottingham Malaysia Campus, Malaysia.