Embed Size (px)
Citation preview

Yuma County
Needs Assessment
2007

~tC'U AUll U 6 .2D-07
Yuma County Needs Assessment 2007
Page 1 of 11
Yuma County is located in the southwest comer of the state sharing borders with Mexico and California. It is largely rural. Agriculture and tourism provide its economic base. Agriculture is seasonal and some families migrate to other states, especially the Salinas area of California during the summer.
Yuma County had a population of 195,499 in 2006 an increase of6019 or 3.0 %. This percentage is down from 4.2% in 2005. During the same period the state increased by 3.0% down from 3.5% in 2005. The City of Yuma population increased by 3,385 people or 3.6%, Well ton increased by 15 8 people or 7.4 %, and San Luis increased by 780 people or 3.3 %. Somerton's population increased by 250 people or 2.5% which is a decrease from 9.0% a year ago. Additionally, for 6 months of the year the county has an influx of winter visitors. These "snowbirds" numbered 56,000 in 2006 a decrease of 500 from 2005. However in 2004, snowbirds numbered 56,000 a decrease of34,000 people from 2003. This decrease could be due to many factors such as: changes in the tax law and medical coverage restrictions for these visitors from Canada, rising gas prices the instability of the world situation, and the fact that these visitors are aging. Some visitors are investing in homes here and are no longer considering themselves winter visitors. Approximately two thirds of the population in this county is centered in the city of Yuma, the county seat. Most of the health and social services are centered in the City of Yuma, but there is some outreach to the smaller communities of Somerton, San Luis, Well ton, and Dateland.
In comparing rates of growth from 2000-2006:
Yuma County grew 15.2% City of Yuma grew 11.7%
City of San Luis grew 42.3 % City of Somerton grew 32.7 %
Town of Wellton grew 11.7%
COMPARISON OF ESTIMATED POPULATION TOTALS FOR YUMA COUNTY 2004 2005 2006 CHANGE
Arizona 5,832,150 6,044,985 6,239,482 UP 194,497 Yuma County 181,470 189,480 195,499 UP 6019 Yuma 86,070 88,775 92,160 UP 3385 Somerton 8,855 9,750 10,000 UP 250 San Luis 21,180 22,930 23,710 UP 780 Wellton 1,900 1,970 2,128 UP 158
There is no municipal system of public transportation in Yuma County. Some small buses have begun to service the area for a fee, but their routes are not comprehensive. The County
Page 2 of 11
encompasses approximately 5,600 square miles, approximately 80 miles from east to west and 92 miles from north to south with an area cut out for La Paz County. Somerton is within 7 miles of the City of Yuma, San Luis is within 23 miles, and Wellton is within 32 miles. The community of Dateland is 70 miles one way from the City of Yuma. Small communities such as Dateland dot the County's agricultural and desert landscape.
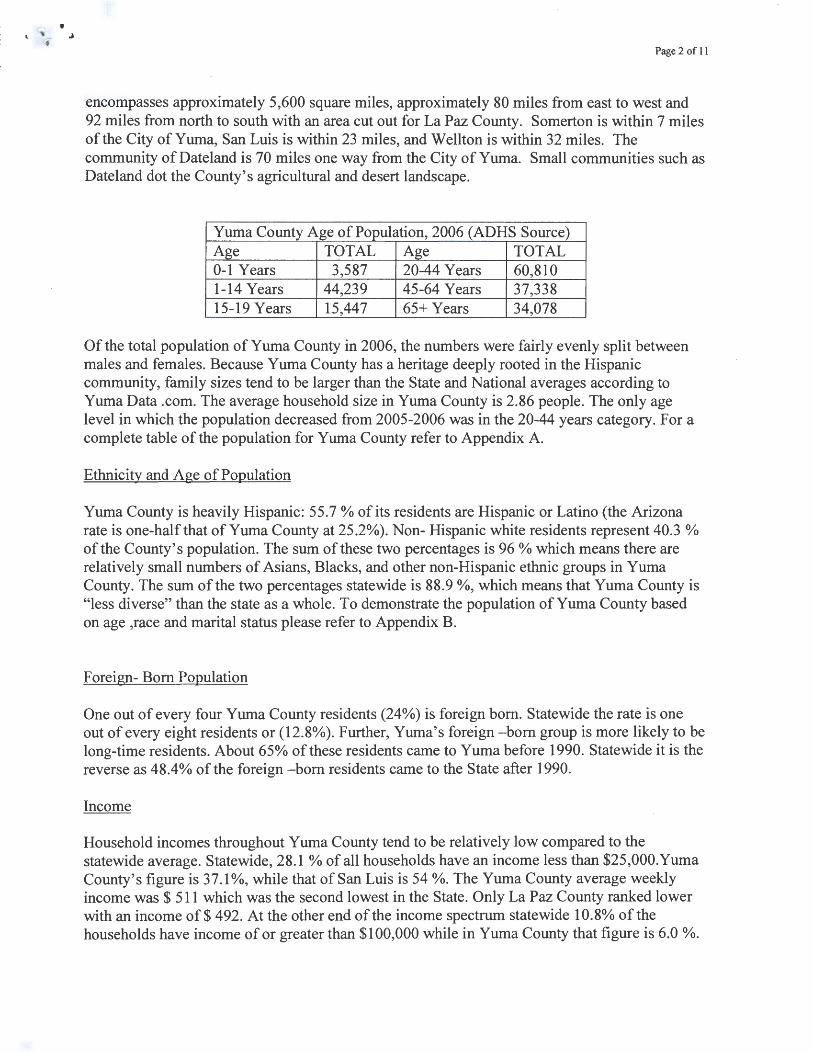
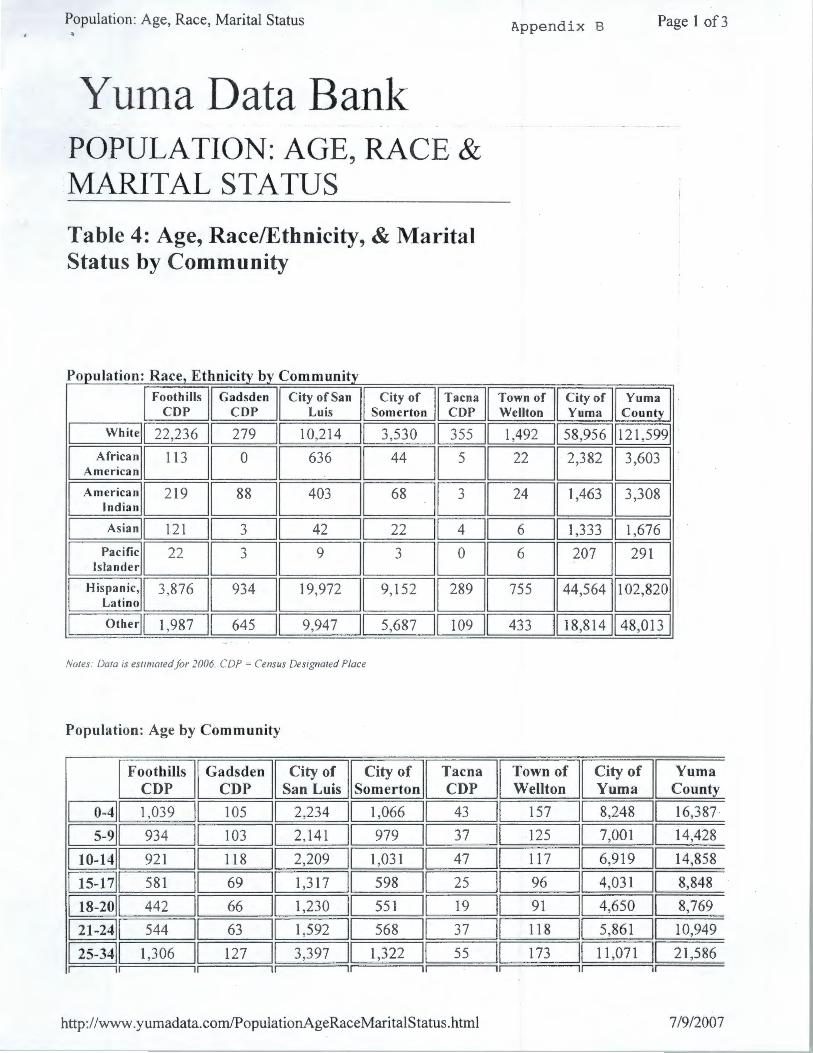
Yuma County Age of Population, 2006 (ADHS Source) Age TOTAL Age TOTAL 0-1 Years 3,587 20-44 Years 60,810 1-14 Years 44,239 45-64 Years 37,338 15-19 Years 15,447 65+ Years 34,078
Of the total population of Yuma County in 2006, the numbers were fairly evenly split between males and females. Because Yuma County has a heritage deeply rooted in the Hispanic community, family sizes tend to be larger than the State and National averages according to Yuma Data .com. The average household size in Yuma County is 2.86 people. The only age level in which the population decreased from 2005-2006 was in the 20-44 years category. For a complete table of the population for Yuma County refer to Appendix A.
Ethnicity and Age of Population
Yuma County is heavily Hispanic: 55.7% of its residents are Hispanic or Latino (the Arizona rate is one-half that of Yuma County at 25.2%). Non- Hispanic white residents represent 40.3% of the County's population. The sum of these two percentages is 96% which means there are relatively small numbers of Asians, Blacks, and other non-Hispanic ethnic groups in Yuma County. The sum of the two percentages statewide is 88.9 %, which means that Yuma County is "less diverse" than the state as a whole. To demonstrate the population of Yuma County based on age ,race and marital status please refer to Appendix B.
Foreign- Born Population
One out of every four Yuma County residents (24%) is foreign born. Statewide the rate is one out of every eight residents or (12.8%). Further, Yuma's foreign -born group is more likely to be long-time residents. About 65% of these residents came to Yuma before 1990. Statewide it is the reverse as 48.4% of the foreign -born residents came to the State after 1990.
Income
Household incomes throughout Yuma County tend to be relatively low compared to the statewide average. Statewide, 28.1 %of all households have an income less than $25,000.Yuma County's figure is 3 7.1 %, while that of San Luis is 54 %. The Yuma County average weekly income was $ 511 which was the second lowest in the State. Only La Paz County ranked lower with an income of$ 492. At the other end of the income spectrum statewide 10.8% of the households have income of or greater than $100,000 while in Yuma County that figure is 6.0 %.
Page 3 of 11
The City of Yuma does a bit better than the County as a whole with 7.6% of the households in the $100,000 plus income range. The percentages for the Foothills and San Luis are 5.0% and 1.1% respectively.
In Yuma County, 19.2% of all households are living in poverty. Statewide the figure is 13.9%. The City of Yuma has the lowest rates of poverty in the County at 14.7 %.Th~ largest concentrations of those living in poverty are found in Gadsden (45.2 %), San Luis (35.8 %), Somerton (26.6 %) , Tacna (25.1 %) and Wellton ( 21.3 %).
Unemployment
Yuma County has a high rate of unemployment. The average rate of unemployment in Yuma County for 2006 was 13.5%. In May of2007, Arizona's rate was 3.6%, while at the same time Yuma County's was 14.4 %, a increase from the previous year. The City of Yuma's rate was 13.0%, also a decrease from the previous year. The unemployment rate for the areas largely populated by agricultural workers was considerably higher, especially closer to the Mexican border. Wellton's rate was 17.7 %, Somerton was 24.8 %, and San Luis, on the border, averaged 34.5 %.
Education
Yuma County has a total of nine school districts within its borders and over 55 public schools. There are seven high schools, several charter schools, and a community college within the county. Northern Arizona University has created a satellite college within the community college, and the University of Phoenix as well as Arizona State University and Webster University, have also created educational opportunities within the community. In addition Southern Illinois University offers a Bachelors Degree in Aviation Management at the Marine Corps Air Station.
Based on the 2006-2007 enrollment data, there are approximately 12,644 students enrolled in the Yuma Union High School District. On an average there was a 3% growth rate in the enrollment numbers for Yuma County.
When comparing different schools within Yuma County the school population on an average is 64-99% Hispanic in ethnic background, and 62-99% receive free or reduced lunches.
The percentage of the population greater than 25 years old without a high school diploma is much higher than the year 2000 state average of 19%. In Yuma, the percentage is 34.2%, in San Luis 64.8%, and 62% in Somerton.
The dropout rate for 2006-2007 was comparable to the State level. Most of the schools averaged 1.7 %-4.2 %. The exceptions were the two half day high schools which averaged a 25% dropout rate .A table showing County and State dropout rates, enrollment, free and reduced lunch rate, and ethnic make-up can be found in Appendix D

Page 4 ofll
Yuma County has the third highest number of gangs in the State, following Maricopa and Pima County. There are 34 active gangs in Yuma County. According to the Yuma Police Department and the Gitem Squad through DPS active means more than 1-2 people in the gang. Altogether the police estimate there are over 1500 gang members in this County. These gangs are largely Hispanic in origin and their home territories usually are dictated by geographic areas within the County, but there has been a lot of overlap in those geographic areas in the last few years.
Health Services
There is one regional hospital, a rehabilitation hospital, and many private practice physicians. There are three "urgent care" facilities. Cinpatico, the local behavioral health group, manages a small eight-bed residential treatment center for the mentally ill and four group homes plus a small family practice clinic. Since Cinpatico took over, some of the referrals have been handled differently, and there are more outside contracted providers, which has been a benefit to those in need of mental health services. Sunset Community Health Care has reorganized and downsized but still offers sliding scale fee services for low-income families at the main clinic as well as at satellite clinics. This Health Care group built a central office which houses all of its' individual clinics under one roof which will be helpful for its clients.
The prenatal clinic at the hospital was eliminated October 1, 1997 making availability of services difficult for the NOTCH group. This change, along with the new AHCCCS requirements, has caused undocumented immigrants, which are numerous in this county, to have difficulty obtaining prenatal care. Only eligible for emergency AHCCCS undocumented immigrants must find an OB/GYN who will contract with them for lowered prenatal care costs. This has lead to a rise in the number of drop-in deliveries at the hospital. For those eligible, "Baby Arizona" has facilitated earlier prenatal care, especially among teens.
Family Planning services are available from two sources in Yuma: Planned Parenthood and the Yuma County District of Public Health Family Planning Clinic. Planned Parenthood employs a nurse practitioner. The Family Planning Clinic contracts with one doctor and two nurse midwives, one family nurse practitioner, and employs one registered nurse. There are currently two Family Planning Clinics available through the Health District, one in Yuma and one in San Luis.
Pregnancy testing is available through both clinics. Women may also come to the Health District for pregnancy testing. Pregnancy testing is available to all women in the county. Public Health Nurses and lay health workers through Yuma County Health District offer follow-up to clients with their first pregnancy, for all teens, or if they are medically/socially high risk and/or clients needing prenatal education.

Page 5 of 11
The warm desert climate during winter months makes Yuma County an attractive area for winter visitors. Between November and April the population increased by nearly 56,000 people which boosts the local economy, but also stresses medical facilities and manpower.
Diabetes in Yuma County
In the 2002 Community Health Profile, Arizona Department of Health Services reported 222.3 per 100,000 deaths of cardiovascular diseases and 22.7 per 100,000 deaths from diabetes. In addition, Yuma Regional Medical Center (YRMC) reported in 2004 a total of245 cases of patients with Diabetes Type II (18+ years) who visited the ER and of those 245 patients, 223 were admitted due to problems such as Diabetes Mellitus (DM) with neurological manifestations, hypoglycemic shock, DM renal uncontrolled reason not stated, DM ketoacidosis uncontrolled, DM with peripheral circulatory disorders, DM with other specified manifestations such as hypoglycemia, bone changes etc. In 2005, YRMC reported an increase in the number of patients with Diabetes Mellitus to 363 of which 256 were admitted. & 7.5 % of all the adults in Arizona have been diagnosed with diabetes. In Yuma County the incidence of diabetes has doubled since 1994. A table to illustrate this information can be found in Appendix E.
Maternal Health Status
A) Teen Pregnancy and Birth Rates The nationwide teen pregnancy rate decreased again last year but unfortunately, the rate for teens 19 years and younger in Yuma County has risen again to bring us back into the # 1 position in the State. A copy of the pregnancy and birth rates can be found in Appendix F.
T p een regnancies 19 years an d younger 2006 Rank Year <15 15-17 18-19 TOTAL Rate/10
years years years 00 #3 2002 9 174 322 505 38.8
#2 2003 10 200 333 543 40.6
#1 2004 5 224 353 582 42.1
#3 2005 3 193 335 536 37.0
#1 2006 6 197 378 581 38.0

Page 6 of 11
Pregnancy Rate Ranking for Teens 19 and under 2006 Rank/1000 2003 2004 2005 2006 1
2
3
Gila Co. 42.8 Yuma· co. 42.1 LaPaz Co. 49.8 Yuma Co. 38.0 Yuma Co. 40.6 LaPaz Co. 39.8 Gila Co. 38.8 Gila Co. 37.7 Pinal Co. 38.8 Santa Cruz Co.38.6 Yuma Co. 37.0 Graham Co. 35.5
In comparing, the pregnancy rate ranking within the state in 2002 to 2005 it is interesting to note that Gila County ranked# 1 for 2002 and 2003, dropped to 4th in 2004 and now is back at #2, and remains there for 2006. La Paz County was #5 in 2003, in 2004 rose to #2, then to# 1, and now is tied for# 9 with a rate of 30.0.
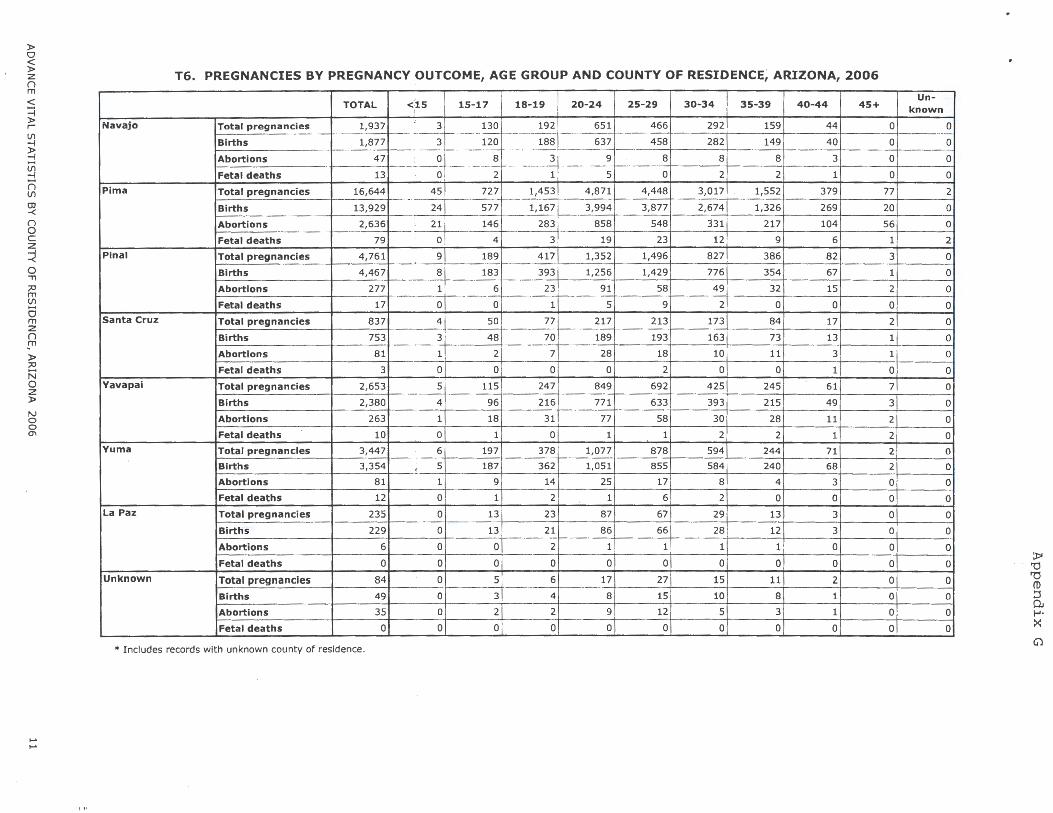
Teen pregnancies decreased in 2005 to 536 from 582, and in 2006 are back up to 581. There was an increase in pregnancies in most age categories. There were 24 abortions in teens 19 years and under up from 8 in 2005. These services are not available in Yuma County as yet but Planned Parenthood plans to initiate those services soon. At this time women still have to travel to Phoenix or California to receive termination services. There were 3 fetal deaths in 2006. Additional information on these rates can be found in Appendix G.
2006 Teen Births and Rate for Teens Under 19 Rank Year <15 15-17 years 18-19 years Total Rate #4 2002 9 160 304 473 36.3 #2 2003 9 187 302 498 37.2 #1 2004 5 213 337 555 40.1 #3 2005 3 193 325 521 35.9 #1 2006 5 187 362 554 36.2
BIRTH RATE RANKING FOR TEENS 19 YEARS AND UNDER 2006 Rank/1000 2003 2004 2005 2006 #1 Gila Co. 41.0 Yuma Co. 41.1 La Paz Co. 49.8 Yuma Co. 36.2 #2 Yuma Co. 37.2 La Paz Co. 38.9 Gila Co. 38.9 Gila Co. 34.2 #3 Pinal Co. 37.0 Santa Cruz Co. Yuma Co. 35.9 Graham Co. 33.9
37.2

• Page 7 of 11
There was an increase in teen births from 521 to 554. Of those 554 births 85 or 15% were to white non-Hispanic females, 456 or 82 % were to Hispanic females, 4 or . 7 % were to black females, and 6 or 1.08% to females of American Indian descent. Additional information can be found in Appendix H.
Of those 554 teens, 430 or 78% were single at the time of delivery and 122 or 22% were married. 474 teens or 86% used AHCCCS to pay for prenatal care, 52 or 9.3% were covered by private insurance, and 28 or 5% were self pay.
Thirty -two girls or 5.8% received no prenatal care. This was a decrease from 2005 when 45 teens did not. 268 or 48% began care in the first trimester, 168 or 30% began care in the second trimester, and 86 or 16 % began care in the third trimester. This was a sizable increase in the number seeking prenatal care in the third trimester in 2006, up from 71 to 86. Of those 554 teens 32 or 5.7% had no medical visits, 50 or 9% had 1-4 prenatal visits, 159 clients or 29% had 5-8 prenatal visits, 203 clients or 40.2% had 9-12 prenatal visits, 90 or 16.2% had 13 or more prenatal visits. Thirty- seven teens delivered babies that weighed less than 2500 grams. A complete listing of this information can be found in Appendix I.
Women's Health Status
COMPARATIVE BIRTH RATE PER 1000 POPULATION 2001 2002 2003 2004 2005 2006
Yuma County 18.2 18.1 18.2 18.3 17.4 17.2 Arizona 16.1 16.0 16.1 16.0 15.8 16.4
The birth rate for Yuma County has decreased almost every year since 1998, but was up slightly in 2003 and again in 2004 before dropping almost a full percentage point in 2005. In 2006 the rate dropped slightly. The State followed the same trend but the drop in 2005 was not so dramatic. Unfortunately, in 2006, the State Birth Rate increased to 16.4 the highest it has been since the year 2000. The Yuma County rate remains above the State level and Yuma County ranks # 2 after Maricopa County in overall birth rate. A table listing the birth and death rates can be found in Appendix J.
Number of Live Births Yuma County 2002 . I 2oo3 I 2oo4 2005 2006 3,071 13,187 I 3,318 3,292 3354
The total number of births in Yuma County has risen slowly in the last four years but dropped off slightly in 2005 and increased again slightly in 2006. The County's population has continued to climb increasing 3.0% in 2006.
• Page 8 of 11
In the year 2006, 581 or 17.3% were to teens 19 years or younger. These were actually 3447 documented pregnancies but only 3,354 births. There were 81abortions and 12 miscarriages. There was a dramatic increase in the number of abortions provided to County residents from 28 in 2005 to 81 in 2006. A table of pregnancies by outcome, and age group can be found in Appendix G.
Of those 3,354 births, 696 or 21 %were born to white non-Hispanic females, 2,497 or 75% to Hispanic females, 56 or 1.6 % to black females, 41 or 1.2 % to American Indian females, 59 or 1. 7 5 % to Asian females or Pacific Islanders, and 5 or .15 % to females of unknown origin. More information is available in Appendix H.
Of these 3,354 births 2114 or 63% were paid for by AHCCCS, 5 or .15% were covered by Indian Health Services, 1063 or 32 % were covered by private insurance, 169 or 5 % listed self as source of payment and 3 or .009% had unknown financial resources.
Of those 3,354 births, 1,843 or 55% were married, 1,470 or 44% were single, and 41or 1.2% were of unknown status.
One hundred and sixty-six women, (down from 183 in 2005) or 4.9% received no prenatal care, 2034 or 61 %began care in the first trimester, 783 or 23.3% began care in the second trimester, 370 or11 %began care in the third trimester and 1 or .02% began care at an unknown time.
Of those 3,354 women 166 or 4.9% had no medical visits, 241 or 7.1 %had 1-4 medical visits, 753 or 22.4% had 5-8 medical visits, 1,419 or 42% had 9-12 visits, 772 or 23% had 13+ medical visits, 3 or .009% had an unknown number of visits.
One hundred and ninety-five babies or 5.68% weighed less than 2500 grams and are considered low birth weight. Yuma County had an alarming jump in low birth weight babies up from 4.9% in 2002, to 6.4 % in 2003 but it decreased slightly in 2004 to 6%, and was down again in 2005 to 5.6%. In 2006 it is up slightly, but Yuma ranked# 13 in LBW babies. More information is available in Appendix I.
Mortality in 2006
There were 18 infant deaths up from 14last year. The infant mortality rate was 5.411000 live births in 2006, which was an increase from 2005 numbers. In 2006 Yuma County ranked in the middle range in the State ( # 7) . A complete listing can be found in Appendix K.
The causes of the 18 infant deaths included congenital malformation of the brain and spinal column, prematurity, maternal complications, RDS and SIDS. A complete listing can be found in Appendix L.

Page 9 of 11
There were 1 0 children's deaths between the ages of 1-14 years. Four of the ten children died of unintentional accidents, 1 of cancer and 1 of heart disease ... A complete list can be fotmd in AppendixM.
There were 6 deaths in children between the ages of 15-19 years, 2 of which were due to homicide, 1 of congenital malformations, and one was a suicide. A complete listing can be found in Appendix N.
There were 60 deaths in young adult's ages 20-44 years. Eleven deaths were due to accidents, 5 were suicides, thirteen from malignant neoplasms, 3 from heart disease, 5 from accidental poisonings, and 1 from HIV. In addition, four were murdered, 1 died of liver disease, three from strokes and 2 from influenza. It is alarming to see the increase in violent crime in all age groups, and in this age range the sudden increase in malignant neoplasm's from 6 to 13. A complete listing can be found in Appendix 0.
There were 194 deaths in adults age 45-64.Fifty- one was due to malignant neoplasms, 38 due to heart disease, 6 due to liver disease, 12 due to diabetes, and 7 due to suicide. Six died from influenza and pneumonia, 5 from septicemia, 9 due to a stroke, 13 to unintentional accident and 7 to respiratory disease. A complete listing can be found in Appefl:dix P.
There were 876 deaths in adults 65 years or more. 211 were due to heart disease, 182 due to malignant neoplasms, and 45 due to cerebrovascular disease, 73 due to COPD, and 38 due to diabetes. There was a large jump in the number of deaths from diabetes in 2005 up to 42 from 11 in 2004, but it has remained fairly constant in 2006. 40 died from influenza and pneumonia, 30 from septicemia and 6 from Alzheimer's disease. For a complete listing of causes of death in Yuma County 2006, refer to Appendix Q.
Resources for Prenatal Care
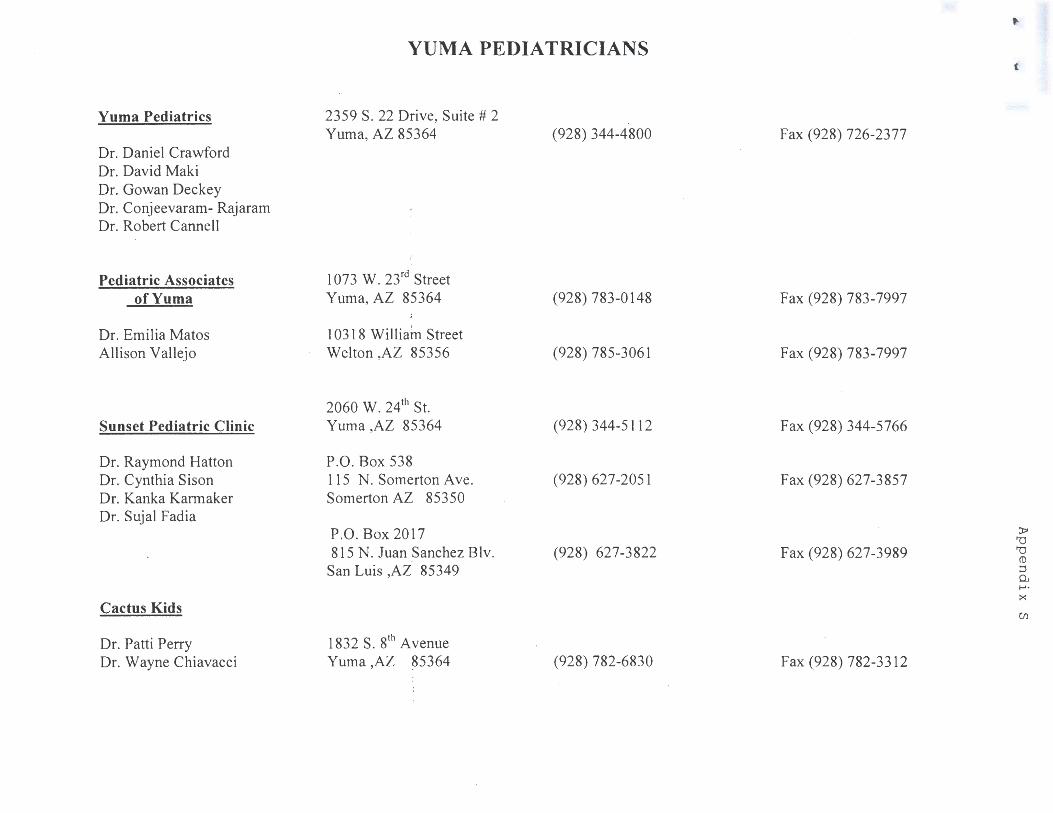
• Appendix R lists the current OB/GYN offices and Appendix S lists the current pediatricians. The offices all accept AHCCCS patients and most OB/GYN offices offer Baby AZ Services. There are OB/GYN and pediatric clinics in San Luis but not in Eastern Yuma County.
• Pregnancy testing is offered in Yuma, San Luis, and eastern Yuma County at a regularly schedule walk-in clinic by the Health District. In addition, the Family Planning Clinic for the Health District offers testing and birth control services, as do other individual medical offices and several private clinics.
o Provides official verification of pregnancy and referrals. o Needed follow-up visits are scheduled through Public Health Nurses and Health
Start to promote early prenatal care. • The Lay Health Worker Program "Health Start" targets Spanish-speaking populations.
They perform outreach and referral, prenatal classes, and family follow-up for older · prenatal clients.
• Nurse Case Management Services for teens under 20 provides outreach and referral, home visits to provide prenatal, and postpartum teaching using funding from the Prenatal Block Grant.

Page 10 ofll
• Baby Arizona implemented in January 1997 in Yuma County can facilitate care for -pregnant women.
• Emergency AHCCCS provides hospital coverage for those women without documentation. OB/GYN offices usually will offer a reduced cost program for prenatal care.
• Planned Parenthood offers pregnancy testing, contraceptive, and counseling services. • AHCCCS will provide transportation for medical visits for enrolled clients and AP/IPA
will pay for prenatal classes at the hospital. • Public Health Nursing services are available to provide nursing assessment,
developmental screening, pre and post natal care and health education. The program provides follow-up and guidance to those infants enrolled in the NICP program and Infants with Special Health Care Needs.
• Public Health Nurses have established regular office hours at all of the high schools. This allows and encourages students to ask for information on health care and referral serv1ces.
• Yuma Regional Medical Center Prenatal Program for the NOTCH group of women whose income is above AHCCCS and Kids Care level but cannot afford insurance.
• Immunization services are available to infants and children through the Health District Also, some adult immunizations are available at specific clinics.
• Infants with parents at high risk for abuse can receive intensive follow-up by Healthy Families.
• The Abstinence Plus program initiated with a grant from ADHS will address health education needs in the junior highs.
Barriers to Service
• Lack of reliable transportation for those without AHCCCS, or with non-medical appointments.
• Lack of federal and state support for social services and public health programs. The "Budget Crunch" limits services to those who need it most.
• Lack of funding in the public health and social services areas discourages staff and results in difficulty recruiting new staff. The instability of grant based job positions and the fluctuation of program funding makes planning and implementing programs difficult.
• The fear of arrest and deportation results in many undocumented immigrants not seeking health care early or at all.
• Immigrants applying for permanent papers avoid contact with authorities for fear of affecting immigration.
• Teenagers tend to delay and fear telling parents and often prenatal care is delayed. • Elimination of the Teenage Parenting Program in the High Schools which provided
support and education services for pregnant and parenting teens.
Page II of II
2010 OBJECTIVES
Objective #3: Reduce pregnancies among adolescents 15-17 year olds.
The strategies described in Appendix T mostly deal with developing community programs and educating the public. It is a constant challenge to do so. The Prenatal Block Grant program has made great progress in developing close ties to the schools in the area, by developing and supporting programs, which promote teen health.
The MCH Prenatal Block Grant program has expanded the Teen Festival to two days in San Luis at the high school, and has begun another Festival in a high school in rural east county. Additionally, presentations to the community have increased and new programs are beginning which will enhance mother baby bonding.
The Abstinence Plus program provides important information and education to three junior high schools in the community. Ideally, this will create dialogue among the students regarding the risks and consequences of early sexual behavior. Hopefully, decisions these students make in the future will be based on facts, and they will enter into relationships based on the truth.

)> 0 < )> z n m < ~ )> I
(j) _, j (j) _, (=) (j)
OJ -< n 0 c z ~ 0 11
;:o m ~ 0 m :z n ~m
)> ;:o N 0 2 )>
N 0 0 0'\
0'\ ~
T40. POPULATION OF INFANTS, CHILDREN (1-14 YEARS), ADOLESCENTS (15-19 YEARS), YOUNG ADULTS (20-44 YEARS),
MIDDLE-AGED -ADULTS ( 45-64 YEARS) AND ELDERLY (65+) BY GENDER AND COUNTY OF RESIDENCE, ARIZONA, 2006
county :-·. :. ',~ ·Gender <1 1-14 15-19 . 20-44 ' .. 45.:.64-- '. 65+ .:··_. '· . - Tot~• - ·•
Mohave Total I 2,348 I
11 ,632 5_6~ ~ 8_8 1 50,190 40 ,509 194,920 I
3_3,853 1
6 ,oo.21 - .. - .. - . ----· . .
Male I 1,208 _17 ~ 327 j _ ~7-~~-~5 ~ 24,246 19 ,380 96,158 -. ·- ------- ---- -- - ------·-- . ·- --- - .. - ---- - .- -----·---- ----- --- --- --------Female 1,140 16,526 5,630 28,393 25,944 21,129 98,762
Navajo Total 1,925 27,545 10,843 35,740 24,160 12,459 112,672 --- -·-------· --- -····· ---·-··- ------------ - . - ---· ---- - - - -- - ----- - -- - -----·-···-· ---- -- --- ~----- ----------- --- ------------------r-·-----. --------· Male 976 13,813 5,504 18,129 11,568 5,$05 55,795 1--~--------· - - . ·--- --- -- ·-------------------- - . --- -------------- - --------- --- -- ------ ------ --------------- r- -- ·---- -~-:------- r---------- - r--------Female 949 13,732 5 ,339 17,61_1 12,592 6,654 56,877
Pima Total 13,748 184,810 70,935 336,661 234,132 140,691 980,977 - --------- ----------- t----- - - - ----- ------- -- - -- --- --------------- - -- - ·---·--- 1--- -- - - ------------------·- ---- r----Male 7,009 94,457 35,989 168,976 112,528 61,115 480,074 -------------- ---·· ------·----------- ---- - - ------ - ·-·------·- ~---~ ·· --- ·----·-- ---1- - ---- - ------- 1--------- ------- ---r--------Female 6,739 90,353 34,946 167,685 121,604 79,576 500,903
Pinal Total 3,562 51,958 18,489 97,655 59,075 39,153 269,892 ------ ----f----------1-- -- ------------- --· ·--------- --------1--- - - ----------r----------~------r---- ----Male 1,806 26,788 9,703 55,721 29,800 18,614 142,432
1--------------~-------- ----- -- -------r---- --- ---·-- ....... -·-------- -~-·- - -
Female 1,756 25,170 8,786 41,934 29,275 20,539 127,460 Santa Cruz Total 937 10,923 4,061 13,755 10,348 5,279 45,303
r----- ------ r--------------- r---- --- -- ------1-- - ----- ---1-· Male 469 5,544 2,048 6,312 4,796 2,353 21,522 1------- ---------r- ---------- --- - -- . - -----·--- 1----- -- - --- --
23,7811 Female 468 5,379 2,013 7,443 5,552 2,926 Yavapai Total 1,958 32;388 13,269 60,814 57,467 46,826 212,722
- -- ·- --------Male 1,012 16,614 6,921 30,927 27,265 21,638 104,377 r-------- r----- ---------- ---------1--------I--· Female 946 15,774 6,348 29,887 30,202 25,188 108,345
Yuma Total 3,587 44,239 15,447 60,810 37,338 34,078 195,499 1-------- ·- ----------- ··- -·--------- ------···- --Male 1,829 22,633 7 ,804 31,401 17,704 16,302 97,673
---- -- ---- .. ------ ·---·------------ -- -Female 1,758 21,606 7,643 29,409 19,634 17,776 97,826
Note: Two data sources were utilized in producing the 2006 population estimates. The totals for the State and each of its counties agree w ith the projections released by the Department of Economic Security (DES) on March 31, 2006 (http://www.workfo rce .az.gov/?PAGEID=67&SUBID=138) . The percentages of population breakdowns by single-year of age, gender and racejethn icity were derived f rom the " Bridged-Race Vintage 2005 Postcensa i Population Estimates for Calculating Vital Rates", ava ilable from the National
Center for Health Statistics (NCHS : http ://www.cdc.govjnchs/aboutjmajor/dvs/popbridge/datadoc.htm#vlntage2005). These percentages were then applied to total state and county population projections for 2006 from DES. ·
~ 'U 'U
CD ~ OJ 1-J· X
;:t::>
Population: Age, Race, Marital Status Appendix B Page 1 of3
Yuma Data Bank POPULATION: AGE, RACE & MARITAL STATUS
Table 4: Age, Race/Ethnicity, & Marital Status by Community
Population: Race, Ethnicity by Community Foothills Gadsden City of San City of II Tacna I
CDP CDP Luis Somerton COP
I Whitell 22,236 II 279 II 10,214 II 3,530 II 355 II
Town of City of Yuma Wellton Yuma County
1,492 1158,95611121,5991 African ~~I 636 44 ICJ~~~ American
American ~~I 403 68 · ICJ~~~ Indian
I Asian II 121 II "')
II 42 22 II 4 II 6 II 1,333 II 1,676 1 .)
II Pacific.
Population: Age, Race, Marital Status App~ndix B Page 2 of3
35-4411 1,704 130 II 3,199 II 1,274 II 65 II 187 10,971 22,090
45-4911 872 63 1,355 II 561 29 I 83 5,189 10,521
50-5411 892 54 1,059 II 451 21 85 4,394 9,031
55-5911 1,560 45 639 332 34 92 3,546 7,963
60-6411 2,665 23 375 207 17 142 2,672 7,456
65-7411 6,958 38 656 358 27 366 . 5,697 17,173
75-8411 3,902 21 I 333 269 38 159 4,568 11,094
85+11 783 4 II 63 75 11 40 1,725 3,194
Notes: Data is estimated for 2006. CDP = Census Designated Place
Population: Marital Status by Community
Population Estimates 2006 - Race Classification
Foothills Gadsden City of City of ~ Town of II City of CDP CDP San Luis Somerton p Wellton Yuma
I Never Marriedll 1,480 II 194 II 4,970 II 1,731 II 73 252 II 14,754 1
Married, Spouse ~c:J~I 3,651 ICJ 1,080 I~ · Present
Married, Spouse c:J~EI 441 ~ 80 I~ · Absent
I Widowedll 1,974 II 16 II 461 II 378 26 104 . 4,343 I I Divorcedll 1,504 II 49 II 863 II 365 29 116 6,118 I
Males, Never ~~~~ 871 lc:J 131 ~ Married
1\!Iales, Previously ~~~~ 324 1~1 108 I~ Married
Females, Never c:J~EJI 860 1~1 121 I~ Married
Females, ULJLJCJUULJ Previously Married
Notes: Data is eslima!edfor 2006, CDP = Census Designated Place
Source: Claritas, 2006 estimates
Partners
http://www.yumadata.com/PopulationAgeRaceMaritalStatus.html 7/9/2007

Unemployment by Place of Work
Yuma Data Bank EDUCATION OF WORKING PERSONS
NoH.S. Some H.S., H.S. Some Education No Diploma, College, No
Diploma GED Degree
Foothills ~I 3,264 7,003 II 5,433 CDP
I Gad~~;~~] 85 60 I
29
City of San EJI 2,575 1,718 1,410 Luis
City of ~I 834
I 862 671
Somerton
I Tacna CDPII 71 II 43 65 75
Town of ~I 233 412 259 Wellton
I City ofYumall 5,669 II 7,365 12,290 13,071
I c!~:;[~JI 18,434 27,713 25 ,474
Notes:2006 data are estimates: CDP =Census Designated Place
SOURCES:
>> Claritas
Partners
<:;i ~y _t>f Vl_JMA
Arizona City of Yuma Greater Yuma Yu ma \ 'uma Western Yuma County Economic County County C ol k ge· Development Chamber of Libriu·y
Corporation Commerce District
http://www.yumadata.com/UnemploymentbyPlaceofWork.html
Appendix C Page 1 of2
Associate's Bachelor's Mastc Degree Degree Deg1
1~1 1,606 IC: ICJI 21 I~ 1~1 188 I~ ~I 102 I~
8 25 10 [:] 57 I~ II 3,046 5,028 I~
1~1 8,110 I~
Yuma Yuma Private f'v1etropol itan
Industry· Plann ing Council
7/9/2007

SCHOOL
KOFA HS
CIBOLA HS
YUMAHS
AZTEC HS
ANTELOPE HS
SAN LUIS HS
CATHOLIC HS
VISTA HS
PEP-TEC HS SAN LUIS PEP-TEC HS SOMERTON YPIC HS CHARTER DISTRICT 1 ELEMENTARY SOMERTON ELEMENTARY GADSDEN ELEMENTARY CRANE ELEMENTARY
YUMA COUNTY SCHOOL STATISTICS 2006-2007
ENROLLMENT DROP % OUT HISPANIC RATE
2,621 4.2 °/o 66°/o
2,353 1.7 °/o 74°/o
2,942 2.2 °/o 68°/o
105 70 °/o
375 6o/o 69°/o
2,151 4.0 °/o 99°/o
357 0 64 °/o
298 25.5 °/o 73 °/o
130 -- 97°/o
120 -- 92°/o
105 25 °/o 84°/o
11,001 -- 67.7°/o
2,761 --
4838 -- 99.9 °/o
6,408 -- --
Appendix D
FREE& REDUCED LUNCHES 62°/o
64o/o
70o/o
97°/o
63°/o .
99°/o
0
99°/o
98°/o
98°/o
0
69°/o
100°/o
66.25°/o

Ap'-pendix E GDC"s Diabetes Program- Data & Trends- Diabetes Surveillance System- Prevalence o ... Page 1 of 24
!!::AFltlll •HltAL.THII:R• PI:OPLt:: '"
Home
'(? Diabetes & Me
Learn about Diabetes
Be Active
Eat Right
Prevent Diabetes
FAOs
Publications & Products
Other Resources
-;~? Professional _ Resources
Co[lferences
DlatJutc:) Pub!1c He,;: i tt; r\ ::::d .. r ;. ,
Ho~ I AbQ!Jlthe_PLQ9&11J I Site_Mm21 Qont~-~LLL~
Data & Trends
National Diabetes Surveillance System
'·
State-specific Estimates of Diagnosed Diabetes Among Adults .
Numbers (in Thousands) with Diagnosed Diabetes, by Age and State, United States, 1994-2005
Arizona
Arkansas

)> ;:::J < )> z :J 'T1
< =1 )>
J) _, )>
j J)
j :J '.ll JJ -< :J :2 z ~ :) Tl
:0 T1 .fl
:J T1 z '") T1
)> :0
'.J :) z )>
"' :::> :::> J)
J1
T3. BIRTHS TO UNMARRIED MOTHERS, TEEN PREGNANCIES, TEEN BIRTHS AND RATES BY COUNTY OF RESIDENCE,
ARIZONA 2006
Unmarried mothers Pregnancies* to females 19 or younger Births to females 19 or younger -·----·. . . --· ·- - - r --
Number J Ratio** I Number
Apache 8171 68.7 -·-··- ------- --···-·---- ------- ······- ··----·---- ---·- --~- -- --- ----------- -- -------- · -- -- -- - -·
Cochise 664 36.7 ---· -- --~-- -- ··-· ------ ·--------- --- ------ -- ---· ----· ·--. - ··--·--- . . ·- ---- ---- r-- -- ·----- --- - -- -
~~-0~~~~-~~ - - -- -------· -------- -··---- ='-0-~51 ···. -- -------~~1 ..... Gila 405 60.7
Grah~~---------- ---------;·;~l-- --- -----~1.~----
----- - ---------- ------ .. --------------- -- -- --------- - ---- --- - ----------- . - --
Greenlee 54 49.1
Maricopa
-·--------·--·- ~---· ·- - - --· --
28,223 1 42.7 ----·--------- --1--- --------------+
--------------- ---- .. Mohave 1,167 1 47.3
1---------··- - - ---- -1·- --- ----· -- ---- ----~·--- -- -- ------· - -----·--
Navajo 1,092 1 58. 2 ·--------·----·+--------- ---·· ·---+--- -·- --------·1-------···-
Pima 6,215 44.6
·-1 -- ·- ·---·----·-· !
199
239
324
142
110
17
9,203
393
325
Rate*** Number Rate***
25.6 194 24.9
24.2 209 21.2
31.0 274 26.2
37.7 129 34.2 ------ t ·· ·----- ----- --35.5 105 33.9 -------··--·-- ------ ------+---
24.7 17 24.7 ··--~------- --t- ------ ------- --- -----1
35.4 7,903 30.4 --------- t----·------------·--·--+----- -. --------·· - -· --· -------
33.0
30.0
390 ----------- ·-----t-
311
32.7 -----
-·-·-·-.- -+--·----- ----- ·--------1 28.7
---------- -·--·-- - _ ___.,__ _
2,225 32.9 1,768 26.2 1----- ----·- --+-----·--· ------·· - --f -- ---------- --·--·---+---
Pinal ~----
Santa Cruz
Yavapai
Yuma
Total State** I 44.746 1
* The sum of live births, fetal deaths, and abortions.
** Per 100 births.
** Per 1,000 females 19 or younger. .
Note: The totals for the State may include records with unknown county of residence.
615
131
367
581
34.1
32.9
584 32.4 -- -----\" -- ---- - - ----~0.4
121 --·--·------·---1 ------------- ·-----··----f-----· --·-··- --·- -·-·--- - · ·· --
29.6 316 25.5
38.0 554 36.2
30.0 34 28.4
34.1 12,916 29.6
;)>I 'd '0 (l) ;:l p_, 1-'· X
r'%j
)> 0 < )> z n m < ~ r Vl -l
~ U) -l n (/)
OJ -< n 0 c z ~ 0 "T1 ;u m ~ 0 m z n m
)> ;u N 0 z )>
N 0 0 m
~ ~
T6. PREGNANCIES BY PREGNANCY OUTCOME, AGE GROUP AND COUNTY OF RESIDENCE~ ARIZONA, 2006
TOTAL <~15 !
15- 17 18-19 20-24 25-29 30-34 35-39 40-44 45+
Navajo Total pregnancies 1,937 .l 3 130 192 65 1 466 292 159 44
Births 1,877 ' 3 120 188 637 458 282 149 40 -·
Abortions 47 0 8 3 9 8 8 8 3 -- r---·
Fetal deaths 13 0 2 1 5 0 2 2 1
Pima Total pregnancies 16,644 45 727 1,453 4,871 4,448 3,017 1,552 379
Births 13,929 24 577 1,167 3,994 3,877 2,674 1,326 269
Abortions 2,636 21 146 283 858. 548 331 217 104
Fetal deaths 79 0 4 3 19 23 12 9 6
Pinal Total pregnancies 4,761 9 189 417 1,352 1,496 827 386 82
Births 4,467 8 183 393 1,256 1,429 776 354 67
Abortions 277 1 6 23 9 1 58 49 32 15
Fetal deaths 17 0 0 1 5 9 2 0 0
Santa Cruz Total pregnancies 837 4 so 77 217 213 173 84 17
Births 753 3 48 70 189 193 163 73 13
Abortions 81 1 2 7 28 18 10 11 3
Fetal deaths 3 0 0 0 0 2 0 0 1
Yavapai Total pregnancies 2,653 5 115 247 849 692 425 245 61
Births 2,380 4 96 216 771 633 393 215 49
Abortions 263 1 18 31 77 58 30 28 11
Fetal deaths 10 0 1 0 1 1 2 2 1
Yuma Total pregnancies 3,447 6 197 378 1,077 878 594 244 71
Births 3,354 : 5 187 362 . 1,051 855 584 240 68 !!. Abortions 81 1 9 14 25 17 8 4 3
Fetal deaths 12 0 1 2 1 6 2 0 0
La Paz Total pregnancies 235 0 13 23 87 67 29 13 3
Births 229 0 13 2 1 86 66 28 12 3
Abortions 6 0 0 2 1 1 1 1 0
Fetal deaths 0 0 0 0 0 0 0 0 0
Unknown Total pregnancies 84 : 0 5 6 17 27 15 11 2
Births 49 0 3 4 8 15 10 B 1
Abortions 35 0 2 2 9 12 5 3 1
Fetal deaths 0 0 0 0 0 0 0 0 0 - --
* Includes records with unknown county of residence .
Un-known
0
0
0
0
77
20
56
1
3
1
2
0
2
1
1
0
7
3
2
2
2
2
0
0
0
0
0
0
0
0
0
0
0
0
0
0
2
0
0
2
0
0
0
0
0
0
0
0
0,
o: 0
0
0 o:
Ol O! o; oi a:
o, oi ol 0
ol
:J::I '"d '"d (D ~ OJ 1-'· :><
GJ

)
Santa Cruz
Yavapai
Yuma
La Paz
Unknown
TS. BIRTHS BY MOTHER'S AGE GROUP, RACE/ETHNICITY AND COUNTY OF RESIDENCE, ARIZONA, 2006
TbTAL <15 15-17 18-19
Total 753 3 48 70 White non-Hispanic 54 0
Mother's age group
2o-24 I 25-29 T -;~=~~ --189 193 163
35-39 40-44
73
9
45+ Un
known 0
-+------·----_1{1 --. ---~lf ------0
0
0
0
0
0
1--------------- ------ - --Hispanic or Latino ~J - 1_~1 . ~ - - -~
~:~::~:k:~:~~:.:~~:~=~=·~t~~~-·-# -- ·-=:: -II-~~-·~ ~-~-- -6
~~-~- ~J~~L1+~~ -!l-_ ~~lk=/l~=~-~-~--·-- 0 2
46
Black or African American
697
0
3
Total 96 633 215 3 0 --- -- - --- - ·-- ---------- ·-----White non-Hispanic 436 159 _______ __ .9_ Hispanic or Latino ___ ___!25 45 _____ o Black or African American 6 0 0 American Indian or Alaska Native 10 --- 1· ----;· 0
Asian or Pacific Islander 0 0 2 12 7 1 0 --+----- - ------
Other/unknown 0 0
~~~t1
e non-Hispanic ------±-=mt----- -------61-----~~~ 362
67 Hispanic or Latino
Black or African American
American Indian or Alaska Native
13
1,051
230
4
855
184
Asian or Pacific Islander 59 0 0 2 9 2: - ---1r--·--- - ·-- - - ·----
2 3
584 240
143 41
19
0 1 1 0
- ---4---it------% 68
12
53
0
0
1
0
0
0
0
0
Other/unknown
·=r -~~!lL=t--- r -$16~1 *28~ 1 $7~r - -6~ 5 . 0 0 1 1 2 1 11 Ol Ol Ol 0 1 1
Total 28
13
8 Black or African American 0 0 0
1
10 -
5
3 -
0 American Indian or Alaska Native 0 1 0 1
0 1 0
1 0 1
Asian or Pacific Islander I ~I ~ 0 0
Other/unknown 0 0 1 1 01 0 1 0
*"Refused", "Yes, divorced", "Unknown"
;I:>' r-o r-o (l)
::I OJ t-'· X
0::

)> 0 < )> z n m < ~ )> I
Vl _, ~ U) _, n Vl OJ -< n 0 c z ~ 0 II ;o m ~ 0 m z n m
)> ;o ;:::J 0 2 )>
"-' 0 0 0"1
~ Ul
T26. SELECTED CHARACTERISTICS OF NEWBORNS AND WOMEN GIVING BIRTH, YUMA COUNTY, ARIZONA, 2006 .:
Mother's age group Total ----··- . ,----·------.--·
<15 15-17 18-19 20-24 25-29 30-34 35-39 40-44
TOTAL 3,354 5 187 362 1,051 855 584 240 68
Payee for births AHCCCS 2,114 5 167 302 716 461 286 133 44
IHS 5 0 0 0 0 3 2 0 0
Private insurance 1,063 0 9 43 279 348 269 92 21
Self 169 0 11 17 54 42 27 15 3
Unknown 3 0 0 0 2 1 0 0 0
Marital status Married 1,843 1 25 96 501 551 445 177 46
Unmarried 1,470 4 162 264 540 291 128 59 21
Other* 41 0 0 2 10 13 11 4 1
Prenatal care No care 166 1 10 21 48 40 26 14 6
1st trimester 2,034 1 87 180 638 539 402 149 37
2nd trimester 783 3 -59 106 257 174 109 60 14
3rd trimester .370 0 31 55 108 101 47 17 11 '
Unknown 1 0 0 0 0 1 0 0 0
Prenatal visits No visits 166 1 10 21 48 40 26 14 6
1-4 visits 241 0 22 28 82 (:)4 25 13 7
5-8 visits 753 2 63 94 232 182 118 4i 15
9-12 visits 1,419 2 68 153 455 350 258 105 26
13+ visits 772 0 24 66 233 217 157 61 14
Unknown 3 0 0 0 1 2 0 0 0
Weight at birth <2,500 grams 195 0 12 25 55 39 41 21 2
2,500+ grams 3,159 5 175 337 996 816 543 219 66
Unknown 0 0 0 0 0 0 0 0 0 -
'Refused', 'Yes, divorced', 'Unknown'
45+
2
0
0
2
0
0
1
1
0
0
1
1
0
0
0
0
0
2
0
0
0
2
0
I I
,.
0::>1 1"(1 ro (D
::I · OJ
1-'· ~
H

)> 0 < )> z (") m < ~ )> r IJ) _, j tn _, n til CP -< (")
0 c z ~ 0 II ;o m ~ 0 m z (") m
)> ;o N 0 z )>
N 0 0 0'1
w
Tl. NUMBER AND RATE OF B1IRTHS AND DEATHS BY COUNTY OF RESIDENCE, ARIZONA 2006
Population *
Apache 74,691
Cochise 134,789
Coconino 132,826
Gila 55, 102
r--- --Gr aham 35,873
Greenlee 8,281 -- --. --- ------------ --
Maricopa 3,764,446
Mohave 194,920
Navaj o 112,672
Pima 980, '1 77
Pinal 269,892
Number of b i rths
1,189 1 - __ l
1,808 i - ... 1-
2,062 1 I
6671 I
540 ·
11) 66:160 f .
Rate of births per 1,000 population
Number of deat hs
1 5 .9 454 ··---- ----+------- -- - ·-· . - ..
13.4 1,140 . ---- ____._ _ --
15.5 1 619 . ----- ---!--- .. ----·- -- -----
1 2 .1 1 627
15.1 1 295
13 .3 1 65
17.61 25,176 1 I --- ----
2,_468j1
1,877 --- · - I
13,929 1
4,467
12.71 2,354
16.7 1 860 ·----!--·- -·-··· - -. --- -- ---.
14.2 1 7,885 - -·- ------ ---- -- ·-----------·-- ----
16.6 1 1,948 1----------------- 1---------------------- ---~ - ---. -----------Santa Cruz
Yavapai
45,3031 753
212,7221 2,380
16.6t 238 - -----------.,
11.2 2,386 ------+------·- --- -. -------
Yuma 17 .2 1,164
Rate of deaths per 100,000 population
607.8
845.8
466.0
1,137.9
822 .3
784.9
668.8
1, 207.7
763 .3
803 .8
721.8
525.4
1,121.7
595.4 195,4991 3,354 ---------------~------------- - ----- ------ ... --- - --- --- --- --+---- -- --- --·-· .. -----------!---------------·--- ·--
La Paz 21,489 229 10.7
Total State** 6,239,482 102,042 16.4
* Total state and county population estimates for 2006 as re leased by the Department of Econom ic Security on 3/31/2006 .
** Included records with unknown county of residence .
200 930.7
45,415 727.9
:PI t"(j t"(j (l)
::J OJ I-'· X
y

t>
~ t;; 2 "') , ..... ......
=l t>
fl -1 t> :j fl -1 =) fl ):1
< "')
2 2
~ ) Tl
0 n f) .... J n ;;-=) n
t> 0
~ ) ~ C>
'-' ::> ::> j\
!::>.
T2. LOW-BIRTHWEIGHT BIRTHS A~D INFANT MORTALITY BY COUNTY OF RESIDENCE, ARIZONA 2006
Low-birthweight (LBW) births
LBW births per 100 births
Apache so l 6.7
Cochise 171 9.5 -
Coconino 175 8.5 --
Gila 59 8.8 1---- -----------------------------t----·- ·----- · -------1---- -· --------- -- -----------··· --
Graham 46 8.5 1-- . ------------------ -+ --- --------------- ----- --------1------------------
Greenlee 5 4.5 ~- -· -····-------------------+---- --------- -------·-+·- -------- ---- · ·~---
Maricopa 4,638 7.0
6.3
8.1 -
7.5
6.7
6.9
7.2 -
5.8
Mohave I ~55 --- -·----- -
~~ajo ____________ j __ _ 152 ________ _
Pima l ' 1,047
Pinal I -~ Santa Cruz =42
----------
~Yavapa_i -------------+------- 17-=- __________ _
Yuma 195
La Paz 14 6.1 -
Total State 7,266 7.1
Low-birthweight : Any neonate whose weight at birth is less that 2,500 grams (less that 5 pounds 8 ounces) .
Infant deaths Infant mortality rate per
1,000 live births
6 5.0
17 9.4
10 4.8
3 4.5 ---------------------
2 3.7 ----------- --·--
0 0.0 ----------- -----·· --- -- - --+---- -------------
406 6.1 - -- --- ·-···· -----·-·-- ,
18 7.3 -1------------
9 4.8 ----- ------
100 7.2 --
29 6.5
4 5.3
19 8.0 ---
I 18 5.41
I 1 \ 4.41
642 \ 6.31
Infant mortality : Any death at any time from birth up to, but not including, the first year of age (364 days, 23 hours, 59 minutes, from the moment of birth).
•
~ '0 'U (1) ;:J OJ 1-'· !><:
~

')> 0 < ')> z n m
< ~ ')> r l/)
~ ')> ;j U1 ;j n tn OJ -< n 0 c z ~ 0 11
;;o m U1 ...... 0 m z n m
')> ;u N 0 z ')>
N 0 0 0'1
lT1 0
T29. LEADING CAUSES OF INFANT DEATH BY COUNTY OF RESIDENCE, ARIZONA, 2006
Certain conditions originating in the perinatal Qe!"iQ.~ - ______ ________ . ____ ·-·-· _ _
Maternal complications --·----- ··- ·----· -· --·--·--- ··--··-··
Complications of placenta, cord and
"' ..... 0 1-
County of residence -r- ---- -- -- -·-r ---·· -r - - --
: 0 QJ "' I I ~ aJ aJ ! c E aJ a. aJ o 1 1..
'5 .~ ·c: "' "' :: 0 ~ ·;;- "' ni u "' ~ o = ~ QJ ~ ~ > E c "' c. u u (!) "' aJ 1.. o ro ·- ·- _... - 0 0 ~ ~ "' ~ z ~ ~ c ~ u u (!) (!) ::t ' "'
Ul
ro c. "' > ro >
"' E ::J >
N
"' ~ "' ..J
-- :::=~~~~~~~:~:~~:~-~:: :~:~\~ =:----- - ~ ~ -~ ~ ~ -- ---~ __ 6' ~:~~--J ~J __ :~:=_- _t=J~-r - t _ ~ ;~·~;:;;.:;:~Ye::;;~me__ ---- ------ --~ ~ -~ - -ci ~= -~ J -~~t -~} ·-_: ·-1-j -~-ir_---% ... -- ~ _::j~- --~ ::::;;:~i:epsis of newbor~ ----- --- ___ ·---- ________ __ b ------~ ~-- -5r·--- -6l ----- ~ - _ - -~r--- 2
; ~ ----6-- ----i -- . -~ ... -- % ----~ ----~ - - ----5
,_ ______ -~J -~~l-~:-t_~r=J~~~=~----~ ~ -~ ==F~i~-~3:~~1 Congenital malformations
of heart
of brain, spinal cord or nervous system 0 1 0 0 0 0 18 1 0 4 3 1 0 0 0 ------- --- -- -. ----r--------- r--------1-----r---- -- --r-·- ---
of respiratory system 9 0 1 0 0 0 6 0 0 2 0 0 o o o . - --- ---- -, -- --- --- -- -- -------r------ ------·- - -- - - - --j
Sudden mfant death syndrome 37 0 2 1 1 0 0 21 1 0 7 2 o 1 1 o - - ---- ------ 1--- - ----1-- -- -·- - ·-- ----- - --1----· ----- -'----1- --- - -
Accident (unintentional injury) 17 0 0 0 0 0 0 12 0 1 2 1 1 0 0 o t------'--------"----'--=------- ----- ---- ---- --r--------1-- ------- - ----
Motor vehicle accident 2 0 0 0 0 0 0 2 0 0 0 0 0 0 0 0 . - - - -----·-& - - ------ -- --- --- -------- 1------ r----- --·-1--- -- ..... _ ------
Accidental drowning and submersion 2 0 0 0 0 0 0 2 0 0 0 0 0 0 0 0 1- - --1-- - - ·---- --------- ... - - --1-- - --r---- 1--- . ---- .. - ·- --------
r--Accidental exposure to smoke, fire and flames 1 0 0 0 0 0 0 0 0 1 0 0 0 0 o o ---------'-=----------- --- __ ,,, - ___ ._ ......... - ... - ·--1----1---- - ---- r--- --- 1-- -t--- ------"---------· -----
Mechanical suffocation 9 0 0 0 0 0 0 6 0 · 0 2 0 1 0 ) 0 0 ------ - ----------·-·· - ------- - --- r- - - - r---- ------1--------1-------1---- -- 1--- .. -,---.------1----- ---- ----1
Choked on food 0 0 0 0 0 0 1 0 0 0 1 0 0 0 o: 1----------------------·-·------ ---·- --. --- -- -------t------- "1 Influenza and pneumonia _________ 13 0 0 0 O _____ _Q_r--_ _..!_~ _ 0 0 0 0 0 2 _ 0 0~
0 1 0 0 0 5 0 0 5 0 0 0 ---~~----~1 Diseases of the circulatory system 12
0 0 0 0 0 11 0 0 2 1 1 0 0 0 -t-- --t---1------ -- ·- ------ ·---·--- --- ----- r------ -·- - ·- ------- - - - --- - r-----l---- .. - -
15 Diseases of the digestive system - ·---·-----------~-
::::~~1~::~:i;:;vous _•v•=~- ~==--__ -t_t~) ~-0 _j~~=::t~-t~=~=-==1 --i=-~ ~~c---~-=~-~--! I -~ ~~ Other ill-defined and unspecified causes of mortality
33 0 3 0 1 0 0 18 2 0 5 2 0 1 1 0
Total, all causes* 642 6 17 10 3 2j 01 406 18 91 100 29 4 19 18 1
* Includes causes of death not shown above.
~ t'Q t'Q ro ~ Q, 1-J· >:
t-t

}> 0 < }> z () m < ~ }> r (f)
-1 }> ;j . (f) -1 n (f)
OJ -< ()
0 c z ~ 0 11
;::o m ~ 0 m z () m
}> ;:o N 0 z l>
N 0 0 0'1
V1 N
T31. LEADING CAUSES OF DEATH AMONG CHILDREN (1-14 YEARS) BY COUNTY OF RESIDENCE, ARIZONA, 2006
ttl ... 0 1-
CIJ ~ u ttl c. <
CIJ .~ ~ u 0 u
0 c:: c:: 0 u 0 u
ttl
Cl
E ttl ~ ttl L.
Cl
County of residence
~ T ·~ ····· ·~ ro
u I ttl ttl E ·- ~ > :a 0 ttl 0: ~ l ~ z
r ..
ttl
·= Q,.
r -~-
:::~ L. u ttl ... c:: ttl
(/)
·;a c. ttl > ttl >-
ttl
E :I >-
N ttl Q,.
ttl ...J
4 1
2 1
2 0 ~~::~::~::~:~~~;~~:.~~~~~~;~~ ~ -~~~ -~ !~ ~ : :t --l ··. ~~ . _: :: ~-- ----; ····· .. :1· --l~ : . -~ :
~a~~~dental:xp~:ure-~~~smo~-~~~:- _____ 6 . . 0 ... oJ. 0 . ~i u ~· 3 2 0 0 __ . ~ · --~ c_!dental poisonin_!!_ .. -~-- ~ ....... _ . __ .. a ___ _o __ o __ o .... . -~ ... _ ~ --~ .. ... o o o 0 _ . . 9 ___ _{l
Assa~;;::::~~~m_s_ -~-- -· .... . ... - - :: . : - ~~~ : ... -J- --:i --~~ : ·-< ----~ --- ~ - - l : -~ . ..... ~ -- ·~ By discharge of firearms
~----------- - . _ ----------------+------~-------·t-- ---- t ---- -t--- - ---t --r------i-----~ -- - --r--r---------j------t-·---------r------ -r---------61 Ol Ol Ol Ol Ol 51 Ol 0 0 11 Ol Ol Ol 0
------t--------+ --- ------ --1 - -- -+------ +-- -- --+----+------+---l-----+- ·--- + -----1---+----+---- -+----- -9 OJ 0 0 0 1 6 1 1 0 0 0 0
0 0 ~----------------------= ~~~1-1- ·:1 2:1 . J lr al 2
By other means 0
Congenital malformations 28 OJ 0 0 0 0 3
Intentional self-harm (suicide) 1
0
ol 2l ol ---~ 0
0 111 0
By discharge of firearms
By other means
Diseases of heart
Influenza and pneumonia
Septicemia
Cerebrovascular diseases
Asthma
Total, all causes
0 0 --- ---~- -- --+------+--+-------~1 - ---r---;r- ---;r---~r-- o - -·---t---·t--1
51 0 0 0 0 0 2
0
-a= 0 2 0 1 0 2 3[-------- 0 0 0 0
12 0 0 0 1 7 0 - ----- -___ --f- - 0 1 2 0 0 1 0
8 1 0 1 0 4 -- --+------- 0 0 0 2 0 0 0 0 0 0 0 0 0 OT -
-----r-6r-----~r-~---~r--- o -r-
3 0
3 0
6 0
278 6
0
0
0
3
0
0
0
5
0
0
0
2
OJ 3
OJ 1 0
OJ 3 0
4 J 166 6
.o
1J OJ 1J 01 0 0 0
0 1 1 0 1 0 0
14 31 21 2 7 10 1
NOTE : There were no deaths among ch ildren 1-14 years in Gr~enlee County.
:J:::>I ~ ~ (!)
::s 0J 1-'· X
:3:

)> 0 < )> z n m < ~ ):> r l/) _, ):> _, [i) _, n l/)
OJ -< n 0 c z ~ 0 11
;u m (/)
0 m z () m ):> ;u N 0 z )>
N 0 0 Q')
U1 ~
T33. LEADING CAUSES OF DEATH AMONG ADOLESCENTS (15-19 YEARS) BY COUNTY OF RESIDENCE, ARIZONA, 2006
Accident (unintentional injury)
llJ ~
0 ....
190
150
Q) Q)
..r: .~ IJ ..r: llJ u a. 0 <t u
7 1
3 1
0 c c 0 u 0 u
r ~1 -
E llJ llJ = ..r: l' llJ
"-l'
Q)
~ c: Q) Q)
"-l'
County of residence ···-T- ·- -·
I
[ Q) 0 0 > ..... llJ
.~ ~ ~ E "- 0 llJ 0: ttl ~ z ~
-1 ~ c: ii:
14
N :::J "-u llJ ~
c: ttl II)
1
ttl a. llJ > llJ >
11
8
llJ
E :::J >
0
0
N llJ 0. llJ ...I
0
>---~~~~~:::: :~~::~.:: :;~;:~::~~;~~=~- r---; -~ : -~r -:f ----Motor vehicle accident
~ ~ - ~~ - -l~- J-!L~s 61 - -a j -----=~- -~f-s: 1----t 1 ~f- -- -=~~- --~-3 -· ·- - .. :L j- :l· ·· ~ ----1 --- ~ ---t--~-- ~ -~ - ~ - 1
0
0
0 0
0 0 ---- - - !--··· -· .•... ·---4- .- . ----~ ·---·-- --+-- ·-- ·- .. +--- ··· -·+--·- ·-!--- -- .. ·--- - -----·-
0 0 0 ----+· 0 0 ----- ---+------+-------1----- +---·---l----+----+--------+---- ---+---- --·
0 10 0 0 5 0 Accidental poisoning 16 1 ---+---.
0 0 0
Assault (homicide) 79 1 0 1 0 0 0 56 2 2 11 3 0 1 2 0 +· . --+··· ·---·+- - ----- ··-·-·-·---+- - -- -- +- ··. --+----·+ ··--·- - ·- --+-----+---- -· -+-····----+- ---·- -+--- -----+-· ..
By discharge of firearms 61 0 0 0 0 0 0 49 0 0 10 1 0 0 1 0 ·-- - - -~-----+ -- ··- -+ ·- ·---- +----·--- ··-· ----+-- ------1----+-- ·- +-·--- -----+-·- ··- - ·-------- -- -
By other means 18 1 0 1 0 0 0 7 2 2 1 2 0 1 1 0 --+ ·----- -+- - - -+ --- - -+-----l ----1- ·-·-- +----+---+-- -+-----+--··-- -+--- ---
Intentional self-harm (suicide) 57 2 3 2 1 1 1 29 3 5 6 2 1 0 1 0 r------ -~-~-------1- -·· --- ··--~-- -+----· ------ ··-+----+----+-----
By discharge of firearms 28 0 1 0 0 1 1 17 2 3 1 0 1 0 1 0 ----- 1- ·- ---+-- ---- ·- l-- -- -+--·- -- + -----+-- -·- -+--- -+--- -- +-·-------+- ----+------+----+---+--- _.......,
By other means 29 2 2 2 1 0 0 12 1 2 5 2 0 0 0 0 ---. --+--+-- --+--- ---1----+----+- - --t-- - - + ----l---+-·-·- --+----+----
Malignant neoplasms 15 2 1 0 0 1 0 7 0 0 1 2 0 1 0 0
1 0 1 Diseases of heart r-- ------ ----~:=r~-r-~--- r---+--- +---+----+·--+ - -· +------+-------0 0 0 1 0 0 5 0 0 0 0 0 -----+- ·--+-----+-----·-+--·-----+---·-
0 0 0 0 0 3 0 0 0 0 Congenital malformations ~ -~ I I 0 1 ---- - --~--- -L-.-J 1 0 41 0
Cerebrovascular diseases 1 0 0 0 0 0 0 1 0 0 0 0 0 0 0 0 ·--+---4 -----l--- --+- . -· ··1-----·--+ t----- -1-~-- -
Influenza and pneumonia 4 1 0 0 0 0 0 2 1 0 0 0 0 0 0 0
Total, all causes 412 16 6 14 4 4 11 233 9 20 58 23 3 15 6 0
..
•
:t:>' t"() t"() ([)
::J OJ f-'· ~
!Z

)> 0 < )> z n m < ~ r l/)
~ (f)
--i n (f)
OJ -< n 0 c z ~ 0 11
;;o m (f)
6 m z n ..m )> ;;o N 0 z )>
N 0 0 (J)
U1 (J)
T35. LEADING CAUSES OF DEATH AMONG YOUNG ADULTS (20-44 YEARS) BY COUNTY OF RESIDENCE,
ARIZONA, 2006
County of residence ---
0 Q) N
iU Q) Q) E ttl Q) :I c: Q) a. 0 L. ttl ""' .r::. Ill
ttl ttl c: 0 > .,..., ttl iU u c. 0 u .r::. c: .c: u ttl ttl E ttl 1- ttl 0 Q) .r::. > c: ttl u ~ ttl 'i: > a. 0 u L. Q) 0 ttl 0:: 0:: ""' ttl < u 0 ~ L. ttl
~ z c: u ~ ~ ttl >
(/)
Accident (unintentional injury) 1,059 31 25 25 12 12 2 590 28 41 180 58 5 24
Motor vehicle accident 535 19 16 19 7 10 2 275 16 23 74 42 2 14
Accidental poisoning 346 1 6 3 3 0 0 206 6 10 91 8 1 6 -- ---1---
Intentional self-harm (suicide) 388 7 8 12 4 3 0 218 11 16 66 19 0 19
By discharge of firearms 197 2 5 4 3 1 0 114 7 6 35 5 0 12 -
By other means 19 1 5 3 . 8 1 2 0 104 4 10 31 14 0 7 ·-
Malignant neoplasms 300 4 5 3 2 1 1 173 9 6 54 16 2 11
Malignant neoplasm of colon, rectum, and 26 0 0 0 0 0
anus 0 17 1 0 4 4 0 0
Malignant neoplasm of trachea, bronchus 16 0 0 0 0 0 0 9 0 0 5 0 0 1 and lung
Malignant neoplasm of breast 42 0 1 1 0 0 0 26 0 2 8 0 1 1
Assault (homicide) 321 4 1 5 3 1 0 225 8 7 45 12 1 4
By discharge of firearms 264 1 1 3 1 0 0 200 6 0 41 6 1 2
By other means 57 3 0 2 2 1 0 25 2 7 4 6 0 2
Diseases of heart 236 2 10 5 1 4 1 122 4 10 50 14 3 7
Chronic liver disease and cirrhosis 99 2 2 3 2 "1 0 46 2 8 25 2 1 4
Human immunodeficiency virus (HIV) 62 1 0 1 1 0 0 40 1 0 11 3 0 2
disease
Diabetes 56 3 1 1 2 0 0 28 4 2 13 1 0 1
Cerebrovascular diseases 65 0 3 2 0 0 0 37 5 2 7 5 0 1
Influenza and pneumonia 39 0 2 2 0 0 0 26 1 2 4 0 0 1
Total, all causes 3,258 68 68 78 36 22 7 1,863 89 126 563 154 18 94
N ttl ttl E 0. :I > ttl
..J
21 5
11 5
5 0
5 0
3 0
2 0
13 0
0 0
1 0
2 0
4 1
2 0
2 1
3 0
1 0
1 1
0 0
3 0
0 1
60 11
c: ~ 0 c:
.::t!. c: :J
0
0
0
0
0
0
0
0
oi I
o! 0
oj ol
0
0
0
0
0
0
1
•
:t:=' 'U 'U (J)
:::I OJ t-' · X
0

l> ::J < l> 2 :1 il
< =1 l>
.f) __, l> __, :r; __, :::; .f)
JJ -< :1 2 2
~ :> , ;o , £! ::J il 2 :1 il
l> ;o
'-1 :> 2 l>
....., :;) :;) :J"'
J1 :::0
T37. LEADING CAUSES OF DEATH AMONG MIDDLE-AGED ADULTS ( 45-64 YEARS) BY COUNTY OF RESIDENCE,
ARIZONA, 2006
County of residence ., I r·
... r· - r· -- -·· -T -· l
I ..
I N
iii I1J I I1J 0 E
I1J ra I1J :::J r:: r:: I1J c. 0 L.. ra N ~ ..... .r:. Ill ra r: I 0 > ·~ ra iii u 0. ra ra 0 v r:: ra ra ra E E 0 ·
1- ra .r:. 0 .r:. I1J
v .r:. > c: ra ra a. r:: v (!) ra 'i: > :::J 0. 0 v I1J 0 ra n: n: ..... ra .::t:. L.. ra r: ra > < u 0 (!) L.. ::t z ..J r: u (!) ::t ra > ::;)
I tn I
Malignant neoplasms 2,508 19 65 40 28 10 2 1,388 151 37 442 127 22 114 51 12 0 -- ·---
Ma I ignant ne-o-pTasm_o_fcofon~ .rectum, ·---- ----·- ----- --- ----- -- ----- . . -----1- --·----f----·--·-!----· - - - ---- ---- - -- . - -- ------
204 2 7 1 5 0 0 113 8 3 40 10 0 10 3 2 0 ~nus _____ _ ______________________________
- .. - ---- ----· . . ·-- -·-····- ---------·-- ---·-----·- --------·- ------ - --· . 1--- -· -·· -- . ·---- ---Malignant neoplasm of trachea,
683 7 22 9 8 1 1 379 55 7 111 37 1 21 23 1 0 bronchus and lunQ ----------- ----- ------· --- -·-··· - ---- r------- ----- -- ----------- ---- f--- - ---- ----!---- -·· 1- - - - - - ...
Malignant neoplasm of breast 275 2 6 3 3 3 0 149 16 4 52 11 4 18 4 0 0 ·------ - ---- --- --·- --- ---.. ------- . ··- t-- --·--· !-··· -······- ------- !--- ·--------- - -----:---- --- -- ·----- r--- - -- ·- - -·-- ------ --- . --- ---
Diseases of. heart 1,753 18 59 20 19 10 4 937 115 32 302 100 4 79 38 16 0 ------~-------·-- -·--··· --t-- ---- .•.. -· - ~------- 1-·- -·--- r------- t-· - -----
Accident (unintentional injury) 812 16 27 25 12 2 1 429 40 25 137 43 2 31 13 9 0 '----· ----·----. --!----·-f-· - - - - - - ---- ·-·--1------t--- --- -·- ··--- -------
Motor vehicle accident 320 7 12 17 4 1 0 158 26 10 40 23 1 13 5 3 0 -- ------ ---- - -- - ----- ----1----1-----· - ----- 1--------- ----- f--· ---- - ------ ---- ---·- ------ ---
Falls 60 0 0 2 3 0 0 33 2 2 11 4 0 3 0 0 0 ,___.._. ------· --- ---r---- !--- ·-- t--·-- r-· ------1----t-·- -------
Accidental poisoning 264 1 7 1 5 1 1 157 9 4 52 8 1 11 3 3 0 -- - ··--·-
Chronic liver disease and cirrhosis 350 6 1 10 9 5 0 181 16 13 67 14 3 15 6 4 0 - ---___ _. ___
1---- · ----- --- ------ ------- r- -- - - ---- !------ - r------ 1---- ---- - - ---Chronic lower respiratory diseases 319 3 3 5 4 1 1 178 23 4 57 14 1 16 7 2 0
-- -------- ·- · - 1-----t--·· ---1--- ----- -· ----· Diabetes 324 6 0 5 6 1 0 174 22 8 55 17 2 13 12 3 0
-- - ----- ----- - ---- - -- 1
Intentional self-harm (suicide) 295 2 10 6 3 0 1 154 16 6 49 19 1 18 7 2 11 ------r-- -- --!----·- t----- ---·- r---·---· - --- - --- ---- · - -------~
By discharge of firearms 182 1 8 4 2 0 0 89 11 3 31 14 0 13 5 1 0, --- --- --··- --- - ----- i
By other means 113 1 2 2 1 0 1 6:S 5 3 18 5 1 5 2 1 11 -·-· -
Cerebrovascular diseases 249 1 3 1 2 0 1 141 10 3 47 17 2 12 9 0 o! -- -- ---:---- 1---- _j
Influenza and pneumonia 160 0 2 4 1 1 0 88 8 5 30 7 0 6 6 2 O! - -·--t----
Septicemia 116 . 3 2 2 1 0 0 69 5 5 18 5 0 1 5 0 0 - --I--· --
Nephritis, nephrotic syndrome and 95 4 5 2 1 1 0 35 6 2 24 8 2 2 2 1 0
nephrosis --- ----1-·- f---· ·1-----1-- t--· ~-----
Assault (homicide) 84 2 1 1 1 1 0 51 3 3 13 3 0 2 1 2 o. ·---- --1---- - -- -+-· --·- -,
By discharge of firearms 36 1 0 1 1 0 0 25 0 0 7 0 0 0 0 1 0 -- -- ··- 1------ 1------f-· ......,
By other means 48 1 1 0 0 1 0 26 3 3 6 3 0 2 1 1 0
Total, all causes 8,618 107 205 151 119 44 12 4 ,693 487 180 1,498 449 45 373 194 59 21 --'--· -- --
...
::t::-1-Q t-o ro !:l 0., J-l · X
'U

:t> 0 < :t> z () m < ~ :t> r (/) _, ~ U) _, n (/)
co -< n 0 c z ~ 0 -n ;o m l/)
6 m 2 n ~m
:t> ;;o N 0 z :t> N 0 0
""
"" 0
T39. LEADING CAUSES OF DEATH AMONG ELDERLY (65 YEARS AND OLDER) BY COUNTY OF RESIDENCE,
ARIZONA, 2006
County of residence
I
I
.. --· fj I ~ -- r -_ -- · -
-m r
··-
0 ~ N
ni ~ ~ E ~ ::s c: ~ c. 0 &.. ~ N ... .r::. .!!! ~ ~ c 0 ..... u c. ~ 0 u .r::. c: .r::. u ~ E ~ ~ E a. ~ ~ u 0 (:; ~
~ 'i: > ~ > ::s c. 0 u &.. ~ 0 ~ ~ ~ ... ~ > t'J
< u 0 (.!) &.. ~ l: z c: ...J
u (.!) l: ~ > U')
I
Diseases of heart 8,343 56 249 75 111 65 10 4,643 442 126 1,466 340 42 465 211 42 - -···-· -- ---- --- -------------- --- --- -------- ·------· ---- -- ------ - - ----- . - - -- - - ----- ----- --------- ----- ---- - ------ --- ------- -- -- r-- --- -- ------ - · ·· -----
Malignant neoplasms 6 ,925 46 197 77 118 45 17 3,654 444 97 1,237 321 37 424 182 29
---Malignant neopTasm-of colon, rectum, ---·-·· --- - ·-- -- ~· ----- -- --- -· ---- - - -- -- ---- ·-·------ -- --------1---- - ---- --------- -- --- !---- - - ---- . -- -----
687 2 23 3 9 5 4 350 45 10 118 34 2 60 19 3 and anus __ _ _____ - ------ - ~----- --- --- - - --- -- -------- - -- -----·· - - - - - --· ------- -- -- - -----r---- --- -- - - ·- ------- ----- -------Malignant neoplasm of trachea,
2,018 11 53 20 38 10 3 1,043 162 24 355 104 5 1'21 61 8 bronchus and luna _ _ _____ ------ - --------- - 1------ -- f-·- - r----- --- --- -·-Malignant neoplasm of breast 427 1 6 3 10 1 0 251 16 5 87 11 2 23 10 1
Malignant neoplasm of lymphoid, -- ----- ------ -· - - ---- .. ------ -- --
718 4 16 4 11 4 1 404 33 11 149 22 2 32 23 2 hematopoietic and related tissue -- - ·---- ------ - - - ---- . ---- ---- ---- - -------· - --Malignant neoplasm of prostate 464 3 15 5 9 7 0 240 31 10 80 18 6 29 9 2
---- - ---- --- ------ ---·---- ------- ------- -- ----- -- -r--- --- r----- ---- -----Chronic lower respiratory diseases 2,430 8 60 14 32 17 2 1,296 174 27 422 123 8 163 73 11
- ---- -------- ---- - - ·-- - ---Cerebrovascular diseases 1,839 12 53 20 34 14 2 1,036 69 26 326 74 12 107 45 9
·---------- ---- -- - - - - -- r------- -- - -- r- --r- -- --- -- ~
Alzheimer's disease 2,036 7 26 15 38 6 0 1,436 86 29 215 52 9 108 6 3 --- ---- -- ----- --- - - ----- ---t-- --- - ----- --- ---- - - --r-- -- - - - !-- - -- - ~
Influenza and pneumonia 923 14 23 8 8 7 1 492 32 22 185 27 5 56 40 3 ··- ----· --- - -· - - ·-- -- r-- ·- t--· ---- - -
Accident (unintentional injury) 97 1 17 23 10 20 4 2 579 26 14 156 28 11 54 22 5 ---- ------- -- - ------ --·-- 1----- 1-------- 1-------!---- - - ·- ------------- ---- ----- !-----
Falls 602 6 11 4 7 1 1 382 10 5 108 14 6 36 9 2 --- - --
Motor vehicle accident 157 2 9 3 3 0 0 93 5 3 20 5 0 10 4 0 - ---- ---
Diabetes 807 10 21 11 17 6 1 422 60 18 138 24 6 31 38 4
Nephritis, nephrotic syndrome and ---- r---- --
neohrosis 426 10 16 10 5 4 1 171 31 12 89 25 3 28 20 1
- --- - - -- r---- t---- -------- r---~ Parkinson's disease 482 3 11 10 6 2 0 264 22 6 101 18 0 29 8 2
--- ----- - ···---- --·--· ---- - - ---1---
Septicemia 391 ' 3 11 5 4 2 0 221 19 12 47 12 0 23 30 2
Total, all causes 32,192 251 841 361 463 219 45 1?,802 1 1,?~~ 511 5 ,635 1,272 166 1,878 876 127 --- -------------
"
;J:::I ro ro ({)
:::::1 OJ t-'· :><
10

.Appendix R
Yuma County Maternity Services -JULY 2007
Associates for Women's Health
Surendher Lokareddy , MD Susie Rhoads , CNM Annette Casey, CNM Sheryl Shantz , FNP
Zia OB/GYN
Terry Lewis , MD
Julie Dance, CFNP, CNM
Women's Health Specialist
Maria Gasca- Holtz, MD FACOG Erick Martinez, MD FACOG James Vining, MD F ACOG Werner Wester, MD FACOG Thomas Suciu, MD FACOG, FACS Brian Grogan , MD F ACOG J. Brock Amon , MD Alejandrina Orpineda , RNP Jose lnclan , RDMS Edie Morgan OBI GYN CNP Denise Southwick , CFNP Marsha Keechler , CNM
Sunset Women's Medical Group
Jennifer Price, MD Raja Mittapalli , MD Delia Montopoli, CNM Rhonda Hepworth, CNM
Office: (928) 341-4650 1945 W. 24th Street Yuma, AZ 85364
Mon.- Fri., 9:00am- 5:00pm
Office: (928) 344-2728 2451 S. Avenue A, Suite 8 Yuma , AZ 85364
Mon.- Thur. 9:00am - I 2:00pm 1:OOpm- 5:00pm
Friday 9:00am - I 2:00pm
Office: (928)783-3050 2911 S gth Ave Yuma , AZ 85364
Mon. - Thur. 7:00am - 5:00pm Friday 7:00am- 4:00pm
San Luis Office: (928) 627-7049 1896 E. Babbitt Lane San Luis, AZ 85349 Mon.-Wed. 7:00am- 5:30pm Thursday 12:00 noon - 5:30pm Friday 7:00am- 4:00pm
Office: (928)726-5950 2060 W 24th St
Mon. - Fri. 8:00am- 5.00 pm
March 2007
.. YUMA PEDIATRICIANS
{
Yuma Pediatrics 2359 S. 22 Drive, Suite# 2 Yuma, AZ 85364 (928) 344-4800 Fax (928) 726-2377
Dr. Daniel Crawford Dr. David Maki Dr. Gowan Deckey Dr. Conjeevaram- Rajaram Dr. Robert Cannell
Pediatric Associates 1073 W. 23rd Street of Yuma Yuma, AZ 85364 (928) 783-0148 Fax (928) 783-7997
!
Dr. Emilia Matos 10318 Williab Street Allison Vallejo Welton ,AZ 85356 (928) 785-3061 Fax (928) 783-7997
2060 W. 24th St. Sunset Pediatric Clinic Yuma ,AZ 85364 (928) 344-5112 Fax (928) 344-5766
Dr. Raymond Hatton P.O. Box 538 Dr. Cynthia Sis on 115 N. Somerton Ave. (928) 627-2051 Fax (928) 627-3857 Dr. Kanka Karmaker Somerton AZ 85350 Dr. Sujal Fadia
P.O. Box 2017 ~ 'U
815 N. Juan Sanchez Blv. (928) 627-3822 Fax (928) 627-3989 'U <D
San Luis ,AZ 85349 ::J OJ 1-'·
:><:
Cactus Kids (/)
Dr. Patti Perry 1832 S. 8th Avenue Dr. Wayne Chiavacci Yuma ,AZ 5364 (928) 782-6830 Fax (928) 782-3312

Yuma Children's Clinic
Dr. Sonal Subbu
San Luis Walk- In Clinic
Dr. Jose Munoz Dr. Jean Amon Karen Watts, MS, CS, FNP
Dr. S. Nutakki
Dr. Habib RathJe
Dr. Isabel Bellot
Dr. Bart Bernstein
,YUMA PEDIATRICIANS
2150 W. 24th, St. Yuma , Az 85364
P.O. Box 16$9 1896 E. BabSit Lane San Luis, AZ 85349
1025 W. 24th St. Suite #25 Yuma , AZ 85364
1025 W. 24th St. Suite #6 Yuma , AZ 85364
1025 W. 24th St. Suite #5 Yuma , AZ 85364
' 1220 W. 24th; St. Suite #2 Yuma,AZ
(928) 819-7000
(928) 722-6112
(928) 344-3411
(928) 314-1100
(928) 344-113 5
(928) 782-4040
~
{
Fax (928) 329-9309
Fax (928) 722-6113
Fax (928) 344-4194
Fax (928) 344-3565
Fax (928) 344-3758 :J:::-ro ro
CD - ::::::!
~
Fax (928)782-4041 f-J· :X:
(j)

Objective #3
Strategy 3.1
Strategy 3.2
Strategy 3.3
Strategy 3.4
Strategy 3.5
Appendix T
2010 OBJECTIVES
Reduce pregnancies among adolescents 15- 17 years old.
Enhance community education and support.
Develop I enhance parent education programs.
Enhance youth programs.
Develop new media campaigns.
Enhance faith-based and culturally-specific programs.