Embed Size (px)
Citation preview

!
Han Chef Restaurant and
Bar A Chinese-Style Barbecue and Noodle Restaurant with Sports Bar.
A Concept presented by:
Yuke Investment, LLC.
1530 140th Ave NE Suite 111 Bellevue, WA 98005
(425) 231-2211
COMPREHENSIVE BUSINESS PLAN
Pursuant to 8 CFR §204.6(j)(4)(B) and Matter of Ho !
C

1"|"P a g e "Yuke"Investment,"LLC.""Han"Restaurant"and"Bar"7/18/14"Yuke"Investment,"LLC.""Han"Restaurant"and"Bar"7/18/14"
Table&of&Contents&
SECTION& TITLE&&
PAGE&
1." Executive"Summary" 2"
2." Organizational"and"Investment"Structure" 6"
3." Full"Service"Restaurant:"Han"Chef"Restaurant"and"Bar" 10"
4." Job"Creation,"Revenue"and"Cost"Projections" 16"
" • Phase"One" 22"
" • Phase"Two" 25"
" • Years"3"V"5" 28"
5." Restaurant"Industry"Overview" 40"
6." Silver"Lake,"WA" 46"
7." Development"Timeline" 50"
"
""""""

16"|"P a g e "Yuke"Investment,"LLC.""Han"Restaurant"and"Bar"7/18/14"Yuke"Investment,"LLC.""Han"Restaurant"and"Bar"7/18/14"
4& JOB&CREATION,&REVENUE&AND&COST&PROJECTIONS&&!Restaurant"Financial"Benchmarks:""Baker&Tilly&
According to Baker Tilly’s 2012 Restaurant Benchmarks publication, the appropriate range for sales per square feet for a full service restaurant generating moderate profit is $250 - $350. YUKE uses the lower end of this scale as a starting point. Recent analysis based on publicly disclosed SEC filings show that a number of full-service casual dining establishments generate between $451 and $622 in sales per square feet.1 This is shown in Graph 1 below.2
Table"4V1"""Restaurant"Costs"Benchmarks"(Baker!Tilly)!
Cost&Dimensions& %&of&Sales&Prime"Cost"Full"Service" 65%"or"less"" total"sales"Food"Cost" 28%"V"32%"" total"sales"Alcohol"Costs" 18%"V"20%"" alcohol"sales"Payroll"Cost"Full"Service" 30%"V"35%"" total"sales"Gross"Payroll"Full"Service" 18%"V"20%"" total"sales"
"
Table"4V2""""Restaurant"Sales"Benchmarks"(Baker!Tilly)"
NOI&level& Sales&Per&Square&Foot&Losing"Money" $150"or"less"Break"Even" $150"V"$250"Moderate"Profit" $250"V"$350"High"Profit" More"than"$350"
""
"""""""""""""""""""""""""""""""""""""""""""""""""""""""""""""1"By"law"SEC"filings"are"required"to"be"accurate."Cheesecake"Factory"at"$887"per"square"feet"is"clearly"an"outlier;"we"2"http://marketrealist.com/2013/11/dardenVanalysisVrevenueVperVsquareVfootVessential/"
17"|"P a g e "Yuke"Investment,"LLC.""Han"Restaurant"and"Bar"7/18/14"Yuke"Investment,"LLC.""Han"Restaurant"and"Bar"7/18/14"
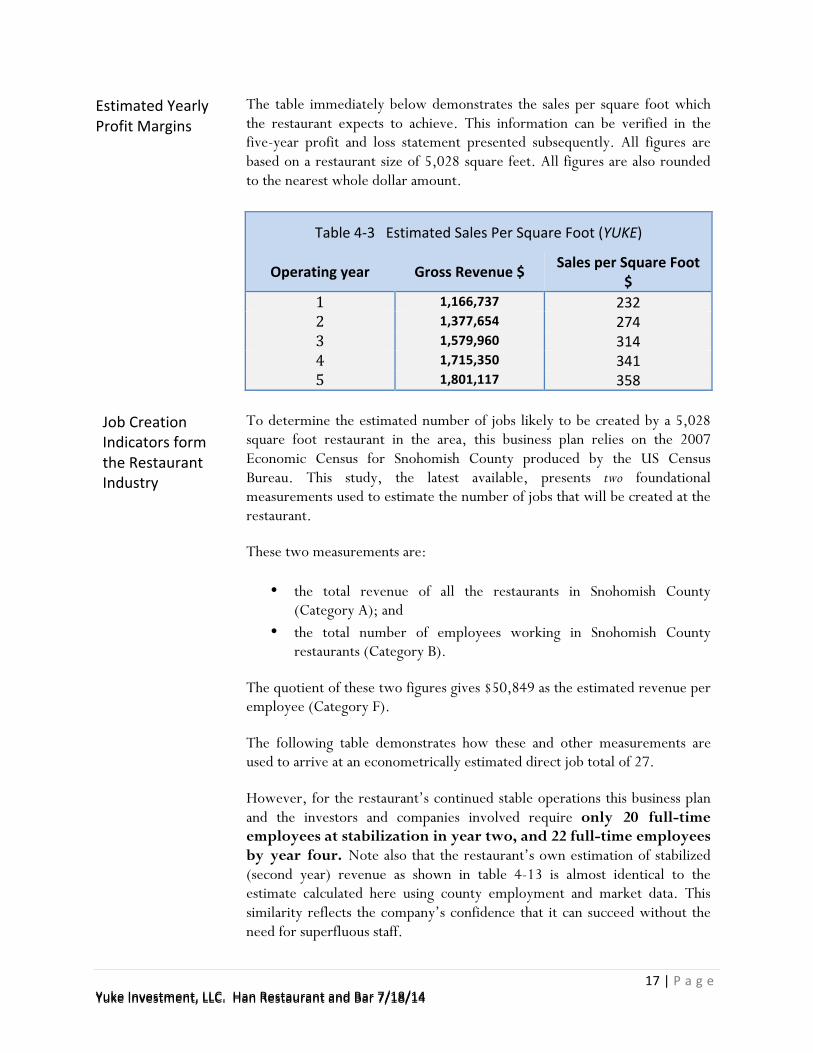
Estimated"Yearly"Profit"Margins&
The table immediately below demonstrates the sales per square foot which the restaurant expects to achieve. This information can be verified in the five-year profit and loss statement presented subsequently. All figures are based on a restaurant size of 5,028 square feet. All figures are also rounded to the nearest whole dollar amount.
"
Table"4V3"""Estimated"Sales"Per"Square"Foot"(YUKE)"
Operating&year& Gross&Revenue&$& Sales&per&Square&Foot&$&
1! 1,166,737& 232"2! 1,377,654& 274"3! 1,579,960& 314"4! 1,715,350& 341"5! 1,801,117& 358"
"Job"Creation"Indicators"form"the"Restaurant"Industry
To determine the estimated number of jobs likely to be created by a 5,028 square foot restaurant in the area, this business plan relies on the 2007 Economic Census for Snohomish County produced by the US Census Bureau. This study, the latest available, presents two foundational measurements used to estimate the number of jobs that will be created at the restaurant. !These two measurements are: !
• the total revenue of all the restaurants in Snohomish County (Category A); and
• the total number of employees working in Snohomish County restaurants (Category B).
!The quotient of these two figures gives $50,849 as the estimated revenue per employee (Category F). !The following table demonstrates how these and other measurements are used to arrive at an econometrically estimated direct job total of 27. !However, for the restaurant’s continued stable operations this business plan and the investors and companies involved require only 20 full-time employees at stabilization in year two, and 22 full-time employees by year four. Note also that the restaurant’s own estimation of stabilized (second year) revenue as shown in table 4-13 is almost identical to the estimate calculated here using county employment and market data. This similarity reflects the company’s confidence that it can succeed without the need for superfluous staff.

18"|"P a g e "Yuke"Investment,"LLC.""Han"Restaurant"and"Bar"7/18/14"Yuke"Investment,"LLC.""Han"Restaurant"and"Bar"7/18/14"
Table&4(4Category Measurement Estimate Source
A Total&Sno.&County&Revenue&2014 $429,264,929 US&CensusB Total&Sno.&County&Employees 8,442 US&CensusC Sales&per&Sq.&Ft.&(Year&Two) $275 SECD Restaurant&Sq.&Ft. 5,028 (
E Estimated&Restaurant&Revenue&(Year&Two) $1,382,700 C&x&DF Revenue&per&Employee $50,849 A&/&BG Square&Feet&per&Employee 185 F&/&CH Estimated&Direct&Job&Creation 27 D&/&GI Projected)Jobs)at)Stabilization 20 (
Estimated&Job&Creation&at&Stabilization
Economist’s"Explanatory"Notes
Table 4-4 above uses the following economic data to arrive at its projected job creation estimate. This data was supplied by project economist, David Schneider (see management team). 2007 Industry Revenue for the restaurant sector in Snohomish County is $376,419,000. This figure is inflated to 2014 dollars using the following multipliers and calculations:
- Average annual CPI for 2007 is 207.342 - Assuming 1.5 percent average inflation for 2014, average annual
CPI for 2014 is 236.451 To go from 2007 to 2014 dollars we multiply the 2007 Industry Revenues of $376,419,000 by the 2014 CPI and then divide it by annual 2007 CPI [376,419,000 x (236.451/ 207.342) or 1.14]. Inflated to 2014 figures, the Snohomish County Restaurant Revenue is now $429,264,929. For 8,442 total restaurant employees in Snohomish County, this averages to $50,849 in revenue (or sales) per employee. Marketralist.com has published revenue per square foot metrics for a number of restaurants run by publicly traded companies. Metrics come from legally required SEC filings. The lowest revenue per square foot measure is $450 per square foot. The restaurant business plan uses sales per square feet of about $275, which is very conservative compared to $450.

19"|"P a g e "Yuke"Investment,"LLC.""Han"Restaurant"and"Bar"7/18/14"Yuke"Investment,"LLC.""Han"Restaurant"and"Bar"7/18/14"
Dividing $50,849 sales per employee by $275 sales per square feet estimates 185 sq. ft. per employee. Dividing 5,028 sq. ft. of restaurant by 185 sq. ft. per employee estimates 27 employees. Conclusion $275 sales per square feet, as used in the business plan, appears conservative in comparison to published revenue per square feet for full-service restaurants. Using a method to estimate direct jobs where square footage drives the estimate, 27 direct jobs are estimated to be created by the proposed restaurant in Snohomish County per the Economist’s estimate. This estimate is, by the owners’ estimations, above and beyond the actual number of staff required to stably run the enterprise.
&&&&&&&&&&&&&&&&&&&&&&&&&

20"|"P a g e "Yuke"Investment,"LLC.""Han"Restaurant"and"Bar"7/18/14"Yuke"Investment,"LLC.""Han"Restaurant"and"Bar"7/18/14"
MANAGEMENT&AND&LABOR&(Year&Two&Stabilization)&
Staffing""
Staffing at the Han Chef Restaurant and Bar will be ramped up by year two to include a total of 20 full-time employees. In the first year the restaurant estimates the need for approximately 19 full-time employees; the remainder shall be hired after the second year in order to work the extended operating hours required to run the upstairs sports bar. The following estimated staff requirements and descriptions of their duties are based upon a year two stabilization model.
Restaurant"Manager"(1)""
The restaurant manager is responsible for ensuring that Han’s operations meet company standards regarding product quality, customer service, store cleanliness, and cost controls. The manager’s principal duty involves hiring and training employees with an emphasis on continual training to ensure that all team members are able to meet expectations. Candidates will be hired two to three weeks before the restaurant opens in order to organize the setup and opening of the enterprise. This is a single full-time position requiring 40 hours/week.
Assistant"Manager"(1)"
The assistant manager is responsible for overtaking the Manager’s duties when he or she is absent. Duties include making sure all other employees are present and accounted for, checking the receipts at the end of the business day, and general administration. One full-time assistant manager position at 40 hours per week will be required.
Hostess"/"Cashier"(2)"
The hostess/cashier is responsible for the main dining area. Duties include assisting patrons with seating, taking orders, handling cash, and tending to patrons’ needs. At least two full-time hostess/cashier positions at 40 hours per week will be required.
Chef"(2)""
Responsible for the overall management of the kitchen, the chef supervises staff, creates menus and new recipes with the assistance of the restaurant manager, makes purchases of raw food items, trains apprentices, and maintains a sanitary and hygienic environment for the preparation of food. One chef will carry the title of Head Chef and the second chef will carry the title of Sous-Chef. At least two full-time chefs at 40 hours per week will be required.
Cook"(4)""
Cooks receive orders directly from the chef for the management of the kitchen, and often serve as the representative when the chef is not present. Responsible for food preparation and all kitchen activities. At least four full-time cooks at 40 hours per week will be required.

21"|"P a g e "Yuke"Investment,"LLC.""Han"Restaurant"and"Bar"7/18/14"Yuke"Investment,"LLC.""Han"Restaurant"and"Bar"7/18/14"
Waiter"/"Bartender"(6)""
The duties of serving staff include preparing tables for a meal, taking customers' orders, serving drinks and food, and cleaning up before, after and during servings in a restaurant. Bartenders will be responsible for all activities involving the serving, stocking and maintenance of alcohol and alcohol related products. At least six full-time servers / bartenders at 40 hours per week will be required in year 2, seven in year three, and eight in year four.
Dishwasher"(2)" The dishwasher positions are responsible for washing dirty dishes, keeping
clean tableware stocked and available, keeping kitchen equipment clean, and general cleanliness/repair of the facility. They also perform support and preparatory duties as required by the chefs and the cooks. At least two full-time dishwasher staff at 40 hours per week will be required.
Delivery"Driver"(2)""
The delivery driver is responsible for safely delivering orders within a limited delivery area. Additionally, the delivery driver may be called upon to remain in attendance with orders delivered for catered events. Two full time delivery drivers at 40 hours per week will be required.
"Job"Creation"Timeline"
The job creation timeline below displays how total job creation will be increased year-on-year. 19 jobs will be created in the first year of operations, and 20 in year two. The following two years will each see one additional job added to keep pace with demand from the bar element of the Han Chef Restaurant and Bar."
"
&

22"|"P a g e "Yuke"Investment,"LLC.""Han"Restaurant"and"Bar"7/18/14"Yuke"Investment,"LLC.""Han"Restaurant"and"Bar"7/18/14"
PHASE&ONE&(Year&One)&COST"AND"REVENUE"PROJECTIONS&
!Labor"Compensation"
The following table presents labor compensation for Phase One of the restaurant development. YUKE anticipates 19 full-time staff in Phase One (year one). The total cost of labor is therefore different depending on the year of operation, and this fact is reflected in the five-year profit and loss statement found in table 4-13. Phase One projections apply only to the first operating year of the restaurant. Total labor costs in year one are therefore shown below as $453,440. YUKE anticipates annual labor costs to start off at 43%, decreasing to under 38% by year five. This estimation is also reflected in the five-year profit and loss statement.
#"Positions Hourly"" Hours/Yr Annual"Restaurant"Manager 1 $15" 2080 $31,200"Assistant"Manager 1 $15" 2080 $31,200"Hostess/Cashier 2 $10" 2080 $41,600"Chef 2 $15" 2080 $62,400"Cook 4 $12" 2080 $99,840"Waiter/Bartender 5 $10" 2080 $104,000"Dishwasher 2 $10" 2080 $41,600"Delivery"Driver 2 $10" 2080 $41,600"
Total 19 $97* $453,440*
Table"4M5""Year"One"Labor"Costs
&&

23"|"P a g e "Yuke"Investment,"LLC.""Han"Restaurant"and"Bar"7/18/14"Yuke"Investment,"LLC.""Han"Restaurant"and"Bar"7/18/14"
PHASE&ONE&&FINANCIAL"PROJECTIONS&
!Sales"Projections:"Weekly,"Monthly,"Annually
According to data from the National Restaurant Association, the average number of patrons per meal-hour on any given day at a restaurant similar to that envisioned by YUKE is approximately 75% of the 112 available seats in year one. Yuke anticipates 2 turnovers per meal period, including both lunch and dinner. Due to the differences in customer volume over the course of a week, some days will experience higher or lower volumes. The average seating capacity over a seven-day operating week will be approximately 56% (62 seats). This average is used to determine weekly and monthly revenue. This following Table 4-6 projects the estimated daily and weekly sales. The table reflects the Phase One ramp-up period during which there will be a reduced amount of staff and a smaller volume of business. Information in this table includes: estimated number of customers for lunch and dinner each day of the week; estimated average expenditure per customer; and estimated daily and weekly sales.
2 2 2 2Monday 60% 134 134 $11 $13 $3,216Tuesday 50% 112 112 11 13 $2,688Wednesday 50% 112 112 11 13 $2,688Thursday 50% 112 112 11 15 $2,912Friday 60% 134 134 11 15 $3,484Saturday 60% 134 134 11 17 $3,752Sunday 60% 134 134 11 17 $3,752
Estimated)Weekly)Sales $22,492
TableA4B6AYearAOneAEstimatedAWeeklyASales:A56%AAverageASeatingACapacity
#AofACustomersAverageASpentAPerA
PersonLunchA
TurnoversDinnerA
TurnoversLunchA
TurnoversDinnerA
Turnovers
DailyAAvg.ASeatingACapacity
EstimatedADailyASales

24"|"P a g e "Yuke"Investment,"LLC.""Han"Restaurant"and"Bar"7/18/14"Yuke"Investment,"LLC.""Han"Restaurant"and"Bar"7/18/14"
Revenue"Basis The following table incorporates the following National Restaurant Association methodology for estimating new restaurant sales by month and year. Note that the Estimated Weekly Sales figure shown in table 4-6 above is integral to the methodology’s calculations Note 1 Monthly sales are calculated by multiplying the average projected weekly sales by 4.33 weeks per month, and by a reduction, increase or inflation factor. Note 2 Reduction Factors Month 1 = 90% Month 4 = 96% Month 2 = 92% Month 5 = 98% Month 3 = 94% Month 6 = 100% Note 3 Increase Factors Month 7 = 102% Month 9 & 10 = 105% Month 8 = 104% Month 11 & 12 = 106% Note 4 Inflation factor Based on 5% inflation per year For example, the figure below in table 4-7, Month 1, was calculated in the following manner:
• Multiply the average projected weekly sales figure in table 4-6 ($22,492) by 4.33 weeks per month to arrive at $97,390
• Multiply that figure by 90% to arrive at $87,651 "
Month Gross)Rev1 ))))))))))87,651)2 ))))))))))89,599)3 ))))))))))91,547)4 ))))))))))93,495)5 ))))))))))95,443)6 ))))))))))97,390)7 ))))))))))99,338)8 ))))))))101,286)9 ))))))))102,260)10 ))))))))102,260)11 ))))))))103,234)12 ))))))))103,234)
Annual)Total) $1,166,737
Table)4?7)Year)One))))))))))))))))))))))))Monthly/Annual)Sales
""

25"|"P a g e "Yuke"Investment,"LLC.""Han"Restaurant"and"Bar"7/18/14"Yuke"Investment,"LLC.""Han"Restaurant"and"Bar"7/18/14"
PHASE&TWO&(Year&Two)&COST"AND"REVENUE"PROJECTIONS&
!Labor"Compensation"
The following table presents labor compensation for Phase Two (Year 2) of the restaurant development. YUKE anticipates 20 full-time staff in Phase Two. The total cost of labor is therefore different depending on the year of operation, and this fact is reflected in the five-year profit and loss statement found in table 4-13. Total labor costs beginning in year two are therefore shown below as $474,240. YUKE anticipates year-on-year labor costs to start off at 43%, decreasing to under 38% by year five. This estimation is also reflected in the five-year profit and loss statement.
"
#"Positions Hourly"" Hours/Yr Annual"Restaurant" 1 $15" 2080 $31,200"Assistant"Manager 1 $15" 2080 $31,200"Hostess/Cashier 2 $10" 2080 $41,600"Chef 2 $15" 2080 $62,400"Cook 4 $12" 2080 $99,840"Waiter/Bartender 6 $10" 2080 $124,800"Dishwasher 2 $10" 2080 $41,600"Delivery"Driver 2 $10" 2080 $41,600"
Total 20 $97+ $474,240+
Table"4M8""Year"Two"Stabilized"Labor"Costs
"""""""""""&&&&

26"|"P a g e "Yuke"Investment,"LLC.""Han"Restaurant"and"Bar"7/18/14"Yuke"Investment,"LLC.""Han"Restaurant"and"Bar"7/18/14"
PHASE&TWO&&FINANCIAL"PROJECTIONS&
!Sales"Projections:"Weekly,"Monthly,"Annually
According to data from the National Restaurant Association, the average number of patrons per meal-hour on any given day at a restaurant similar to that envisioned by YUKE is 75% of the 112 available seats in years two through five. Yuke anticipates 2 turnovers per meal period, meaning both lunch and dinner. Of course, due to the differences in customer volume over the course of a week, some days will experience higher or lower volumes. The average seating capacity over a seven-day operating week will be approximately 66% (74 seats). This is the average which is used to determine the weekly and monthly revenue. That demand fluctuates throughout the week is acknowledged in the table below. This table reflects the Phase Two stabilization period, during which there will be a full complement of staff and a higher volume of business. Table 4-9 indicates the following information: estimated number of customers for lunch and dinner each day of the week; estimated average expenditure per customer; and estimated daily and weekly sales.
"
2 2 2 2
Monday 70% 157 157 $11 $13 $3,768
Tuesday 60% 134 134 11 13 $3,216
Wednesday 60% 134 134 11 13 $3,216
Thursday 60% 134 134 11 15 $3,484
Friday 70% 157 157 11 15 $4,082
Saturday 70% 157 157 11 17 $4,396
Sunday 70% 157 157 11 17 $4,396
Estimated)Weekly)Sales $26,558
TableA4B9AYearATwoAEstimatedAWeeklyASales:A66%AAverageASeatingACapacity
#AofACustomersAverageASpentAPerA
Person
DailyAAvg.ASeatingACapacity
LunchATurnovers
DinnerATurnovers
LunchATurnovers
DinnerATurnovers
EstimatedADailyASales
"

27"|"P a g e "Yuke"Investment,"LLC.""Han"Restaurant"and"Bar"7/18/14"Yuke"Investment,"LLC.""Han"Restaurant"and"Bar"7/18/14"
Revenue"Basis The following table incorporates the following National Restaurant Association methodology for estimating new restaurant sales by month and year. Note that the Estimated Weekly Sales figure shown in table 4-9 is integral to the methodology’s calculations. Note also that the following table does not reflect revenue from the operation of the sports bar. Sports bar revenue will instead be shown in the five-year profit and loss statement. Note 1 Monthly sales are calculated by multiplying the average projected weekly sales by 4.33 weeks per month, and by a reduction, increase or inflation factor. Note 2 Reduction Factors Month 1 = 90% Month 4 = 96% Month 2 = 92% Month 5 = 98% Month 3 = 94% Month 6 = 100% Note 3 Increase Factors Month 7 = 102% Month 9 & 10 = 105% Month 8 = 104% Month 11 & 12 = 106% Note 4 Inflation factor Based on 5% inflation per year For example, the figure in table 4-10, Month 1, Year 2 Gross Rev, was calculated in the following manner:
• Multiply the average projected weekly sales figure in table 4-9 ($26,558) by 4.33 weeks per month to arrive at $114,996
• Multiply that figure by 90% Reduction Factor to arrive at $103,497. • Gross Revenue for years three through five are also shown here.
"
Month1 '''''''103,497' '''''''118,695' '''''''128,866' '''''''135,309'2 '''''''105,796' '''''''121,332' '''''''131,730' '''''''138,316'3 '''''''108,096' '''''''123,970' '''''''134,593' '''''''141,323'4 '''''''110,396' '''''''126,608' '''''''137,457' '''''''144,330'5 '''''''112,696' '''''''129,245' '''''''140,321' '''''''147,337'6 '''''''114,996' '''''''131,883' '''''''143,184' '''''''150,344'7 '''''''117,296' '''''''134,521' '''''''146,048' '''''''153,351'8 '''''''119,596' '''''''137,158' '''''''148,912' '''''''156,357'9 '''''''120,746' '''''''138,477' '''''''150,344' '''''''157,861'10 '''''''120,746' '''''''138,477' '''''''150,344' '''''''157,861'11 '''''''121,896' '''''''139,796' '''''''151,776' '''''''159,364'12 '''''''121,896' '''''''139,796' '''''''151,776' '''''''159,364'
Annual'Total
$1,377,654 $1,579,960 $1,715,350 $1,801,117
Table'4:10''''Year'Two'Monthly/Annual'Sales
Year'2'''''''''''''''Gross'Rev
Year'3''''''''''''''''Gross'Rev
Year'4''''''''''''Gross'Rev
Year'5'''''''''''Gross'Rev
"&

28"|"P a g e "Yuke"Investment,"LLC.""Han"Restaurant"and"Bar"7/18/14"Yuke"Investment,"LLC.""Han"Restaurant"and"Bar"7/18/14"
LABOR:&YEARS&375&!Labor"Compensation"
The following table presents labor compensation for years three through five of the restaurant. YUKE anticipates 21 full-time staff in year three and 22 full time staff in years four and five, after which employment will be stabilized. The total cost of labor is therefore different depending on the year of operation, and this fact is reflected in the five-year profit and loss statement found in table 4-13.
"
Restaurant)Manager 1 $16) 2080 $33,280)Assistant)Manager 1 $16) 2080 $33,280)Hostess/Cashier 2 $12) 2080 $49,920)Chef 2 $16) 2080 $66,560)Cook 4 $13) 2080 $108,160)Waiter/Bartender 7 $12) 2080 $174,720)Dishwasher 2 $12) 2080 $49,920)Delivery)Driver 2 $12) 2080 $49,920)
Total 21 $109+ $565,760+
Table)4K11)))Year)Three)Labor)Costs
#)Positions Hourly))Rate
Hours/Yr Annual)Salary
"
Restaurant)Manager 1 $16) 2080 $33,280)Assistant)Manager 1 $16) 2080 $33,280)Hostess/Cashier 2 $12) 2080 $49,920)Chef 2 $16) 2080 $66,560)Cook 4 $13) 2080 $108,160)Waiter/Bartender 8 $12) 2080 $199,680)Dishwasher 2 $12) 2080 $49,920)Delivery)Driver 2 $12) 2080 $49,920)
Total 22 $109+ $590,720+
Table)4J12)))Year)Four)Labor)Costs
#)Positions Hourly))Rate
Hours/Yr Annual)Salary
&&
&
&