Embed Size (px)
Citation preview

Yuan YuanMarch 10, 2010
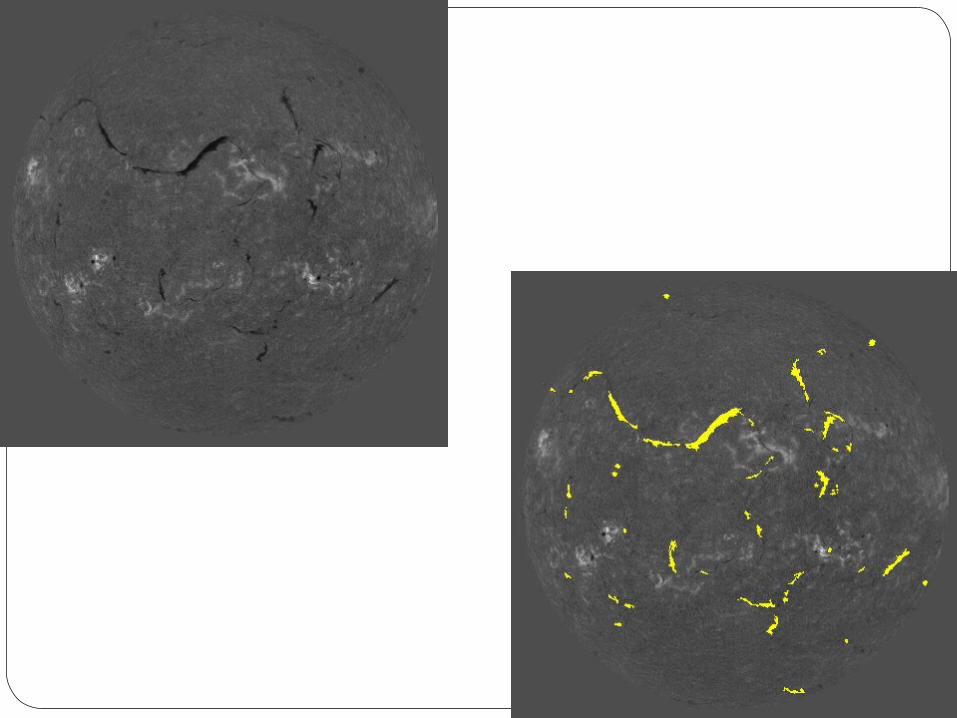
Automatic Solar Filaments Segmentation


Data Set OneFrom 1969 to 1995, Big Bear Solar Observatory (BBSO) recorded all of their observations on 35 mm film with the cadence of observations ranging from 10 seconds to 1 minute.
Solar Film Digitization project digitize these films. These film data sets cover two and one-half solar cycles.

Data Set One

Data Set Two - Global H-alpha Network
Host H-alpha image from 9 stations across the world, e.g.
Big Bear Solar Observatory (USA)Kanzelhöhe Solar Observatory (Austria) Catania Astrophysical Observatory (Italy)Meudon and Pic du Midi Observatories (France)Yunnan Astronomical Observatory (China)Mauna Loa Solar Observatory (Hawaii)
All these observatories have over 300 sunny days a year, good seeing conditions, adequate observing staffs and well established H-alpha telescope systems.

Data Set Two - Global H-alpha Network

Work Flow
Solar Disk Detection Objective
1. Segment Solar Disk from the back ground
2. Locate the center and radius of the solar disk
Method1. Edge Detection2. Cascading Hough Circle Detectors


5 10 15 20 25 30 35 40Gaussian filter
+ Roberts operator0.35 0.35 0.38 0.34 0.32 0.27 0.23 0.21
Gaussian fitler + Sobel operator
0.28 0.32 0.31 0.30 0.28 0.24 0.21 0.19
Gaussian filter + LoG operator
0.03 0.08 0.12 0.08 0.06 0.03 0.02 0.01
Gaussian filter + Canny operator
0.03 0.04 0.05 0.05 0.06 0.05 0.05 0.05
Median filter + Roberts operator
0.25 0.48 0.68 0.53 0.74 0.54 0.74 0.54
Median filter + Sobel operator
0.24 0.60 0.77 0.77 0.91 0.77 0.90 0.76
Median filter + LoG operator
0.03 0.12 0.23 0.42 0.66 0.63 0.74 0.65
Median filter + Canny operator
0.02 0.05 0.20 0.30 0.17 0.20 0.33 0.31

Hough Transform
Our problem is that the Radius is Unknown?But within range 850 to 950. need to construct a 3-d Hough accumulation matrix of size 1016 rows, 1016 columns and 1000-800+1≡201 channels. memory consumption is 1016*1016*201/1024/1024*4≈800 mega bytes.

Cascading Hough Transform
1. Shrink the original image to 1/k of its original size.
2. Do Hough Transform on the shrunk image, with radius in the range 800/k to 1000/k. Find out the radius R1
3. Do Hough Transform again on the original image, with radius in the range kR1-k to kR1+k.


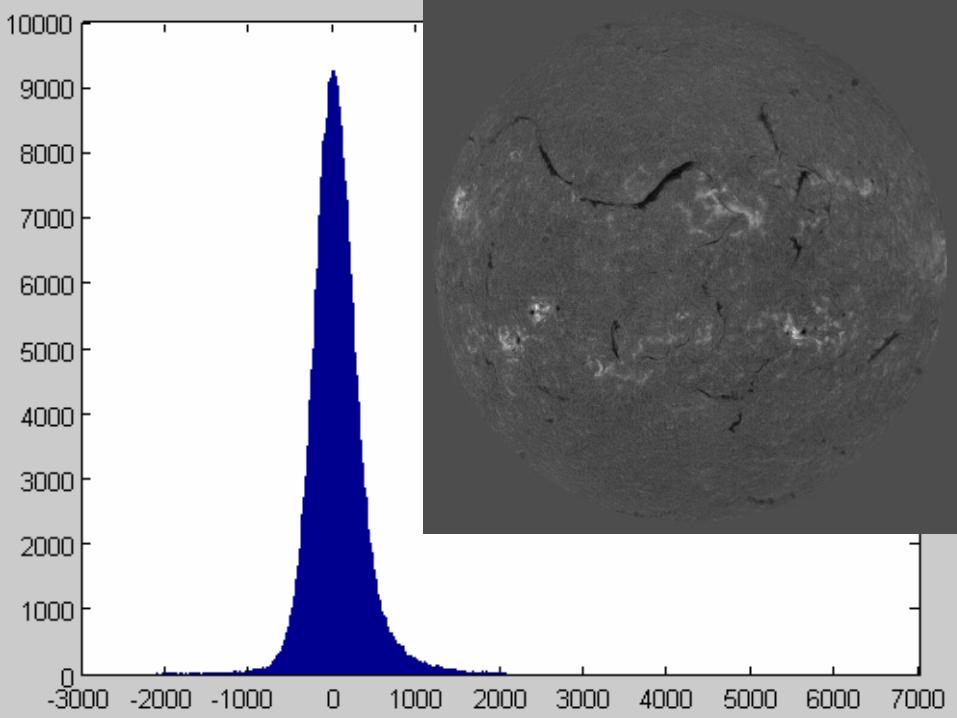
Unbalanced Luminance RemovalClouds in the atmosphere of the Earth, which block the sunlight in some location;
Dusts on the telescope; Dusts on the film or the electronic noise brought in during the film digitization procedure


Unbalanced background

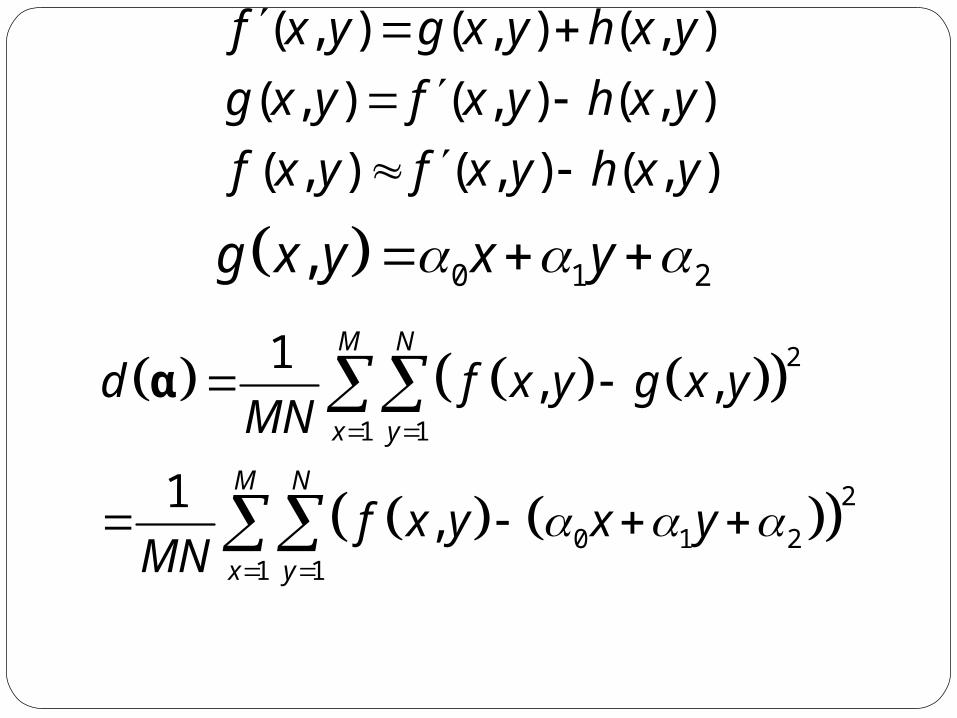
Remove unbalanced background
- =
( , ) ( , ) ( , )
( , ) ( , ) ( , )
( , ) ( , ) ( , )
f x y g x y h x y
g x y f x y h x y
f x y f x y h x y
0 1 2,g x y x y
2
1 1
2
0 1 21 1
1, ,
1,
M N
x y
M N
x y
d f x y g x yMN
f x y x yMN
α

Differentiate with respect to the coefficients α
0 1 21 10
0 1 21 11
0 1 21 12
2( , ) ( )
2( , ) ( )
2( , ) ( )
M N
x y
M N
x y
M N
x y
dx f x y x y
MN
dy f x y x y
MN
df x y x y
MN
α
α
α

20 1 2
1 1 1 1 1 1 1 1
20 1 2
1 1 1 1 1 1 1 1
0 1 21 1 1 1 1 1 1 1
( , )
( , )
1 ( , )
M N M N M N M N
x y x y x y x y
M N M N M N M N
x y x y x y x y
M N M N M N M N
x y x y x y x y
x xy x xf x y
xy y y yf x y
x y f x y
set each equation to zero, rewrite it as following:

2
1 1 1 1 1 1 1 1
02
11 1 1 1 1 1 1 1
2
1 1 1 1 1 1 1 1
( , )
( , )
1 ( , )
M N M N M N M N
x y x y x y x y
M N M N M N M N
x y x y x y x y
M N M N M N M N
x y x y x y x y
x xy x xf x y
xy y y yf x y
x y f x y
1
H w
H w
Write the equations in matrix form:


Automatic Thresholding (1)Create a series of threshold value T1, T2, T3,…,TN
T1 : minimum intensity valueTN : median intensity valueγ : step valueT2 = T1 + γT3 = T1 + 2 γ
Ti = T1 + (i-1) γ

Automatic Thresholding (2)Thresh the given image I using T1, T2, T3,…, we get binary map B1,B2,B3,…,BN
Calculate the difference region D1,D2,D3,…,DN-1, where
D1 = B2 – B1,
D2 = B3 – B2,
Di = Bi+1– Bi, ….
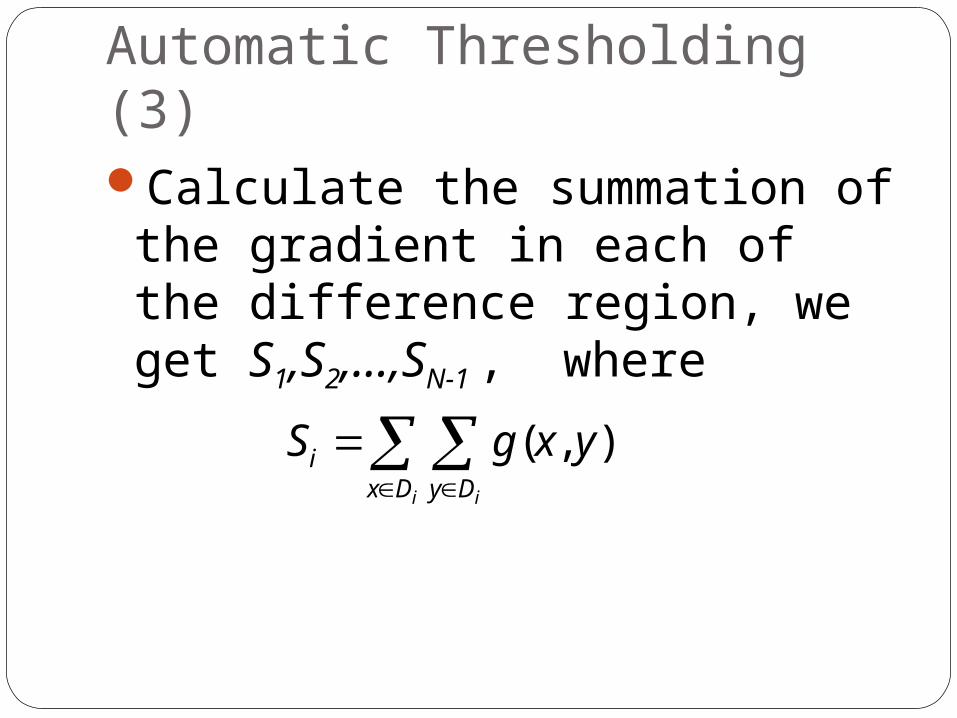
Automatic Thresholding (3)Calculate the summation of the gradient in each of the difference region, we get S1,S2,…,SN-1 , where
( , )i i
ix D y D
S g x y

Automatic Thresholding (4)Draw a curve, where x-axis is the
threshold value Ti, y-axis is the summation of gradient in difference region Si

Automatic Thresholding (5)To find out the best threshold value, we choose Ti
whose distance is greatest from a line connecting (T1,S1) and (Tm,Sm), where Tm is the threshold value whose y-value is greatest on the curve.

-1500
-2000-2500
-1000
A
C D
B

- =
B A
1
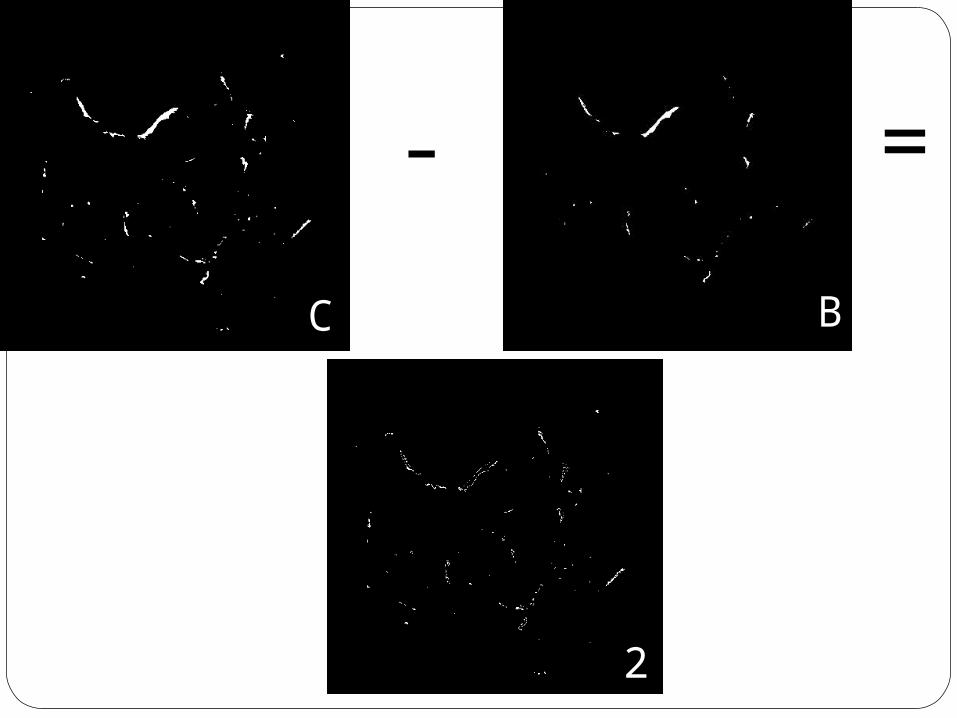
- =
C B
2
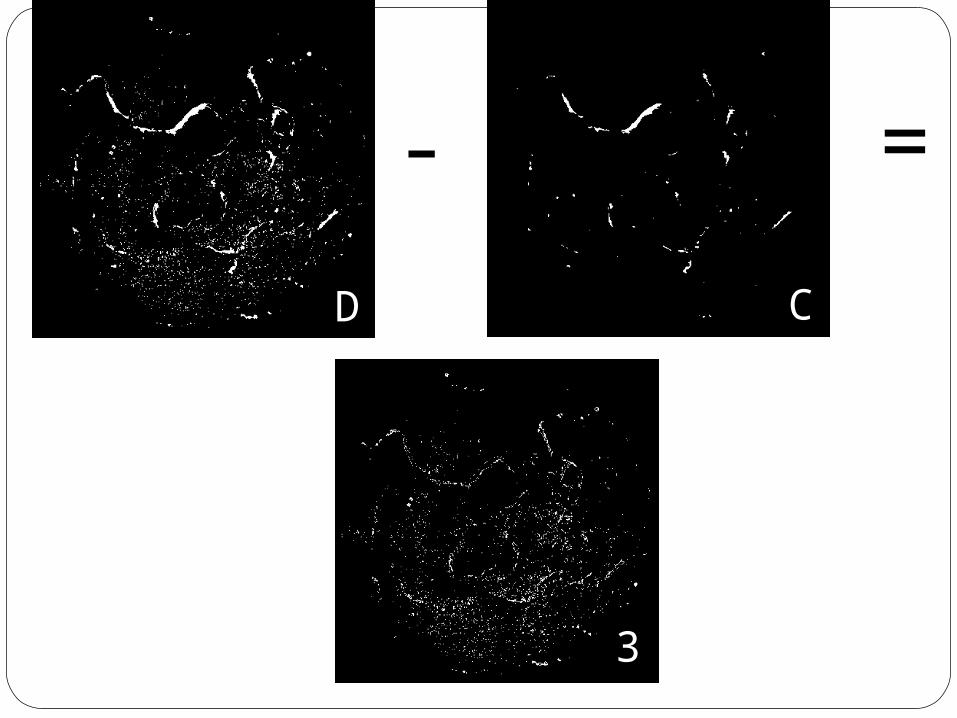
- =
D C
3
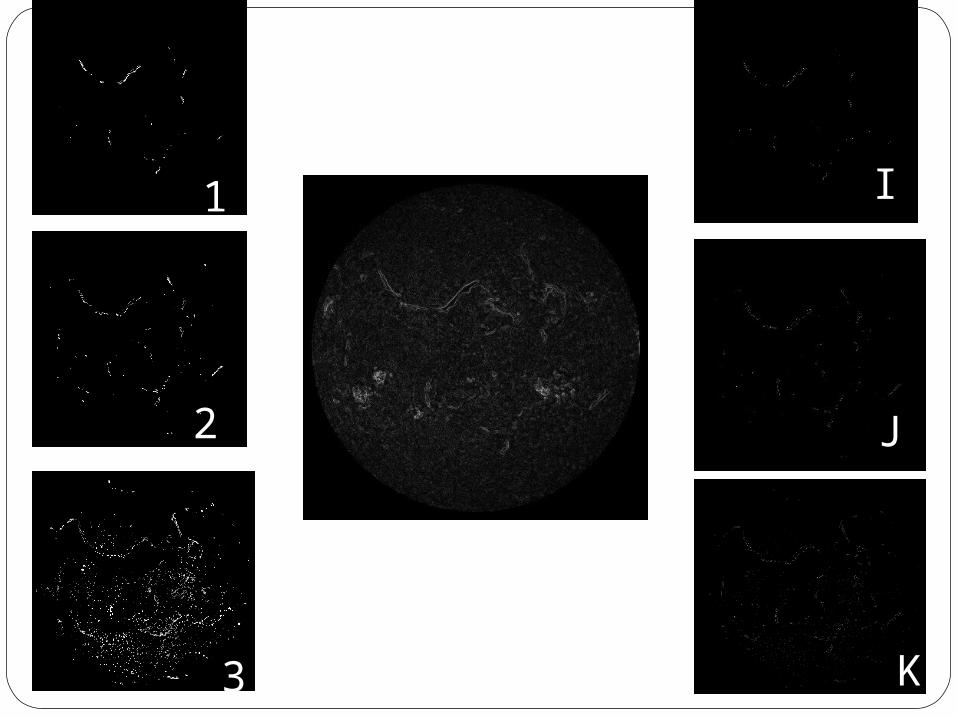
1
2
3
I
K
J

( , )x Di y Di
Si g x y
I J K


Region GrowingAfter thresholding, we treat each connect components as a seed region.
And then we do region growing for each of these connect components.

heap
A heap is a specialized tree-based data structure that satisfies the heap property: if B is a child node of A, then key(A) <= key(B).
To find out the element with minimum key costs a constant time.

First, construct a heap, initiate as empty. For a connect component C, figure out its mean intensity Io 1. Dilate C with the following structure elements, we
get a dilated component C’, take the different C* = C’ – C.
2. Insert all the element in C* into the heap if it has not been visited before, use the pixel intensity as the key, each node of the heap contains the horizontal and vertical coordinates (x,y) of each element.
3. Get the heap node with minimum key from the heap, merge the pixel corresponds to the node with the original connect component C’. Figure the current mean intensity Ic of C’, if the difference between Ic and Io is great than a threshold, stop, else go to step 1.
1 1 1
1 1 1
1 1 1

Region Growing (Continued)

Remove noise regionsAfter region growing, we remove those region whoes area is too small or satisfy the following conditions:1
( , )
( ( , ))
b b Nx R y R
b Nx R y R
C x y T T TMN
and
std C x y T T

Thanks for your attention!
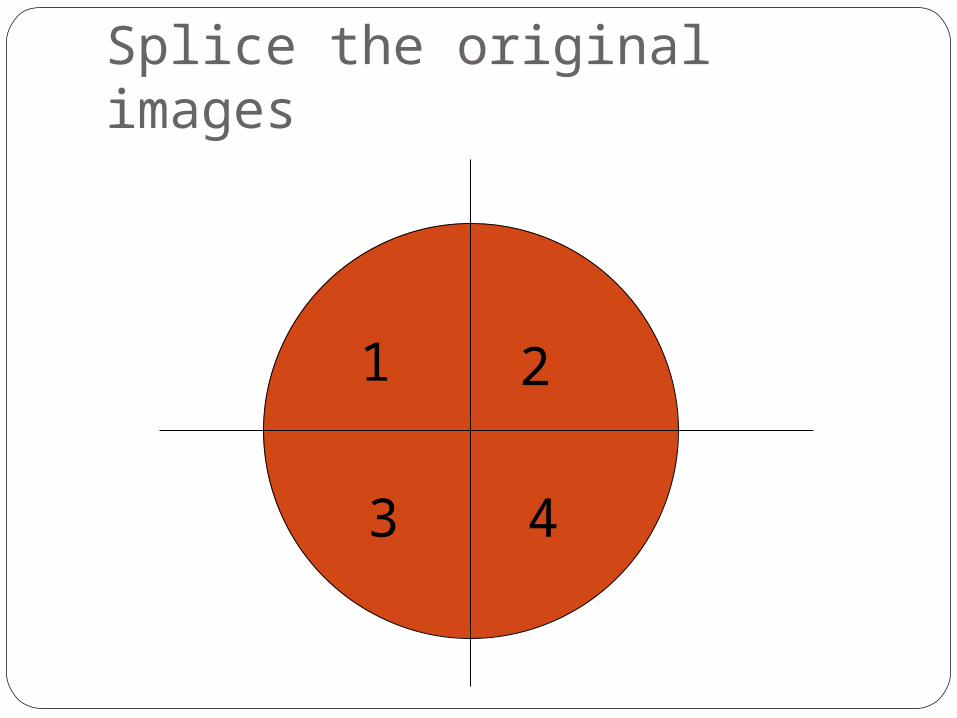
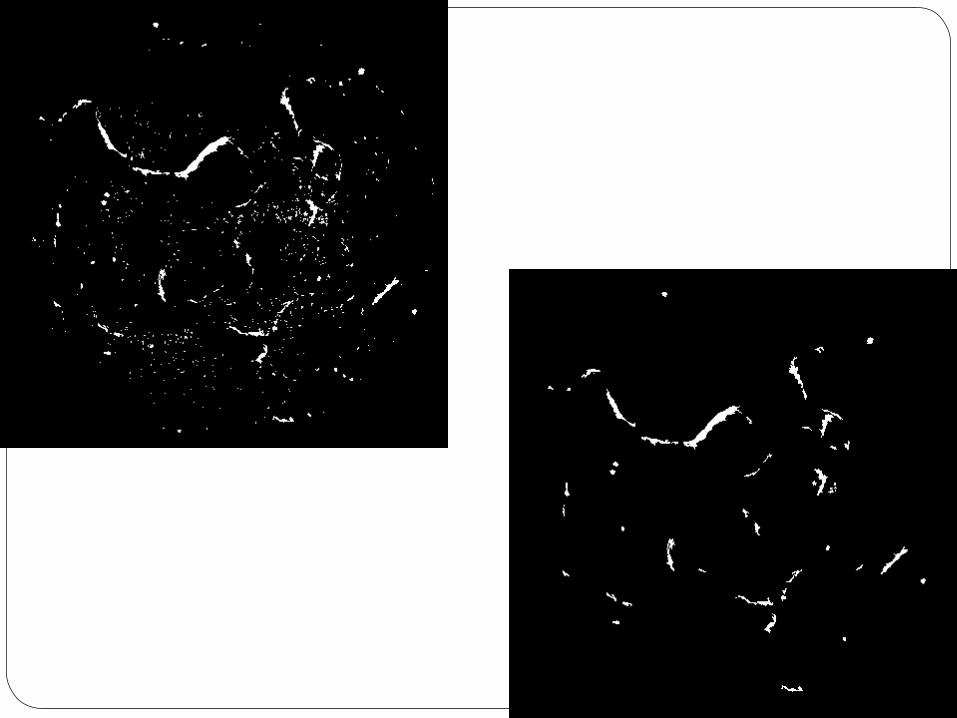
Splice the original images
1
43
2

Get the skeletonTo measure the length and location of the
filaments, we need to get the skeleton of each filaments, two methods are generally used to accomplish this:
1. Morphology Thinning2. Distance Transform

Remove spursCan be done used morphology thinning,
however, it would shrink the main spine itself.
New approach, use graph theory, treat each pixel as one node, if two pixel are 8-connected, treat them as connect, else not.
Then we try to find out the longest path among any of two nodes, and use the longest path as the main skeleton.