Embed Size (px)
Citation preview

Youth Employment in
Sub-Saharan Africa
Deon Filmer
The World Bank
December 2013

Main Findings
Unemployment (of urban educated graduates who want to work in the wage sector) is just the tip of the iceberg
The youth employment problem is about pathways to productive work in agriculture, household enterprises, as well as the modern wage sector—with priority actions on the human capital as well as the business environment side

The Opportunity: Africa’s Youth Bulge
Sub-Saharan Africa 2015, 2035
3
South Asia 2015, 2035
-100 -80 -60 -40 -20 0 20 40 60 80 100
0-4
10-14
20-24
30-34
40-44
50-54
60-64
70-74
80+
Population in millions
Male 2015 Female 2015
Male 2035 Female 2035
-100 -80 -60 -40 -20 0 20 40 60 80 100
0-4
10-14
20-24
30-34
40-44
50-54
60-64
70-74
80+
Population in millions
Male 2015 Female 2015
Male 2035 Female 2035
Source: United Nations, Department of Economic and Social Affairs, Population Division (2011). World Population Prospects: The 2010 Revision. http://esa.un.org/wpp/Excel-Data/population.htm

Over the past two decades, agriculture’s share in GDP contracted in Africa, but manufacturing did not replace it
Commodity exports have shaped recent changes in economic structure
0.0
0.2
0.4
0.6
0.8
1.0
1990 2010 1990 2010 1990 2010
SSA South Asia East Asia
Agriculture Industry (exc. Manufacturing)
Manufacturing Services, etc.
Low income countries
0.0
0.2
0.4
0.6
0.8
1.0
1990 2010 1990 2010 1990 2010
SSA South Asia East Asia
Agriculture Industry (exc. Manufacturing)
Manufacturing Services, etc.
Low-Middle income countries

Most Africans are not unemployed – they work in agriculture and household enterprises
0%
10%
20%
30%
40%
50%
60%
70%
80%
90%
100%
Low Income Lower-MiddleIncome
Resource Rich Upper-MiddleIncome
Total
183 m 40 m 150 m 21 m 395 m
Lab
or
Forc
e D
istr
ibu
tio
n 1
5-6
4
Agriculture HE Wage Industry Wage Services Unemployed

The SSA Youth Challenge: a long transition to work, especially in urban areas
Rural Urban
0.0
0.2
0.4
0.6
0.8
1.0
15 17 19 21 23 25 27 29 31 33
Pro
po
rtio
n
Age
0.0
0.3
0.5
0.8
1.0
15 17 19 21 23 25 27 29 31 33
Pro
po
rtio
n
Age
Not at School, Not Working, Looking for Work
At School Both Working and at School
Working

Where will the new jobs come from?
Projected new jobs in 2020 compared with structure in 2010
0
50
100
150
200
250
300
Agriculture HouseholdEnterprises
Wage Industry Wage Services
Lab
or
forc
e (
mill
ion
s)
2010 New Jobs in 2020

Priority Actions
A cross-cutting agenda on education quality

Education determines opportunities… Education Profile of Workers ages 25-34 in each Sector
0
20
40
60
80
100
Agriculture Non-farmhouseholdenterprise
Wagewithoutcontract
Wage withcontract
All
No Education Primary incomp. Primary comp. Secondary +
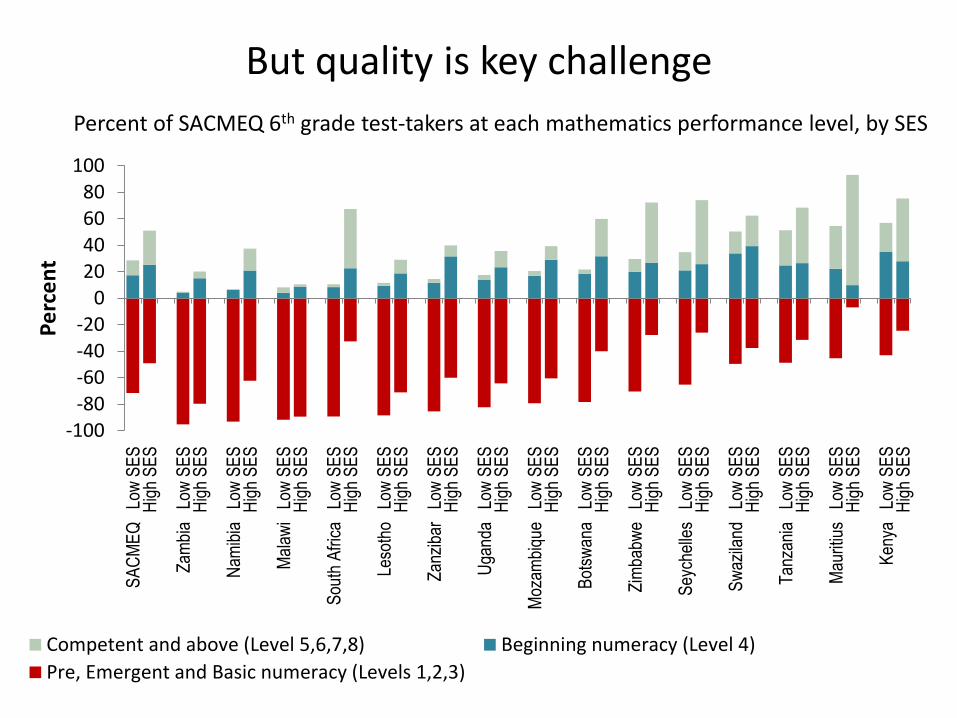
But quality is key challenge
Percent of SACMEQ 6th grade test-takers at each mathematics performance level, by SES
-100-80-60-40-20
020406080
100
SA
CM
EQ
Lo
w S
ES
Hig
h S
ES
Zam
bia
Low
SE
S H
igh
SE
S
Nam
ibia
Lo
w S
ES
Hig
h S
ES
Mal
awi
Low
SE
S H
igh
SE
S
Sou
th A
fric
a L
ow S
ES
Hig
h S
ES
Leso
tho
Low
SE
S H
igh
SE
S
Zan
ziba
r L
ow S
ES
Hig
h S
ES
Uga
nda
Low
SE
S H
igh
SE
S
Moz
ambi
que
Low
SE
S H
igh
SE
S
Bot
swan
a L
ow S
ES
Hig
h S
ES
Zim
babw
e L
ow S
ES
Hig
h S
ES
Sey
chel
les
Low
SE
S H
igh
SE
S
Sw
azila
nd
Low
SE
S H
igh
SE
S
Tan
zani
a L
ow S
ES
Hig
h S
ES
Mau
ritiu
s L
ow S
ES
Hig
h S
ES
Ken
ya
Low
SE
S H
igh
SE
S
Pe
rce
nt
Competent and above (Level 5,6,7,8) Beginning numeracy (Level 4)
Pre, Emergent and Basic numeracy (Levels 1,2,3)

Severe Shortfalls in the Delivery of Education Services
Service Delivery Indicators
Kenya Nigeria* Senegal Tanzania Uganda
(Public schools only)
School teacher absence rate 16% 16% 18% 23% 27%
Classroom teacher absence rate 47% 25% 29% 53% 57%
Share of teachers with minimum
knowledge:
English/French 10% 5% 29% 9% 4% Mathematics 75% 7% 75% 73% 36%
Classroom teaching time 2h 19m 3h 17m 3h 15m 2h 04m 2h 58m (scheduled teaching time) (5h 40m) (4h 43) (4h 36m) (5h 12m) (7h 20m)
* Nigeria SDI covers 6 States. Preliminary findings shown.

Priority Actions
For agriculture
For household enterprises
For the modern wage sector

In agriculture, youth need land and support to make it productive
Land ownership by age group
0
10
20
30
40
50
60
70
80
Pe
rce
nt
Age
Malawi Tanzania Uganda
Opportunities and constraints
• Growing demand for food produced on Africa’s farms – domestically and exports
• Youth can be early adopters of new technology if it is available
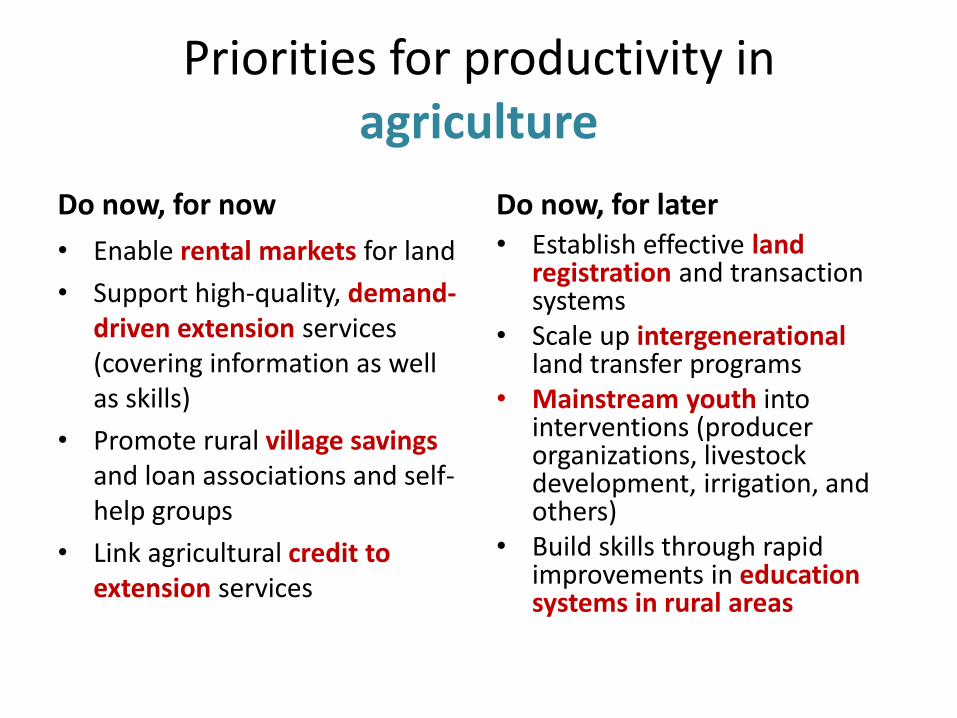
Priorities for productivity in agriculture
Do now, for now
• Enable rental markets for land
• Support high-quality, demand-driven extension services (covering information as well as skills)
• Promote rural village savings and loan associations and self-help groups
• Link agricultural credit to extension services
Do now, for later • Establish effective land
registration and transaction systems
• Scale up intergenerational land transfer programs
• Mainstream youth into interventions (producer organizations, livestock development, irrigation, and others)
• Build skills through rapid improvements in education systems in rural areas

Household Enterprises are not SMEs – they need their own approach, and youth need support to seize opportunities
Most enterprises are family operations
0
10
20
30
40
50
60
70
80
SelfEmployed
SelfEmployed
with FamilyHelpers
With 1-4Employees
5 +Employees
Pe
rce
nt
Youth struggle to start a business
0
5
10
15
20
25
30
35
15
- 1
9
20
- 2
4
25
- 2
9
30
- 3
4
35
- 3
9
40
- 4
4
45
- 4
9
50
- 5
4
55
- 5
9
60
- 6
5
66
+
Pe
rce
nt
Distribution of HE owners
Share of age group being in HE owners

Priorities for productivity in household enterprises
Do now, for now • Develop a national strategy that
reflects the voice of youth and household enterprise owners
• Ensure access to workspace and infrastructure for household enterprises through improved urban policy
• Leverage NGOs to deliver interventions that support disadvantaged youth to enter the sector by addressing multiple constraints (building a range of skills together, building skills along with providing access to finance)
Do now, for later
• Build foundational skills through rapid improvements in education systems
• Address infrastructure needs of household enterprises in urban development planning
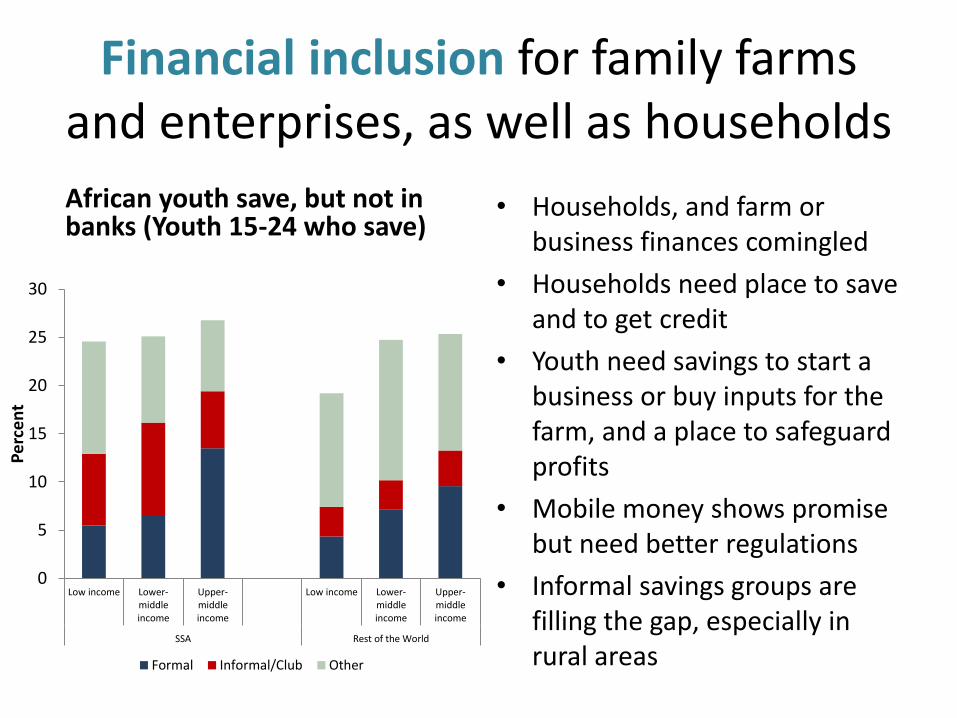
Financial inclusion for family farms and enterprises, as well as households
African youth save, but not in banks (Youth 15-24 who save)
• Households, and farm or business finances comingled
• Households need place to save and to get credit
• Youth need savings to start a business or buy inputs for the farm, and a place to safeguard profits
• Mobile money shows promise but need better regulations
• Informal savings groups are filling the gap, especially in rural areas
0
5
10
15
20
25
30
Low income Lower-middleincome
Upper-middleincome
Low income Lower-middleincome
Upper-middleincome
SSA Rest of the World
Pe
rce
nt
Formal Informal/Club Other
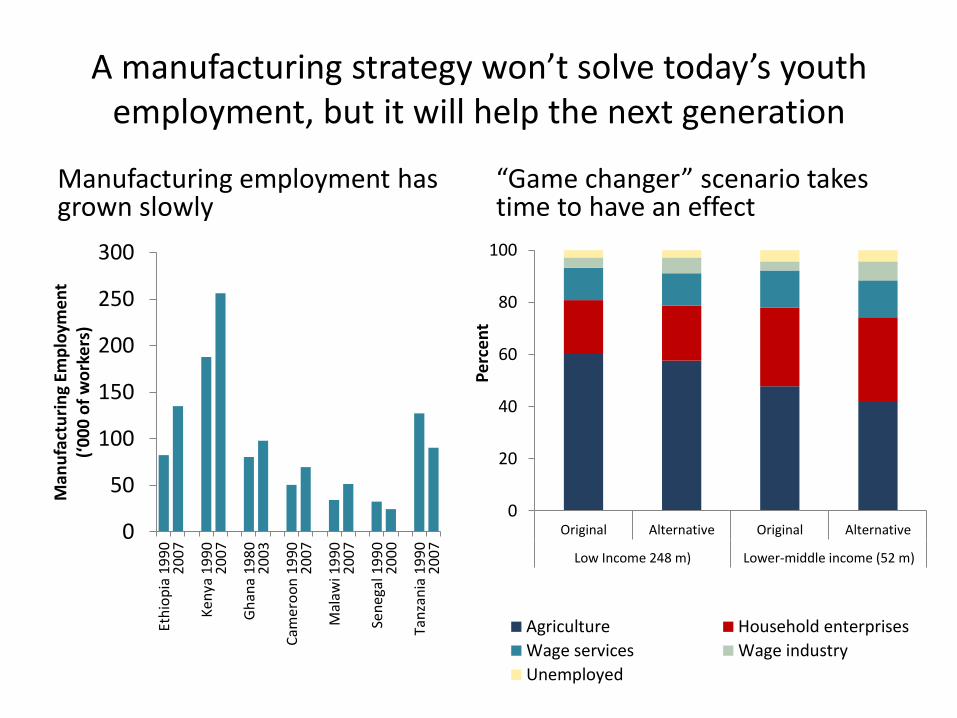
A manufacturing strategy won’t solve today’s youth employment, but it will help the next generation
Manufacturing employment has grown slowly
“Game changer” scenario takes time to have an effect
0
50
100
150
200
250
300
Eth
iop
ia 1
99
02
00
7
Ken
ya 1
99
02
00
7
Gh
ana
198
02
00
3
Cam
ero
on
19
902
00
7
Mal
awi 1
990
20
07
Sen
egal
19
90
20
00
Tan
zan
ia 1
99
02
00
7
Man
ufa
ctu
rin
g Em
plo
yme
nt
(‘0
00
of
wo
rke
rs)
0
20
40
60
80
100
Original Alternative Original Alternative
Low Income 248 m) Lower-middle income (52 m)
Pe
rce
nt
Agriculture Household enterprises
Wage services Wage industry
Unemployed

Priorities for productivity in the modern wage sector
Do now, for now
• Reduce the cost of infrastructure services by addressing quality and efficiency
• Address logistics bottlenecks
• Reduce corruption and the cost of business start-up
• Reform technical vocational education and training and pursue public-private partnerships for delivering demand-driven training
Do now, for later
• Increase the quantity of infrastructure services
• Expand regional markets for products
• Build foundational skills through rapid improvements in education systems
• Improve access to credit through financial sector reform

Cross-cutting priorities
Do now, for now
• Use safety net programs as a platform to deliver interventions to disadvantaged youth
• Increase awareness of opportunities and pathways to self-employment, especially for young women
• Consider second-chance education for basic skills
Do now, for later • Promote ECD and nutrition to
build a stronger foundation for skills development
• Build socioemotional and behavioral skills (consider reforms within the school system)
• Reduce fertility rates to lower the size of future youth cohorts
• Build better employment data and a stronger evidence base to identify country constraints, priorities, and opportunities
Some evidence from recent impact evaluations in Africa
• Addressing capital constraints:
• Cash Grants delivered to youth groups led to investments in capital and training and large increases in income.
• Building a range of skills:
• Training providing either business and life skills, or technical and life skills increased employment and income among adolescent girls.
• Provision of training in technical and life skills targeting adolescent girls was highly effective in reducing risky behavior and increased self-employment.
• Integrated intervention addressing multiple constraints:
• “Graduation” model including cash transfers, assets and training being piloted in 10 countries (including in Ghana and Ethiopia) is showing promising early results.
30

Strategic efforts to build the evidence-base through impact evaluations
• Optimal design of integrated employment programs – In Kenya, what is the relative effectiveness of internship and skills training in
improve young people’s employment prospects? – Is training in technical, business and life skills more cost-effective than training
in technical skills only to foster employment and earnings among urban youth In Sierra Leone?
– In Nigeria, is it cost-effective to add an apprenticeship to a package of technical skills training and capital delivered to vulnerable youth?
• Graduation from safety nets targeted to the poor: – In Cote d’Ivoire, can training in business skills or sensitization to wage
employment opportunities help disadvantaged youth graduate from public works into self-employment or wage employment?
– In Cameroon, can accompanying measures to cash transfers program foster household enterprises?
• Leveraging private skills training – In Benin, what are effective strategies to help young apprentices graduate and
enter self-employment faster? – In Cote d’Ivoire, does the public provision of apprenticeship displace private
apprenticeships?

YE is about building skills through improving the quality of education, as well as behavioral and business skills
YE is about agriculture – where strategies exist but have not been implemented, and could benefit from a youth lens
YE is about household non-farm enterprises – where few strategies exist
YE is about creating more labor intensive enterprises as fast as possible to absorb the supply of new entrants with education who want wage jobs
YE is about female empowerment and focus on the poor
Governments need to own the “whole” problem
A wide ranging agenda … with no silver bullets

Thank you