Embed Size (px)
Citation preview

Discussion Papers
Stock Market Integration in Asia: Global or Regional?Evidence from Industry Level Panel Convergence Tests
Guglielmo Maria Caporale and Kefei You
1669
Deutsches Institut für Wirtschaftsforschung 2017

Opinions expressed in this paper are those of the author(s) and do not necessarily reflect views of the institute.
IMPRESSUM
© DIW Berlin, 2017
DIW Berlin German Institute for Economic Research Mohrenstr. 58 10117 Berlin
Tel. +49 (30) 897 89-0 Fax +49 (30) 897 89-200 http://www.diw.de
ISSN electronic edition 1619-4535
Papers can be downloaded free of charge from the DIW Berlin website: http://www.diw.de/discussionpapers
Discussion Papers of DIW Berlin are indexed in RePEc and SSRN: http://ideas.repec.org/s/diw/diwwpp.html http://www.ssrn.com/link/DIW-Berlin-German-Inst-Econ-Res.html

Stock Market Integration in Asia: Global or Regional?
Evidence from Industry Level Panel Convergence Tests
Guglielmo Maria Caporale
Brunel University London, CESifo Munich and DIW Berlin
Kefei You
University of Greenwich
May 2017
Abstract This paper examines global and regional stock market integration in Asia at both the aggregate and disaggregate (industry) level by applying the Phillips-Sul (2007) tests for panel and club convergence. The main findings can be summarised as follows. In the pre-2008 crisis period, no integration/convergence of any kind is found. By contrast, in the post-crisis period, the Asian stock markets appear to be integrated both globally and regionally at the aggregate level; at the industry level, there is evidence of both global and regional integration in 6 out of 10 cases, the exceptions being Financials and Telecommunication, both in a turn-around phase, and Gas & Oil and Technology, for which there is no panel convergence. Club convergence tests reveal the existence of convergence clubs and divergent economies within the full panel, which explains why panel convergence is not found for the pre-crisis period and for the Gas & Oil and Technology sectors in the post-crisis period.
Keywords: Asian stock markets, global and regional integration, Phillips-Sul tests, panel and club convergence JEL classification: C32, C33, G11, G15
Corresponding author: Professor Guglielmo Maria Caporale, Research Professor at DIW Berlin. Department of Economics and Finance, Brunel University London, Kingston Lane, Uxbridge UB8 3PH, United Kingdom. Tel.: +44 (0)1895 266713. Fax: +44 (0)1895 269770. Email: [email protected]


1. Introduction
Cross-border financial integration is generally thought to bring benefits to an
economy by lowering the costs of asset trading and offering more portfolio
diversification opportunities. For these reasons many Asian countries, especially after
the 1997 crisis, embarked upon financial deregulation programmes with the aim of
removing the inefficiencies caused by the previous restrictions on capital flows and
achieving welfare gains. Indeed, in the last couple of decades cross-border financial
flows have increased significantly in most Asian economies (see Park, 2013).
However, the benefits have not been as large as anticipated, possibly because
integration has been incomplete, and also because higher openness has made these
economies more vulnerable to contagion during periods of financial turmoil such as
the recent global crisis. Analysing their degree of integration and its patterns is
therefore crucial also from a policy perspective, since different policy measures aimed
at achieving financial stability might be required in response to exogenous shocks
depending on the nature of the linkages between these financial markets. In particular,
regional financial integration might be an appealing alternative to globalised finance
with its associated contagion risks: since the Asian region as a whole runs a large
current account surplus, which means that regional saving exceeds regional
investment, higher regional integration might be preferable to riskier global exposure
to address the borrowing needs of individual Asian countries (see Devereux et al.,
2011).
There is in fact some evidence that regional financial integration has been the
main funding source for domestic investment, Japanese saving in particular financing
a sizeable percentage of investment in the region (see Kim et al., 2011). Regional
initiatives boosting intraregional trade have also stimulated financial integration as
shown by changes in the composition of portfolio equity holdings (see Lane, 2011).
Bae (2011) provides evidence of a higher degree of both global and regional
integration of the Asian stock markets using principal component analysis. Hinojales
and Park (2011) estimate conditional correlations also for stock returns at the
disaggregate, industry level data and find that financial integration with the rest of the
world is greater than within the region.
Park (2013) addresses similar issues by measuring both β- and σ-convergence
(see Barro and Sala-i-Martin, 1991, 1992) in emerging Asia and some sub-groupings.
1

She finds that the cross-market dispersion of weekly stock market returns has
declined and returns have converged over time; as for bond markets, the sovereign
debt problems experienced by some Asian countries combined with the global
financial crisis has resulted in a lower degree of convergence. She also uses principal
component analysis to model returns as having both expected and unexpected
components, the latter including local, regional and global shocks. The evidence she
obtains suggests that the Asian stock markets have become more integrated at the
global than the regional level, whilst both types of integration have declined in the
case of bond markets.
The present paper also examines stock market integration in Asia, more
specifically whether the Asian markets are more integrated with global or regional
markets (the US being used as an indicator of the former, and Japan and the rest of
Asia as two alternative indicators of the latter). Our contribution is three-fold. First,
the analysis is carried out using return differentials at both the aggregate and industry
level, the latter providing evidence on which industries drive Asian financial
integration. Very few previous studies have analysed industry level data to compare
global to regional integration. In particular, Hinojales and Park (2011) estimate a
DCC model using weekly data for the period 1993-2009, whilst we employ a panel
convergence method and also cover a longer period, until 2016.
Second, we examine whether the degree and pattern of integration has been
affected by the 2008 global financial crisis by splitting the sample and comparing the
pre- and post-crisis periods. This is again an issue not thoroughly investigated in the
existing literature. Wu et al. (2015) and Wang (2014) both use daily data at the
aggregate level. The former focus on the transmission of shocks (contagion) from the
US, Japan, and Hong Kong to other Asian countries and hence integration among East
Asia stock market themselves is not explained. Compared with the latter, our study
adopts alternative measures of financial integration as well as a different empirical
method, and provides further evidence at the industry level.
Third, we apply the Phillips and Sul (2007) tests for both panel and club
convergence, which are ideally suited to test for global and regional integration in the
Asian stock markets. To our knowledge, these tests have only been used in two
previous studies on Asia, namely those by Apergis et al. (2014) and Tam and Tam
(2012) for a panel of over 40 countries. However, neither paper analyses global versus
regional integration (returns are used instead of return differentials), the former only
2

covers the period up to 2008, and the latter does not consider either the impact of the
recent global financial crisis or club convergence (it uses stock valuation ratios such
as earnings-, dividend-, and book-price ratios for the analysis).
Our main findings can be summarised as follows. In the pre-crisis period, no
integration/convergence at either the global or regional level is found for the Asian
stock markets; this is true for both aggregate and industry level stock returns. By
contrast, in the post-crisis period, the Asian markets appear to be integrated both
globally and regionally at the aggregate level; at the industry level, there is evidence
of both global and regional integration in 6 out of 10 cases, the exceptions being
Financials and Telecommunication, both in a turn-around phase, and Gas & Oil and
Technology, for which there is no panel convergence. Club convergence tests reveal
the existence of convergence clubs and divergent economies within the full panel,
which explains why panel convergence is not found for the pre-crisis period and for
Gas & Oil and Technology sectors in the post-crisis period.
The layout of the paper is as follows. Section 2 reviews the relevant literature.
Section 3 outlines the empirical method used for the analysis, namely the Phillips and
Sul (2007) convergence tests. Section 4 describes the data and discusses the empirical
findings. Section 5 offers some concluding remarks and highlights the policy
implications of the analysis.
2. Literature Review
There are three main types of measures of financial integration in the existing
literature, based on prices, volume and regulatory or institutional factors respectively.
The first is often embodied in interest parities conditions in the money markets or in
co-movements in assets returns in stock and bond markets. Studies employing
volume-based measures often examine the saving-investment correlations pioneered
by Feldstein and Horioka (1980), consumption correlations (e.g., Bayoumi, 1997; de
Browuer, 1999) and capital flows (cross-border financial transactions) (e.g., Cavoli et.
al., 2006). The third type is often based on the presence or not of capital controls and
legal restrictions such as those on foreign equity holdings (e.g., Grilli and Milesi-
Ferretti, 1995; Magud and Reinhart, 2006).
Price-based measures have been most often employed to analyse Asian stock
market integration. Both (time-varying) correlations and VAR (cointegration) models
with impulse response analysis have been used in various papers (see Sharma and
3

Seth, 2012). 1 Some recent correlation studies include Loh (2013) (applying the
wavelet coherence method), Abid et al. (2014) (using the multivariate General
Dynamic Covariance (GDC)-GARCH model), Boubakri and Guillaumin (2015),
Narayah et al. (2014) (both using GARCH-dynamic conditional correlations (DCCs)),
Dewandaru et al. (2015) (using wavelet decomposition techniques), Cao et al. (2017)
(using volatility constrained multi-sfractal de-trended cross-correlation analysis (VC-
MF-DCCA)) and Wang et al. (2017) (using the coupling de-trended fluctuation
analysis (CDFA) method).
Examples of VAR studies are Huyghebaert and Wang (2010) and Wang
(2014) that examine both long- and short-term linkages using cointegration tests and
impulse response analysis respectively. Gupta and Guidi (2012) and Chien et al.
(2015) focus on India and China respectively within a cointegration framework.
Most of the available evidence suggests increasing financial integration
between the Asian stock markets; however, it appears that global is stronger than
regional integration (e.g., Hinojales and Park, 2011; Park and Lee, 2011; Kim et al.,
2011; Kim and Lee, 2012). As already mentioned, some recent studies have measured
both β- and σ-convergence in Asia and found convergence of stock markets and
divergence of bond markets (Park, 2013).
3. The Methodology
Barro and Sala-i-Martin (1991, 1992) introduced the concepts of β- and σ-
convergence, the former implying mean reversion for the panel units, whilst the latter
is a reduction in overall cross-section dispersion. Islam (2003) highlighted some
problems with standard convergence tests (see also Durlauf and Quah, 1999 and
Bernard and Durlauf, 1996): the implications of growth models for absolute
convergence and convergence “clubs” are not clear; different tests do not have the
same null hypothesis and therefore are not directly comparable; most tests are based
on rather specific and restrictive assumptions about the underlying panel structures.
A new non-linear, time-varying coefficient factor model without such limitations
has been developed by Phillips and Sul (2007), who proposed a regression-based test
together with a clustering procedure. Their approach is not dependent on stationarity
assumptions and allows for a wide variety of possible transition paths toward
1 For a review of the literature on financial integration in Asia focusing on money and bond markets, see Rughoo and You (2016).
4

convergence (including sub-group convergence). Specifically, it is based on a time-
varying factor model using common stochastic trends, which can accommodate long-
term co-movement in aggregate behaviour outside the cointegration framework and
allows for the modelling of transitional effects. Being based on such a time-varying
factor model, the Phillips and Sul (2007) method is more powerful than the traditional
β- and σ-convergence tests, and it provides estimates of the speed of convergence for
both the full panel and sub-groups through its club formation procedure. This method
is explained in detail below.
3.1. Relative Transition
Phillips and Sul (2007) (P-S) proposed the new time-varying loading factor
representation for the panel variable 𝑋𝑋𝑖𝑖𝑖𝑖:
𝑋𝑋𝑖𝑖𝑖𝑖 = 𝛿𝛿𝑖𝑖𝑖𝑖𝜇𝜇𝑖𝑖, (1)
where 𝜇𝜇𝑖𝑖 is a single common component and 𝛿𝛿𝑖𝑖𝑖𝑖 is a time-varying factor-loading
coefficient that measures the idiosyncratic distance between the common trend
components 𝜇𝜇𝑖𝑖 and 𝑋𝑋𝑖𝑖𝑖𝑖.
To obtain information about the time-varying factor loading 𝛿𝛿𝑖𝑖𝑖𝑖, Phillips and
Sul (2007) employed the relative version of 𝛿𝛿𝑖𝑖𝑖𝑖 , the relative loading factor or the
relative transition parameter, as follows:
ℎ𝑖𝑖𝑖𝑖 = 𝑋𝑋𝑖𝑖𝑖𝑖1𝑁𝑁∑ 𝑋𝑋𝑖𝑖𝑖𝑖𝑁𝑁𝑖𝑖=1
= 𝛿𝛿𝑖𝑖𝑖𝑖1𝑁𝑁∑ 𝛿𝛿𝑖𝑖𝑖𝑖𝑁𝑁𝑖𝑖=1
, (2)
where ℎ𝑖𝑖𝑖𝑖 is the relative transition parameter that measures 𝛿𝛿𝑖𝑖𝑖𝑖 in relation to the panel
average at time 𝑡𝑡 and therefore describes the transition path for country or area 𝑖𝑖
relative to the panel average. If 𝛿𝛿𝑖𝑖𝑖𝑖 converge to 𝛿𝛿 , then the relative transition
parameters ℎ𝑖𝑖𝑖𝑖 converge to unity. In this case, the cross-sectional variance of ℎ𝑖𝑖𝑖𝑖 ,
𝐻𝐻𝑖𝑖, converges to zero in the long run:
𝐻𝐻𝑖𝑖 = 1𝑁𝑁∑ (ℎ𝑖𝑖𝑖𝑖 − 1)2𝑁𝑁𝑖𝑖=1 → 0 as 𝑡𝑡 → ∞. (3)
3.2. The 𝒍𝒍𝒍𝒍𝒍𝒍 𝒕𝒕 Convergence Test
P-S proposed a simple regression-based testing procedure to examine the null of
convergence, 𝐻𝐻0: 𝛿𝛿𝑖𝑖 = 𝛿𝛿 and 𝛼𝛼 ≥ 0, against the alternative of 𝐻𝐻𝐴𝐴: 𝛿𝛿𝑖𝑖 ≠ 𝛿𝛿 or 𝛼𝛼 < 0.
The procedure involves three steps. First, the cross-sectional variance ratio 𝐻𝐻1 𝐻𝐻𝑖𝑖⁄ is
calculated, given that 𝐻𝐻𝑖𝑖 = 1𝑁𝑁∑ (ℎ𝑖𝑖𝑖𝑖 − 1)2𝑁𝑁𝑖𝑖=1 . Second, the following ordinary least
5

squares regression is run, and a conventional robust 𝑡𝑡 statistics, 𝑡𝑡𝑏𝑏� , is calculated for
the coefficient 𝑏𝑏� using the estimate of the long-run variance of the regression
residuals:
𝑙𝑙𝑙𝑙𝑙𝑙 �𝐻𝐻1𝐻𝐻𝑖𝑖� − 2𝑙𝑙𝑙𝑙𝑙𝑙𝑙𝑙(𝑡𝑡) = 𝑎𝑎� + 𝑏𝑏�𝑙𝑙𝑙𝑙𝑙𝑙 𝑡𝑡 + 𝑢𝑢�𝑖𝑖, (4)
for 𝑡𝑡 = [𝑟𝑟𝑟𝑟], [𝑟𝑟𝑟𝑟] + 1, … ,𝑟𝑟 with some 𝑟𝑟 > 0. P-S recommended 𝑟𝑟 = 0.3 on the basis
of their simulations. Other settings of the regression include 𝑙𝑙(𝑡𝑡) = 𝑙𝑙𝑙𝑙𝑙𝑙 (𝑡𝑡 + 1) and
the fitted coefficient of log 𝑡𝑡 is 𝑏𝑏� = 2𝑎𝑎�, where 𝑎𝑎� is the estimate of 𝑎𝑎 under the null. A
one-sided 𝑡𝑡 test of null 𝛼𝛼 ≥ 0 using 𝑏𝑏� is then performed and the null of convergence
is rejected at a 5% significance level if 𝑡𝑡𝑏𝑏� < −1.65.
Note that 𝛼𝛼� ≥ 1 and, accordingly, 𝑏𝑏� ≥ 2 implies level (i.e., absolute)
convergence and that 1 > 𝛼𝛼� ≥ 0 and therefore 2 > 𝑏𝑏� ≥ 0 implies rate (i.e.,
conditional) convergence.
3.3. Club Convergence and Clustering
Rejection of the null of full-panel convergence does not imply that there is no
convergence. There may be one or more convergent clusters as well as divergent units
in the panel. P-S provided a four-step algorithm to detect such units of clusters that is
based on repeated log t regressions and involves the following steps:
(i) Order the panel units 𝑋𝑋𝑖𝑖𝑖𝑖 according to the last observation, 𝑋𝑋𝑖𝑖𝑖𝑖.
(ii) Select the first k highest panel units (𝑁𝑁 > 𝑘𝑘 ≥ 2) and calculate 𝑡𝑡𝑏𝑏�(𝑘𝑘) for each k.
The core group size 𝑘𝑘∗ is chosen according to 𝑘𝑘∗ = 𝑎𝑎𝑟𝑟𝑙𝑙𝑎𝑎𝑎𝑎𝑎𝑎𝑘𝑘{𝑡𝑡𝑏𝑏�(𝑘𝑘)} subject
to 𝑎𝑎𝑖𝑖𝑚𝑚{𝑡𝑡𝑏𝑏�(𝑘𝑘)} > −1.65 . If 𝑘𝑘∗ = 𝑁𝑁 , there is full-panel convergence. If
𝑎𝑎𝑖𝑖𝑚𝑚{𝑡𝑡𝑏𝑏�(𝑘𝑘)} > −1.65 does not hold for 𝑘𝑘 = 2, drop the first unit and perform the
same procedure for the remaining units. If 𝑎𝑎𝑖𝑖𝑚𝑚{𝑡𝑡𝑏𝑏�(𝑘𝑘)} > −1.65 does not hold for
every subsequent pair of units, there are no convergent clusters in the panel.
(iii) Add one remaining unit at a time to the core group and perform the 𝑙𝑙𝑙𝑙𝑙𝑙 𝑡𝑡 test. If
the corresponding 𝑡𝑡 statistic from this regression, �̂�𝑡 , exceeds a chosen critical
value, 𝑐𝑐1F
2, then include the unit in the current subgroup. The 𝑙𝑙𝑙𝑙𝑙𝑙 𝑡𝑡 test is run for
this sub-group, and if 𝑡𝑡𝑏𝑏� > −1.65, the formation of the sub-group is completed.
Otherwise, increase the critical value 𝑐𝑐 and repeat the procedure.
2 Note that, following Phillips and Sul (2009), we set 𝑐𝑐 = 0, as the number of observation is not particularly large.
6

(iv) A subgroup of the units is formed for which �̂�𝑡 < 𝑐𝑐 in (iii). Run the 𝑙𝑙𝑙𝑙𝑙𝑙 𝑡𝑡 test for
this subgroup, and if 𝑡𝑡𝑏𝑏� > −1.65 , this cluster converges, and there are two
convergent sub-groups in the panel. Otherwise, repeat (i)–(iii) on this sub-group to
determine whether a smaller convergent sub-group exists. If there is no 𝑘𝑘 in (ii)
for which 𝑡𝑡𝑏𝑏�(𝑘𝑘) > −1.65, the remaining units diverge.
The Phillips and Sul (2007) method has been employed for a range of developed
stock markets. For instance, Caporale et al. (2015) apply it to test for convergence in
the stock returns of five EU countries (Germany, France, the Netherlands, Ireland and
the UK) as well as the US between 1973 and 2008, for both sectors and individual
industries within sectors. Concerning studies focusing on Asia, as already mentioned
the only two previous applications are Apergis et al. (2012) and Tam and Tam (2012).
4. Empirical Analysis
4.1 Data
The Asian economies included in this study are China (PRC), Hong Kong, India,
Indonesia, Malaysia, Pakistan, Philippines, Singapore, South Korea, Sri Lanka,
Taiwan, and Thailand. The data source is Datastream. Stock market returns are
calculated as monthly log first differences. Then three sets of return differentials are
constructed vis-à-vis 1) the US; 2) Japan; and 3) Asia (excluding Japan).
We employ data at both the aggregate and industry level. The following ten
sectors are included in the analysis: 1) Basic Materials, 2) Consumer Goods, 3)
Consumer Services, 4) Financials, 5) Healthcare, 6) Industrials, 7) Oil & Gas, 8)
Technology, 9) Telecommunications, and 10) Utilities. The frequency is monthly and
the sample period is 2000M1-2016M9. To investigate the impact of the 2008 financial
crisis we divide the full sample into two sub-periods, namely 2000M1-2007M12 and
2009M1-2016M9, excluding the two-year period 2007M10-2009M9 that is
characterised by extreme volatility.
4.2. Logt Test Results
Following Phillips and Sul's (2007) recommendation, we apply the Hodrick and
Prescott (1997) filter to remove the cycle component of each series before running the
convergence test on the return differentials. The first step is to examine full-panel
7

convergence applying the logt test. The test results are displayed in Table 1. At the
aggregate level, the null of convergence is rejected at the 5% level in the pre-crisis
period in all three cases, suggesting absence of both global and regional integration.
However, in the post-crisis period there is conditional convergence (convergence in
rates) (given that 2 > 𝑏𝑏� ≥ 0) in the return differentials at both the global and regional
level, and the speed of convergence for the three sets of differentials is very similar
(i.e., above 0.5 and below 0.6).
Moving on to the sector level results, in the pre-crisis period panel
convergence is rejected in all three cases (i.e., relative to the US, Japan, and Asia
(excluding Japan)) for all ten sectors, which suggests that the absence of convergence
at the aggregate level in the pre-crisis period reflects lack of convergence at the sector
level. By contrast, in the post-crisis period returns differentials in six out of ten
sectors exhibit conditional convergence (since 2 > 𝑏𝑏� ≥ 0), again at a very similar
speed for all sets of differentials. The four exceptions are Financials,
Telecommunication, Oil & Gas, and Technology. It is noteworthy that in the case of
the former two sectors the point estimates are negative and not significantly different
from zero; following Phillips and Sul (2009), this indicates that the Financials and
Telecommunication sectors are in transitional divergence and in a turn-around phase,
with convergence occurring in the post-crisis period. For Oil & Gas and Technology
convergence is rejected and hence there is no evidence of integration regardless of the
period or level of integration (global or regional) considered.
Therefore, it appears that there is both global and regional integration at the
aggregate level in the post-crisis period. At the sector level there is evidence of both
global and regional integration, except for Oil & Gas, Technology (full panel
convergence is rejected) and Financials and Telecommunication sector (that are in
transitional divergence and turn-around phase). There is slightly stronger evidence of
global than regional integration at both the aggregate and sector level (except for the
sectors mentioned before), since the speed of convergence, b, is consistently higher
(though by a small amount) in the former case.
4.3. Club Convergence Results
As argued by Phillips and Sul (2007), a rejection of full-panel convergence on the
basis of the logt test does not rule out the possibility of club convergence and the
8

presence of divergent members. Hence our next step is to apply the P-S clustering
algorithm to the panel and identify those.
Since we are more interested in the recent post-crisis period, we first carry out
club convergence analysis for the Oil & Gas and Technology Sectors, the only two
sectors where full-panel convergence is rejected in the post-crisis period. The results
are presented in Table 2. Since full-panel convergence is rejected at both the
aggregate and sector level in the pre-crisis period, we also carry out club convergence
tests for this sub-sample to establish whether this rejection is due to the presence of
convergence clubs and/or divergent economies. The results are presented in Table 3.
Oil and Gas Sector
For this sector, in the case of return differentials vis-à-vis the US, one convergence
club is identified including China, India, Hong Kong, Malaysia, Philippine, Thailand,
Pakistan, and Sri Lanka. Singapore and South Korea are two divergent countries that
neither belong to the convergence club nor converge between themselves. As for the
return differentials vis-à-vis Japan and Asia (excluding Japan), only Singapore
diverges and all the other countries belong to a convergence club. It is worth
mentioning that the convergence club based on the return differentials vis-à-vis the
US is converging at a faster speed (i.e., a higher value of 𝑏𝑏�) than that based on the
differentials vis-à-vis Japan and Asia. Therefore, rejection of full-panel convergence
in the post-crisis period is due to Singapore and South Korean diverging in the case of
the return differentials vis-à-vis the US, and Singapore diverging in the case of the
differentials vis-à-vis Asia.
Figures 1-3 present the corresponding relative transition parameters for the Oil
& Gas sector in all ten countries. Figure 1 highlights the fact that Singapore and South
Korea have diverged from the other economies, especially towards the end of the
post-crisis period. Figures 2 and 3 show the divergence of Singapore with much lower
relative transition parameters towards the end of our sample period. In the case of
South Korea, although its relative transition parameters are also higher than for other
economies since 2015, the overall transition path is more similar to theirs than in
Figure 1, which suggests that this country, unlike Singapore, belongs to the
convergence club.
9

Table 3 reports the club convergence tests for the Oil & Gas sector in the pre-
crisis period. On the basis of the return differentials vis-à-vis the US, three clubs can
be identified, with clubs 1 and 3 being in transitional divergence and a turn-around
phase, and club 2 having conditional convergence given by 2 > 𝑏𝑏� ≥ 0. The same
three clubs can also be identified in the case of the return differentials vis-à-vis Japan
and Asia, although only club 3 (Pakistan and Sri Lanka) is in a transitional phase
while the economies in club 1 (China, Hong Kong, Thailand and South Korea)
converge at a relatively faster speed than those in club 2. Therefore, the rejection of
full-panel convergence in the pre-crisis period is due to the presence of some
convergence clubs as well as some transitional clubs.
A comparison of the two sub-periods shows that, for the Oil & Gas Sector,
both global and regional integration are stronger in post- than in pre-crisis period as
most economies (with one or two exceptions) have experienced club convergence.
There is slightly stronger evidence of regional integration (based on a faster speed of
convergence and the existence of only one club in a transitional phase) in the pre-
crisis period and of global integration (given a slightly faster speed of convergence) in
the post-crisis period. This suggests that the Asian energy markets, despite being
more globally and regionally integrated after 2008, have been more influenced by the
global markets after the crisis.
Technology Sector
In the post-crisis period, two clubs can be identified, with Hong Kong and Taiwan in
club 1 and China, India, Singapore, Thailand and South Korea in club 2. This is the
case for all three sets of differentials, although the speed of convergence (measured
by the value of b) is slightly higher in the case of the differentials vis-à-vis Japan and
Asia. Therefore, rejection of full-panel convergence in the post-crisis period is due to
the existence of two separate convergence clubs. Further, their speed of convergence
suggests that regional integration is slightly stronger than the global one.
Figures 4-6 present the relative transition parameters for all seven countries in
the Technology sector. In all cases Hong Kong and Taiwan have transition curves that
are moving together and upwards faster than those of the other economies towards the
end of the sample period, suggesting higher differentials vis-à-vis the US, Japan and
Asia than for other emerging Asian economies since 2015.
10
Table 3 reports club convergence test for the Technology sector in the pre-
crisis period. There is one club where economies are in a transitional phase and one
divergent country, i.e. China, for all three sets of differentials. Therefore, rejection of
full-panel convergence in the pre-crisis period is due to China diverging and the other
countries being in a transitional divergence and turn-around phase.
Although full-panel convergence is rejected for both pre- and post-crisis
periods, there are signs of both global and regional integration in the latter period
since two convergence clubs can be found, compared with no convergence clubs in
the former. The divergence of China in the pre-crisis period and its belonging to one
of the convergence clubs in the post-crisis period suggest that the Technology sector
of this country has become regionally and globally integrated. Hong Kong and
Taiwan form a convergence club in the post-crisis period, confirming their leading
positions in this sector in Asia. The speed of convergence for the clubs is slightly
faster at the regional level, which again indicates stronger regional integration within
clubs in the post-crisis period.
Aggregate and other sector results in the pre-crisis period
Since full-panel convergence is rejected in all cases in the pre-crisis period, we now
analyse the club convergence test results in Table 3 to establish whether this is due to
the existence of convergence clubs and/or divergent economies.
At the aggregate level, there is one convergence club including India, Hong
Kong, Indonesia, Malaysia, Philippine, Singapore, South Korea, Taiwan, Pakistan,
and Sri Lanka, whilst China and Thailand form one transitional club. This is the case
regardless of the differentials used. Therefore, the lack of full-panel convergence in
the pre-crisis period at the aggregate level is mainly due to the fact that China and
Thailand are in a transitional divergence and turn-around phase.
As for the sector level data, we first consider the Financials sector. Prior to the
crisis, three convergence clubs and one transitional club can be identified in the case
of the differentials vis-à-vis the US, whilst on the basis of those vis-à-vis Japan and
Asia there are two convergence clubs. Although all three sets of differentials suggest
that there are economies in a transitional phase in the post-crisis period, there is
stronger evidence of regional integration prior to the crisis since only a few clubs can
be identified when considering the differentials vis-à-vis Japan and Asia.
11
Concerning the Telecommunication sector, two convergence clubs are found
for all three sets of differentials, although Singapore and Pakistan belong to club 1 in
the case of the differentials vis-à-vis the US and Japan and instead to club 2 in the
case of those vis-à-vis Asia. Hence there are two convergence clubs in the pre-crisis
period and a transitional club in the post-crisis period.
Regarding the other six sectors, our results reveal that there are three
convergence clubs for Basic Materials, two convergence clubs and one transitional
club for Consumer Goods, two convergence clubs for the Utility sector, one
convergence and one transitional club for the Industrial sector, one convergence club
and two divergent economies (China and Taiwan) for the Consumer Services sector,
and one convergence club, one transitional club, and two divergent countries (India
and Philippine) for Healthcare. When convergence clubs are found, there is
conditional convergence (2 > 𝑏𝑏� ≥ 0) except in the case of Healthcare and Consumer
Goods in club 3 when level convergence (𝑏𝑏� ≥ 2) is found. This holds regardless of
what type of differentials are used for the analysis.
Both at the aggregate and sector level, prior to the crisis, global and regional
integration is only found for some sub-groups. The degree of global and regional
integration are very similar in terms of their speed of convergence and convergence
clubs, transitional clubs, and divergent economies across the three data set. There are
only two exceptions. The first is the Financials sector where slightly stronger
evidence of regional integration is detected given the smaller number of clubs. The
second is the Oil & Gas sector where stronger evidence of regional integration is
found since there are fewer transitional clubs and a faster speed of club convergence.
It is also noteworthy that China has moved from often diverging or being in a
transitional club in the pre-crisis period to becoming a member of a convergence club
in the second sub-period, which suggests that it has become more integrated, both
globally and regionally, after the crisis.
5. Conclusions
This paper investigates whether the Asian stock markets are more integrated at the
global or regional level (the US being used as an indicator of the former, and Japan
and the rest of Asia as two alternative indicators of the latter). We analyse return
differentials at both the aggregate and industry level, the latter shedding light on
12

which sectors drive integration. Specifically we carry out the Phillips-Sul (2007) tests
for panel and club convergence, which are more powerful than conventional β- and σ-
convergence tests, paying special attention to contrasting convergence patterns
between the pre- and post-crisis periods.
We find that in the pre-crisis period there is no integration/convergence at
either the global or regional level for the Asian stock markets, regardless of whether
one uses aggregate or industry level stock returns. By contrast, in the post-crisis
period, the Asian markets appear to be integrated both globally and regionally at the
aggregate level. Further tests using the industry level data show that there are 6 out of
10 industries driving integration, the exceptions being Financials and
Telecommunication, both in a turn-around phase, and Gas & Oil and Technology, for
which there is no panel convergence. Is it also noteworthy that where full-panel
convergence is found, at both the aggregate and industry level, global integration is
slightly stronger than regional integration (judged by the speed of convergence).
Further club convergence tests for the Gas & Oil and Technology sectors in
the post-crisis period reveal the existence of convergence clubs and divergent
economies, which explains the lack of full-panel convergence for these two industries.
The evidence on the convergence clubs suggests that the energy sector is more
influenced by the global than the regional markets after the 2008 global financial
crisis, while the opposite is true for the Technology sector. In addition, we also find
that the absence of full-panel convergence in the pre-crisis period is due to the
existence of a transitional club (formed by China and Thailand) at the aggregate level
and of convergence/transitional clubs and/or divergent economies at the industry
level.
Of the countries examined China, often found to be in a transitional club or to
be a divergent economy, has become far more globally and regionally integrated after
the 2008 global financial crisis. The speed of convergence for both sets of regional
stock return differentials implies that, when either full-panel or club convergence
occurs, in most cases the Asian stock markets are more integrated with Japan than
with the regional index. Therefore Japan appears to be a regional leader and continues
in fact to be the main source of funding for investment in the region (see Kim et al.,
2011).
Whilst several previous studies provide more evidence of global integration
(e.g., Hinojales and Park, 2011; Park and Lee, 2011; Kim et al., 2011; Kim and Lee,
13

2012; Park, 2013), ours finds very similar levels of global and regional integration at
both the aggregate and industry level, the former being only slightly stronger.
Therefore, although various regional agreements such as the Chiang Mai Initiative in
2000, the Asian Bond Market Initiative (ABMI) in 2003, the new ABMI roadmap in
2008 and the Chiang Mai Initiative Multilateralization in 2012 have been signed to
enhance regional cooperation, this should be promoted further to achieve a level of
integration similar to that with the US.
Further, the 2008 global financial crisis appears to have resulted in tighter
global and regional financial integration in the case of Asia, possibly because it
provided stronger incentives for (regional) integration to deal with external common
shocks (Asian Development Bank, 2013). This finding goes contrary to previous
claims of a decoupling between Asia and the US (e.g., Leduc and Spiegel, 2013).
Such stronger financial linkages require that an appropriate policy framework be in
place to deal with future crises. In particular, since the recent global financial crisis
originating from the US affected emerging equity markets primarily through a decline
in investor’s risk appetite (Chudik and Fratzscher, 2011), measures such as the daily
one proposed by Kumar and Persaud (2002) should be used to keep track of it.
Moreover, risk sharing between the Asian countries should be increased; as suggested
by Ding et al. (2014), greater financial inclusion and innovation would contribute to
achieve this objective and make the Asian economies more resilient in the presence of
external shocks.
Finally, our findings have implications for investors seeking portfolio
diversification, since the four sectors that do not appear to be tightly integrated across
countries offer investment opportunities for both global and regional diversification.
However, this is not the case for either China or Japan given the evidence of strong
integration of their stock markets.
14

References Abid, I., Kaabia, O. and Guesmi, K., 2014, Stock market integration and risk premium: Empirical evidence for emerging economies of South Asia, Economic Modelling 37, 408–416 Apergis, N., Christou, C. and Miller S. M., 2014, Country and industry convergence of equity markets: International evidence from club convergence and clustering, The North American Journal of Economics and Finance, 29, 36-58. Asian Development Bank (2013, October). Regional cooperation and integration. In Asian Development Bank (Ed.), Asian Economic Integration Monitor. Asian Development Bank. Bae, K.-H. (2011), “Stock market integration and financial contagion”, in Devereux, M.B., Lane, P.R., Park, C.-Y. and S.-J. Wei (eds.), The Dynamics of Asian Financial Integration – Facts and Analytics”, 135-173, Routledge, Abingdon, UK. Barro, R. J., X. Sala-i-Martin (1991), Convergence across States and Regions, Brookings Papers on Economic Activity, 22, 107-182. Barro, R. J., X. Sala-i-Martin (1992), Convergence, The Journal of Political Economy, 100, 2, 223-251. Bayoumi, T. (1997). Financial integration and real activity. Manchester University Press. Bernard, A., S. N. Durlauf (1996), Interpreting Tests of the Convergence Hypothesis, Journal of Econometrics, 71, 1-2, 161-173. Boubakri, S. and Guillaumin, C., 2015, Regional integration of the East Asian stock markets: An empirical assessment, Journal of International Money and Finance 57, 136–160 Cao, G., Zhang, M. and Li, Q. (2017), Volatility-constrained multifractal detrendedcross correlation analysis: Cross-correlation among Mainland China, US, and Hong Kong stock markets, Physica A 472, 67–76. Caporale, G.M., Erdogan, B. and V. Kuzin (2015), Testing for convergence in stock markets: a non-linear factor approach, Empirica, 42, 3, 481-498. Cavoli, T., Rajanb, R.S. and Siregarc, R. (2006). Financial integration in East Asia: How far? How much further to go? eSocialSciences Working Papers, 372. Chien, M.-S., Lee, C-C., Hu, T-C. and Hu, H-T. (2015), Dynamic Asian stock market convergence: Evidence from dynamic cointegration analysis among China and ASEAN-5 Economic Modelling 51, 84–98. Chudik, A., Fratzscher, M. (2011). Identifying the global transmission of the 2007–2009 financial crisis in a GVAR model. European Economic Review 55 (3), 325–339.
15

deBrowuer, G. (1999). Financial integration in East Asia. Cambridge University Press. Devereux, M.B., Lane, P.R., Park, C.-Y. and S.-J. Wei (2011), “Executive summary and overview”, in Devereux, M.B., Lane, P.R., Park, C.-Y. and S.-J. Wei (eds.), The Dynamics of Asian Financial Integration – Facts and Analytics”, 1-18, Routledge, Abingdon, UK. Dewandaru, G., Masih, R. and Masih, A.M.M., 2015, Why is no financial crisis a dress rehearsal for the next? Exploring contagious heterogeneities across major Asian stock markets, Physica A 419, 241–259 Durlauf, S. N., D. T. Quah (1999), The New Empirics of Economic Growth, in Taylor J. B., M. Woodford (eds.), Handbook of Macroeconomics, vol. 1, chapter 4, 235-308. Ding, D., Peiris, S. J. and Lam, W. R., 2014, Future of Asia’s Finance: How Can it Meet Challenges of Demographic Change and Infrastructure Needs? IMF Working Paper WP/14/126. Feldstein, M., and Horioka, C. (1980). Domestic saving and international capital flows. Economic Journal 90, 314–329. Grilli, V., and Milesi-Ferretti, G.M. (1995). Economic effects and structural determinants of capital controls. IMF Staff Papers, 42, 517–551. Gupta, R., and Guidi, F. (2012), Cointegration relationship and time varying co movements among Indian and Asian developed stock markets, International Review of Financial Analysis 21, 10–22. Hinolajes, M. and C.-Y. Park (2011), “Stock market integration: emerging East Asia’ experience”, in Devereux, M.B., Lane, P.R., Park, C.-Y. and S.-J. Wei (eds.), The Dynamics of Asian Financial Integration – Facts and Analytics”, 174-203, Routledge, Abingdon, UK. Huyghebaert, N. and Wang, L., 2010, The co-movement of stock markets in East Asia Did the 1997–1998 Asian financial crisis really strengthen stock market integration? China Economic Review 21, 98–112. Islam, N. (2003), What have We Learnt from the Convergence Debate?, Journal of Economic Surveys, 17, 3, 309-362. Kim, S., Kim S. H. and C.-Y. Park (2011), International capital mobility of East Asian economies: is domestic investment financed by regional or global saving?, in Devereux, M.B., Lane, P.R., Park, C.-Y. and S.-J. Wei (eds.), The Dynamics of Asian Financial Integration – Facts and Analytics”, 52-76, Routledge, Abingdon, UK. Kim, S. and Lee, J. -W. (2012). Real and financial integration, real and financial integration in east Asia. Review of International Economics 20(2), 332–349.
16

Kim, S, Lee, J. -W. and Park C.- Y., 2011, Emerging Asia: Decoupling or Recoupling, The World Economy 34(1), 23-53. Kumar, M. and Persaud, A., 2002. Pure contagion and investors’ shifting risk appetite: analytical issues and empirical evidence. International Finance 5 (3), 401–436. Lane, P.R. (2011), Regional and global drivers of the portfolio holdings of Asian investors, in Devereux, M.B., Lane, P.R., Park, C.-Y. and S.-J. Wei (eds.), The Dynamics of Asian Financial Integration – Facts and Analytics”, 93-109, Routledge, Abingdon, UK. Leduc, S. and Spiegel, M. M., 2013, Is Asia Decoupling from the United States (Again)? Pacific Economic Review, 18(3), 345–369. Liu, L., 2013. International stock market interdependence: are developing markets the same as developed markets? Journal of International Financial Markets Inst. Money 26, 226–238. Loh, L. 2013, Co-movement of Asia-Pacific with European and US stock market returns: A cross-time-frequency analysis, Research in International Business and Finance 29, 1– 13 Magud, N. and Reinhart, C. (2006). Capital controls: An evaluation. NBER Working Paper, 11973. Narayan S., Sriananthakumar, S. and Islam, S. Z, 2014, Stock market integration of emerging Asian economies: Patterns and causes, Economic Modelling 39, 19–31 Park, C.-Y. (2013), “Asian capital market integration: theory and evidence”, Asian Development Bank Working Paper no. 351, Manila, Philippines. Park, C. -Y. and Lee, J. -W. (2011). Financial integration in emerging Asia: Challenges and prospects. Asian Economic Policy Review 6, 176–198. Phillips, P.C., D. Sul (2007), Transition Modeling and Econometric Convergence Tests, Econometrica, 75, 6, 1771-1855. Rughoo A. and K. You (2016), Asian financial integration: Global or regional? Evidence from money and bond markets, International Review of Financial Analysis 48, 419–434. Sharma, A. and Seth, N., 2012. Literature review of stock market integration: a global perspective. Qualitative Research in Financial Markets 4 (1), 84–122. Tam, P.S., Tam, P.I. (2012), Rethinking stock market integration: Globalization, valuation and convergence, SFB 649 Discussion Paper 2012-052.
17

Wang, L., 2014, Who moves East Asian stock markets? The role of the 2007–2009 global financial crisis, Journal of International Financial Markets, Institutions and Money 28, 182– 203. Wang, Q., Zhu, Y., Yang, L., and Mul, R. A. H., 2017, Coupling detrended fluctuation analysis of Asian stock markets, Physica A 471, 337–350. Wu, L., Meng, Q. and Xu, K., 2015, ‘Slow-burn’ spillover and ‘fast and furious’ contagion: a study of international stock markets, Quantitative Finance 15 (6), 933–958.
18
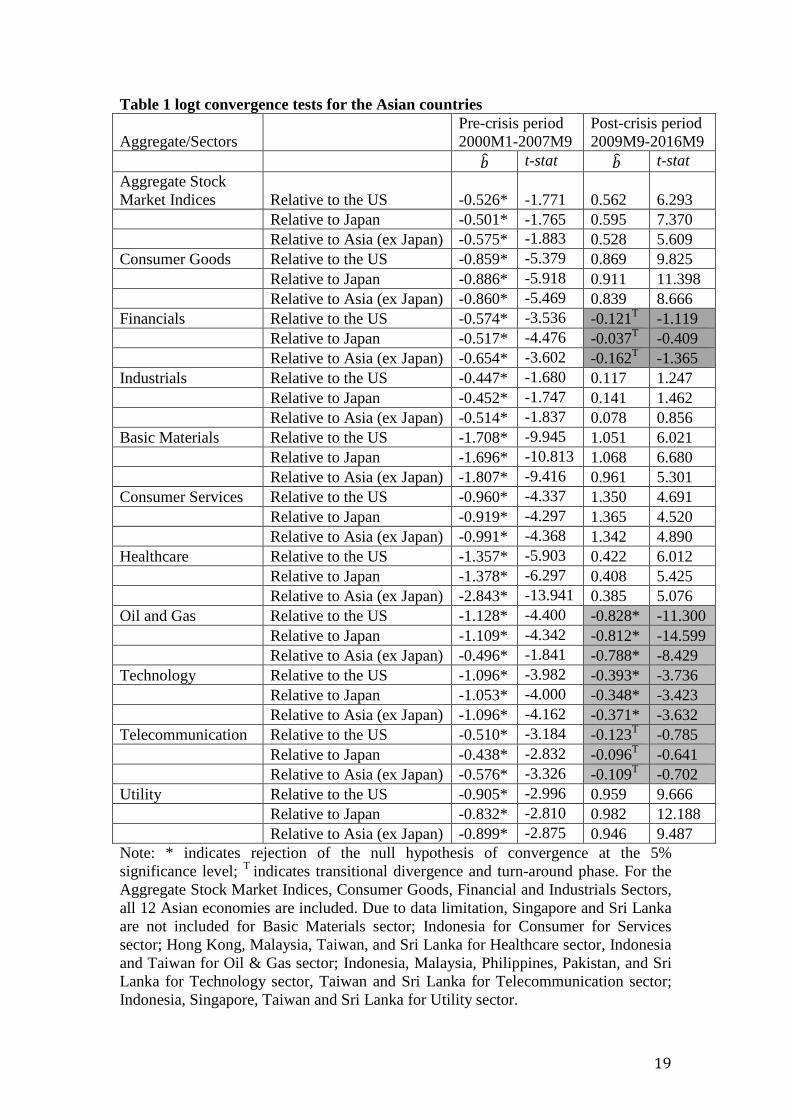
Table 1 logt convergence tests for the Asian countries
Aggregate/Sectors
Pre-crisis period 2000M1-2007M9
Post-crisis period 2009M9-2016M9
𝑏𝑏� t-stat 𝑏𝑏� t-stat Aggregate Stock Market Indices Relative to the US -0.526* -1.771 0.562 6.293
Relative to Japan -0.501* -1.765 0.595 7.370
Relative to Asia (ex Japan) -0.575* -1.883 0.528 5.609
Consumer Goods Relative to the US -0.859* -5.379 0.869 9.825 Relative to Japan -0.886* -5.918 0.911 11.398 Relative to Asia (ex Japan) -0.860* -5.469 0.839 8.666
Financials Relative to the US -0.574* -3.536 -0.121T -1.119 Relative to Japan -0.517* -4.476 -0.037T -0.409 Relative to Asia (ex Japan) -0.654* -3.602 -0.162T -1.365
Industrials Relative to the US -0.447* -1.680 0.117 1.247 Relative to Japan -0.452* -1.747 0.141 1.462 Relative to Asia (ex Japan) -0.514* -1.837 0.078 0.856
Basic Materials Relative to the US -1.708* -9.945 1.051 6.021
Relative to Japan -1.696* -10.813 1.068 6.680
Relative to Asia (ex Japan) -1.807* -9.416 0.961 5.301
Consumer Services Relative to the US -0.960* -4.337 1.350 4.691 Relative to Japan -0.919* -4.297 1.365 4.520 Relative to Asia (ex Japan) -0.991* -4.368 1.342 4.890
Healthcare Relative to the US -1.357* -5.903 0.422 6.012 Relative to Japan -1.378* -6.297 0.408 5.425 Relative to Asia (ex Japan) -2.843* -13.941 0.385 5.076
Oil and Gas Relative to the US -1.128* -4.400 -0.828* -11.300 Relative to Japan -1.109* -4.342 -0.812* -14.599 Relative to Asia (ex Japan) -0.496* -1.841 -0.788* -8.429
Technology Relative to the US -1.096* -3.982 -0.393* -3.736 Relative to Japan -1.053* -4.000 -0.348* -3.423 Relative to Asia (ex Japan) -1.096* -4.162 -0.371* -3.632
Telecommunication Relative to the US -0.510* -3.184 -0.123T -0.785 Relative to Japan -0.438* -2.832 -0.096T -0.641 Relative to Asia (ex Japan) -0.576* -3.326 -0.109T -0.702
Utility Relative to the US -0.905* -2.996 0.959 9.666 Relative to Japan -0.832* -2.810 0.982 12.188 Relative to Asia (ex Japan) -0.899* -2.875 0.946 9.487
Note: * indicates rejection of the null hypothesis of convergence at the 5% significance level; T indicates transitional divergence and turn-around phase. For the Aggregate Stock Market Indices, Consumer Goods, Financial and Industrials Sectors, all 12 Asian economies are included. Due to data limitation, Singapore and Sri Lanka are not included for Basic Materials sector; Indonesia for Consumer for Services sector; Hong Kong, Malaysia, Taiwan, and Sri Lanka for Healthcare sector, Indonesia and Taiwan for Oil & Gas sector; Indonesia, Malaysia, Philippines, Pakistan, and Sri Lanka for Technology sector, Taiwan and Sri Lanka for Telecommunication sector; Indonesia, Singapore, Taiwan and Sri Lanka for Utility sector.
19

Table 2. Club convergence tests for the Oil & Gas and Technology Sectors in post-crisis period (2009M9-2016M9)
Oil & Gas Sector Relative to the US Club 1 China, India, Hong Kong, Malaysia,
Philippine, Thailand, Pakistan, Sri Lanka
𝑏𝑏�: 0.410
t-stat: 6.600
Divergent Singapore, South Korea
𝑏𝑏�: -4.667*
t-stat: -5.545
Relative to Japan Club 1 China, India, Hong Kong, Malaysia, Philippine, Thailand, South Korea, Pakistan, Sri Lanka
𝑏𝑏�: 0.005
t-stat: 0.009
Divergent Singapore
Relative to Asia (ex Japan) Club 1 China, India, Hong Kong, Malaysia, Philippine, Thailand, South Korea, Pakistan, Sri Lanka
𝑏𝑏�: 0.009
t-stat: 0.150
Divergent Singapore
Technology Sector Relative to the US Club 1 Hong Kong, Taiwan
𝑏𝑏�: 0.364
t-stat: 1.868
Club 2 China, India, Singapore, Thailand, South
Korea
𝑏𝑏�: 0.529
t-stat: 2.373
Relative to Japan Club 1 Hong Kong, Taiwan
𝑏𝑏�: 0.407
t-stat: 2.026
Club 2 China, India, Singapore, Thailand, South
Korea
𝑏𝑏�: 0.575
t-stat: 2.675
Relative to Asia (ex Japan) Club 1 Hong Kong, Taiwan
𝑏𝑏�: 0.377
t-stat: 1.876
Club 2 China, India, Singapore, Thailand, South
Korea
𝑏𝑏�: 0.553
t-stat: 2.512
Note: * indicates rejection of the null hypothesis of convergence at the 5% significance level.
20

Table 3. Club convergence tests for Aggregate Stock Market Indices in the pre-crisis period (2000M1-2007M9)
Aggregate Stock Market Indices Relative to the US Club 1 India, Hong Kong, Indonesia, Malaysia,
Philippine, Singapore, South Korea, Taiwan, Pakistan, Sri Lanka
𝑏𝑏�: 0.785
t-stat: 3.492
Club 2 China, Thailand
𝑏𝑏�: -0.903T
t-stat: -0.547
Relative to the Japan Club 1 India, Hong Kong, Indonesia, Malaysia, Philippine, Singapore, South Korea, Taiwan, Pakistan, Sri Lanka
𝑏𝑏�: 0.811
t-stat: 3.970
Club 2 China, Thailand
𝑏𝑏�: -0.882 T
t-stat: -0.546
Relative to Asia (ex Japan) Club 1 India, Hong Kong, Indonesia, Malaysia, Philippine, Singapore, South Korea, Taiwan, Pakistan, Sri Lanka
𝑏𝑏�: 0.734
t-stat: 3.095
Club 2 China, Thailand
𝑏𝑏�: -0.953T
t-stat: -0.589
1. Financials Sector Relative to the US Club 1 China, India, Indonesia, Philippine,
Pakistan
𝑏𝑏�: 0.623
t-stat: 5.449
Club 2 Hong Kong, Singapore, Sri Lanka
𝑏𝑏�: 1.531
t-stat: 2.959
Club 3 Malaysia, South Korea
𝑏𝑏�: -2.569 T
t-stat -0.906
Club 4 Thailand, Taiwan
𝑏𝑏�: 0.222
t-stat: 9.218
Relative to Japan Club 1 China, India, Indonesia, Philippine, South Korea, Pakistan
𝑏𝑏�: 0.394
t-stat: 3.947
Club 2 Hong Kong, Malaysia, Singapore, Thailand,
Taiwan, Sri Lanka
𝑏𝑏�: 0.232
t-stat: 1.576
Relative to Asia (ex Japan) Club 1 China, India, Indonesia, Philippine, South Korea, Pakistan
𝑏𝑏�: 0.260
t-stat: 1.980
Club 2 Hong Kong, Malaysia, Singapore, Thailand,
Taiwan, Sri Lanka
𝑏𝑏�: 0.090
t-stat: 0.542
2. Industrial Sector
21

Relative to the US Club 1 China, India, Hong Kong, Indonesia, Philippine, Singapore, South Korea, Taiwan, Pakistan, Sri Lanka
𝑏𝑏�: -0.215 T
t-stat: -0.824
Club 2 Malaysia, Thailand
𝑏𝑏�: 1.804
t-stat: 4.565
Relative to the Japan Club 1 China, India, Hong Kong, Indonesia, Philippine, Singapore, South Korea, Taiwan, Pakistan, Sri Lanka
𝑏𝑏�: -0.220 T
t-stat: -0.864
Club 2 Malaysia, Thailand
𝑏𝑏�: 1.798
t-stat: 4.497
Relative to Asia (ex Japan) Club 1 China, India, Hong Kong, Indonesia, Philippine, Singapore, South Korea, Taiwan, Pakistan, Sri Lanka
𝑏𝑏�: -0.282 T
t-stat: -1.024
Club 2 Malaysia, Thailand
𝑏𝑏�: 1.730
t-stat: 4.444
3. Consumer Goods Sector Relative to the US Club 1 China, Malaysia, Pakistan
𝑏𝑏�: 0.189
t-stat: 1.032
Club 2 India, Hong Kong, Indonesia, Singapore,
Taiwan, South Korea, Sri Lanka
𝑏𝑏�: -0.098T
t-stat: -0.913
Club 3 Philippine, Thailand 𝑏𝑏�: 2.872 t-stat: 1.621 Relative to Japan Club 1 China, Malaysia, Pakistan
𝑏𝑏�: 0.181
t-stat: 1.062
Club 2 India, Hong Kong, Indonesia, Singapore,
Taiwan, South Korea, Sri Lanka
𝑏𝑏�: -0.108T
t-stat: -0.902
Club 3 Philippine, Thailand 𝑏𝑏�: 2.864 t-stat: 1.655 Relative to Asia (ex Japan) Club 1 China, Malaysia, Pakistan
𝑏𝑏�: 0.191
t-stat: 1.061
Club 2 India, Hong Kong, Indonesia, Singapore,
Taiwan, South Korea, Sri Lanka
𝑏𝑏�: -0.102T
t-stat: -0.924
Club 3 Philippine, Thailand 𝑏𝑏�: 2.836
22

t-stat: 1.560 4. Consumer Services Sector
Relative to the US Club 1 India, Hong Kong, Malaysia, Philippine, Singapore, Thailand, South Korea, Pakistan, Sri Lanka
𝑏𝑏�: 0.785
t-stat: 3.492
Divergent China, Taiwan
𝑏𝑏�: -4.803
t-stat: -6.053*
Relative to Japan Club 1 India, Hong Kong, Malaysia, Philippine, Singapore, Thailand, South Korea, Pakistan, Sri Lanka
𝑏𝑏�: 0.415
t-stat: 1.842
Divergent China, Taiwan
𝑏𝑏�: -4.770
t-stat: -5.859*
Relative to Asia (ex Japan) Club 1 India, Hong Kong, Malaysia, Philippine, Singapore, Thailand, South Korea, Pakistan, Sri Lanka
𝑏𝑏�: 0.851
t-stat: 3.093
Divergent China, Taiwan
𝑏𝑏�: -1.665
t-stat: -4.006*
5. Oil & Gas Sector Relative to the US Club 1 China, Hong Kong, Thailand, South Korea
𝑏𝑏�: -0.009 T
t-stat: -0.070
Club 2 India, Malaysia, Philippine, Singapore
𝑏𝑏�: 0.542
t-stat: 4.220
Club 3 Pakistan, Sri Lanka 𝑏𝑏�: -2.090 T t-stat: -1.075 Relative to Japan Club 1 China, Hong Kong, Thailand, South Korea
𝑏𝑏�: 0.010
t-stat: 0.083
Club 2 India, Malaysia, Philippine, Singapore
𝑏𝑏�: 0.561
t-stat: 4.380
Club 3 Pakistan, Sri Lanka 𝑏𝑏�: -2.071 T t-stat: -1.055 Relative to Asia (ex Japan) Club 1 China, Hong Kong, Thailand, South Korea
𝑏𝑏�: 1.125
t-stat: 9.006
Club 2 India, Malaysia, Philippine, Singapore
𝑏𝑏�: 0.609
t-stat: 4.672
23

Club 3 Pakistan, Sri Lanka 𝑏𝑏�: -2.028 T t-stat: -1.046
6. Basic Materials Sector Relative to the US Club 1 China, Indonesia, South Korea
𝑏𝑏�: 0.443
t-stat: 3.589
Club 2 India, Hong Kong, Philippine
𝑏𝑏�: 0.774
t-stat: 5.158
Club 3 Malaysia, Thailand, Taiwan, Pakistan 𝑏𝑏�: 0.603 t-stat: 7.056 Relative to Japan Club 1 China, Indonesia, South Korea
𝑏𝑏�: 0.453
t-stat: 3.788
Club 2 India, Hong Kong, Philippine
𝑏𝑏�: 0.785
t-stat: 5.318
Club 3 Malaysia, Thailand, Taiwan, Pakistan 𝑏𝑏�: 0.617 t-stat: 8.900 Relative to Asia (ex Japan) Club 1 China, Indonesia, South Korea
𝑏𝑏�: 0.352
t-stat: 2.746
Club 2 India, Hong Kong, Philippine
𝑏𝑏�: 0.677
t-stat: 4.410
Club 3 Malaysia, Thailand, Taiwan, Pakistan 𝑏𝑏�: 0.497 t-stat: 4.560
7. Telecommunication Sector Relative to the US Club 1 China, India, Hong Kong, Indonesia,
Philippine, Singapore, Pakistan
𝑏𝑏�: 0.067
t-stat: 0.423
Club 2 Malaysia, Thailand, South Korea
𝑏𝑏�: 1.273
t-stat: 9.754
Relative to Japan Club 1 China, India, Hong Kong, Indonesia, Philippine, Singapore, Pakistan
𝑏𝑏�: 0.138
t-stat: 0.897
Club 2 Malaysia, Thailand, South Korea
𝑏𝑏�: 1.350
t-stat: 10.323
Relative to Asia (ex Japan) Club 1 China, India, Hong Kong, Indonesia, Philippine
𝑏𝑏�: 0.557
t-stat: 4.316
24

Club 2 Malaysia, Singapore, Thailand, South
Korea, Pakistan
𝑏𝑏�: 0.929
t-stat: 8.833
8. Healthcare Sector Relative to the US Club 1 Singapore, Thailand, South Korea, Pakistan
𝑏𝑏�: 2.128
t-stat: 4.803
Club 2 China, Indonesia
𝑏𝑏�: -0.455 T
t-stat: -0.710
Divergent India, Philippine 𝑏𝑏�: -4.700 t-stat: -5.001* Relative to Japan Club 1 Singapore, Thailand, South Korea, Pakistan
𝑏𝑏�: 2.108
t-stat: 4.820
Club 2 China, Indonesia
𝑏𝑏�: -0.478 T
t-stat: -0.737
Divergent India, Philippine 𝑏𝑏�: -4.710 t-stat: -4.977* Relative to Asia (ex Japan) Club 1 Singapore, Thailand, South Korea, Pakistan
𝑏𝑏�: 2.132
t-stat: 4.772
Club 2 China, Indonesia
𝑏𝑏�: -0.447 T
t-stat: -0.688
Divergent India, Philippine 𝑏𝑏�: -4.692 t-stat: -4.948*
9. Utility Sector Relative to the US Club 1 China, India, Philippine
𝑏𝑏�: 0.520
t-stat: 3.271
Club 2 Hong Kong, Malaysia, Thailand, South
Korea, Pakistan
𝑏𝑏�: 1.393
t-stat: 3.598
Relative to Japan Club 1 China, India, Philippine
𝑏𝑏�: 0.592
t-stat: 1.464
Club 2 Hong Kong, Malaysia, Thailand, South
Korea, Pakistan
𝑏𝑏�: 1.393
t-stat: 3.598
Relative to Asia (ex Japan) Club 1 China, India, Philippine
𝑏𝑏�: 0.530
25

t-stat: 3.295
Club 2 Hong Kong, Malaysia, Thailand, South
Korea, Pakistan
𝑏𝑏�: 1.395
t-stat: 3.513
10. Technology Sector Relative to the US Club 1 India, Hong Kong, Singapore, Thailand,
Taiwan, South Korea
𝑏𝑏�: -0.066 T
t-stat: -0.939
Divergent China
Relative to Japan Club 1 India, Hong Kong, Singapore, Thailand, Taiwan, South Korea
𝑏𝑏�: -0.033 T
t-stat: -0.684
Divergent China
Relative to Asia (ex Japan) Club 1 India, Hong Kong, Singapore, Thailand, Taiwan, South Korea
𝑏𝑏�: -0.065 T
t-stat: -1.198
Divergent China
Note: * indicates rejection of the null hypothesis of convergence at the 5% significance level; T indicates transitional divergence and turn around phase.
26

Figure 1. Relative Transition Parameters for the Oil & Gas Sector in the post-crisis period 2009M9-2016M9: Return differentials vis-à-vis the US
Figure 2. Relative Transition Parameters for the Oil & Gas Sector in the post-crisis period 2009M9-2016M9: Return differentials vis-à-vis Japan
0,90
0,95
1,00
1,05
1,1020
09M
0920
09M
1220
10M
0320
10M
0620
10M
0920
10M
1220
11M
0320
11M
0620
11M
0920
11M
1220
12M
0320
12M
0620
12M
0920
12M
1220
13M
0320
13M
0620
13M
0920
13M
1220
14M
0320
14M
0620
14M
0920
14M
1220
15M
0320
15M
0620
15M
0920
15M
1220
16M
0320
16M
0620
16M
09
China India Hong Kong Malaysia PhilippineSingapore Thailand South Korea Pakistan Sri Lanka
0,90
0,95
1,00
1,05
1,10
2009
M09
2009
M12
2010
M03
2010
M06
2010
M09
2010
M12
2011
M03
2011
M06
2011
M09
2011
M12
2012
M03
2012
M06
2012
M09
2012
M12
2013
M03
2013
M06
2013
M09
2013
M12
2014
M03
2014
M06
2014
M09
2014
M12
2015
M03
2015
M06
2015
M09
2015
M12
2016
M03
2016
M06
2016
M09
China India Hong Kong Malaysia PhilippineSingapore Thailand South Korea Pakistan Sri Lanka
27

Figure 3. Relative Transition Parameters for the Oil & Gas Sector in the post-crisis period 2009M9-2016M9: Return differentials vis-à-vis Asia (excluding Japan)
Figure 4. Relative Transition Parameters for the Technology Sector in the post-crisis period 2009M9-2016M9: Return differentials vis-à-vis the US
0,90
0,95
1,00
1,05
1,10
2009
M09
2009
M12
2010
M03
2010
M06
2010
M09
2010
M12
2011
M03
2011
M06
2011
M09
2011
M12
2012
M03
2012
M06
2012
M09
2012
M12
2013
M03
2013
M06
2013
M09
2013
M12
2014
M03
2014
M06
2014
M09
2014
M12
2015
M03
2015
M06
2015
M09
2015
M12
2016
M03
2016
M06
2016
M09
China India Hong Kong Malaysia PhilippineSingapore Thailand South Korea Pakistan Sri Lanka
0,90
0,95
1,00
1,05
1,10
2009
M09
2009
M12
2010
M03
2010
M06
2010
M09
2010
M12
2011
M03
2011
M06
2011
M09
2011
M12
2012
M03
2012
M06
2012
M09
2012
M12
2013
M03
2013
M06
2013
M09
2013
M12
2014
M03
2014
M06
2014
M09
2014
M12
2015
M03
2015
M06
2015
M09
2015
M12
2016
M03
2016
M06
2016
M09
China India Hong Kong Singapore Thailand Taiwan South Korea
28

Figure 5. Relative Transition Parameters for the Technology Sector in the post-crisis period 2009M9-2016M9: Return differentials vis-à-vis Japan
Figure 6. Relative Transition Parameters for the Technology Sector in the post-crisis period 2009M9-2016M9: Return differentials vis-à-vis Asia (excluding Japan)
0,90
0,95
1,00
1,05
1,10
2009
M09
2009
M12
2010
M03
2010
M06
2010
M09
2010
M12
2011
M03
2011
M06
2011
M09
2011
M12
2012
M03
2012
M06
2012
M09
2012
M12
2013
M03
2013
M06
2013
M09
2013
M12
2014
M03
2014
M06
2014
M09
2014
M12
2015
M03
2015
M06
2015
M09
2015
M12
2016
M03
2016
M06
2016
M09
China India Hong Kong Singapore Thailand Taiwan South Korea
29