Embed Size (px)
Citation preview

Your Suggestions
Sample problems and examples in lecture.Download recitation problems before recitation.Complete exercises in recitations.Reorganize web site.Have power point slides available earlier.Overview class at the beginning.

Your Suggestions
Board/slides.
Too fast/too slow.
Book does not have enough examples.

Market Demand
From individual to market demand.
Price elasticity of demand.
Income elasticity of demand.
An example: the Laffer curve.
From Individual to Market demand
Individual ‘s demand function for good 1:
Aggregate demand (market demand) function for good 1:
iii mppxx ,, 2111
n
i
iin mppxmmmppX1
2112,1211 ,,,...,,,
i

Market Demand: Example
Consider 2 consumers of CDs:
Each consumer has the demand function:
Consumers have different incomes:
pmx ii
100$1 m
2,1i
200$2 m
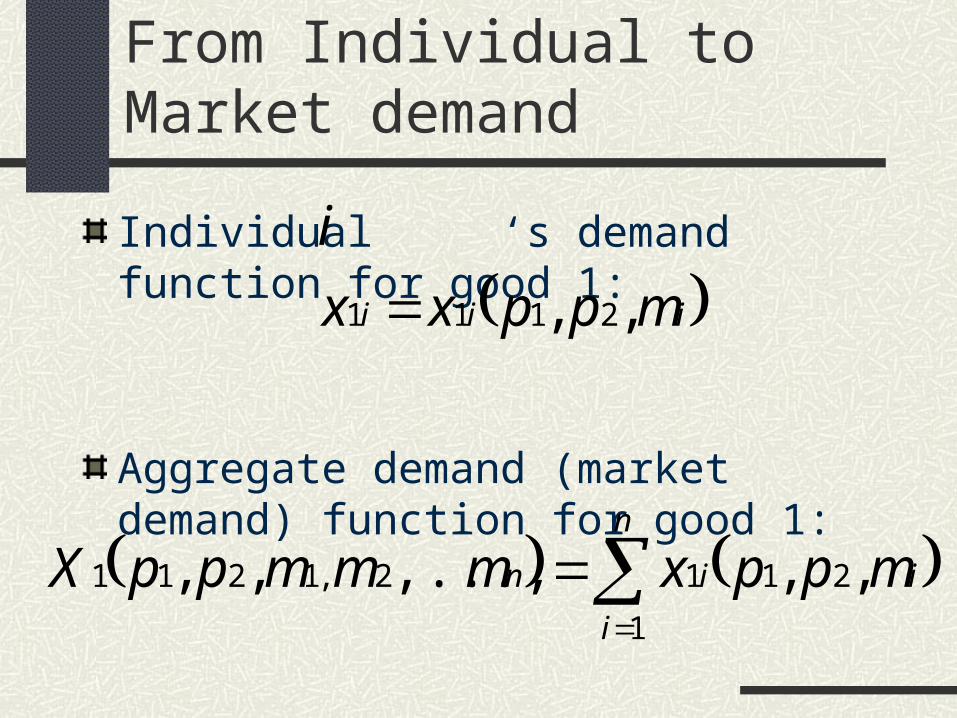
Market Demand: Example
Individual demand functions:
Market demand:
for
for
px 100$1
pX 2300$
px 200$2
100$p
pX 200$ 200$100$ p

Inverse Market Demand: Example
Market demand: for
for
Inverse demand: for
for
pX 2300$ 100$p
pX 200$ 200$100$ p
2/150$ Xp 100$p
Xp 200$ 200$100$ p

Market Demand Curve
Individual demand curves:
Market demand curve:
ix
pp
X
100
200
100 20000
200
100
300100
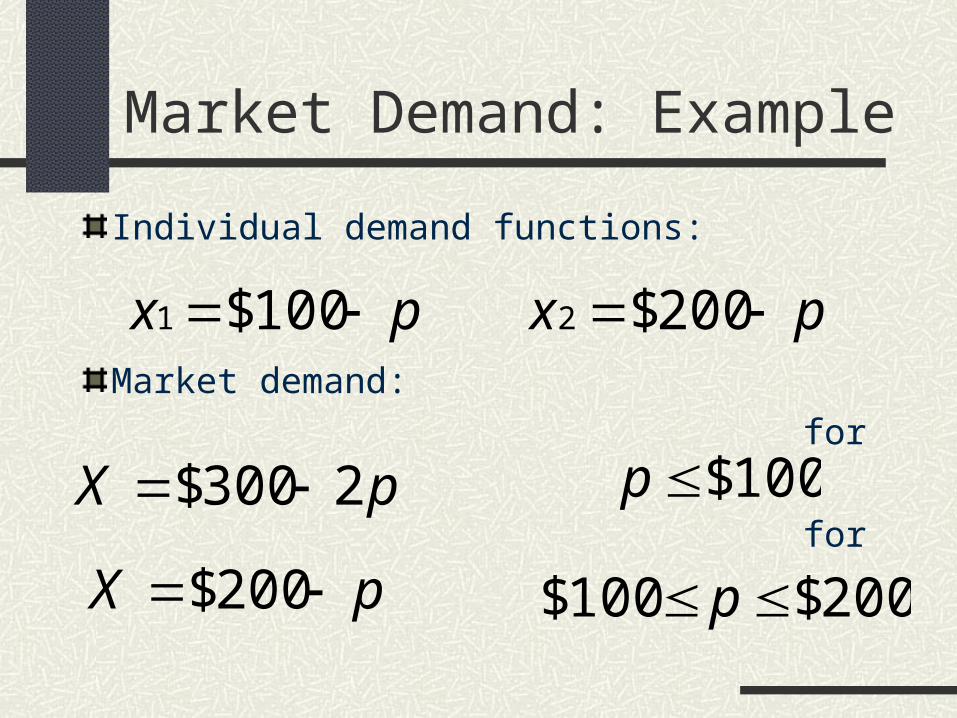
Aggregation
Q:Is the sum of our demands (aggregate demand) for a good always equal to the demand of one individual whose income is given by the sum of our incomes?
In other words is aggregate demand equal to the demand of some representative consumer who has income equal to the sum of all individual incomes?

Aggregation
A: No, for two reasons:
1. Individuals have different preferences
2. Even if individuals had the same preferences, some goods are necessary goods, and others are luxury goods.
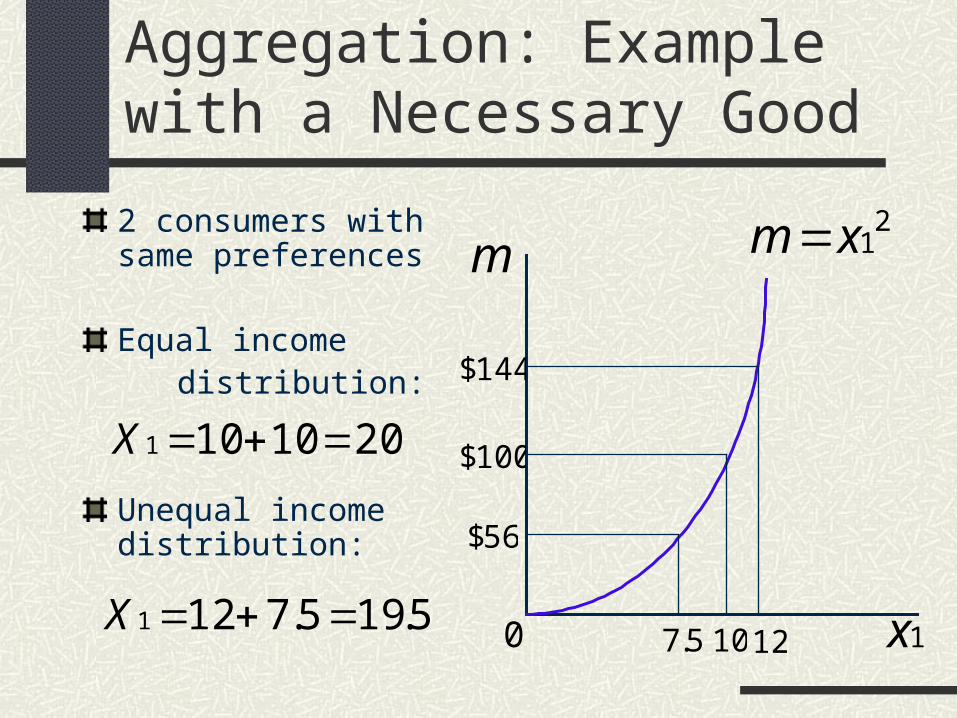
Aggregation: Example with a Necessary Good
1x0
2 consumers with same preferences
Equal income distribution:
Unequal income distribution:
21xmm
100$
10
2010101 X
144$
56$
125.75.195.7121 X

Elasticity
Looking for a measure of how “responsive” individual and aggregate demands are to changes in price and income.This measure is important to determine effects of taxes on prices.

One Candidate
One candidate measure of how “responsive” demand is to price changes is the slope of the demand function (at a given point):
1
2,1211 ,...,,,
p
mmmppX n
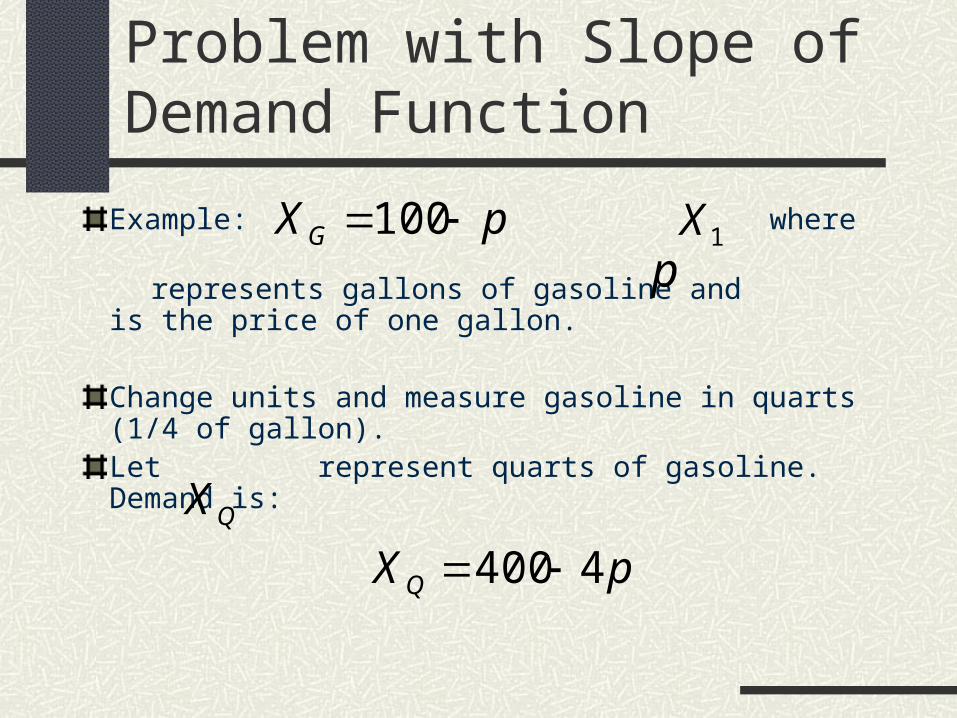
Problem with Slope of Demand Function
Example: where represents gallons of gasoline and is the price of
one gallon.
Change units and measure gasoline in quarts (1/4 of gallon). Let represent quarts of gasoline. Demand is:
pXG 100 1Xp
QX
pXQ 4400
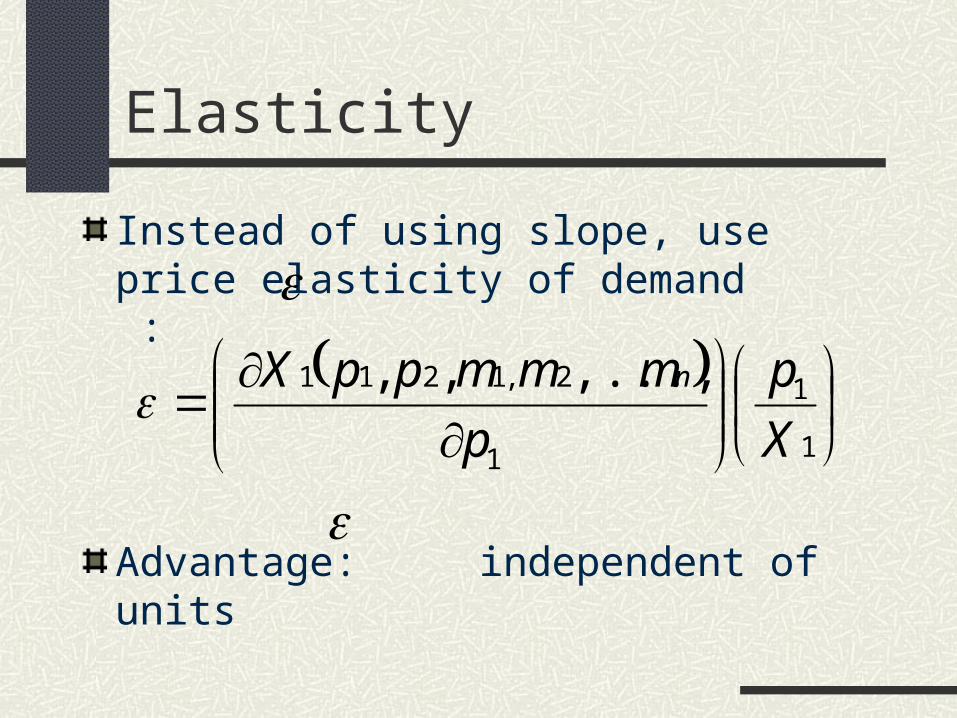
Elasticity
Instead of using slope, use price elasticity of demand :
Advantage: independent of units
1
1
1
2,1211 ,...,,,
X
p
p
mmmppX n

Example Cont’d
Demand for gasoline:
Elasticity:
Demand for gasoline:
Elasticity:
pXG 100
p
p
X
p
G
1001
pXQ 4400
p
p
p
p
X
p
Q
1004400
44

Properties of Elasticity
Elasticity changes with demand:
p
p
100
p
X
100
1000
50
50
1
0

Properties of Elasticity
A demand function is elastic if:
A demand function is inelastic if:
A demand function is unit elastic if:
1
1
1

Example: Cobb-Douglas
Demand function:
Slope:
Elasticity:
p
mcx
2p
mc
p
x
12
2
cm
p
p
mc
x
p
p
x

Income Elasticity of Demand
Describes how responsive demand is to changes in individual or aggregate income.
Defined similarly to price elasticity:
1
211 ,,
x
m
m
mppx
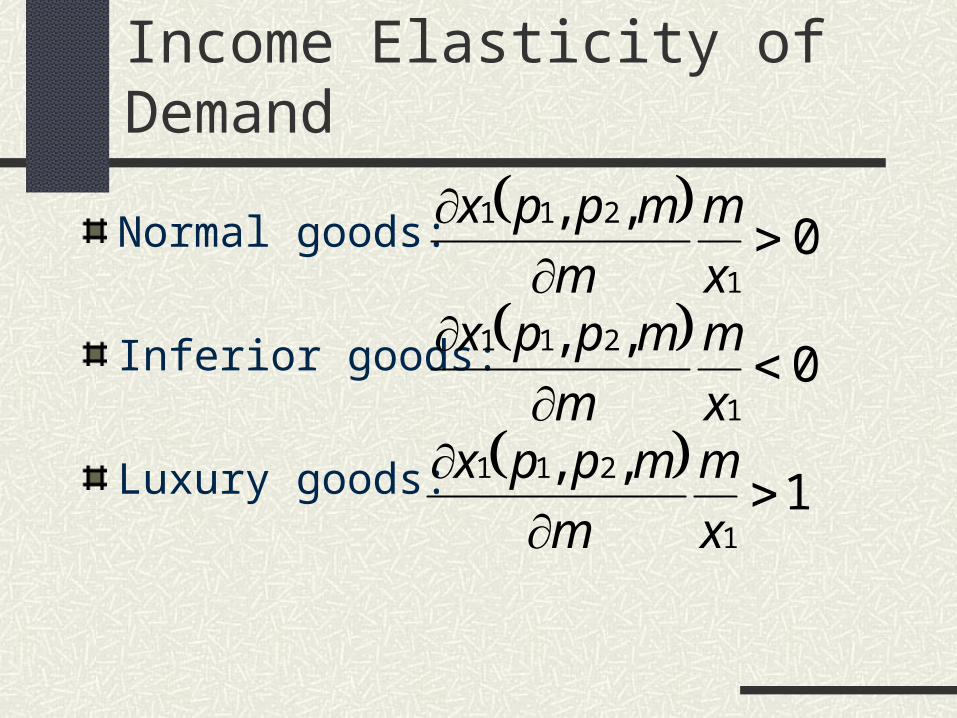
Income Elasticity of Demand
Normal goods:
Inferior goods:
Luxury goods:
0
,,
1
211
x
m
m
mppx
0
,,
1
211
x
m
m
mppx
1
,,
1
211
x
m
m
mppx

The Laffer Curve
How do government tax revenue change when the tax rate changes?

The Laffer Curve
If : zero revenues.
If : zero revenues.
There exists a tax rate that maximizes revenues.
0 1
Tax .R
t
0t
1t
*t
*t
The Laffer Curve
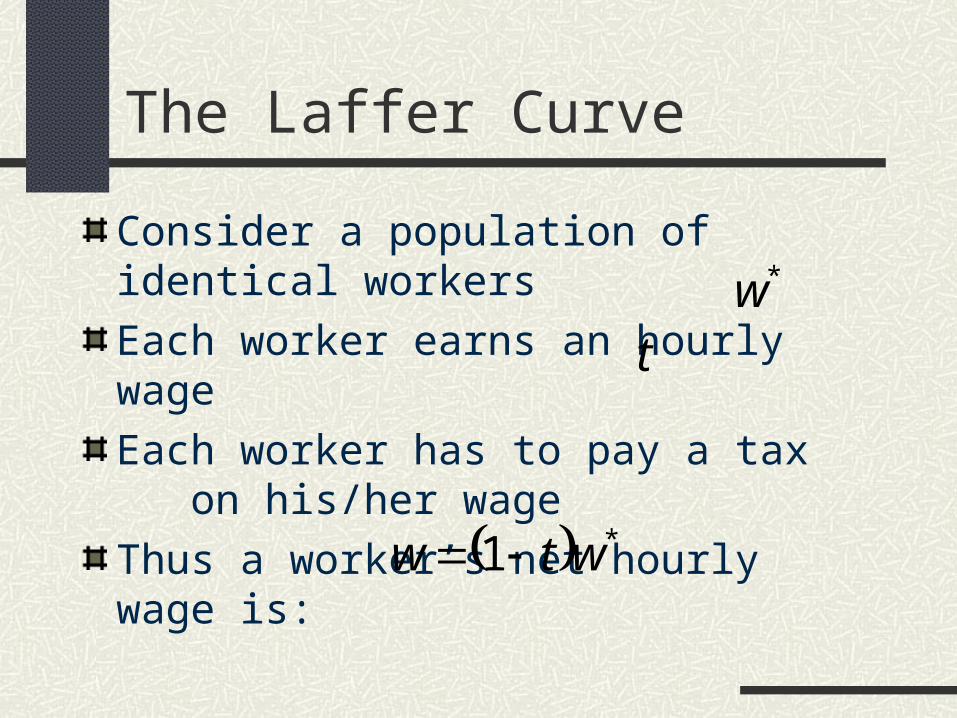
Consider a population of identical workers
Each worker earns an hourly wage
Each worker has to pay a tax on his/her wage
Thus a worker’s net hourly wage is:
*wt
*1 wtw
The Laffer Curve
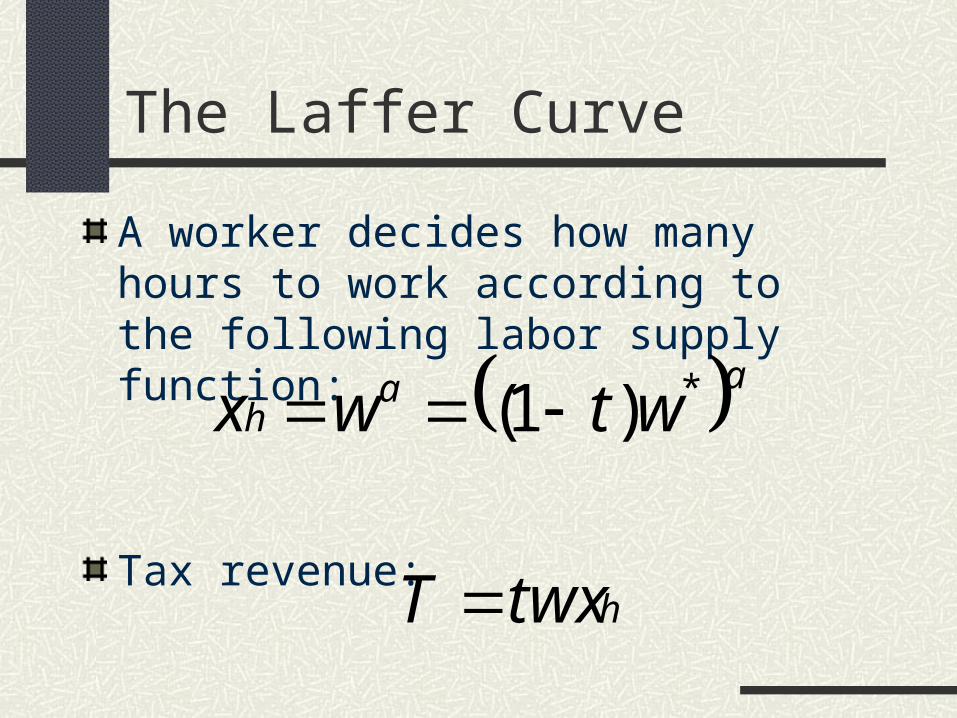
A worker decides how many hours to work according to the following labor supply function:
Tax revenue:
aah wtwx *)1(
htwxT
The Laffer Curve
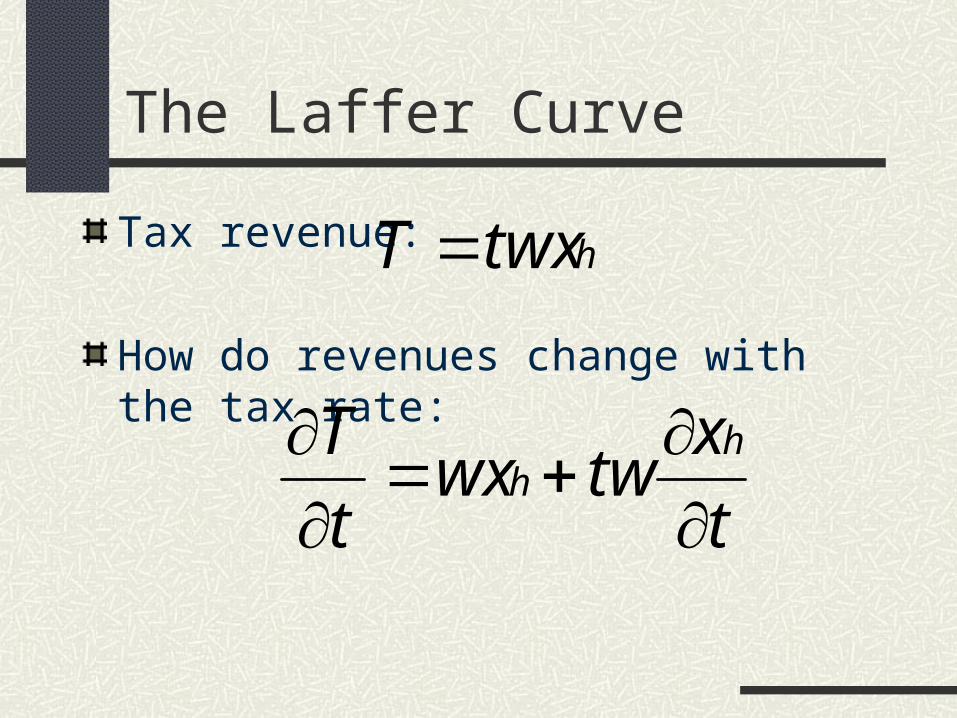
Tax revenue:
How do revenues change with the tax rate:
htwxT
t
xtwwx
t
T hh
The Laffer Curve
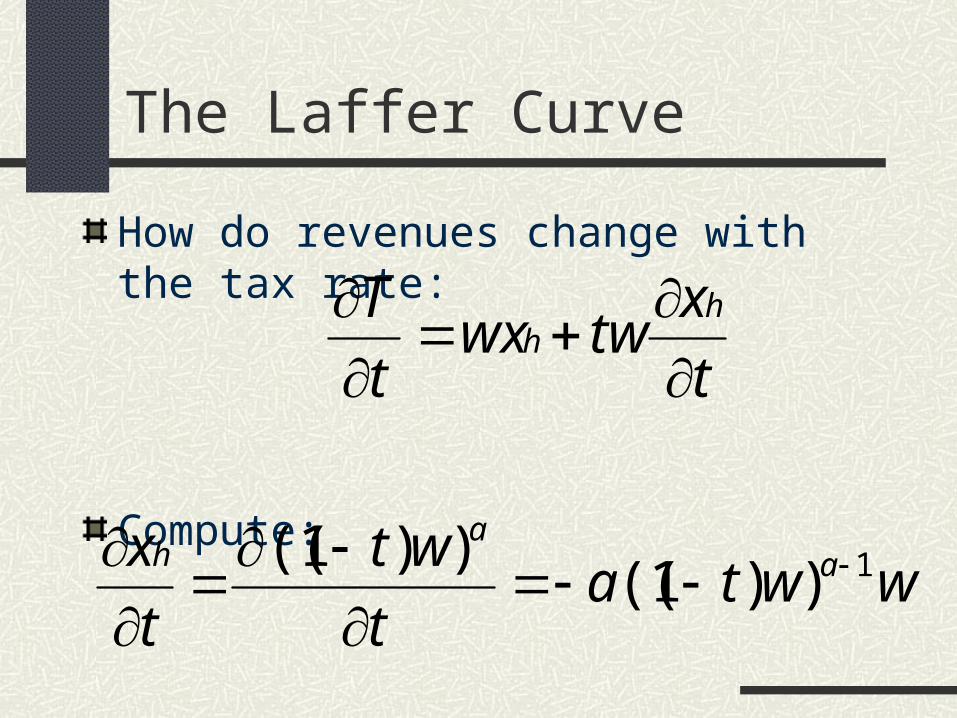
How do revenues change with the tax rate:
Compute:
t
xtwwx
t
T hh
wwtat
wt
t
x aa
h 1))1(())1((

The Laffer Curve
Compare
with
so that
wwtat
x ah 1))1((
twtaw
x ah
1))1(( 1
tw
w
x
t
x hh
1

The Laffer Curve
We know that:
Then:
tw
w
xtwwx
t
xtwwx
t
T hh
hh
1
tw
w
x
t
x hh
1
The Laffer Curve
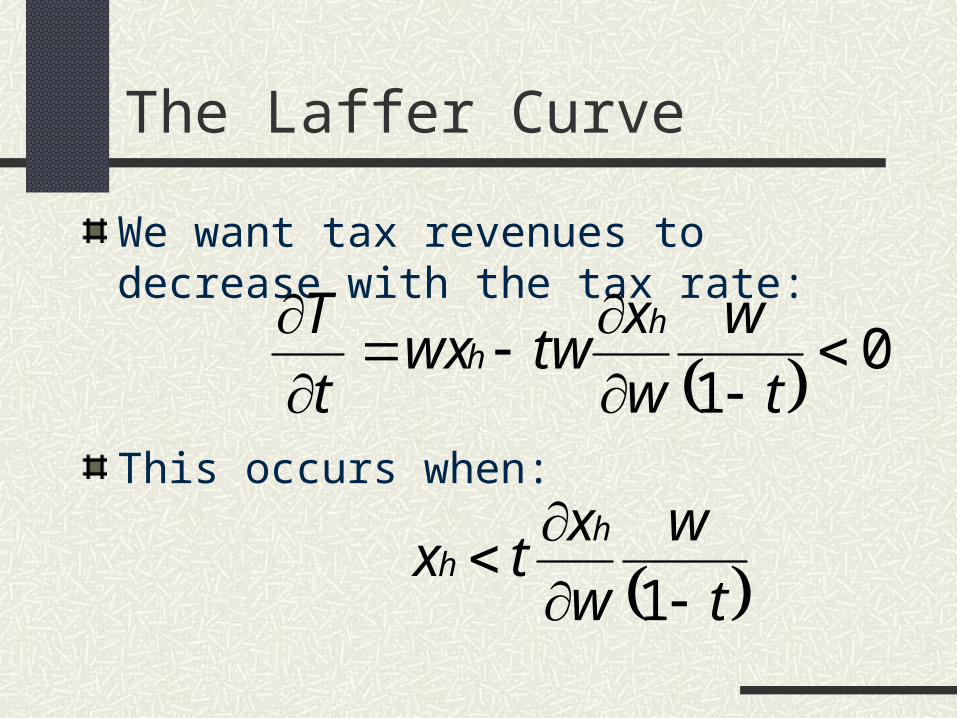
We want tax revenues to decrease with the tax rate:
This occurs when:
01
t
w
w
xtwwx
t
T hh
tw
w
xtx
hh
1

The Laffer Curve
This occurs when:
Rearrange:
tw
w
xtx
hh
1
t
t
x
w
w
x
h
h
1
The Laffer Curve
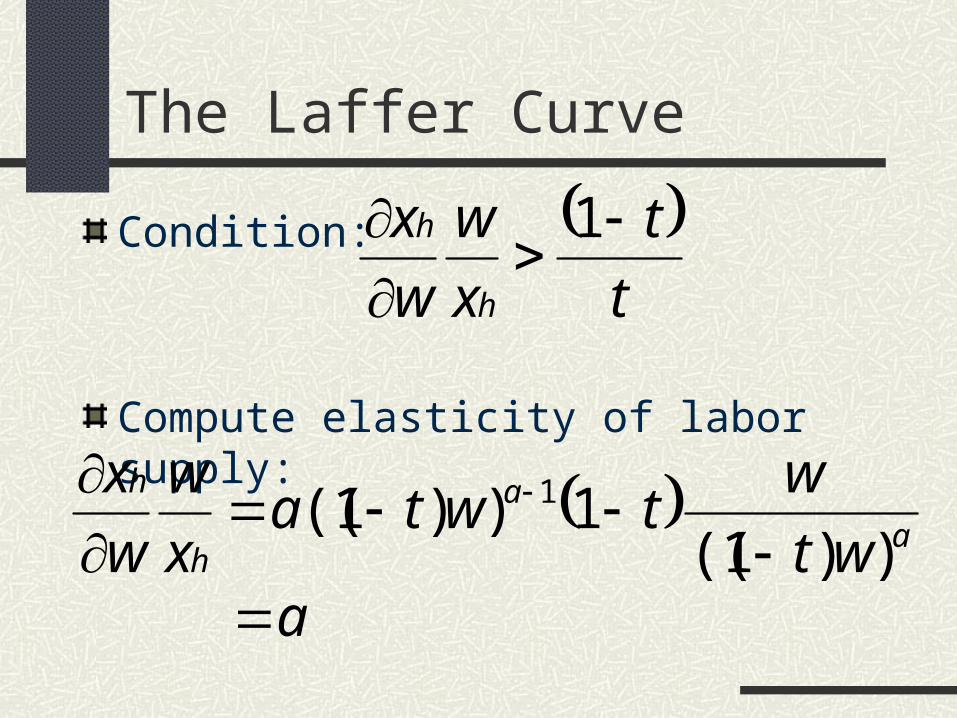
Condition:
Compute elasticity of labor supply:
t
t
x
w
w
x
h
h
1
a
a
h
h
wt
wtwta
x
w
w
x
))1((1))1(( 1
a

The Laffer Curve
Thus we have that tax revenues increase when government reduces tax rate if:
Elasticity of labor supply estimated to be at most 0.2Tax rate on labor income is at most 0.5
t
ta
1
The Laffer Curve
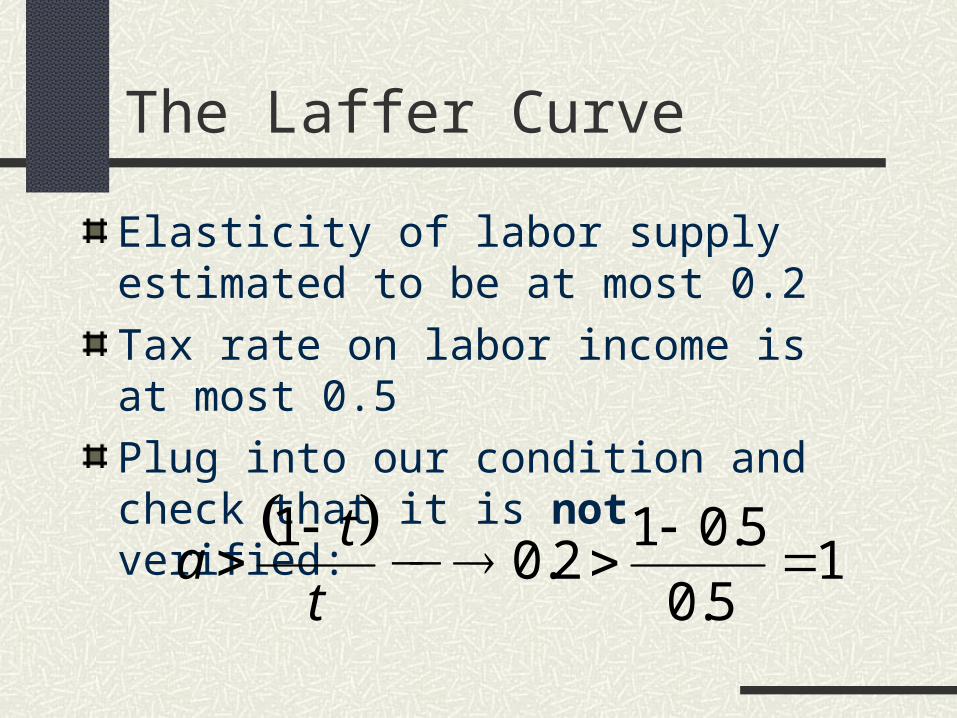
Elasticity of labor supply estimated to be at most 0.2
Tax rate on labor income is at most 0.5
Plug into our condition and check that it is not verified:
1
5.0
5.012.0
1
t
ta