Embed Size (px)
Citation preview

Dear Parents and Students,
We hope you will enjoy this Math Challenge packet and work hard to complete all problems on
your own or with help from a parent or guardian. All projects in this packet are based upon the
Connecticut Core Standards for Math (formally known as Common Core State Standards). To
learn more about these standards, please visit:
www.corestandards.org
We suggest doing two to three projects each week. Once you have finished a project, try to find
a way to discuss it with a friend, parent, or relative. Think about how the skills and concepts in
the problem you have completed are connected to other things in your home, environment, or
daily routine. Find ways to apply your new understanding to real world situations.
Math is all about problem-solving. One of the best ways to learn Math is to try out problems in
which you have to develop your own strategy in order to find the solution. There is usually more
than one way to solve Math problems. While working on the problems in this packet, you may
discover shortcuts and use your own process or set of rules to calculate and determine the
appropriate solution. Make sure to keep notes and include your work so that you can explain
your solutions. In other works, be sure you can answer the question “How do you know?”
Explaining your solution to a problem immediately tells others what you’re learning.
Have a wonderful summer!
Sincerely,
Sheila M. Civale
STEM Coordinator
Greenwich Public Schools
Adapted with permission from
Chartier Valley School District

E n t e r i n g P r e - A l g e b r a
Page 2
Project #1 Domain: Ratios and Proportional Relationships (RP) Learning Targets: I can explain the relationship that a ratio represents. I can describe the ratio relationship represented by a unit rate. I can solve real-world problems involving proportional reasoning by using various diagrams. Directions: Solve the following problem. Show all steps you take to find your solution. The ratio of the number of boys to the number of girls at school is 4:5.
1. What fraction of the students are boys?
2. If there are 120 boys, how many students are there altogether?

E n t e r i n g P r e - A l g e b r a
Page 3
Project #2 Domain: Ratios and Proportional Relationships (RP) Learning Targets: I can explain the relationship that a ratio represents. I can describe the ratio relationship represented by a unit rate. I can solve real-world problems involving proportional reasoning by using various diagrams. Directions: Find five examples of ratios in the real world. Write them down and
describe the situation in which they are found. *Remember, ratios are comparisons of two quantities which can be written in the following ways:
1) a to b
2) ab
3) a:b
Example: At the grocery store, Amanda noticed that there were three times as
many carts as there were baskets for shoppers to use to carry their food. The ratio of carts to baskets (c : b) is 3 to 1.
1. 2. 3. 4. 5. Create a problem using ratios for your parents/guardians or friends to solve. Write both your problem and solution below.

E n t e r i n g P r e - A l g e b r a
Page 4
Project #3 Domain: The Number System (NS) Learning Targets: I can find all factors of any given number, less than or equal to 100. I can find the greatest common factor of any two numbers, less than or equal to 100. I can find the least common multiple of any two numbers, less than or equal to 12. Directions: Read the problem below.
*Use the hints to help if needed to solve the riddle.
I’m thinking of two numbers. Their greatest common factor is 6. Their least common multiple is 36. One of the numbers is 12. What is the other number? Hints:
1) What are the factors of 12? 2) Can the other number be 3? Why or why not? The number cannot be 3 because the
greatest common factor of both of the numbers is 6. (3 cannot have a factor). 3) Can the other number be 6? Why or why not?
Show your work! Create two riddles like this one to challenge your friends or parents/guardians. One of the two should include a negative integer or fraction. Create 2-3 hints for each to help in case your problem solvers need some assistance.

E n t e r i n g P r e - A l g e b r a
Page 5
Project #4 Domain: The Number System (NS) Learning Targets: I can fluently add, subtract, multiply and divide multi-digit decimals and fractions using the standard algorithm. Directions: Complete the problems below. Chef Julius Grayson had an empanada recipe that called for 3 4� lb onions and 1 1 3� lbs of pork. He was preparing the recipe for a special event and needed to quadruple it to make enough for all of his guests. How many pounds of onions and pounds of pork would he need for the recipe? Show all of your work. Create a problem about the estimated cost of ingredients for the large event recipe if onions cost $2.99/lb and pork costs $5.49/lb. Include both an estimated solution and a true solution to check to see that your estimation is reasonable.

E n t e r i n g P r e - A l g e b r a
Page 6
Project #5 Domain: The Number System (NS) Learning Targets: I can show and explain why every rational number can be represented by a point on a number line. I can find the opposite of any given number.
1. Read the problem below. A number line from 0 to 1 is divided into seven equal segments. What fraction names point A? What fraction names point B?
2. Draw your own number line to show twelve equal segments from 0 to 1. Label intervals on the number line to show the fractional units that represent each section.
3. Create a second number line and plot the following points on it: a. -2 b. 3 c. –(-4) d. the opposite of zero e. 2.5 f. -1/2

E n t e r i n g P r e - A l g e b r a
Page 7
Project #6 Domain: The Number System (NS) Learning Targets: I can describe and give examples of how positive or negative numbers are used to describe quantities having opposite directions or values. I can recognize that positive and negative signs represent opposite values and/or directions. I can explain that the number zero is the point at which direction or value will change. I can use positive and negative numbers along with zero to represent real world situations.
1. Use an integer to represent 25 feet below sea level.
2. Use an integer to represent 25 feet above sea level.
3. What would 0 (zero) represent in the scenario above?
4. Draw a map or sketch to illustrate the above scenario and label each the designated regions.

E n t e r i n g P r e - A l g e b r a
Page 8
Project #7 Domain: The Number System (NS) Learning Targets: I can fluently add, subtract, multiply and divide multi-digit decimals and fractions using the standard algorithm. Directions: Read the following problem and answer the questions. Draw a table or
pictures to help you solve. *Show all of your work in the space below or on a separate sheet of paper.
A runner ran 20 miles in 150 minutes. If she runs at that speed,
1. How long would it take her to run 6 miles?
2. How far could she run in 15 minutes?
3. How fast is she running in miles per hour?
4. What is her pace in minutes per mile?

E n t e r i n g P r e - A l g e b r a
Page 9
Project #8 Domain: The Number System (NS) Learning Targets: I can find all factors of any given number, less than or equal to 100. I can find the greatest common factor of any two numbers, less than or equal to 100. I can find the least common multiple of any two numbers, less than or equal to 12.
1. List all the factors of 48.
2. List all the factors of 64.
3. What are the common factors of 48 and 64?
4. What is the greatest common factor of 48 and 64?
5. Use the greatest common factor and the distributive property to find the sum of 36 and 8.
6. Solve:
The elementary school lunch menu repeats every 20 days; the middle school lunch menu repeats every 15 days. Both schools are serving pizza today. In how may days will both schools serve pizza again?
E n t e r i n g P r e - A l g e b r a
Page 10
Project #9 Domain: The Number System (NS) Learning Targets: I can fluently add, subtract, multiply and divide multi-digit decimals and fractions using the standard algorithm. Directions: Solve the following problem. The florist can order roses in bunches of one dozen and lilies in bunches of 8. Last month she ordered the same number of roses as lilies. If she ordered no more than 100 roses, how many bunches of each could she have ordered? What is the smallest number of bunches of each that she could have ordered? Use the space to create a table or draw a diagram to solve the problem. Be careful to explain your reasoning.

E n t e r i n g P r e - A l g e b r a
Page 11
Project #10 Domain: Expressions and Equations (EE) Learning Targets: I can explain the meaning of a number raised to a power. I can write numerical expressions involving whole-number exponents. I can evaluate numerical expressions involving whole-number exponents. Directions: Solve the following. Show all of your work.
1. What is the value of:
a. 0.23
b. 5 + 24 x 6 c. 72 – 24 ÷ 3 + 26
2. What is the area of a square with a side length of 5x?
3. 6x = 1,296
4. Write an algebraic expression for each of the following:
7 less than 3 times a number 3 times the sum of a number and 5 7 less than the product of 2 and a number Twice the difference between a number and 5 The quotient of the sum of x plus 4 and 2

E n t e r i n g P r e - A l g e b r a
Page 12
Project #11 Domain: Expressions and Equations (EE) Learning Targets: I can evaluate an algebraic expression for a given value. I can substitute values in formulas to solve real-world problems. I can apply the order of operations when evaluating both arithmetic and algebraic expressions.
1. Evaluate the following expression when x = 4 and y = 2
2𝑥 + 3𝑦3
2. Solve the following:
It costs $100 to rent the skating rink plus $5 per person. Write an expression to find the cost for any number (n) of people. Then use your formula to find the cost for 25 people to skate.
3. Create an equation of your own for a parent or friend to solve. Write your solution and show all of your work below.

E n t e r i n g P r e - A l g e b r a
Page 13
Project #12 Domain: Expressions and Equations (EE) Learning Targets: I can create a visual model to show two expressions are equivalent. I can apply the properties of operations – especially the distributive property – to generate equivalent expressions.
1. Given that the width of the flower beds is 4.5 units and the length can be represented by x + 2, write an equation to express the area of the flowers below.
2. Write out an explanation for each part of the problem below:
a. Use your understanding of multiplication to interpret 3 (2 + x).
b. Use a model to represent x, and make an array to show the meaning of 3(2 + x).
c. Draw an array to represent the equation: 3(2+x)
3. Prove that y + y + y = 3y

E n t e r i n g P r e - A l g e b r a
Page 14
Project #13 Domain: Expressions and Equations (EE) Learning Targets: I can use a variable to write an algebraic expression that represents a real-world situation when a specific number is unknown. I can explain and give examples of how a variable can represent a single unknown number or can represent any number in a specified set. I can use a variable to write an expression that represents a consistent relationship in a particular pattern.
1. Complete both problems below.
A. Billy was offered a job at the nearby golf course. The owner offered him $500.00 per seven day week or $50 the first day and agreed to double it for each following day. How could Billy make the most amount of money?
Which deal should he accept and why?
B. Sally is having a birthday party with 10 people. When everyone gets there she asks everyone to introduce themselves and shake everyone's hand. How many handshakes will there be? How do you know? Show your work below.
2. Create three real-world mathematical problems involving variables to represent unknown numbers. *Be sure to create an answer key with explanations of how to solve each of your problems.

E n t e r i n g P r e - A l g e b r a
Page 15
Project #14 Domain: Expressions and Equations (EE) Learning Targets: I can create a table of two variables that represents a real-world situation in which one quantity will change in relation to the other.
1. What is the relationship between the two variables (shown in the table below)? Write an expression that illustrates the relationship.
2. Solve the problem below.
Describe the change in speed over time shown by the graph.
3. Make up two new problems of your own to show your understanding of how to
analyze change.

E n t e r i n g P r e - A l g e b r a
Page 16
Project #15 Domain: Geometry (G) Learning Targets: I can show how to find the area of other polygons by decomposing them into simpler shapes such as triangles, rectangles, and parallelograms. Directions: Study the figure below. Answer the questions and complete the activities
under the figure.
1. How many triangles are in this figure?
2. How many parallelograms are in this figure?
3. Break apart the geometric figure into its base components. In other words, on a separate piece of paper, draw every possible triangle and every possible parallelogram you identified and counted to answer questions 1 & 2.
4. Then color the shapes and put them back together to form a variety of new shapes.

E n t e r i n g P r e - A l g e b r a
Page 17
Project #16 Domain: Geometry (G) Learning Targets: I can plot vertices in the coordinate plane to draw specific polygons. I can use the coordinates of the vertices of a polygon to find the length of a specific side. I can plot points, draw figures, and find lengths on the coordinate plane to solve real-world problems. Part I
1. Use the following coordinates to draw polygons on the coordinate plane below.
A. (2, -3) B. (-2, -1) C. (-3, 4) D. (1, 3) Name the figure:_____________ A. (-5, -3) B. (-4, -6) C. (4,-4) Name the figure:_____________
Part II
2. On graph paper, draw your own coordinate plane. Label the X and Y axes.
3. Choose a room in your house and study the arrangement of the furniture.
4. Measure the dimensions of at least three pieces of furniture in the room you chose (i.e., your bed, desk, and chest of drawers if you choose your bedroom).
5. Create a scale, then graph the pieces of furniture on your graph paper coordinate plane.
6. Write directions using your coordinate plane and furniture model to give to a parent to
see if they can complete a transformation of the furniture according to the directions and scale model you created.

E n t e r i n g P r e - A l g e b r a
Page 18
Project #17 Domain: Geometry (G) Learning Targets: I can solve problems that involve finding the area of polygons. Directions: Solve each problem using the formulas listed below.
1. Find the area of a right triangle with a base length of three units, a height of four units, and a hypotenuse of 5.
2. Find the area of the trapezoid shown below using the formulas for rectangles and triangles.
3. A rectangle measures 3 inches by 4 inches. If the lengths of each side double, what is
the effect on the area?

E n t e r i n g P r e - A l g e b r a
Page 19
Project #18 Domain: Statistics and Probability (SP) Learning Targets: I can define a measure of center as a single value that summarizes a data set. I can find measures of center by calculating the mean, median, and mode of a set of numerical data. I can define a measure of variation as the range of the data, relative to the measures of center. Consider the data shown in the line plot of the six trait scores for organization for a group of students.
1. How many students are represented in the data set?
2. What are the mean and median of the data set?
3. What do these values mean? How do they compare?
4. What is the range of the data? What does this value mean?

E n t e r i n g P r e - A l g e b r a
Page 20
Project #19 Domain: Statistics and Probability (SP) Learning Targets: I can write a data collection summary that includes the number of observations, what is being investigated, how it is measured, and the units of measurement. I can determine the measures of center and measures of variability of the collected data. Directions: Solve the following. Show all of your work and explain how you arrived at
your solutions. Use charts, graphs or diagrams to help you. Problem 1: Susan has four 20-point projects for math class. Susan’s scores on the first 3 projects are shown below: Project 1: 18 Project 2: 15 Project 3: 16 Project 4: ?? What does she need to make on Project 4 so that the average for the four projects is 17? Explain your reasoning. Problem 2: Mean Absolute Deviation (MAD) describes the variability of the data set by determining the absolute deviation (the distance) of each data piece from the mean and then finding the average of these deviations. The Mean Absolute Deviation is represented by a single numerical value. Higher values represent a greater variability in the data. Use this information to solve the problem below. The following data set represents the size of 9 families: 3, 2, 4, 2, 9, 8, 2, 11, 4. What is the MAD for this data set?

E n t e r i n g P r e - A l g e b r a
Page 21
Extensions
The following activities are based on standards you will learn in Pre-Algebra. They may be challenging for you.
Project #20 Domain: Statistics and Probability (SP) Learning Targets: I can create a sample space of all possible outcomes for a compound event by using an organized list, a table or a tree diagram. Directions: Solve the problem below. Create three-dimensional models by making
real pizza pies and take pictures of your creations or create models with representative objects.
Pizza Party: How many different types of pizza can you make with the following toppings: pepperoni, tomatoes, bacon, onions and green peppers? Show your answer. The chef at Pinelli’s Pizza just told you that they can create pizzas with two different kinds of pizza on the same pie. For example, you could have a half pepperoni and half bacon pizza. How does this affect the number of types of pizzas you created? Will the number of options double? Why or why not? Show all of your work below. Hint: To add to the fun of this problem, create real or pretend pizzas and use pennies, nickels, dimes, erasers, M&Ms, Reese’s Pieces, gumdrops, or other objects to create your models and figure out your solution.

E n t e r i n g P r e - A l g e b r a
Page 22
Project #21 Domain: Statistics and Probability (SP) Learning Targets: I can explain that inferences about a population can be made by examining a sample. I can explain why the validity of a sample depends on whether the sample is representative of the population. I can explain that random sampling tends to produce representative samples. Directions: 1. Develop a survey like the example below. Include at least 3 groups for
the survey (e.g. 3 rounds)
2. Once you have conducted 3 rounds of the survey, evaluate the actual results of your survey in comparison to your prediction following the 2nd round of the survey.
Example: Present the following question to 10 people:
Which of the following 3 is your favorite sport: Soccer, Basketball, and Baseball/Softball? Then, use your collected results and percentages to predict what the number of responses will be in your 3rd group of 10. Which of the following is your favorite sport: Soccer, Basketball, or Baseball (Softball, for a girl)? Record your results from the 1st and 2nd rounds of survey in the table below:

E n t e r i n g P r e - A l g e b r a
Page 23
Project #22 Domain: Ratios and Proportional Relationships (RP) Learning Targets: I can use proportional reasoning to solve real-world ratio and percent
problems, including those with multiple steps.
1. Complete the following three problems to apply your understanding of percentages and ratios.
Problem 1:
Tom wants to buy some protein bars and magazines for a trip. He has decided to buy three times as many protein bars as magazines. Each protein bar costs $0.70 and each magazine costs $2.50. The sales tax rate on both types of items is 6½%. How many of each item can he buy if he has$20.00 to spend?
Problem 2:
You and some friends went out to T.G.I. Fridays for dinner. You ordered a root beer, sweet potato fries and cheese quesadillas. The total bill came to $21.86. Your dad has told you many times that it’s important to leave a good tip; about 20%. You have $26.00 in your wallet. Can you leave a 20% tip? How much would the total be if you left a 20% tip? Can you cover the cost?
Problem 3:
Builders have observed that residence windows are most attractive if they have the width to length ratio 3:5. If a window is to be 48 inches wide, what should its length be for the most attractive appearance?
2. Create one original problem involving a percentage (discount or tax).
3. Create one original problem involving a ratio or part/whole relationship.
4. Solve both and keep the answer key.
5. Challenge a friend to solve your problems.

E n t e r i n g P r e - A l g e b r a
Page 24
Project #23 Domain: The Number System (NS) Learning Targets: I can solve real-world problems that involve the addition, subtraction, multiplication and/or division of rational numbers. Problem 1: Using exactly four 4's and any operations [+, -, x, ÷, ()] write an expression to equal each of the following: 1 = _______________ 4 = _______________ 2 = _______________ 5 = _______________ 3 = _______________ *Example: 16 = 4 x 4 x 4 ÷ 4 Problem 2: Find three different ways to fill in operations in the boxes below to make the equations true.

E n t e r i n g P r e - A l g e b r a
Page 25
Project #24 Domain: Ratios and Proportional Relationships (RP) Learning Targets: I can determine whether two quantities are proportional by examining the relationship given in a table, graph, equation, diagram or as a verbal description. The students in Ms. Baca’s art class were mixing yellow and blue paint. She told them that two mixtures will be the same shade of green if the blue and yellow paint are in the same ratio. The table below shows the different mixtures of paint that the students made.
a. How many different shades of paint did the students make?
b. Some of the shades of paint were bluer than others. Which mixture(s) were the bluest? Show work or explain how you know.
c. Carefully plot a point for each mixture on a coordinate plane like the one that is shown in the figure. (Graph paper might help.)
d. Draw a line connecting each point to (0,0). What do the mixtures that are the same shade of green have in common?

E n t e r i n g P r e - A l g e b r a
Page нс
SUMMER MATH FUN FOR STUDENTS ENTERING
PRE-ALGEBRA
ANSWER KEY
When completing the problems we need to show all of our work and show all of our thinking. Compare your work to ours, especially if your answer is different than our
answer. If the project listed is creative in its approach and each project created would be different, no answer is provided.
E n t e r i n g P r e - A l g e b r a
Page 2т
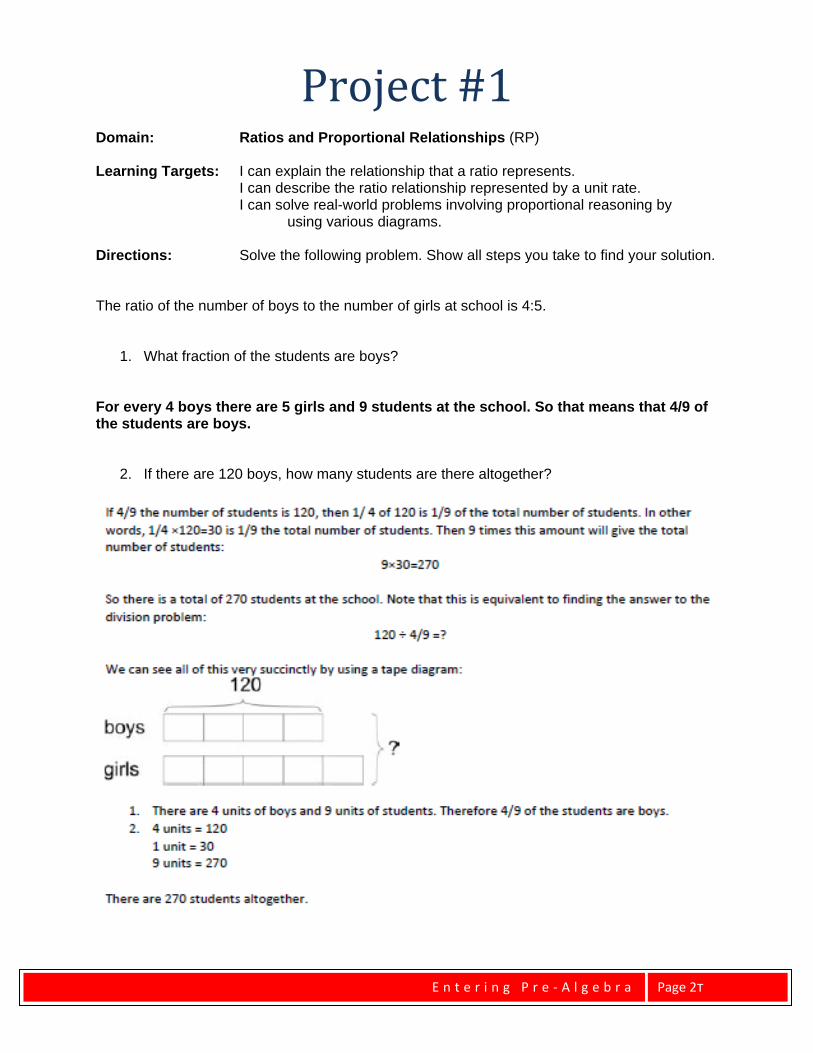
Project #1 Domain: Ratios and Proportional Relationships (RP) Learning Targets: I can explain the relationship that a ratio represents. I can describe the ratio relationship represented by a unit rate. I can solve real-world problems involving proportional reasoning by using various diagrams. Directions: Solve the following problem. Show all steps you take to find your solution. The ratio of the number of boys to the number of girls at school is 4:5.
1. What fraction of the students are boys? For every 4 boys there are 5 girls and 9 students at the school. So that means that 4/9 of the students are boys.
2. If there are 120 boys, how many students are there altogether?

E n t e r i n g P r e - A l g e b r a
Page ну
Project #2 Domain: Ratios and Proportional Relationships (RP) Learning Targets: I can explain the relationship that a ratio represents. I can describe the ratio relationship represented by a unit rate. I can solve real-world problems involving proportional reasoning by using various diagrams. Directions: Find five examples of ratios in the real world. Write them down and
describe the situation in which they are found. *Remember, ratios are comparisons of two quantities which can be written in the following ways:
1) a to b
2) ab
3) a:b
Example: At the grocery store, Amanda noticed that there were three times as
many carts as there were baskets for shoppers to use to carry their food. The ratio of carts to baskets (c : b) is 3 to 1.
1. 2. 3. 4. 5. Create a problem using ratios for your parents/guardians or friends to solve. Write both your problem and solution below.

E n t e r i n g P r e - A l g e b r a
Page нф
Project #3 Domain: The Number System (NS) Learning Targets: I can find all factors of any given number, less than or equal to 100. I can find the greatest common factor of any two numbers, less than or equal to 100. I can find the least common multiple of any two numbers, less than or equal to 12. Directions: Read the problem below.
*Use the hints to help if needed to solve the riddle.
I’m thinking of two numbers. Their greatest common factor is 6. Their least common multiple is 36. One of the numbers is 12. What is the other number? Hints:
1) What are the factors of 12? 2) Can the other number be 3? Why or why not? The number cannot be 3 because the
greatest common factor of both of the numbers is 6. (3 cannot have a factor). 3) Can the other number be 6? Why or why not?
Show your work! Create two riddles like this one to challenge your friends or parents/guardians. One of the two should include a negative integer or fraction. Create 2-3 hints for each to help in case your problem solvers need some assistance.

E n t e r i n g P r e - A l g e b r a
Page ол
Project #4 Domain: The Number System (NS) Learning Targets: I can fluently add, subtract, multiply and divide multi-digit decimals and fractions using the standard algorithm. Directions: Complete the problems below. Chef Julius Grayson had an empanada recipe that called for 3 4� lb onions and 1 1 3� lbs of pork. He was preparing the recipe for a special event and needed to quadruple it to make enough for all of his guests. How many pounds of onions and pounds of pork would he need for the recipe? Show all of your work. Onions: ¾ x 4 = 12/4 =3 lb. onions Pork: 1 1/3 = 4/3 4/3 x 4/1 = 16/3 16 ÷ 3 = 5 1/3 lb. pork Create a problem about the estimated cost of ingredients for the large event recipe if onions cost $2.99/lb and pork costs $5.49/lb. Include both an estimated solution and a true solution to check to see that your estimation is reasonable.

E n t e r i n g P r e - A l g e b r a
Page ом
Project #5 Domain: The Number System (NS) Learning Targets: I can show and explain why every rational number can be represented by a point on a number line. I can find the opposite of any given number.
1. Read the problem below. A number line from 0 to 1 is divided into seven equal segments. What fraction names point A? What fraction names point B?
A. 3/7 B. 5/7
2. Draw your own number line to show twelve equal segments from 0 to 1.
Label intervals on the number line to show the fractional units that represent each section.
3. Create a second number line and plot the following points on it:
a. -2 b. 3 c. –(-4) d. the opposite of zero e. 2.5 f. -1/2
-3 -2 -1 0 1 2 3 4

E n t e r i n g P r e - A l g e b r a
Page он
Project #6 Domain: The Number System (NS) Learning Targets: I can describe and give examples of how positive or negative numbers are used to describe quantities having opposite directions or values. I can recognize that positive and negative signs represent opposite values and/or directions. I can explain that the number zero is the point at which direction or value will change. I can use positive and negative numbers along with zero to represent real world situations.
1. Use an integer to represent 25 feet below sea level.
-25
2. Use an integer to represent 25 feet above sea level.
25
3. What would 0 (zero) represent in the scenario above?
0 would represent sea level
4. Draw a map or sketch to illustrate the above scenario and label each the designated regions.

E n t e r i n g P r e - A l g e b r a
Page оо
Project #7 Domain: The Number System (NS) Learning Targets: I can fluently add, subtract, multiply and divide multi-digit decimals and fractions using the standard algorithm. Directions: Read the following problem and answer the questions. Draw a table or
pictures to help you solve. *Show all of your work in the space below or on a separate sheet of paper.
A runner ran 20 miles in 150 minutes. If she runs at that speed,
1. How long would it take her to run 6 miles?
2. How far could she run in 15 minutes?
3. How fast is she running in miles per hour?
4. What is her pace in minutes per mile?

E n t e r i n g P r e - A l g e b r a
Page оп
Project #8 Domain: The Number System (NS) Learning Targets: I can find all factors of any given number, less than or equal to 100. I can find the greatest common factor of any two numbers, less than or equal to 100. I can find the least common multiple of any two numbers, less than or equal to 12.
1. List all the factors of 48.
1, 2, 3, 4, 6, 8, 12, 16, 24, 48
2. List all the factors of 64.
1, 2, 4, 8, 16, 32, 64
3. What are the common factors of 48 and 64?
1, 2, 4, 8, 16
4. What is the greatest common factor of 48 and 64?
16
5. Use the greatest common factor and the distributive property to find the sum of 36 and 8.
36 + 8 = 4 (9) + 4(2) 44 = 4 (9 + 2) 44 = 4 (11) 44 = 44
6. Solve:
The elementary school lunch menu repeats every 20 days; the middle school lunch menu repeats every 15 days. Both schools are serving pizza today. In how may days will both schools serve pizza again? The solution to this problem will be the least common multiple (LCM) of 15 and 20. Students should be able to explain that the least common multiple is the smallest number that is a multiple of 15 and a multiple of 20. One way to find the least common multiple is to find the prime factorization of each number: 2 x 2 x 5 = 20 and 3 x 5 = 15. To be a multiple of 20, a number must have 2 factors of 2 and one factor of 5. To be a multiple of 15, a number must have factors of 3 and 5. The least common multiple of 20 and 15 must have 2 factors of 2, one factor of 3 and one factor of 5 ( 2 x 2 x 3 x 5) or 60.
E n t e r i n g P r e - A l g e b r a
Page ор
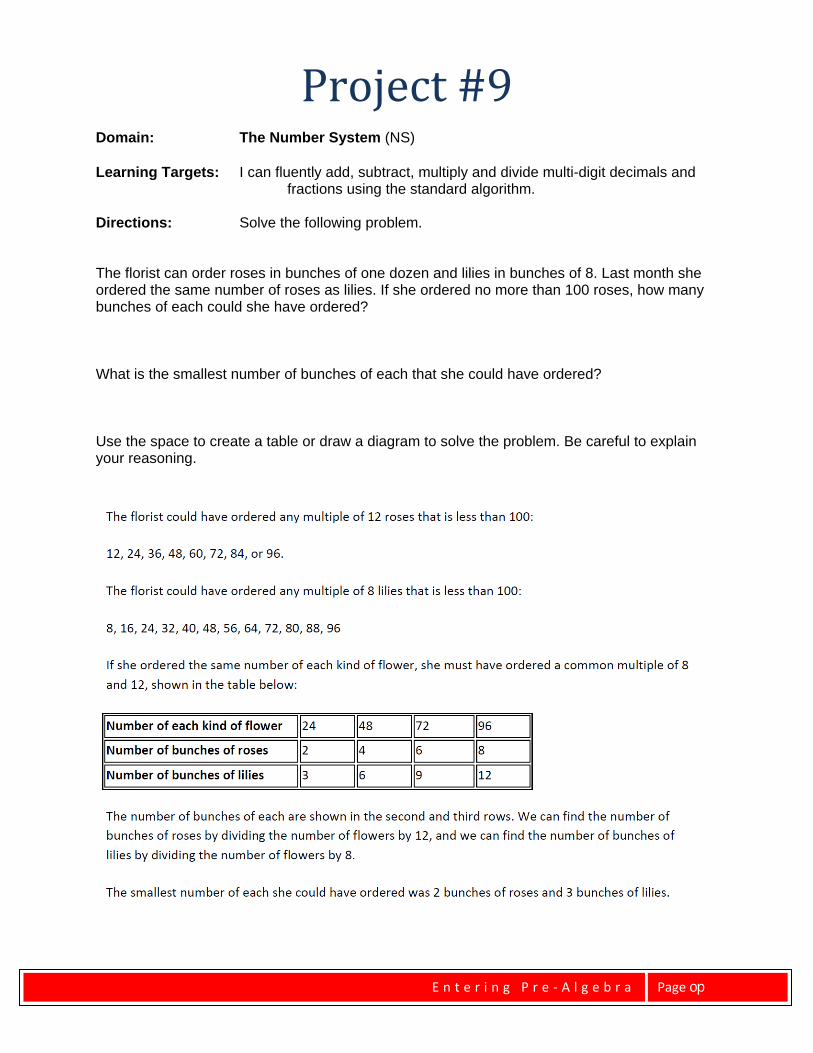
Project #9 Domain: The Number System (NS) Learning Targets: I can fluently add, subtract, multiply and divide multi-digit decimals and fractions using the standard algorithm. Directions: Solve the following problem. The florist can order roses in bunches of one dozen and lilies in bunches of 8. Last month she ordered the same number of roses as lilies. If she ordered no more than 100 roses, how many bunches of each could she have ordered? What is the smallest number of bunches of each that she could have ordered? Use the space to create a table or draw a diagram to solve the problem. Be careful to explain your reasoning.

E n t e r i n g P r e - A l g e b r a
Page ос
Project #10 Domain: Expressions and Equations (EE) Learning Targets: I can explain the meaning of a number raised to a power. I can write numerical expressions involving whole-number exponents. I can evaluate numerical expressions involving whole-number exponents. Directions: Solve the following. Show all of your work.
1. What is the value of:
a. 0.23 0.008 b. 5 + 24 x 6 101 c. 72 – 24 ÷ 3 + 26 67
2. What is the area of a square with a side length of 5x?
5x ∙ 5x = 25x2
3. 6x = 1,296
x = 4 because 6∙6∙6∙6 = 1,296
4. Write an algebraic expression for each of the following:
7 less than 3 times a number 3x-7 3 times the sum of a number and 5 3(x+5) 7 less than the product of 2 and a number 2x-7 Twice the difference between a number and 5 2(x-5) The quotient of the sum of x plus 4 and 2 𝑥+4
2

E n t e r i n g P r e - A l g e b r a
Page от
Project #11 Domain: Expressions and Equations (EE) Learning Targets: I can evaluate an algebraic expression for a given value. I can substitute values in formulas to solve real-world problems. I can apply the order of operations when evaluating both arithmetic and algebraic expressions.
1. Evaluate the following expression when x = 4 and y = 2
2𝑥 + 3𝑦3
2. Solve the following:
It costs $100 to rent the skating rink plus $5 per person. Write an expression to find the cost for any number (n) of people. Then use your formula to find the cost for 25 people to skate. The cost for any number (n) of people could be found by the expression, 100 + 5n. To find the cost of 25 people substitute 25 in for n and solve to get 100 + 5 * 25 = 225. It will cost $225 to skate.
3. Create an equation of your own for a parent or friend to solve. Write your solution and show all of your work below.

E n t e r i n g P r e - A l g e b r a
Page оу
Project #12 Domain: Expressions and Equations (EE) Learning Targets: I can create a visual model to show two expressions are equivalent. I can apply the properties of operations – especially the distributive property – to generate equivalent expressions.
1. Given that the width of the flower beds is 4.5 units and the length can be represented by x + 2, write an equation to express the area of the flowers below.
The length of the flower beds can be expressed as 4.5(x + 3) or 4.5x + 13.5.
2. Write out an explanation for each part of the problem below:
a. Use your understanding of multiplication to interpret 3 (2 + x)
b. Use a model to represent x, and make an array to show the meaning of 3(2 + x).
c. Draw an array to represent the equation: 3(2+x)
Students use their understanding of multiplication to interpret 3 (2 + x) as 3 groups of (2 + x). They use a model to represent x, and make an array to show the meaning of 3(2 + x). They can explain why it makes sense that 3(2 + x) is equal to 6 + 3x. An array with 3 columns and x + 2 in each column.
3. Prove that y + y + y = 3y

E n t e r i n g P r e - A l g e b r a
Page оф
Project #13 Domain: Expressions and Equations (EE) Learning Targets: I can use a variable to write an algebraic expression that represents a real-world situation when a specific number is unknown. I can explain and give examples of how a variable can represent a single unknown number or can represent any number in a specified set. I can use a variable to write an expression that represents a consistent relationship in a particular pattern.
1. Complete both problems below.
A. Billy was offered a job at the nearby golf course. The owner offered him $500.00 per seven day week or $50 the first day and agreed to double it for each following day. How could Billy make the most amount of money?
Which deal should he accept and why? $500n= $500 per week. $50+ 2(50) + 2(50) + 2(50) + 2(50)+2(50) + 2(50)= $650 Billy should go with the second deal because he will make more money if he works each day.
B. Sally is having a birthday party with 10 people. When everyone gets there she asks everyone to introduce themselves and shake everyone's hand. How many handshakes will there be? How do you know? Show your work below.
Sally has 10 people at her party. 10 x 10 = 100 handshakes
2. Create three real-world mathematical problems involving variables to represent unknown numbers. *Be sure to create an answer key with explanations of how to solve each of your problems.

E n t e r i n g P r e - A l g e b r a
Page пл
Project #14 Domain: Expressions and Equations (EE) Learning Targets: I can create a table of two variables that represents a real-world situation in which one quantity will change in relation to the other.
1. What is the relationship between the two variables (shown in the table below)? Write an expression that illustrates the relationship.
Solution: y = 2.5x
2. Solve the problem below.
Describe the change in speed over time shown by the graph.
As time increases, speed is constant for a short period of time. Then, after a sharp decline in speed, speed increases at a direct rate as time passes.
3. Make up two new problems of your own to show your understanding of how to
analyze change.

E n t e r i n g P r e - A l g e b r a
Page пм
Project #15 Domain: Geometry (G) Learning Targets: I can show how to find the area of other polygons by decomposing them into simpler shapes such as triangles, rectangles, and parallelograms. Directions: Study the figure below. Answer the questions and complete the activities
under the figure.
1. How many triangles are in this figure?
2. How many parallelograms are in this figure?
3. Break apart the geometric figure into its base components. In other words, on a separate piece of paper, draw every possible triangle and every possible parallelogram you identified and counted to answer questions 1 & 2.
4. Then color the shapes and put them back together to form a variety of new shapes.

E n t e r i n g P r e - A l g e b r a
Page пн
Project #16 Domain: Geometry (G) Learning Targets: I can plot vertices in the coordinate plane to draw specific polygons. I can use the coordinates of the vertices of a polygon to find the length of a specific side. I can plot points, draw figures, and find lengths on the coordinate plane to solve real-world problems. Part I
1. Use the following coordinates to draw polygons on the coordinate plane below.
A. (2, -3) B. (-2, -1) C. (-3, 4) D. (1, 3) Name the figure: parallelogram A. (-5, -3) B. (-4, -6) C. (4,-4) Name the figure: triangle
Part II
2. On graph paper, draw your own coordinate plane. Label the X and Y axes.
3. Choose a room in your house and study the arrangement of the furniture.
4. Measure the dimensions of at least three pieces of furniture in the room you chose (i.e., your bed, desk, and chest of drawers if you choose your bedroom).
5. Create a scale, then graph the pieces of furniture on your graph paper coordinate plane.
6. Write directions using your coordinate plane and furniture model to give to a parent to
see if they can complete a transformation of the furniture according to the directions and scale model you created.

E n t e r i n g P r e - A l g e b r a
Page по
Project #17 Domain: Geometry (G) Learning Targets: I can solve problems that involve finding the area of polygons. Directions: Solve each problem using the formulas listed below.
1. Find the area of a right triangle with a base length of three units, a height of four units, and a hypotenuse of 5.
A = 1/2 bh A = 1/2 (3 units)(4 units) A = 1/2 ∙ 12 units2 A = 6 units2
2. Find the area of the trapezoid shown below using the formulas for rectangles and triangles.
Students can calculate in various ways however the area of the trapezoid is 26 units2.
3. A rectangle measures 3 inches by 4 inches. If the lengths of each side double, what is
the effect on the area?
The new rectangle would have side lengths of 6 inches and 8 inches. The area of the original rectangle was 12 Inches2. The area of the new rectangle is 48 inches2. The area increased 4 times (quadrupled). Students may also create a drawing to show this visually.

E n t e r i n g P r e - A l g e b r a
Page пп
Project #18 Domain: Statistics and Probability (SP) Learning Targets: I can define a measure of center as a single value that summarizes a data set. I can find measures of center by calculating the mean, median, and mode of a set of numerical data. I can define a measure of variation as the range of the data, relative to the measures of center. Consider the data shown in the line plot of the six trait scores for organization for a group of students.
1. How many students are represented in the data set?
2. What are the mean and median of the data set?
3. What do these values mean? How do they compare?
4. What is the range of the data? What does this value mean?

E n t e r i n g P r e - A l g e b r a
Page пр
Project #19 Domain: Statistics and Probability (SP) Learning Targets: I can write a data collection summary that includes the number of observations, what is being investigated, how it is measured, and the units of measurement. I can determine the measures of center and measures of variability of the collected data. Directions: Solve the following. Show all of your work and explain how you arrived at
your solutions. Use charts, graphs or diagrams to help you. Problem 1: Susan has four 20-point projects for math class. Susan’s scores on the first 3 projects are shown below: Project 1: 18 Project 2: 15 Project 3: 16 Project 4: ?? What does she need to make on Project 4 so that the average for the four projects is 17? Explain your reasoning. One way to solve is to calculate the total number of points needed (17 x 4 or 68) to have an average of 17. She has earned 49 points on the first 3 projects, which means she needs to earn 19 points on Project 4 (68 – 49 = 19). Problem 2: Mean Absolute Deviation (MAD) describes the variability of the data set by determining the absolute deviation (the distance) of each data piece from the mean and then finding the average of these deviations. The Mean Absolute Deviation is represented by a single numerical value. Higher values represent a greater variability in the data. Use this information to solve the problem below. The following data set represents the size of 9 families: 3, 2, 4, 2, 9, 8, 2, 11, 4. What is the MAD for this data set? The mean is 5. The MAD is the average variability of the data set. To find the MAD: 1. Find the deviation from the mean. 2. Find the absolute deviation for each of the values from step 1 3. Find the average of these absolute deviations.

E n t e r i n g P r e - A l g e b r a
Page пс
Extensions
The following activities are based on standards you will learn in Pre-Algebra. They may be challenging for you.
Project #20 Domain: Statistics and Probability (SP) Learning Targets: I can create a sample space of all possible outcomes for a compound event by using an organized list, a table or a tree diagram. Directions: Solve the problem below. Create three-dimensional models by making
real pizza pies and take pictures of your creations or create models with representative objects.
Pizza Party: How many different types of pizza can you make with the following toppings: pepperoni, tomatoes, bacon, onions and green peppers? Show your answer. The chef at Pinelli’s Pizza just told you that they can create pizzas with two different kinds of pizza on the same pie. For example, you could have a half pepperoni and half bacon pizza. How does this affect the number of types of pizzas you created? Will the number of options double? Why or why not? Show all of your work below. Hint: To add to the fun of this problem, create real or pretend pizzas and use pennies, nickels, dimes, erasers, M&Ms, Reese’s Pieces, gumdrops, or other objects to create your models and figure out your solution.

E n t e r i n g P r e - A l g e b r a
Page пт
Project #21 Domain: Statistics and Probability (SP) Learning Targets: I can explain that inferences about a population can be made by examining a sample. I can explain why the validity of a sample depends on whether the sample is representative of the population. I can explain that random sampling tends to produce representative samples. Directions: 1. Develop a survey like the example below. Include at least 3 groups for
the survey (e.g. 3 rounds)
2. Once you have conducted 3 rounds of the survey, evaluate the actual results of your survey in comparison to your prediction following the 2nd round of the survey.
Example: Present the following question to 10 people:
Which of the following 3 is your favorite sport: Soccer, Basketball, and Baseball/Softball? Then, use your collected results and percentages to predict what the number of responses will be in your 3rd group of 10. Which of the following is your favorite sport: Soccer, Basketball, or Baseball (Softball, for a girl)? Record your results from the 1st and 2nd rounds of survey in the table below:
E n t e r i n g P r e - A l g e b r a
Page пу
Project #22 Domain: Ratios and Proportional Relationships (RP) Learning Targets: I can use proportional reasoning to solve real-world ratio and percent
problems, including those with multiple steps.
1. Complete the following three problems to apply your understanding of percentages and ratios. Problem 1:
Tom wants to buy some protein bars and magazines for a trip. He has decided to buy three times as many protein bars as magazines. Each protein bar costs $0.70 and each magazine costs $2.50. The sales tax rate on both types of items is 6½%. How many of each item can he buy if he has $20.00 to spend?
The cost of a unit then is $2.50 + 3×($0.70), which is $4.60. With sales tax, this would be $4.60 × 1.065, which when rounded to the nearest cent would be $4.90, or just under $5.00. There are four groups of five in 20 and 4 × 4.899 = 19.596. This leaves $0.40 in change. So, with $20, he can buy 4 magazines and 12 protein bars, with $0.40 in change.
Problem 2: You and some friends went out to T.G.I. Fridays for dinner. You ordered a root beer, sweet potato fries and cheese quesadillas. The total bill came to $21.86. Your dad has told you many times that it’s important to leave a good tip; about 20%. You have $26.00 in your wallet. Can you leave a 20% tip? How much would the total be if you left a 20% tip? Can you cover the cost?
First, I need to figure out what 20% of the bill would be by changing 20% into a decimal .20. Then I multiply the bill $21.86 by .20 and get $4.37. Second, to get the total needed, I will add the bill $21.86 plus the $4.37 tip which = $26.23 Third, I need to compare what I have to what I need: I have $26.00 and need $26.23. ANSWER: I am short by 23 cents. I would not have enough to cover the cost.
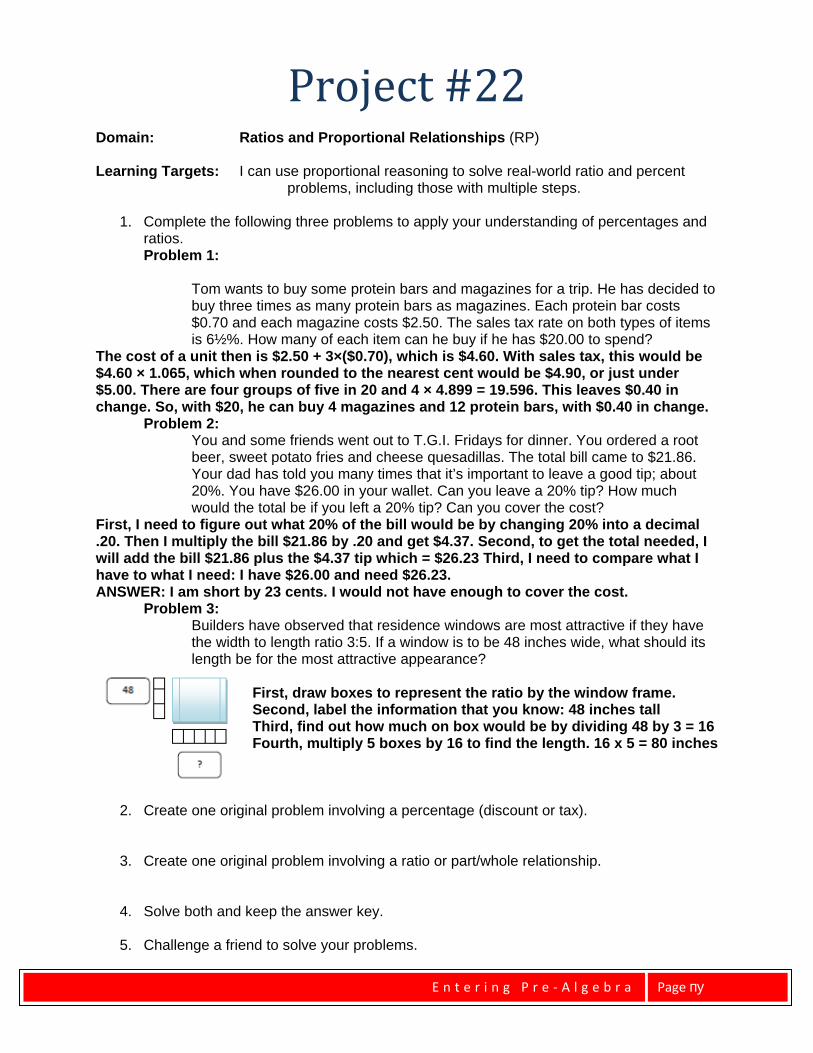
Problem 3: Builders have observed that residence windows are most attractive if they have the width to length ratio 3:5. If a window is to be 48 inches wide, what should its length be for the most attractive appearance?
First, draw boxes to represent the ratio by the window frame. Second, label the information that you know: 48 inches tall Third, find out how much on box would be by dividing 48 by 3 = 16 Fourth, multiply 5 boxes by 16 to find the length. 16 x 5 = 80 inches
2. Create one original problem involving a percentage (discount or tax).
3. Create one original problem involving a ratio or part/whole relationship.
4. Solve both and keep the answer key.
5. Challenge a friend to solve your problems.

E n t e r i n g P r e - A l g e b r a
Page пф
Project #23 Domain: The Number System (NS) Learning Targets: I can solve real-world problems that involve the addition, subtraction, multiplication and/or division of rational numbers. Problem 1: Using exactly four 4's and any operations [+, -, x, ÷, ()] write an expression to equal each of the following:
Problem 2: Find three different ways to fill in operations in the boxes below to make the equations true.

E n t e r i n g P r e - A l g e b r a
Page рл
Project #24 Domain: Ratios and Proportional Relationships (RP) Learning Targets: I can determine whether two quantities are proportional by examining the relationship given in a table, graph, equation, diagram or as a verbal description. The students in Ms. Baca’s art class were mixing yellow and blue paint. She told them that two mixtures will be the same shade of green if the blue and yellow paint are in the same ratio. The table below shows the different mixtures of paint that the students made.
a. How many different shades of paint did the students make?
The students made two different shades: mixtures A and C are the same, and mixtures B, D, and E are the same.
b. Some of the shades of paint were bluer than others. Which mixture(s) were the bluest?
Show work or explain how you know.
To make A and C, you add 2 parts blue to 1 part yellow. To make mixtures B, D, and E, you add 3/2 parts blue to 1 part yellow. Mixtures A and C are the bluest because you add more blue paint to the same amount of yellow paint.
c. Carefully plot a point for each mixture on a coordinate plane like the one that is shown in
the figure. (Graph paper might help.)
d. Draw a line connecting each point to (0,0). What do the mixtures that are the same shade of green have in common? If two mixtures are the same shade, they lie on the same line through the point (0, 0).

E n t e r i n g P r e - A l g e b r a
Page рм
Helpful Websites Visit one of the websites below and learn about one of the games. Play the game together for 10-20 minutes. Give your child time to play the game independently. Then, check to ensure your child is playing the game correctly and has mastered the concept.
www.sumdog.com
http://www.studyisland.com/web/index/