Embed Size (px)
Citation preview

Group SavinGSand retirement
Your range of investment options
inalco.com
SR
M28
7A-1
6

After retirement
2055
2051 -
2010
2006 -
2015
2011 -
2020
2016 -
2025
2021 -
2030
2026 -
2035
2031 -
2040
2036 -
2045
2041 -
2050
2046 -
Before retirement
Investment funds 2005
and -
Composition of portfolios on January 22, 2016 (in percent)
Target retirement period
2056
and +Short Term Bond 0.00 0.00 0.00 0.00 0.00 0.00 0.00 6.75 11.25 16.40 20.88 21.25
Bond 20.23 20.23 20.56 22.16 23.99 26.39 29.68 30.38 32.69 34.20 32.55 33.25
Core Plus Bond (PIMCO) 13.50 13.50 13.73 14.77 16.00 17.60 19.80 20.25 21.80 22.80 21.71 22.19
Global Fixed Income (PIMCO) 11.25 11.25 10.69 10.57 10.00 11.00 10.50 10.13 9.26 8.61 8.35 8.29
TOTAL - Income Funds 44.98 44.98 84.9883.4982.0175.0067.5159.9854.9949.9947.5044.98Dividend 7.22 7.22 7.22 6.89 6.56 5.91 5.25 4.26 3.28 2.36 2.17 1.97
Canadian Focused Equity (Pyramis) 7.22 7.22 7.22 6.89 6.56 5.91 5.25 4.27 3.28 2.36 2.17 1.97
Canadian Equity Low Volatility (TD) 2.41 2.41 2.41 2.30 2.19 1.97 1.75 2.13 2.19 1.97 2.17 1.97
Canadian Equity Growth 4.81 4.81 4.81 4.59 4.38 3.94 3.50 2.13 1.09 0.39 0.00 0.00
Cdn Equity Small Cap (Montrusco) 2.41 2.41 2.41 2.30 2.19 1.97 1.75 1.42 1.09 0.79 0.72 0.66
TOTAL - Canadian Equity Funds 24.07 24.07 6.577.237.8710.9314.2117.5019.7021.8822.9724.07Global Equity Index ACWI (BlackRock) 6.02 6.02 6.02 5.74 5.47 4.92 4.38 3.56 2.73 1.97 1.81 1.64
Global Equity (Hexavest) 6.02 6.02 6.26 6.20 6.13 5.71 5.25 4.41 3.50 2.60 2.45 2.30
Global Equity (Templeton) 7.22 7.22 6.98 6.43 5.91 5.12 4.38 3.41 2.52 1.73 1.52 1.31
Global Equity Small Cap (DeutscheAWM)
1.20 1.20 1.20 1.15 1.09 0.98 0.88 0.71 0.55 0.39 0.36 0.33
Global Equity Small Cap (Mawer) 1.20 1.20 1.20 1.15 1.09 0.98 0.88 0.71 0.55 0.39 0.36 0.33
3
40 years +
44.98%
24.07%
24.07%
6.88%
35 years
44.98%
24.07%
24.07%
6.88%
Income Funds
Canadian Equity Funds
Foreign Equity Funds
Alternative/Specialty Funds
RETIREMENTRETIREMENT
82.01%
7.87%
7.87%
2.25%
5 years
75.00%
10.93%
10.94%
3.13%
10 years
67.51%
14.21%
14.22%
4.06%
15 years
59.98%
17.50%
17.52%
5.00%
20 years
54.99%
19.70%
19.68%
5.63%
25 years
49.99%
21.88%
21.88%
6.25%
30 years
47.50%
22.97%
22.97%
6.56%
RETIREMENT
82.01%
7.87%
7.87%
2.25%
Income Funds
Canadian Equity Funds
Foreign Equity Funds
Alternative/Specialty Funds
Evolution of the composition of portfoliosAttitude Portfolios are designed to maximize the potential growth of investments when retirement is far off and to gradually reduce the risk as retirementapproaches. The asset mix of portfolios evolves automatically to become more prudent over time.
The diagrams below illustrate the evolution of the target composition of CONSERVATIVE profile portfolios over time, for the period before retirementand once retirement has begun.
YEARS
5 years
83.49%
7.23%
7.22%
2.06%
10 years
84.98%
6.57%
6.57%
1.88%
AFTER RETIREMENT
YEARS
HIGHER LOWER
BEFORE RETIREMENT
The asset mixes shown in this section are those of December 31, 2015. See section below for the current composition of portfolios.
CONSERVATIVE ProfileAttitude Portfolios
11
The composition of each portfolio is changed every 3 months so that it gradually reaches the next target asset mix (refer to the section above for the targetallocations of the portfolios over time).
The following table shows the current composition of CONSERVATIVE profile portfolios for each target retirement period.
Composition of portfolios on January 22, 2016
Growth potential and risk level

After retirement
2055
2051 -
2010
2006 -
2015
2011 -
2020
2016 -
2025
2021 -
2030
2026 -
2035
2031 -
2040
2036 -
2045
2041 -
2050
2046 -
Before retirement
Investment funds 2005
and -
Composition of portfolios on January 22, 2016 (in percent)
Target retirement period
2056
and +
Emerging Markets (Aberdeen) 2.41 2.41 2.41 2.30 2.19 1.97 1.75 1.42 1.09 0.79 0.72 0.66
TOTAL - Foreign Equity Funds 24.07 24.07 6.577.227.8710.9414.2217.5219.6821.8822.9724.07Balanced-Risk Allocation (Invesco) 0.00 0.00 0.00 0.00 0.00 0.00 0.50 0.81 0.94 0.90 1.03 0.94
Global Infrastructure (Lazard) 1.72 1.72 1.72 1.64 1.56 1.41 1.00 0.61 0.31 0.11 0.00 0.00
Global Direct Real Estate - PTF (UBS) 5.16 5.16 5.16 4.92 4.69 4.22 3.50 2.64 1.88 1.24 1.03 0.94
TOTAL - Alternative/Specialty Funds 6.88 6.88 1.882.062.253.134.065.005.636.256.566.88

After retirement
2055
2051 -
2010
2006 -
2015
2011 -
2020
2016 -
2025
2021 -
2030
2026 -
2035
2031 -
2040
2036 -
2045
2041 -
2050
2046 -
Before retirement
Investment funds 2005
and -
Composition of portfolios on January 22, 2016 (in percent)
Target retirement period
2056
and +Short Term Bond 0.00 0.00 0.00 0.00 0.00 0.00 0.00 5.63 9.75 14.70 18.88 19.38
Bond 14.62 14.62 14.87 16.34 18.00 20.37 23.51 25.31 28.33 30.63 29.43 30.33
Core Plus Bond (PIMCO) 9.75 9.75 9.91 10.89 12.00 13.60 15.68 16.88 18.89 20.43 19.63 20.23
Global Fixed Income (PIMCO) 8.13 8.13 7.72 7.79 7.50 8.50 8.31 8.44 8.03 7.72 7.55 7.56
TOTAL - Income Funds 32.50 32.50 77.5075.4973.4865.0056.2647.5042.4737.5035.0232.50Dividend 8.86 8.86 8.86 8.53 8.21 7.55 6.89 5.74 4.59 3.48 3.22 2.96
Canadian Focused Equity (Pyramis) 8.86 8.86 8.86 8.53 8.20 7.55 6.89 5.74 4.59 3.48 3.22 2.95
Canadian Equity Low Volatility (TD) 2.95 2.95 2.95 2.84 2.73 2.52 2.30 2.87 3.06 2.90 3.22 2.95
Canadian Equity Growth 5.91 5.91 5.91 5.69 5.47 5.03 4.59 2.87 1.53 0.58 0.00 0.00
Cdn Equity Small Cap (Montrusco) 2.95 2.95 2.95 2.84 2.73 2.52 2.30 1.91 1.53 1.16 1.07 0.98
TOTAL - Canadian Equity Funds 29.53 29.53 9.8410.7311.6015.3019.1322.9725.1727.3428.4329.53Global Equity Index ACWI (BlackRock) 7.38 7.38 7.38 7.11 6.84 6.29 5.74 4.79 3.83 2.90 2.68 2.46
Global Equity (Hexavest) 7.38 7.38 7.68 7.68 7.66 7.30 6.89 5.93 4.90 3.83 3.64 3.45
Global Equity (Templeton) 8.86 8.86 8.56 7.96 7.38 6.54 5.74 4.59 3.52 2.55 2.25 1.97
Global Equity Small Cap (DeutscheAWM)
1.48 1.48 1.48 1.42 1.37 1.26 1.15 0.96 0.77 0.58 0.54 0.49
Global Equity Small Cap (Mawer) 1.48 1.48 1.48 1.42 1.37 1.26 1.15 0.96 0.77 0.58 0.54 0.49
3
40 years +
32.50%
29.53%
29.53%
8.44%
35 years
32.50%
29.53%
29.53%
8.44%
Income Funds
Canadian Equity Funds
Foreign Equity Funds
Alternative/Specialty Funds
RETIREMENTRETIREMENT
73.48%
11.60%
11.60%
3.32%
5 years
65.00%
15.30%
15.32%
4.38%
10 years
56.26%
19.13%
19.14%
5.47%
15 years
47.50%
22.97%
22.97%
6.56%
20 years
42.47%
25.17%
25.17%
7.19%
25 years
37.50%
27.34%
27.35%
7.81%
30 years
35.02%
28.43%
28.43%
8.12%
RETIREMENT
73.48%
11.60%
11.60%
3.32%
Income Funds
Canadian Equity Funds
Foreign Equity Funds
Alternative/Specialty Funds
Evolution of the composition of portfoliosAttitude Portfolios are designed to maximize the potential growth of investments when retirement is far off and to gradually reduce the risk as retirementapproaches. The asset mix of portfolios evolves automatically to become more prudent over time.
The diagrams below illustrate the evolution of the target composition of MODERATE profile portfolios over time, for the period before retirement andonce retirement has begun.
YEARS
5 years
75.49%
10.73%
10.72%
3.06%
10 years
77.50%
9.84%
9.84%
2.82%
AFTER RETIREMENT
YEARS
HIGHER LOWER
BEFORE RETIREMENT
The asset mixes shown in this section are those of December 31, 2015. See section below for the current composition of portfolios.
MODERATE ProfileAttitude Portfolios
11
The composition of each portfolio is changed every 3 months so that it gradually reaches the next target asset mix (refer to the section above for the targetallocations of the portfolios over time).
The following table shows the current composition of MODERATE profile portfolios for each target retirement period.
Composition of portfolios on January 22, 2016
Growth potential and risk level

After retirement
2055
2051 -
2010
2006 -
2015
2011 -
2020
2016 -
2025
2021 -
2030
2026 -
2035
2031 -
2040
2036 -
2045
2041 -
2050
2046 -
Before retirement
Investment funds 2005
and -
Composition of portfolios on January 22, 2016 (in percent)
Target retirement period
2056
and +
Emerging Markets (Aberdeen) 2.95 2.95 2.95 2.84 2.73 2.52 2.30 1.91 1.53 1.16 1.07 0.98
TOTAL - Foreign Equity Funds 29.53 29.53 9.8410.7211.6015.3219.1422.9725.1727.3528.4329.53Balanced-Risk Allocation (Invesco) 0.00 0.00 0.00 0.00 0.00 0.00 0.66 1.09 1.31 1.33 1.53 1.41
Global Infrastructure (Lazard) 2.11 2.11 2.11 2.03 1.95 1.80 1.31 0.82 0.44 0.17 0.00 0.00
Global Direct Real Estate - PTF (UBS) 6.33 6.33 6.33 6.09 5.86 5.39 4.59 3.56 2.63 1.82 1.53 1.41
TOTAL - Alternative/Specialty Funds 8.44 8.44 2.823.063.324.385.476.567.197.818.128.44

After retirement
2055
2051 -
2010
2006 -
2015
2011 -
2020
2016 -
2025
2021 -
2030
2026 -
2035
2031 -
2040
2036 -
2045
2041 -
2050
2046 -
Before retirement
Investment funds 2005
and -
Composition of portfolios on January 22, 2016 (in percent)
Target retirement period
2056
and +Short Term Bond 0.00 0.00 0.00 0.00 0.00 0.00 0.00 4.50 8.25 13.00 16.88 17.50
Bond 9.00 9.00 9.15 10.48 12.02 14.40 17.33 20.23 23.98 27.09 26.31 27.38
Core Plus Bond (PIMCO) 6.00 6.00 6.10 7.00 8.00 9.60 11.55 13.50 15.98 18.07 17.55 18.27
Global Fixed Income (PIMCO) 5.00 5.00 4.75 5.01 5.00 6.00 6.13 6.75 6.79 6.83 6.75 6.83
TOTAL - Income Funds 20.00 20.00 69.9867.4964.9955.0044.9835.0130.0025.0222.4920.00Dividend 10.50 10.50 10.50 10.17 9.84 9.19 8.53 7.22 5.90 4.59 4.27 3.94
Canadian Focused Equity (Pyramis) 10.50 10.50 10.50 10.17 9.84 9.19 8.53 7.22 5.91 4.59 4.27 3.94
Canadian Equity Low Volatility (TD) 3.50 3.50 3.50 3.39 3.28 3.06 2.84 3.61 3.94 3.83 4.27 3.94
Canadian Equity Growth 7.00 7.00 7.00 6.78 6.56 6.13 5.69 3.61 1.97 0.77 0.00 0.00
Cdn Equity Small Cap (Montrusco) 3.50 3.50 3.50 3.39 3.28 3.06 2.84 2.41 1.97 1.53 1.42 1.31
TOTAL - Canadian Equity Funds 35.00 35.00 13.1314.2315.3119.6924.0728.4330.6332.8033.9035.00Global Equity Index ACWI (BlackRock) 8.75 8.75 8.75 8.48 8.20 7.66 7.11 6.02 4.92 3.83 3.56 3.28
Global Equity (Hexavest) 8.75 8.75 9.10 9.16 9.19 8.88 8.53 7.46 6.30 5.05 4.83 4.59
Global Equity (Templeton) 10.50 10.50 10.15 9.49 8.86 7.96 7.11 5.78 4.53 3.37 2.99 2.63
Global Equity Small Cap (DeutscheAWM)
1.75 1.75 1.75 1.70 1.64 1.53 1.42 1.20 0.98 0.77 0.71 0.66
Global Equity Small Cap (Mawer) 1.75 1.75 1.75 1.70 1.64 1.53 1.42 1.20 0.98 0.77 0.71 0.66
3
40 years +
20.00%
35.00%
35.00%
10.00%
35 years
20.00%
35.00%
35.00%
10.00%
Income Funds
Canadian Equity Funds
Foreign Equity Funds
Alternative/Specialty Funds
RETIREMENTRETIREMENT
64.99%
15.31%
15.32%
4.38%
5 years
55.00%
19.69%
19.68%
5.63%
10 years
44.98%
24.07%
24.07%
6.88%
15 years
35.01%
28.43%
28.43%
8.13%
20 years
30.00%
30.63%
30.62%
8.75%
25 years
25.02%
32.80%
32.81%
9.37%
30 years
22.49%
33.90%
33.92%
9.69%
RETIREMENT
64.99%
15.31%
15.32%
4.38%
Income Funds
Canadian Equity Funds
Foreign Equity Funds
Alternative/Specialty Funds
Evolution of the composition of portfoliosAttitude Portfolios are designed to maximize the potential growth of investments when retirement is far off and to gradually reduce the risk as retirementapproaches. The asset mix of portfolios evolves automatically to become more prudent over time.
The diagrams below illustrate the evolution of the target composition of BALANCED profile portfolios over time, for the period before retirement andonce retirement has begun.
YEARS
5 years
67.49%
14.23%
14.22%
4.06%
10 years
69.98%
13.13%
13.13%
3.76%
AFTER RETIREMENT
YEARS
HIGHER LOWER
BEFORE RETIREMENT
The asset mixes shown in this section are those of December 31, 2015. See section below for the current composition of portfolios.
BALANCED ProfileAttitude Portfolios
11
The composition of each portfolio is changed every 3 months so that it gradually reaches the next target asset mix (refer to the section above for the targetallocations of the portfolios over time).
The following table shows the current composition of BALANCED profile portfolios for each target retirement period.
Composition of portfolios on January 22, 2016
Growth potential and risk level
After retirement
2055
2051 -
2010
2006 -
2015
2011 -
2020
2016 -
2025
2021 -
2030
2026 -
2035
2031 -
2040
2036 -
2045
2041 -
2050
2046 -
Before retirement
Investment funds 2005
and -
Composition of portfolios on January 22, 2016 (in percent)
Target retirement period
2056
and +
Emerging Markets (Aberdeen) 3.50 3.50 3.50 3.39 3.28 3.06 2.84 2.41 1.97 1.53 1.42 1.31
TOTAL - Foreign Equity Funds 35.00 35.00 13.1314.2215.3219.6824.0728.4330.6232.8133.9235.00Balanced-Risk Allocation (Invesco) 0.00 0.00 0.00 0.00 0.00 0.00 0.81 1.38 1.69 1.75 2.03 1.88
Global Infrastructure (Lazard) 2.50 2.50 2.50 2.42 2.34 2.19 1.63 1.03 0.56 0.22 0.00 0.00
Global Direct Real Estate - PTF (UBS) 7.50 7.50 7.50 7.27 7.03 6.56 5.69 4.47 3.38 2.41 2.03 1.88
TOTAL - Alternative/Specialty Funds 10.00 10.00 3.764.064.385.636.888.138.759.379.6910.00

After retirement
2055
2051 -
2010
2006 -
2015
2011 -
2020
2016 -
2025
2021 -
2030
2026 -
2035
2031 -
2040
2036 -
2045
2041 -
2050
2046 -
Before retirement
Investment funds 2005
and -
Composition of portfolios on January 22, 2016 (in percent)
Target retirement period
2056
and +Short Term Bond 0.00 0.00 0.00 0.00 0.00 0.00 0.00 3.80 7.28 11.80 15.50 16.25
Bond 5.63 5.63 5.73 6.98 8.38 10.79 13.61 17.09 21.15 24.60 24.17 25.44
Core Plus Bond (PIMCO) 3.75 3.75 3.81 4.67 5.60 7.20 9.08 11.40 14.09 16.40 16.12 16.97
Global Fixed Income (PIMCO) 3.13 3.13 2.97 3.34 3.50 4.50 4.81 5.70 5.99 6.20 6.20 6.34
TOTAL - Income Funds 12.51 12.51 65.0061.9959.0048.5137.9927.5022.4917.4814.9912.51Dividend 11.49 11.49 11.49 11.15 10.83 10.17 9.51 8.14 6.76 5.38 4.99 4.59
Canadian Focused Equity (Pyramis) 11.48 11.48 11.48 11.16 10.83 10.17 9.52 8.14 6.76 5.38 4.99 4.59
Canadian Equity Low Volatility (TD) 3.83 3.83 3.83 3.72 3.61 3.39 3.17 4.07 4.51 4.48 4.99 4.59
Canadian Equity Growth 7.66 7.66 7.66 7.44 7.22 6.78 6.34 4.07 2.25 0.90 0.00 0.00
Cdn Equity Small Cap (Montrusco) 3.83 3.83 3.83 3.72 3.61 3.39 3.17 2.71 2.25 1.79 1.66 1.53
TOTAL - Canadian Equity Funds 38.29 38.29 15.3016.6317.9322.5327.1331.7133.9036.1037.1938.29Global Equity Index ACWI (BlackRock) 9.57 9.57 9.57 9.30 9.02 8.48 7.93 6.78 5.63 4.48 4.16 3.83
Global Equity (Hexavest) 9.57 9.57 9.95 10.04 10.11 9.83 9.52 8.41 7.21 5.92 5.65 5.36
Global Equity (Templeton) 11.48 11.48 11.10 10.41 9.75 8.82 7.93 6.51 5.18 3.95 3.49 3.06
Global Equity Small Cap (DeutscheAWM)
1.91 1.91 1.91 1.86 1.81 1.70 1.59 1.36 1.13 0.90 0.83 0.77
Global Equity Small Cap (Mawer) 1.91 1.91 1.91 1.86 1.81 1.70 1.59 1.36 1.13 0.90 0.83 0.77
3
40 years +
12.51%
38.29%
38.27%
10.93%
35 years
12.51%
38.29%
38.27%
10.93%
Income Funds
Canadian Equity Funds
Foreign Equity Funds
Alternative/Specialty Funds
RETIREMENTRETIREMENT
59.00%
17.93%
17.94%
5.13%
5 years
48.51%
22.53%
22.53%
6.43%
10 years
37.99%
27.13%
27.13%
7.75%
15 years
27.50%
31.71%
31.73%
9.06%
20 years
22.49%
33.90%
33.92%
9.69%
25 years
17.48%
36.10%
36.11%
10.31%
30 years
14.99%
37.19%
37.19%
10.63%
RETIREMENT
59.00%
17.93%
17.94%
5.13%
Income Funds
Canadian Equity Funds
Foreign Equity Funds
Alternative/Specialty Funds
Evolution of the composition of portfoliosAttitude Portfolios are designed to maximize the potential growth of investments when retirement is far off and to gradually reduce the risk as retirementapproaches. The asset mix of portfolios evolves automatically to become more prudent over time.
The diagrams below illustrate the evolution of the target composition of GROWTH profile portfolios over time, for the period before retirement and onceretirement has begun.
YEARS
5 years
61.99%
16.63%
16.62%
4.76%
10 years
65.00%
15.30%
15.32%
4.38%
AFTER RETIREMENT
YEARS
HIGHER LOWER
BEFORE RETIREMENT
The asset mixes shown in this section are those of December 31, 2015. See section below for the current composition of portfolios.
GROWTH ProfileAttitude Portfolios
11
The composition of each portfolio is changed every 3 months so that it gradually reaches the next target asset mix (refer to the section above for the targetallocations of the portfolios over time).
The following table shows the current composition of GROWTH profile portfolios for each target retirement period.
Composition of portfolios on January 22, 2016
Growth potential and risk level

After retirement
2055
2051 -
2010
2006 -
2015
2011 -
2020
2016 -
2025
2021 -
2030
2026 -
2035
2031 -
2040
2036 -
2045
2041 -
2050
2046 -
Before retirement
Investment funds 2005
and -
Composition of portfolios on January 22, 2016 (in percent)
Target retirement period
2056
and +
Emerging Markets (Aberdeen) 3.83 3.83 3.83 3.72 3.61 3.39 3.17 2.71 2.25 1.79 1.66 1.53
TOTAL - Foreign Equity Funds 38.27 38.27 15.3216.6217.9422.5327.1331.7333.9236.1137.1938.27Balanced-Risk Allocation (Invesco) 0.00 0.00 0.00 0.00 0.00 0.00 0.91 1.55 1.93 2.05 2.38 2.19
Global Infrastructure (Lazard) 2.73 2.73 2.73 2.66 2.58 2.42 1.81 1.16 0.64 0.26 0.00 0.00
Global Direct Real Estate - PTF (UBS) 8.20 8.20 8.20 7.97 7.73 7.27 6.34 5.04 3.86 2.82 2.38 2.19
TOTAL - Alternative/Specialty Funds 10.93 10.93 4.384.765.136.437.759.069.6910.3110.6310.93
After retirement
2055
2051 -
2010
2006 -
2015
2011 -
2020
2016 -
2025
2021 -
2030
2026 -
2035
2031 -
2040
2036 -
2045
2041 -
2050
2046 -
Before retirement
Investment funds 2005
and -
Composition of portfolios on January 22, 2016 (in percent)
Target retirement period
2056
and +Short Term Bond 0.00 0.00 0.00 0.00 0.00 0.00 0.00 3.10 6.30 10.60 14.13 15.00
Bond 2.23 2.23 2.26 3.50 4.79 7.18 9.90 13.92 18.28 22.09 22.03 23.47
Core Plus Bond (PIMCO) 1.50 1.50 1.53 2.33 3.20 4.80 6.60 9.30 12.21 14.73 14.69 15.66
Global Fixed Income (PIMCO) 1.25 1.25 1.19 1.67 2.00 3.00 3.50 4.65 5.19 5.57 5.65 5.85
TOTAL - Income Funds 4.98 4.98 59.9856.5052.9941.9830.9720.0014.989.997.504.98Dividend 12.47 12.47 12.47 12.14 11.81 11.16 10.50 9.06 7.61 6.17 5.71 5.25
Canadian Focused Equity (Pyramis) 12.47 12.47 12.47 12.14 11.81 11.16 10.50 9.06 7.61 6.17 5.71 5.25
Canadian Equity Low Volatility (TD) 4.16 4.16 4.16 4.05 3.94 3.72 3.50 4.53 5.08 5.14 5.71 5.25
Canadian Equity Growth 8.31 8.31 8.31 8.09 7.88 7.44 7.00 4.53 2.54 1.03 0.00 0.00
Cdn Equity Small Cap (Montrusco) 4.16 4.16 4.16 4.05 3.94 3.72 3.50 3.02 2.54 2.06 1.90 1.75
TOTAL - Canadian Equity Funds 41.57 41.57 17.5019.0320.5725.3830.2035.0037.2039.3840.4741.57Global Equity Index ACWI (BlackRock) 10.39 10.39 10.39 10.12 9.84 9.30 8.75 7.55 6.34 5.14 4.76 4.38
Global Equity (Hexavest) 10.39 10.39 10.81 10.93 11.03 10.78 10.50 9.36 8.12 6.79 6.47 6.13
Global Equity (Templeton) 12.47 12.47 12.05 11.33 10.63 9.67 8.75 7.25 5.84 4.52 4.00 3.50
Global Equity Small Cap (DeutscheAWM)
2.08 2.08 2.08 2.02 1.97 1.86 1.75 1.51 1.27 1.03 0.95 0.88
Global Equity Small Cap (Mawer) 2.08 2.08 2.08 2.02 1.97 1.86 1.75 1.51 1.27 1.03 0.95 0.88
3
40 years +
4.98%
41.57%
41.57%
11.88%
35 years
4.98%
41.57%
41.57%
11.88%
Income Funds
Canadian Equity Funds
Foreign Equity Funds
Alternative/Specialty Funds
RETIREMENTRETIREMENT
52.99%
20.57%
20.57%
5.87%
5 years
41.98%
25.38%
25.38%
7.26%
10 years
30.97%
30.20%
30.20%
8.63%
15 years
20.00%
35.00%
35.00%
10.00%
20 years
14.98%
37.20%
37.19%
10.63%
25 years
9.99%
39.38%
39.38%
11.25%
30 years
7.50%
40.47%
40.47%
11.56%
RETIREMENT
52.99%
20.57%
20.57%
5.87%
Income Funds
Canadian Equity Funds
Foreign Equity Funds
Alternative/Specialty Funds
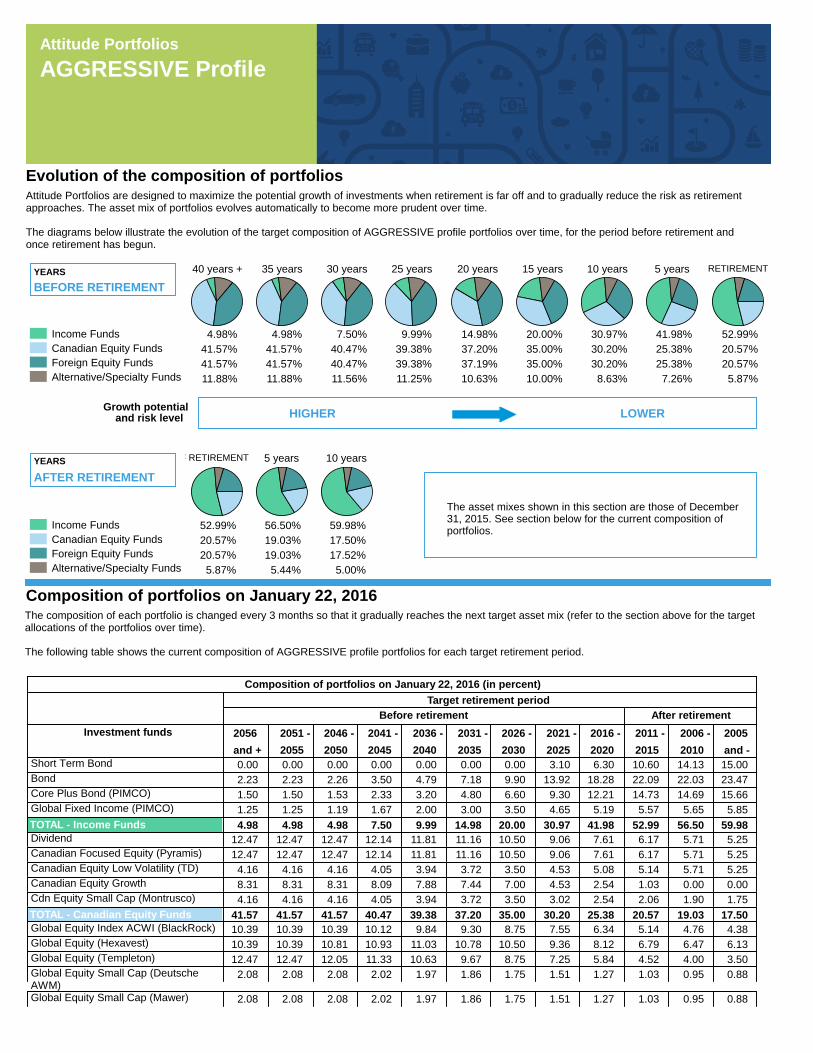
Evolution of the composition of portfoliosAttitude Portfolios are designed to maximize the potential growth of investments when retirement is far off and to gradually reduce the risk as retirementapproaches. The asset mix of portfolios evolves automatically to become more prudent over time.
The diagrams below illustrate the evolution of the target composition of AGGRESSIVE profile portfolios over time, for the period before retirement andonce retirement has begun.
YEARS
5 years
56.50%
19.03%
19.03%
5.44%
10 years
59.98%
17.50%
17.52%
5.00%
AFTER RETIREMENT
YEARS
HIGHER LOWER
BEFORE RETIREMENT
The asset mixes shown in this section are those of December 31, 2015. See section below for the current composition of portfolios.
AGGRESSIVE ProfileAttitude Portfolios
11
The composition of each portfolio is changed every 3 months so that it gradually reaches the next target asset mix (refer to the section above for the targetallocations of the portfolios over time).
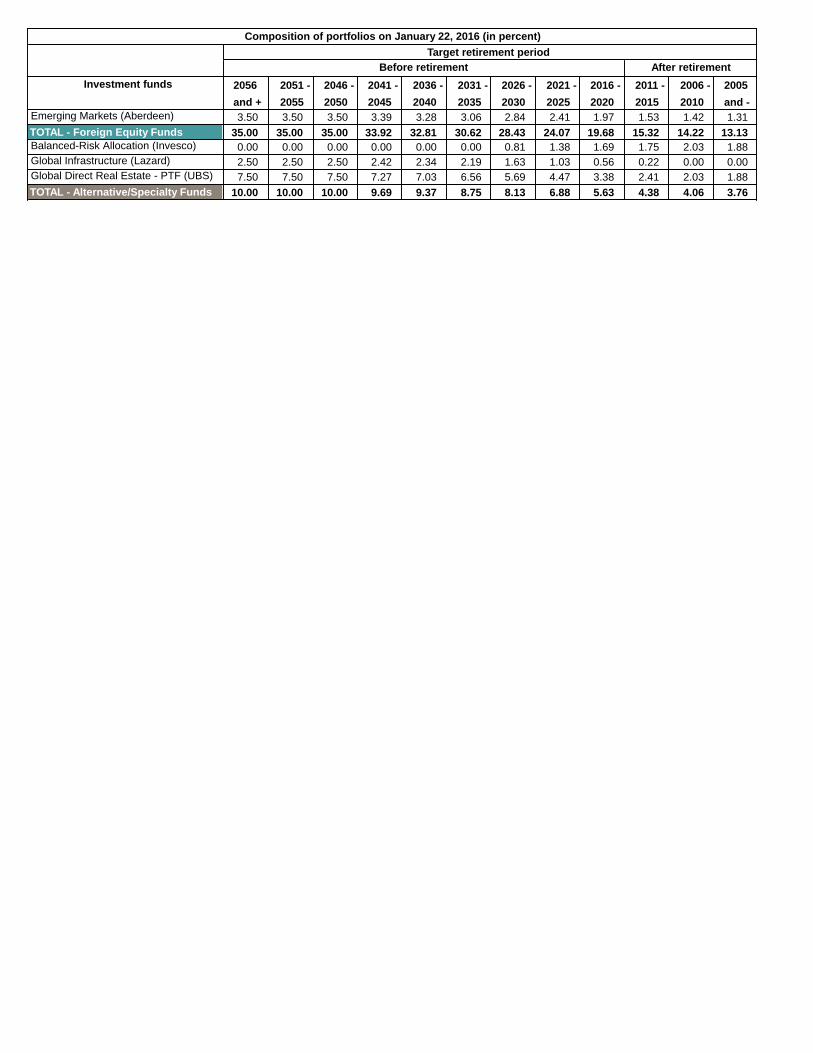
The following table shows the current composition of AGGRESSIVE profile portfolios for each target retirement period.
Composition of portfolios on January 22, 2016
Growth potential and risk level

After retirement
2055
2051 -
2010
2006 -
2015
2011 -
2020
2016 -
2025
2021 -
2030
2026 -
2035
2031 -
2040
2036 -
2045
2041 -
2050
2046 -
Before retirement
Investment funds 2005
and -
Composition of portfolios on January 22, 2016 (in percent)
Target retirement period
2056
and +
Emerging Markets (Aberdeen) 4.16 4.16 4.16 4.05 3.94 3.72 3.50 3.02 2.54 2.06 1.90 1.75
TOTAL - Foreign Equity Funds 41.57 41.57 17.5219.0320.5725.3830.2035.0037.1939.3840.4741.57Balanced-Risk Allocation (Invesco) 0.00 0.00 0.00 0.00 0.00 0.00 1.00 1.73 2.18 2.35 2.72 2.50
Global Infrastructure (Lazard) 2.97 2.97 2.97 2.89 2.81 2.66 2.00 1.29 0.73 0.29 0.00 0.00
Global Direct Real Estate - PTF (UBS) 8.91 8.91 8.91 8.67 8.44 7.97 7.00 5.61 4.35 3.23 2.72 2.50
TOTAL - Alternative/Specialty Funds 11.88 11.88 5.005.445.877.268.6310.0010.6311.2511.5611.88
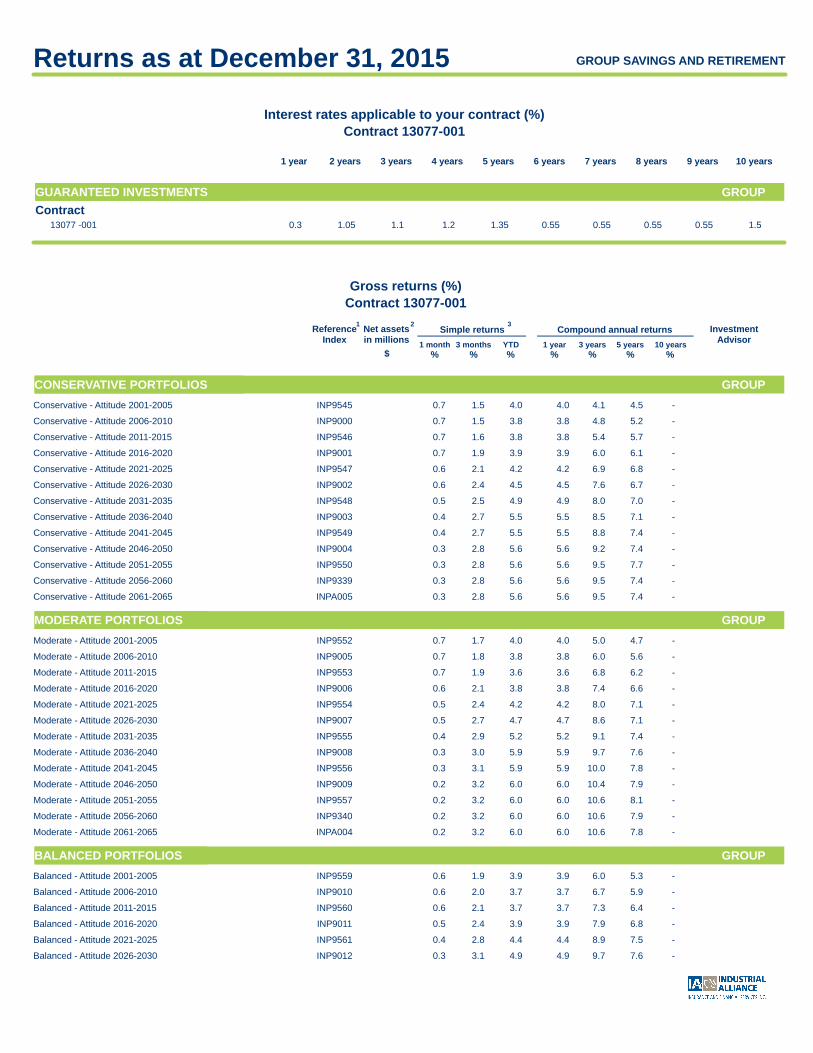
Returns as at December 31, 2015 GROUP SAVINGS AND RETIREMENT
Contract
GUARANTEED INVESTMENTS
1 year 2 years 3 years 4 years 5 years 6 years 7 years 8 years 9 years 10 years
Interest rates applicable to your contract (%)
Contract 13077-001
GROUP
1.2 1.35 0.55 0.55 0.55 0.55 0.3 1.05 1.1 1.5 13077 -001
InvestmentAdvisor
Simple returns Compound annual returns3
%% %%% %YTD3 months1 month 1 year 3 years 5 years 10 years
$
Net assetsin millions
2Reference
Index
Gross returns (%)
Contract 13077-001
%
1
CONSERVATIVE PORTFOLIOS GROUP
Conservative - Attitude 2001-2005 4.0 4.0 1.5 0.7 - 4.5 4.1 INP9545
Conservative - Attitude 2006-2010 3.8 3.8 1.5 0.7 - 5.2 4.8 INP9000
Conservative - Attitude 2011-2015 3.8 3.8 1.6 0.7 - 5.7 5.4 INP9546
Conservative - Attitude 2016-2020 3.9 3.9 1.9 0.7 - 6.1 6.0 INP9001
Conservative - Attitude 2021-2025 4.2 4.2 2.1 0.6 - 6.8 6.9 INP9547
Conservative - Attitude 2026-2030 4.5 4.5 2.4 0.6 - 6.7 7.6 INP9002
Conservative - Attitude 2031-2035 4.9 4.9 2.5 0.5 - 7.0 8.0 INP9548
Conservative - Attitude 2036-2040 5.5 5.5 2.7 0.4 - 7.1 8.5 INP9003
Conservative - Attitude 2041-2045 5.5 5.5 2.7 0.4 - 7.4 8.8 INP9549
Conservative - Attitude 2046-2050 5.6 5.6 2.8 0.3 - 7.4 9.2 INP9004
Conservative - Attitude 2051-2055 5.6 5.6 2.8 0.3 - 7.7 9.5 INP9550
Conservative - Attitude 2056-2060 5.6 5.6 2.8 0.3 - 7.4 9.5 INP9339
Conservative - Attitude 2061-2065 5.6 5.6 2.8 0.3 - 7.4 9.5 INPA005
MODERATE PORTFOLIOS GROUP
Moderate - Attitude 2001-2005 4.0 4.0 1.7 0.7 - 4.7 5.0 INP9552
Moderate - Attitude 2006-2010 3.8 3.8 1.8 0.7 - 5.6 6.0 INP9005
Moderate - Attitude 2011-2015 3.6 3.6 1.9 0.7 - 6.2 6.8 INP9553
Moderate - Attitude 2016-2020 3.8 3.8 2.1 0.6 - 6.6 7.4 INP9006
Moderate - Attitude 2021-2025 4.2 4.2 2.4 0.5 - 7.1 8.0 INP9554
Moderate - Attitude 2026-2030 4.7 4.7 2.7 0.5 - 7.1 8.6 INP9007
Moderate - Attitude 2031-2035 5.2 5.2 2.9 0.4 - 7.4 9.1 INP9555
Moderate - Attitude 2036-2040 5.9 5.9 3.0 0.3 - 7.6 9.7 INP9008
Moderate - Attitude 2041-2045 5.9 5.9 3.1 0.3 - 7.8 10.0 INP9556
Moderate - Attitude 2046-2050 6.0 6.0 3.2 0.2 - 7.9 10.4 INP9009
Moderate - Attitude 2051-2055 6.0 6.0 3.2 0.2 - 8.1 10.6 INP9557
Moderate - Attitude 2056-2060 6.0 6.0 3.2 0.2 - 7.9 10.6 INP9340
Moderate - Attitude 2061-2065 6.0 6.0 3.2 0.2 - 7.8 10.6 INPA004
BALANCED PORTFOLIOS GROUP
Balanced - Attitude 2001-2005 3.9 3.9 1.9 0.6 - 5.3 6.0 INP9559
Balanced - Attitude 2006-2010 3.7 3.7 2.0 0.6 - 5.9 6.7 INP9010
Balanced - Attitude 2011-2015 3.7 3.7 2.1 0.6 - 6.4 7.3 INP9560
Balanced - Attitude 2016-2020 3.9 3.9 2.4 0.5 - 6.8 7.9 INP9011
Balanced - Attitude 2021-2025 4.4 4.4 2.8 0.4 - 7.5 8.9 INP9561
Balanced - Attitude 2026-2030 4.9 4.9 3.1 0.3 - 7.6 9.7 INP9012


Returns as at December 31, 2015 GROUP SAVINGS AND RETIREMENT
InvestmentAdvisor
Simple returns Compound annual returns3
%% %%% %YTD3 months1 month 1 year 3 years 5 years 10 years
$
Net assetsin millions
2Reference
Index
Gross returns (%)
Contract 13077-001
%
1
BALANCED PORTFOLIOS GROUP
Balanced - Attitude 2031-2035 5.5 5.5 3.3 0.3 - 8.0 10.2 INP9562
Balanced - Attitude 2036-2040 6.2 6.2 3.4 0.2 - 8.0 10.9 INP9013
Balanced - Attitude 2041-2045 6.3 6.3 3.5 0.2 - 8.2 11.1 INP9563
Balanced - Attitude 2046-2050 6.4 6.4 3.5 0.1 - 8.3 11.6 INP9014
Balanced - Attitude 2051-2055 6.4 6.4 3.5 0.1 - 8.5 11.8 INP9564
Balanced - Attitude 2056-2060 6.4 6.4 3.5 0.1 - 8.3 11.8 INP9341
Balanced - Attitude 2061-2065 6.4 6.4 3.5 0.1 - 8.3 11.8 INPA003
GROWTH PORTFOLIOS GROUP
Growth - Attitude 2001-2005 3.8 3.8 2.0 0.6 - 5.7 6.9 INP9566
Growth - Attitude 2006-2010 3.6 3.6 2.1 0.6 - 6.3 7.7 INP9015
Growth - Attitude 2011-2015 3.6 3.6 2.3 0.6 - 6.8 8.2 INP9567
Growth - Attitude 2016-2020 3.8 3.8 2.6 0.5 - 7.1 8.9 INP9016
Growth - Attitude 2021-2025 4.4 4.4 2.9 0.4 - 7.9 9.8 INP9568
Growth - Attitude 2026-2030 5.0 5.0 3.3 0.3 - 8.0 10.7 INP9017
Growth - Attitude 2031-2035 5.6 5.6 3.5 0.2 - 8.4 11.3 INP9569
Growth - Attitude 2036-2040 6.5 6.5 3.6 0.2 - 8.4 12.0 INP9018
Growth - Attitude 2041-2045 6.6 6.6 3.7 0.1 - 8.6 12.3 INP9570
Growth - Attitude 2046-2050 6.6 6.6 3.7 0.1 - 8.7 12.7 INP9019
Growth - Attitude 2051-2055 6.6 6.6 3.7 0.1 - 8.9 12.9 INP9571
Growth - Attitude 2056-2060 6.6 6.6 3.7 0.1 - 8.7 12.9 INP9342
Growth - Attitude 2061-2065 6.6 6.6 3.7 0.1 - 8.7 12.9 INPA002
AGGRESSIVE PORTFOLIOS GROUP
Aggressive - Attitude 2001-2005 3.8 3.8 2.2 0.6 - 5.9 7.7 INP9573
Aggressive - Attitude 2006-2010 3.4 3.4 2.3 0.5 - 6.7 8.6 INP9020
Aggressive - Attitude 2011-2015 3.4 3.4 2.4 0.5 - 7.1 9.1 INP9574
Aggressive - Attitude 2016-2020 3.7 3.7 2.8 0.4 - 7.5 9.8 INP9021
Aggressive - Attitude 2021-2025 4.4 4.4 3.1 0.3 - 8.2 10.8 INP9575
Aggressive - Attitude 2026-2030 5.0 5.0 3.5 0.2 - 8.3 11.7 INP9022
Aggressive - Attitude 2031-2035 5.7 5.7 3.7 0.2 - 8.8 12.4 INP9576
Aggressive - Attitude 2036-2040 6.7 6.7 3.8 0.1 - 8.8 13.1 INP9023
Aggressive - Attitude 2041-2045 6.8 6.8 3.9 0.1 - 9.0 13.4 INP9577
Aggressive - Attitude 2046-2050 6.9 6.9 4.0 0.0 - 9.1 13.8 INP9024
Aggressive - Attitude 2051-2055 6.9 6.9 4.0 0.0 - 9.3 14.1 INP9578
Aggressive - Attitude 2056-2060 6.9 6.9 4.0 0.0 - 9.1 14.1 INP9343
Aggressive - Attitude 2061-2065 6.9 6.9 3.9 0.0 - 9.1 14.0 INPA001
INCOME FUNDS GROUP
Industrial Alliance020 Bond 3.7 3.7 1.1 1.1 201.6 5.3 5.1 3.8 IN021
Industrial Alliance070 Money Market 0.7 0.7 0.1 0.0 21.3 1.8 1.0 0.9 IN018
Industrial Alliance170 Short Term Bond 3.0 3.0 0.6 0.5 22.9 3.9 3.2 2.7 IN019
PIMCO893 Global Fixed Income (PIMCO) 3.4 3.4 0.7 (0.8) 11.6 - - 6.1* IN124
CANADIAN EQUITY FUNDS GROUP
Industrial Alliance160 Dividend (1.8) (1.8) 2.6 (2.0) 60.7 7.1 6.9 8.9 IN026
QV Investors Inc.541 Canadian Equity Small Cap (QV) (4.2) (4.2) 2.0 (3.0) 22.1 9.4* 12.6 13.8 IN037
TD753 Canadian Equity Index (TD) (8.2) (8.2) (1.4) (3.1) 12.0 4.4* 2.3* 4.7 IN024


Returns as at December 31, 2015 GROUP SAVINGS AND RETIREMENT
InvestmentAdvisor
Simple returns Compound annual returns3
%% %%% %YTD3 months1 month 1 year 3 years 5 years 10 years
$
Net assetsin millions
2Reference
Index
Gross returns (%)
Contract 13077-001
%
1
CANADIAN EQUITY FUNDS GROUP
Pyramis871 Canadian Focused Equity (Pyramis) 2.2 2.2 (1.0) (2.9) 16.0 8.5* 8.9* 14.0 IN031
FOREIGN EQUITY FUNDS GROUP
Aberdeen120 Global Equity (Aberdeen) 5.2 5.2 5.7 0.5 11.9 - 10.4* 12.3* IN008
Mawer130 Global Equity Small Cap (Mawer) 30.7 30.7 8.7 3.7 16.0 - 24.6* 30.7* IN079
Templeton465 Global Equity (Templeton) 15.5 15.5 8.5 0.7 26.5 7.3 15.1 22.7 IN008
The above returns are gross returns and do not take into account management and administration fees. Past performance is not a guarantee of future returns.
%
10 years
%
5 years
%
3 years
%
1 yearYTD
%%%
1 month 3 months
Compound annual returnsSimple returns3
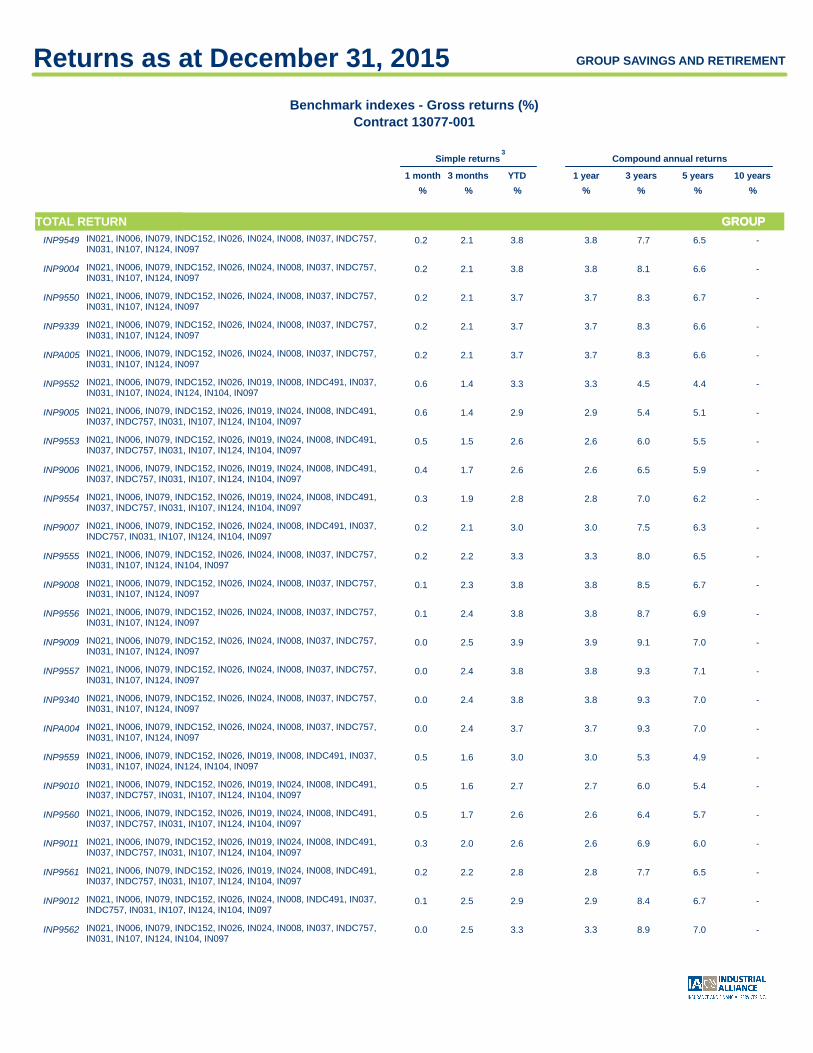
TOTAL RETURN GROUP
Benchmark indexes - Gross returns (%)
Contract 13077-001
GROUPTOTAL RETURN
Money market index
0.0 0.6 0.1 IN018 0.6 0.8 0.9 1.7 FTSE TMX Canada 91 Day T-Bill Index
Bonds indexes
0.5 2.6 0.5 IN019 2.6 2.5 2.8 3.9 FTSE TMX Canada Short Term Bond Index
1.1 3.5 1.0 IN021 3.5 3.6 4.8 5.0 FTSE TMX Canada Universe Bond Index
(0.3) 1.1 (0.6) IN124 1.1 2.2 - - Barclays U.S. Aggregate Index (CAD Hedged)
Equity indexes
2.0 18.3 9.0 IN008 18.3 22.4 14.9 6.8 MSCI - World Index (Can. $) (net ret.)
(3.1) (8.3) (1.4) IN024 (8.3) 4.6 2.3 4.4 S&P/TSX Composite Index
(3.1) (7.8) (1.7) IN026 (7.8) 5.5 2.9 4.7 S&P/TSX 60 Index
(3.1) (8.3) (1.4) IN031 (8.3) 4.6 2.3 4.4 S&P/TSX Capped Composite Index
(1.6) (13.3) 1.1 IN037 (13.3) (3.1) (5.7) 0.0 S&P/TSX SmallCap Index
1.2 19.4 7.8 IN079 19.4 23.7 15.4 8.3 MSCI - World Small Cap Index (Can. $)
Composite indexes (portfolios) 4
0.7 3.5 1.1 INP9545 3.5 3.7 4.2 - IN021, IN006, IN079, INDC152, IN026, IN019, IN008, INDC491, IN037, IN031, IN107, IN024, IN124, IN104, IN097
0.6 3.2 1.2 INP9000 3.2 4.4 4.7 - IN021, IN006, IN079, INDC152, IN026, IN019, IN024, IN008, INDC491, IN037, INDC757, IN031, IN107, IN124, IN104, IN097
0.6 3.0 1.2 INP9546 3.0 4.8 5.1 - IN021, IN006, IN079, INDC152, IN026, IN019, IN024, IN008, INDC491, IN037, INDC757, IN031, IN107, IN124, IN104, IN097
0.6 3.0 1.4 INP9001 3.0 5.3 5.4 - IN021, IN006, IN079, INDC152, IN026, IN019, IN024, IN008, INDC491, IN037, INDC757, IN031, IN107, IN124, IN104, IN097
0.5 3.1 1.6 INP9547 3.1 6.1 5.9 - IN021, IN006, IN079, INDC152, IN026, IN019, IN024, IN008, INDC491, IN037, INDC757, IN031, IN107, IN124, IN104, IN097
0.4 3.1 1.8 INP9002 3.1 6.7 6.0 - IN021, IN006, IN079, INDC152, IN026, IN024, IN008, INDC491, IN037, INDC757, IN031, IN107, IN124, IN104, IN097
0.3 3.3 1.9 INP9548 3.3 7.1 6.2 - IN021, IN006, IN079, INDC152, IN026, IN024, IN008, IN037, INDC757, IN031, IN107, IN124, IN104, IN097
0.2 3.8 2.0 INP9003 3.8 7.5 6.4 - IN021, IN006, IN079, INDC152, IN026, IN024, IN008, IN037, INDC757, IN031, IN107, IN124, IN097

Returns as at December 31, 2015 GROUP SAVINGS AND RETIREMENT
%
10 years
%
5 years
%
3 years
%
1 yearYTD
%%%
1 month 3 months
Compound annual returnsSimple returns3
TOTAL RETURN GROUP
Benchmark indexes - Gross returns (%)
Contract 13077-001
GROUPTOTAL RETURN
0.2 3.8 2.1 INP9549 3.8 7.7 6.5 - IN021, IN006, IN079, INDC152, IN026, IN024, IN008, IN037, INDC757, IN031, IN107, IN124, IN097
0.2 3.8 2.1 INP9004 3.8 8.1 6.6 - IN021, IN006, IN079, INDC152, IN026, IN024, IN008, IN037, INDC757, IN031, IN107, IN124, IN097
0.2 3.7 2.1 INP9550 3.7 8.3 6.7 - IN021, IN006, IN079, INDC152, IN026, IN024, IN008, IN037, INDC757, IN031, IN107, IN124, IN097
0.2 3.7 2.1 INP9339 3.7 8.3 6.6 - IN021, IN006, IN079, INDC152, IN026, IN024, IN008, IN037, INDC757, IN031, IN107, IN124, IN097
0.2 3.7 2.1 INPA005 3.7 8.3 6.6 - IN021, IN006, IN079, INDC152, IN026, IN024, IN008, IN037, INDC757, IN031, IN107, IN124, IN097
0.6 3.3 1.4 INP9552 3.3 4.5 4.4 - IN021, IN006, IN079, INDC152, IN026, IN019, IN008, INDC491, IN037, IN031, IN107, IN024, IN124, IN104, IN097
0.6 2.9 1.4 INP9005 2.9 5.4 5.1 - IN021, IN006, IN079, INDC152, IN026, IN019, IN024, IN008, INDC491, IN037, INDC757, IN031, IN107, IN124, IN104, IN097
0.5 2.6 1.5 INP9553 2.6 6.0 5.5 - IN021, IN006, IN079, INDC152, IN026, IN019, IN024, IN008, INDC491, IN037, INDC757, IN031, IN107, IN124, IN104, IN097
0.4 2.6 1.7 INP9006 2.6 6.5 5.9 - IN021, IN006, IN079, INDC152, IN026, IN019, IN024, IN008, INDC491, IN037, INDC757, IN031, IN107, IN124, IN104, IN097
0.3 2.8 1.9 INP9554 2.8 7.0 6.2 - IN021, IN006, IN079, INDC152, IN026, IN019, IN024, IN008, INDC491, IN037, INDC757, IN031, IN107, IN124, IN104, IN097
0.2 3.0 2.1 INP9007 3.0 7.5 6.3 - IN021, IN006, IN079, INDC152, IN026, IN024, IN008, INDC491, IN037, INDC757, IN031, IN107, IN124, IN104, IN097
0.2 3.3 2.2 INP9555 3.3 8.0 6.5 - IN021, IN006, IN079, INDC152, IN026, IN024, IN008, IN037, INDC757, IN031, IN107, IN124, IN104, IN097
0.1 3.8 2.3 INP9008 3.8 8.5 6.7 - IN021, IN006, IN079, INDC152, IN026, IN024, IN008, IN037, INDC757, IN031, IN107, IN124, IN097
0.1 3.8 2.4 INP9556 3.8 8.7 6.9 - IN021, IN006, IN079, INDC152, IN026, IN024, IN008, IN037, INDC757, IN031, IN107, IN124, IN097
0.0 3.9 2.5 INP9009 3.9 9.1 7.0 - IN021, IN006, IN079, INDC152, IN026, IN024, IN008, IN037, INDC757, IN031, IN107, IN124, IN097
0.0 3.8 2.4 INP9557 3.8 9.3 7.1 - IN021, IN006, IN079, INDC152, IN026, IN024, IN008, IN037, INDC757, IN031, IN107, IN124, IN097
0.0 3.8 2.4 INP9340 3.8 9.3 7.0 - IN021, IN006, IN079, INDC152, IN026, IN024, IN008, IN037, INDC757, IN031, IN107, IN124, IN097
0.0 3.7 2.4 INPA004 3.7 9.3 7.0 - IN021, IN006, IN079, INDC152, IN026, IN024, IN008, IN037, INDC757, IN031, IN107, IN124, IN097
0.5 3.0 1.6 INP9559 3.0 5.3 4.9 - IN021, IN006, IN079, INDC152, IN026, IN019, IN008, INDC491, IN037, IN031, IN107, IN024, IN124, IN104, IN097
0.5 2.7 1.6 INP9010 2.7 6.0 5.4 - IN021, IN006, IN079, INDC152, IN026, IN019, IN024, IN008, INDC491, IN037, INDC757, IN031, IN107, IN124, IN104, IN097
0.5 2.6 1.7 INP9560 2.6 6.4 5.7 - IN021, IN006, IN079, INDC152, IN026, IN019, IN024, IN008, INDC491, IN037, INDC757, IN031, IN107, IN124, IN104, IN097
0.3 2.6 2.0 INP9011 2.6 6.9 6.0 - IN021, IN006, IN079, INDC152, IN026, IN019, IN024, IN008, INDC491, IN037, INDC757, IN031, IN107, IN124, IN104, IN097
0.2 2.8 2.2 INP9561 2.8 7.7 6.5 - IN021, IN006, IN079, INDC152, IN026, IN019, IN024, IN008, INDC491, IN037, INDC757, IN031, IN107, IN124, IN104, IN097
0.1 2.9 2.5 INP9012 2.9 8.4 6.7 - IN021, IN006, IN079, INDC152, IN026, IN024, IN008, INDC491, IN037, INDC757, IN031, IN107, IN124, IN104, IN097
0.0 3.3 2.5 INP9562 3.3 8.9 7.0 - IN021, IN006, IN079, INDC152, IN026, IN024, IN008, IN037, INDC757, IN031, IN107, IN124, IN104, IN097


Returns as at December 31, 2015 GROUP SAVINGS AND RETIREMENT
%
10 years
%
5 years
%
3 years
%
1 yearYTD
%%%
1 month 3 months
Compound annual returnsSimple returns3
TOTAL RETURN GROUP
Benchmark indexes - Gross returns (%)
Contract 13077-001
GROUPTOTAL RETURN
0.0 3.9 2.7 INP9013 3.9 9.4 7.1 - IN021, IN006, IN079, INDC152, IN026, IN024, IN008, IN037, INDC757, IN031, IN107, IN124, IN097
(0.1) 3.9 2.7 INP9563 3.9 9.7 7.2 - IN021, IN006, IN079, INDC152, IN026, IN024, IN008, IN037, INDC757, IN031, IN107, IN124, IN097
(0.1) 3.9 2.8 INP9014 3.9 10.0 7.3 - IN021, IN006, IN079, INDC152, IN026, IN024, IN008, IN037, INDC757, IN031, IN107, IN124, IN097
(0.1) 3.8 2.8 INP9564 3.8 10.2 7.4 - IN021, IN006, IN079, INDC152, IN026, IN024, IN008, IN037, INDC757, IN031, IN107, IN124, IN097
(0.1) 3.8 2.8 INP9341 3.8 10.2 7.3 - IN021, IN006, IN079, INDC152, IN026, IN024, IN008, IN037, INDC757, IN031, IN107, IN124, IN097
(0.1) 3.8 2.8 INPA003 3.8 10.2 7.3 - IN021, IN006, IN079, INDC152, IN026, IN024, IN008, IN037, INDC757, IN031, IN107, IN124, IN097
0.4 2.7 1.7 INP9566 2.7 6.1 5.2 - IN021, IN006, IN079, INDC152, IN026, IN019, IN008, INDC491, IN037, IN031, IN107, IN024, IN124, IN104, IN097
0.4 2.4 1.8 INP9015 2.4 6.7 5.7 - IN021, IN006, IN079, INDC152, IN026, IN019, IN024, IN008, INDC491, IN037, INDC757, IN031, IN107, IN124, IN104, IN097
0.4 2.3 1.9 INP9567 2.3 7.2 6.0 - IN021, IN006, IN079, INDC152, IN026, IN019, IN024, IN008, INDC491, IN037, INDC757, IN031, IN107, IN124, IN104, IN097
0.3 2.3 2.2 INP9016 2.3 7.7 6.3 - IN021, IN006, IN079, INDC152, IN026, IN019, IN024, IN008, INDC491, IN037, INDC757, IN031, IN107, IN124, IN104, IN097
0.1 2.6 2.4 INP9568 2.6 8.5 6.7 - IN021, IN006, IN079, INDC152, IN026, IN019, IN024, IN008, INDC491, IN037, INDC757, IN031, IN107, IN124, IN104, IN097
0.0 2.8 2.7 INP9017 2.8 9.2 6.9 - IN021, IN006, IN079, INDC152, IN026, IN024, IN008, INDC491, IN037, INDC757, IN031, IN107, IN124, IN104, IN097
(0.1) 3.2 2.7 INP9569 3.2 9.7 7.2 - IN021, IN006, IN079, INDC152, IN026, IN024, IN008, IN037, INDC757, IN031, IN107, IN124, IN104, IN097
(0.1) 3.9 2.9 INP9018 3.9 10.4 7.4 - IN021, IN006, IN079, INDC152, IN026, IN024, IN008, IN037, INDC757, IN031, IN107, IN124, IN097
(0.2) 3.9 2.9 INP9570 3.9 10.6 7.5 - IN021, IN006, IN079, INDC152, IN026, IN024, IN008, IN037, INDC757, IN031, IN107, IN124, IN097
(0.2) 3.9 3.0 INP9019 3.9 11.0 7.6 - IN021, IN006, IN079, INDC152, IN026, IN024, IN008, IN037, INDC757, IN031, IN107, IN124, IN097
(0.2) 3.8 3.0 INP9571 3.8 11.2 7.7 - IN021, IN006, IN079, INDC152, IN026, IN024, IN008, IN037, INDC757, IN031, IN107, IN124, IN097
(0.2) 3.8 3.0 INP9342 3.8 11.2 7.6 - IN021, IN006, IN079, INDC152, IN026, IN024, IN008, IN037, INDC757, IN031, IN107, IN124, IN097
(0.2) 3.8 3.0 INPA002 3.8 11.1 7.6 - IN021, IN006, IN079, INDC152, IN026, IN024, IN008, IN037, INDC757, IN031, IN107, IN124, IN097
0.4 2.6 1.9 INP9573 2.6 6.8 5.4 - IN021, IN006, IN079, INDC152, IN026, IN019, IN008, INDC491, IN037, IN031, IN107, IN024, IN124, IN104, IN097
0.3 2.0 2.1 INP9574 2.0 8.0 6.3 - IN021, IN006, IN079, INDC152, IN026, IN019, IN024, IN008, INDC491, IN037, INDC757, IN031, IN107, IN124, IN104, IN097
0.4 2.1 2.0 INP9020 2.1 7.5 6.0 - IN021, IN006, IN079, INDC152, IN026, IN019, IN024, IN008, INDC491, IN037, INDC757, IN031, IN107, IN124, IN104, IN097
0.2 2.0 2.3 INP9021 2.0 8.5 6.5 - IN021, IN006, IN079, INDC152, IN026, IN019, IN024, IN008, INDC491, IN037, INDC757, IN031, IN107, IN124, IN104, IN097
0.0 2.3 2.6 INP9575 2.3 9.3 7.0 - IN021, IN006, IN079, INDC152, IN026, IN019, IN024, IN008, INDC491, IN037, INDC757, IN031, IN107, IN124, IN104, IN097
(0.1) 2.6 2.9 INP9022 2.6 10.0 7.2 - IN021, IN006, IN079, INDC152, IN026, IN024, IN008, INDC491, IN037, INDC757, IN031, IN107, IN124, IN104, IN097


Returns as at December 31, 2015 GROUP SAVINGS AND RETIREMENT
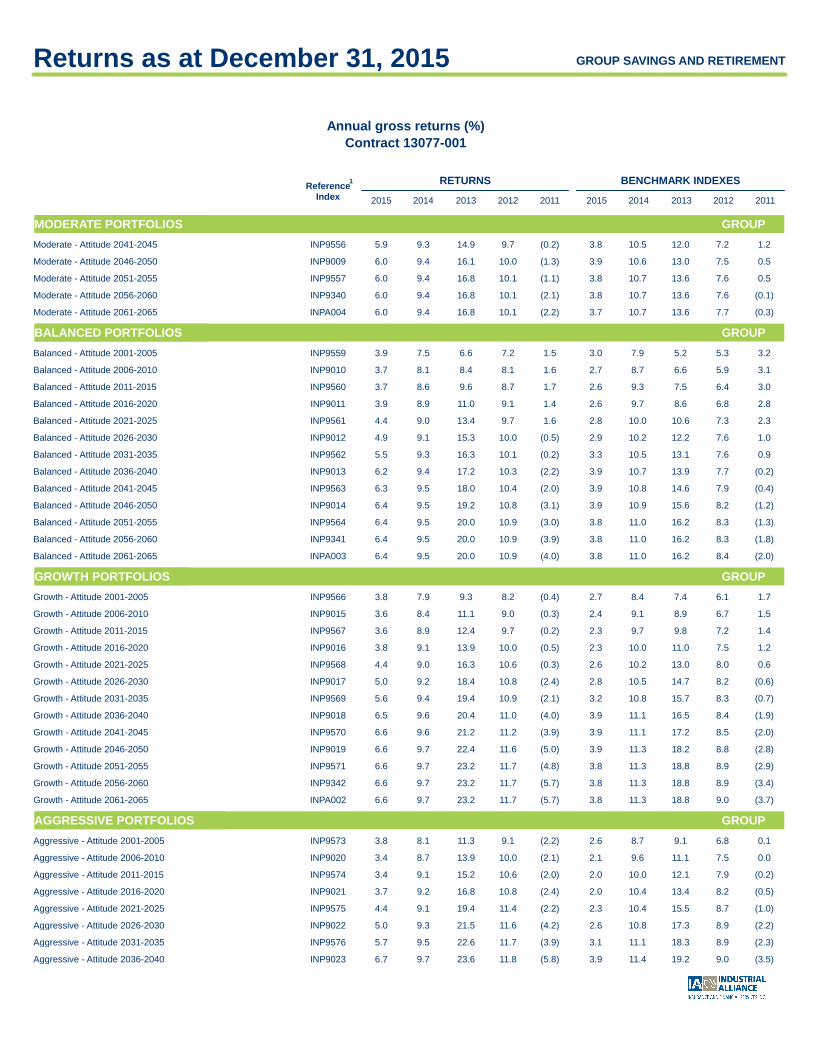
Annual gross returns (%)
Contract 13077-001
RETURNS BENCHMARK INDEXESReference
Index 2015 2014 2013 2012 2011 2015 2014 2013 2012 2011
1
CONSERVATIVE PORTFOLIOS GROUP
Conservative - Attitude 2001-2005 INP9545 4.0 6.8 1.4 5.2 5.2 3.5 6.8 0.9 3.7 6.1
Conservative - Attitude 2006-2010 INP9000 3.8 7.6 3.1 6.1 5.3 3.2 7.8 2.2 4.3 6.1
Conservative - Attitude 2011-2015 INP9546 3.8 8.1 4.2 6.8 5.5 3.0 8.5 3.1 4.9 6.1
Conservative - Attitude 2016-2020 INP9001 3.9 8.6 5.4 7.4 5.3 3.0 9.1 4.0 5.3 6.0
Conservative - Attitude 2021-2025 INP9547 4.2 8.8 7.6 8.1 5.5 3.1 9.5 5.8 5.9 5.4
Conservative - Attitude 2026-2030 INP9002 4.5 8.9 9.4 8.4 2.5 3.1 9.7 7.3 6.2 3.8
Conservative - Attitude 2031-2035 INP9548 4.9 9.0 10.3 8.5 2.7 3.3 9.9 8.1 6.3 3.7
Conservative - Attitude 2036-2040 INP9003 5.5 9.2 11.1 8.7 1.6 3.8 10.1 8.8 6.4 3.0
Conservative - Attitude 2041-2045 INP9549 5.5 9.2 11.9 8.9 1.7 3.8 10.2 9.4 6.6 2.9
Conservative - Attitude 2046-2050 INP9004 5.6 9.3 13.0 9.2 0.6 3.8 10.3 10.4 6.9 2.0
Conservative - Attitude 2051-2055 INP9550 5.6 9.3 13.7 9.3 0.8 3.7 10.4 11.0 7.0 2.0
Conservative - Attitude 2056-2060 INP9339 5.6 9.3 13.7 9.3 (0.2) 3.7 10.4 11.0 7.0 1.4
Conservative - Attitude 2061-2065 INPA005 5.6 9.3 13.7 9.3 (0.5) 3.7 10.4 11.0 7.0 1.4
MODERATE PORTFOLIOS GROUP
Moderate - Attitude 2001-2005 INP9552 4.0 7.2 4.0 6.2 2.4 3.3 7.3 3.0 4.5 4.2
Moderate - Attitude 2006-2010 INP9005 3.8 7.9 6.4 7.4 2.5 2.9 8.3 5.0 5.4 3.9
Moderate - Attitude 2011-2015 INP9553 3.6 8.5 8.2 8.2 2.6 2.6 9.1 6.4 6.0 3.8
Moderate - Attitude 2016-2020 INP9006 3.8 8.8 9.6 8.7 2.4 2.6 9.6 7.5 6.4 3.6
Moderate - Attitude 2021-2025 INP9554 4.2 8.9 11.1 9.0 2.6 2.8 9.8 8.7 6.7 3.3
Moderate - Attitude 2026-2030 INP9007 4.7 9.0 12.3 9.2 0.6 3.0 10.0 9.7 6.9 2.2
Moderate - Attitude 2031-2035 INP9555 5.2 9.1 13.3 9.3 0.8 3.3 10.2 10.6 6.9 2.1
Moderate - Attitude 2036-2040 INP9008 5.9 9.3 14.1 9.5 (0.3) 3.8 10.4 11.3 7.1 1.4
%
10 years
%
5 years
%
3 years
%
1 yearYTD
%%%
1 month 3 months
Compound annual returnsSimple returns3
TOTAL RETURN GROUP
Benchmark indexes - Gross returns (%)
Contract 13077-001
GROUPTOTAL RETURN
(0.2) 3.1 2.9 INP9576 3.1 10.6 7.5 - IN021, IN006, IN079, INDC152, IN026, IN024, IN008, IN037, INDC757, IN031, IN107, IN124, IN104, IN097
(0.2) 3.9 3.1 INP9023 3.9 11.3 7.7 - IN021, IN006, IN079, INDC152, IN026, IN024, IN008, IN037, INDC757, IN031, IN107, IN124, IN097
(0.3) 3.9 3.1 INP9577 3.9 11.5 7.8 - IN021, IN006, IN079, INDC152, IN026, IN024, IN008, IN037, INDC757, IN031, IN107, IN124, IN097
(0.3) 3.9 3.2 INP9024 3.9 11.9 7.9 - IN021, IN006, IN079, INDC152, IN026, IN024, IN008, IN037, INDC757, IN031, IN107, IN124, IN097
(0.3) 3.8 3.2 INP9578 3.8 12.1 8.0 - IN021, IN006, IN079, INDC152, IN026, IN024, IN008, IN037, INDC757, IN031, IN107, IN124, IN097
(0.3) 3.8 3.2 INP9343 3.8 12.1 7.9 - IN021, IN006, IN079, INDC152, IN026, IN024, IN008, IN037, INDC757, IN031, IN107, IN124, IN097
(0.3) 3.8 3.2 INPA001 3.8 12.1 7.9 - IN021, IN006, IN079, INDC152, IN026, IN024, IN008, IN037, INDC757, IN031, IN107, IN124, IN097

Returns as at December 31, 2015 GROUP SAVINGS AND RETIREMENT
Annual gross returns (%)
Contract 13077-001
RETURNS BENCHMARK INDEXESReference
Index 2015 2014 2013 2012 2011 2015 2014 2013 2012 2011
1
MODERATE PORTFOLIOS GROUP
Moderate - Attitude 2041-2045 INP9556 5.9 9.3 14.9 9.7 (0.2) 3.8 10.5 12.0 7.2 1.2
Moderate - Attitude 2046-2050 INP9009 6.0 9.4 16.1 10.0 (1.3) 3.9 10.6 13.0 7.5 0.5
Moderate - Attitude 2051-2055 INP9557 6.0 9.4 16.8 10.1 (1.1) 3.8 10.7 13.6 7.6 0.5
Moderate - Attitude 2056-2060 INP9340 6.0 9.4 16.8 10.1 (2.1) 3.8 10.7 13.6 7.6 (0.1)
Moderate - Attitude 2061-2065 INPA004 6.0 9.4 16.8 10.1 (2.2) 3.7 10.7 13.6 7.7 (0.3)
BALANCED PORTFOLIOS GROUP
Balanced - Attitude 2001-2005 INP9559 3.9 7.5 6.6 7.2 1.5 3.0 7.9 5.2 5.3 3.2
Balanced - Attitude 2006-2010 INP9010 3.7 8.1 8.4 8.1 1.6 2.7 8.7 6.6 5.9 3.1
Balanced - Attitude 2011-2015 INP9560 3.7 8.6 9.6 8.7 1.7 2.6 9.3 7.5 6.4 3.0
Balanced - Attitude 2016-2020 INP9011 3.9 8.9 11.0 9.1 1.4 2.6 9.7 8.6 6.8 2.8
Balanced - Attitude 2021-2025 INP9561 4.4 9.0 13.4 9.7 1.6 2.8 10.0 10.6 7.3 2.3
Balanced - Attitude 2026-2030 INP9012 4.9 9.1 15.3 10.0 (0.5) 2.9 10.2 12.2 7.6 1.0
Balanced - Attitude 2031-2035 INP9562 5.5 9.3 16.3 10.1 (0.2) 3.3 10.5 13.1 7.6 0.9
Balanced - Attitude 2036-2040 INP9013 6.2 9.4 17.2 10.3 (2.2) 3.9 10.7 13.9 7.7 (0.2)
Balanced - Attitude 2041-2045 INP9563 6.3 9.5 18.0 10.4 (2.0) 3.9 10.8 14.6 7.9 (0.4)
Balanced - Attitude 2046-2050 INP9014 6.4 9.5 19.2 10.8 (3.1) 3.9 10.9 15.6 8.2 (1.2)
Balanced - Attitude 2051-2055 INP9564 6.4 9.5 20.0 10.9 (3.0) 3.8 11.0 16.2 8.3 (1.3)
Balanced - Attitude 2056-2060 INP9341 6.4 9.5 20.0 10.9 (3.9) 3.8 11.0 16.2 8.3 (1.8)
Balanced - Attitude 2061-2065 INPA003 6.4 9.5 20.0 10.9 (4.0) 3.8 11.0 16.2 8.4 (2.0)
GROWTH PORTFOLIOS GROUP
Growth - Attitude 2001-2005 INP9566 3.8 7.9 9.3 8.2 (0.4) 2.7 8.4 7.4 6.1 1.7
Growth - Attitude 2006-2010 INP9015 3.6 8.4 11.1 9.0 (0.3) 2.4 9.1 8.9 6.7 1.5
Growth - Attitude 2011-2015 INP9567 3.6 8.9 12.4 9.7 (0.2) 2.3 9.7 9.8 7.2 1.4
Growth - Attitude 2016-2020 INP9016 3.8 9.1 13.9 10.0 (0.5) 2.3 10.0 11.0 7.5 1.2
Growth - Attitude 2021-2025 INP9568 4.4 9.0 16.3 10.6 (0.3) 2.6 10.2 13.0 8.0 0.6
Growth - Attitude 2026-2030 INP9017 5.0 9.2 18.4 10.8 (2.4) 2.8 10.5 14.7 8.2 (0.6)
Growth - Attitude 2031-2035 INP9569 5.6 9.4 19.4 10.9 (2.1) 3.2 10.8 15.7 8.3 (0.7)
Growth - Attitude 2036-2040 INP9018 6.5 9.6 20.4 11.0 (4.0) 3.9 11.1 16.5 8.4 (1.9)
Growth - Attitude 2041-2045 INP9570 6.6 9.6 21.2 11.2 (3.9) 3.9 11.1 17.2 8.5 (2.0)
Growth - Attitude 2046-2050 INP9019 6.6 9.7 22.4 11.6 (5.0) 3.9 11.3 18.2 8.8 (2.8)
Growth - Attitude 2051-2055 INP9571 6.6 9.7 23.2 11.7 (4.8) 3.8 11.3 18.8 8.9 (2.9)
Growth - Attitude 2056-2060 INP9342 6.6 9.7 23.2 11.7 (5.7) 3.8 11.3 18.8 8.9 (3.4)
Growth - Attitude 2061-2065 INPA002 6.6 9.7 23.2 11.7 (5.7) 3.8 11.3 18.8 9.0 (3.7)
AGGRESSIVE PORTFOLIOS GROUP
Aggressive - Attitude 2001-2005 INP9573 3.8 8.1 11.3 9.1 (2.2) 2.6 8.7 9.1 6.8 0.1
Aggressive - Attitude 2006-2010 INP9020 3.4 8.7 13.9 10.0 (2.1) 2.1 9.6 11.1 7.5 0.0
Aggressive - Attitude 2011-2015 INP9574 3.4 9.1 15.2 10.6 (2.0) 2.0 10.0 12.1 7.9 (0.2)
Aggressive - Attitude 2016-2020 INP9021 3.7 9.2 16.8 10.8 (2.4) 2.0 10.4 13.4 8.2 (0.5)
Aggressive - Attitude 2021-2025 INP9575 4.4 9.1 19.4 11.4 (2.2) 2.3 10.4 15.5 8.7 (1.0)
Aggressive - Attitude 2026-2030 INP9022 5.0 9.3 21.5 11.6 (4.2) 2.6 10.8 17.3 8.9 (2.2)
Aggressive - Attitude 2031-2035 INP9576 5.7 9.5 22.6 11.7 (3.9) 3.1 11.1 18.3 8.9 (2.3)
Aggressive - Attitude 2036-2040 INP9023 6.7 9.7 23.6 11.8 (5.8) 3.9 11.4 19.2 9.0 (3.5)


Returns as at December 31, 2015 GROUP SAVINGS AND RETIREMENT
Annual gross returns (%)
Contract 13077-001
RETURNS BENCHMARK INDEXESReference
Index 2015 2014 2013 2012 2011 2015 2014 2013 2012 2011
1
AGGRESSIVE PORTFOLIOS GROUP
Aggressive - Attitude 2041-2045 INP9577 6.8 9.7 24.4 12.0 (5.7) 3.9 11.5 19.8 9.2 (3.6)
Aggressive - Attitude 2046-2050 INP9024 6.9 9.8 25.6 12.3 (6.8) 3.9 11.6 20.9 9.5 (4.4)
Aggressive - Attitude 2051-2055 INP9578 6.9 9.8 26.4 12.4 (6.6) 3.8 11.7 21.5 9.5 (4.5)
Aggressive - Attitude 2056-2060 INP9343 6.9 9.8 26.4 12.4 (7.5) 3.8 11.7 21.5 9.5 (5.0)
Aggressive - Attitude 2061-2065 INPA001 6.9 9.8 26.4 12.4 (7.5) 3.8 11.7 21.5 9.7 (5.5)
INCOME FUNDS GROUP
020 Bond IN021 3.7 8.9 (1.0) 4.2 10.0 3.5 8.8 (1.2) 3.6 9.7
070 Money Market IN018 0.7 1.0 1.0 1.0 1.1 0.6 0.9 1.0 1.0 1.0
170 Short Term Bond IN019 3.0 3.5 1.7 2.7 5.0 2.6 3.1 1.7 2.0 4.7
893 Global Fixed Income (PIMCO) IN124 3.4 7.7 7.3* - - 1.1 6.9 (1.3) - -
CANADIAN EQUITY FUNDS GROUP
160 Dividend IN026 (1.8) 11.8 17.6 9.9 (1.5) (7.8) 12.3 13.3 8.1 (9.1)
541 Canadian Equity Small Cap (QV) IN037 (4.2) 9.0 41.3 23.5 (0.5) (13.3) (2.3) 7.6 (2.2) (16.4)
753 Canadian Equity Index (TD) IN024 (8.2) 10.6 12.9 7.0 (8.6)* (8.3) 10.6 13.0 7.2 (8.7)
871 Canadian Focused Equity (Pyramis) IN031 2.2 12.4 28.9 10.1* - (8.3) 10.6 13.0 7.2 (8.7)
FOREIGN EQUITY FUNDS GROUP
120 Global Equity (Aberdeen) IN008 5.2 10.6* 21.6* - - 18.3 14.5 35.4 13.3 (3.4)
130 Global Equity Small Cap (Mawer) IN079 30.7 14.0* 50.0* - - 19.4 11.6 42.1 15.6 (6.6)
465 Global Equity (Templeton) IN008 15.5 10.3 44.9 19.2 (8.1) 18.3 14.5 35.4 13.3 (3.4)
The above returns are gross returns and do not take into account management and administration fees. Past performance is not a guarantee of future returns.
1 Generally speaking, benchmark indices represent the funds well in terms of their investment structure, i.e.:
2 Total net assets of the fund including individual and group contracts.
3 The rates of return for the period are non-annualized.
4 Each portfolio index is made up of a series of benchmark sub-indexes. These sub-indexes are linked to the portfolios' underlying funds. The weighting reflects the asset allocation of the portfolios' underlying funds. The asset allocation varies periodically. The current allocation appears in Your Range of Investment Options available in CyberClient.
* Simulation of past returns as if the fund had been in effect for these periods.
Index funds: simulation of past returns from the return of the index that the fund aims to reproduce.
Asset allocation funds: simulation of past returns based on the return of the funds included in the asset allocation fund and on an asset allocation decision.
Some portfolio returns are simulated as if they were in effect during the periods shown above.
- In terms of duration and the medium- and long-term allocations in federal, provincial and corporate bonds for the Bonds Fund.
- In terms of exposure to Canadian large cap stocks for the Dividends Fund.
- In terms of allocations in the various asset category types for the Balanced Moderate Index (BlackRock) Fund.
- In terms of exposure to corporate stocks from North American and international markets for the Global Equity Fund.
- In terms of allocations in the various asset category types for the Moderate Attitude Portfolio.
You can find more information on our investment funds by consulting our secure website at www.inalco.com (click on «Cyberclient»).


Group savings and retirement
Industrial AllianceQuarterly Update | Group Investment FundsThird quarter, ending September 30, 2015
Past performance is not a guarantee of future returns.
Money Market
Commentary
The Fund seeks to maintain excellent protection of capital and a high level of liquidity, while maximizing the total return. It is composed essentially of quality securities, with a maximum term of one year, guaranteed by the provinces, governments and some companies. The management style focuses on interest rate forecasts which are based on careful analysis of the economic outlook.
Asset mix of the FundAs at September 30, 2015
Fund Code: 070Inception date: September 1991
Investment Advisor
Christian Pouliot, MBA, CFALouis Gagnon, CFAFrançois Lalande, CFA
Objectives of the Fund• Oriented on short term revenues
• Priority placed on capital protection
• Conforms to a short term investment horizon
Investment styleInterest rate forecasts
Investment limits
Short term 100%
Risk level
Very Low to Moderate low Low moderate Moderate to high High
Characteristics of the FundAs at September 30, 2015
Average rating
- Money Market securities R3 Mid
Average term to maturity 84 days
Yield at market value 0.4%
Treasury bills99.47%
Cash and Cash Equivalents0.53%
Treasury bills99.47%
Cash and Cash Equivalents0.53%
Performance - Gross returnsReturns before deduction of management and administration fees
Compound returns SinceAs at September 30, 2015 YTD 1 month 3 months 6 months 1 year 2 years 3 years 4 years 5 years 10 years Sept. 1991
Fund 0.6 0.0 0.2 0.3 0.8 0.9 1.0 1.0 1.0 1.9 3.5Benchmark index1 0.5 0.0 0.1 0.3 0.8 0.8 0.9 0.9 0.9 1.8
Annual returnsAs at December 31 14 13 12 11 10 09 08 07 06 05
Fund 1.0 1.0 1.0 1.1 0.6 0.5 3.5 4.6 4.1 2.8Benchmark index1 0.9 1.0 1.0 1.0 0.5 0.6 3.3 4.4 4.0 2.6
1 FTSE TMX Canada 91 Day T-Bill Index.
Total net assets: $339.5 million

Group savings and retirement
Industrial AllianceQuarterly Update | Group Investment FundsThird quarter, ending September 30, 2015
Past performance is not a guarantee of future returns.
Short Term Bonds
Commentary
The Fund is managed according to a management style primarily based on securities selection and issuers. The manager also integrates interest rate anticipation in his management process. The fund is characterized by a short and medium term maturity, which minimizes the impact of interest rate fluctuations while generating a good income.
Asset mix of the FundAs at September 30, 2015
Fund Code: 170Inception date: January 1998
Investment Advisor
François Lalande, CFALouis Gagnon, CFAChristian Pouliot, MBA, CFA
Objectives of the Fund• Oriented toward current income
• Moderate long term capital growth
• Conforms to a medium to long term investment horizon
Investment styleInterest rate forecasts
Investment limits Min. Max.
Short term 0% 20%Bonds 80% 100%
The average duration of the portfolio must be situated between 50% and 200% of the duration of the FTSE TMX Canada Short Term Bond Index.
Risk level
Very Low to Moderate low Low moderate Moderate to high High
Corporates53.26%
Provinces18.26%
Canada16.69%
Municipalities and Subsidized6.20%
Short term and other5.56%Mortgage-backed securities
0.03%
Corporates53.26%
Provinces18.26%
Canada16.69%
Municipalities and Subsidized6.20%
Short term and other5.56%Mortgage-backed securities
0.03%
Characteristics of the FundAs at September 30, 2015
Bond and Short term Portfolios
Average rating - Bonds A+
Average term 2.8 years
Modified duration 2.6 years
Average coupon 3.0%
Yield at market value 1.5%
Performance - Gross returnsReturns before deduction of management and administration fees
Compound returns SinceAs at September 30, 2015 YTD 1 month 3 months 6 months 1 year 2 years 3 years 4 years 5 years 10 years Jan. 1998
Fund 2.4 (0.2) 0.1 0.4 3.4 3.4 2.7 2.7 3.0 3.8 4.8Benchmark index1 2.1 (0.2) 0.0 0.2 3.0 3.0 2.4 2.4 2.7 3.8
Annual returnsAs at December 31 14 13 12 11 10 09 08 07 06 05
Fund 3.5 1.7 2.7 5.0 4.4 6.2 4.7 3.7 4.0 3.3Benchmark index1 3.1 1.7 2.0 4.7 3.6 4.5 8.6 4.1 4.0 2.4
1 FTSE TMX Canada Short Term Bond Index.
Total net assets: $314.7 million

Group savings and retirement
Industrial AllianceQuarterly Update | Group Investment FundsThird quarter, ending September 30, 2015
Past performance is not a guarantee of future returns.
Bonds
Commentary
The Fund’s approach in bond management is based on interest-rate movement forecasts, derived from analyses of macroeconomic trends. The management of the duration and the yield curve positioning are the main sources of added value compared to the benchmark. Sector and security selection also contribute to add value. On occasion, the manager may add securities denominated in foreign currencies, real return bonds or other special situations likely to improve the portfolio’s return or to reduce volatility.
Asset mix of the FundAs at September 30, 2015
Fund Code: 020Inception date: May 1977
Investment Advisor
François Lalande, CFALouis Gagnon, CFAChristian Pouliot, MBA, CFA
Objectives of the Fund• Oriented toward current income
• Moderate long term capital growth
• Conforms to a medium to long term investment horizon
Investment styleInterest rate forecasts
Investment limits Min. Max.
Short term 0% 20%Bonds 80% 100%
The average duration of the portfolio must be situated between 50% and 150% of the duration of the FTSE TMX Canada Short Term Bond Index.
Risk level
Very Low to Moderate low Low moderate Moderate to high High
Corporates43.79%
Provinces33.12%
Canada14.63%
Short term and other4.92%
Municipalities and Subsidized3.22%
Investment Funds0.32%
Corporates43.79%
Provinces33.12%
Canada14.63%
Short term and other4.92%
Municipalities and Subsidized3.22%
Investment Funds0.32%
Characteristics of the FundAs at September 30, 2015
Bond and Short term Portfolios
Average rating - Bonds A+
Average term 9.7 years
Modified duration 6.7 years
Average coupon 3.6%
Yield at market value 2.3%
Performance - Gross returnsReturns before deduction of management and administration fees
Compound returns SinceAs at September 30, 2015 YTD 1 month 3 months 6 months 1 year 2 years 3 years 4 years 5 years 10 years May 1977
Fund 2.6 (0.2) 0.1 (1.5) 5.3 6.1 3.6 4.2 4.7 5.2 8.8Benchmark index1 2.5 (0.3) 0.1 (1.6) 5.3 5.8 3.4 3.9 4.5 5.0
Annual returnsAs at December 31 14 13 12 11 10 09 08 07 06 05
Fund 8.9 (1.0) 4.2 10.0 6.4 5.3 8.0 2.7 4.6 6.7Benchmark index1 8.8 (1.2) 3.6 9.7 6.7 5.4 6.4 3.7 4.1 6.5
1 FTSE TMX Canada Universe Bond Index.
Total net assets: $2,656.0 million

Group savings and retirement
Industrial AllianceQuarterly Update | Group Investment FundsThird quarter, ending September 30, 2015
Past performance is not a guarantee of future returns.
Bonds (PIMCO)
Commentary
PIMCO is a “core-plus” manager. Their goal is to add value by consistently outperforming the benchmark by tapping traditional and non-traditional sectors of the fixed income markets, while maintaining overall risk similar to that of the benchmark.
Risk factors to which PIMCO is overweight or underweight include: duration; yield curve; sectors of the Canadian bond market, including government bonds, provincials and corporate bonds; and credit quality. In addition, PIMCO allocates a small portion of its CorePLUS portfolios to out-of-index risk factors comprised of the firm’s best ideas from around the global bond markets, which include international fixed income, currency, Canadian and non-Canadian inflation-linked bonds, Canadian and non-Canadian high yield, emerging markets, liquidity and volatility strategies.
Asset mix of the underlying fundAs at September 30, 2015
Fund Code: 860Inception date: November 2009
Investment Advisor
Management team composed of several managers
Objectives of the Fund• Oriented toward current income
• Moderate long term capital growth
• Conforms to a medium to long term investment horizon
Investment styleMultiple strategies
Investment limits
Industrial Alliance Fund
Min. Max.
Short term 0% 20%Units of the underlying fund 80% 100%
Underlying fund
Min. Max.
Short term 0% 20%Bonds 80% 100%
Risk level
Underlying Fund�PIMCO Canada Canadian CorePLUS Bond Trust
Very Low to Moderate low Low moderate Moderate to high High
Provinces43.00%
Short term and other20.00%
Canada18.00%
Corporates17.00%
Foreign bonds2.00%
Provinces43.00%
Short term and other20.00%
Canada18.00%
Corporates17.00%
Foreign bonds2.00%
Characteristics of the underlying fundAs at September 30, 2015
Bond and Short term Portfolios
Average rating - Bonds AA-
Average term 9.8 years
Modified duration 7.0 years
Average coupon 3.7%
Performance of the Industrial Alliance Fund - Gross returnsReturns before deduction of management and administration fees
Compound returns SinceAs at September 30, 2015 YTD 1 month 3 months 6 months 1 year 2 years 3 years 4 years 5 years 10 years Nov. 2009
Fund 2.6 (0.5) 0.0 (1.6) 5.0 5.8 3.7 4.9 4.5 - 5.2Benchmark index1 2.5 (0.3) 0.1 (1.6) 5.3 5.8 3.4 3.9 4.5 -
Annual returnsAs at December 31 14 13 12 11 10 09 08 07 06 05
Fund 8.2 (0.5) 6.4 6.1 8.7 13.5* 0.7* 4.6* - -Benchmark index1 8.8 (1.2) 3.6 9.7 6.7 5.4 6.4 3.7 - -
1 FTSE TMX Canada Universe Bond Index.* Simulation of past returns as if the Fund had been in effect for these periods.
Asset mix of the Industrial Alliance FundAs at September 30, 2015 Distribution
Short term 0.06%Units of the underlying fund 99.94%
100.00%
Total net assets: $160.2 million

Group savings and retirement
Industrial AllianceQuarterly Update | Group Investment FundsThird quarter, ending September 30, 2015
Past performance is not a guarantee of future returns.
Global Fixed Income (PIMCO)
Commentary
The Fund aims to optimize current income while respecting the principle of capital conservation and prudent investment management. Long term capital appreciation is a secondary objective. The Fund invests primarily in a diversified portfolio of fixed income securities that are not denominated in Canadian dollars and with a variety of maturities.
The Fund can invest up to 50% of its total assets in high-yield securities (“high risk bonds”) that have been rated or, if they are not rated, in securities of comparable quality. The Fund can invest up to 20% of its total assets in securities and instruments that are economically linked to the emerging markets. There is no limit as to the number of securities denominated in currencies in which it can invest. As a general rule, the Fund limits it exposure to currencies (of securities denominated in currencies other than the Canadian dollar) to 10% of its total assets. The Fund can also resort to targeted derivatives, such as options, futures and forward contracts, and swaps. The average duration of this Fund’s portfolio usually varies between zero and eight years.
Asset mix of the underlying fundAs at September 30, 2015
Fund Code: 893Inception date: March 2013
Investment Advisor
Management team composed of several managers
Objectives of the Fund• Oriented on current income by investing
primarily in a diversified portfolio of fixed income securities that are not denominated in Canadian dollars
• Targets moderate long term capital appreciation
• Conforms to a medium to long term investment horizon
Investment styleMultiple strategies
Investment limits
Industrial Alliance Fund
Min. Max.
Short term 0% 20%Units of the underlying fund 80% 100%
Risk level
Underlying Fund�PIMCO Monthly Income Fund (Canada)
Very Low to Moderate low Low moderate Moderate to high High
Foreign bonds77.40%
Mortgages25.70%
Short term and other-3.10%
Foreign bonds77.40%
Mortgages25.70%
Short term and other-3.10%
Characteristics of the underlying fundAs at September 30, 2015
Bond and Short term Portfolios
Average term 5.2 years
Modified duration 3.0 years
Performance of the Industrial Alliance Fund - Gross returnsReturns before deduction of management and administration fees
Compound returns SinceAs at September 30, 2015 YTD 1 month 3 months 6 months 1 year 2 years 3 years 4 years 5 years 10 years Mar. 2013
Fund 2.6 (0.7) (0.8) 0.4 3.1 6.2 7.2* 10.8* - - 5.8Benchmark index1 1.7 0.7 1.3 (0.2) 3.8 4.3 2.5 3.4 - -
Annual returnsAs at December 31 14 13 12 11 10 09 08 07 06 05
Fund 7.7 7.3* 25.4* - - - - - - -Benchmark index1 6.9 (1.3) 5.0 - - - - - - -
1 Barclays U.S. Aggregate Index (CAD Hedged)* Simulation of past returns as if the Fund had been in effect for these periods.
Sector diversification (%) -duration weightedof the underlying fundAs at September 30, 2015
Government-Related 30.30%
Australia 25.10%
EMU 0.50%
Japan 0.10%
United States 11.00%
Other (6.40)%
Mortgage 25.70%
Agency 0.70%
Non-Agency 8.10%
ABS 14.00%
CMBS 1.10%
Other 1.80%
Investment Grade Credit 9.00%
High Yield Credit 12.00%
Emerging Markets 26.90%
Municipal/Other (0.80)%
Net Cash Equivalents (3.10)%
100.00%
Asset mix of the Industrial Alliance FundAs at September 30, 2015 Distribution
Short term 0.19%Units of the underlying fund 99.81%
100.00%
Total net assets: $97.6 million

Group savings and retirement
Industrial AllianceQuarterly Update | Group Investment FundsThird quarter, ending September 30, 2015
Past performance is not a guarantee of future returns.
Canadian Equity Index (TD)
Commentary
The Fund’s objective is to track the S&P/TSX Composite Total Return Index performance. The Fund is managed based on the philosophy that indexing reduces portfolio risk by investing in a comprehensive range of securities while lowering costs compared with more active approaches.
Asset mix of the underlying fundAs at September 30, 2015
Fund Code: 753Inception date: November 2011
Investment Advisor
Objectives of the Fund• Seeks long term capital growth through
investments in Canadian equities
Investment styleIndexed
Investment limits Min. Max.
Short term 0% 20%Units of the underlying fund 80% 100%
Risk level
Underlying Fund�TD Emerald Canadian Equity Index Fund
Very Low to Moderate low Low moderate Moderate to high High
Sector Allocation of the underlying fundAs at September 30, 2015
Canadian Equity Portfolio
Financials 37.12%
Energy 18.41%
Materials 9.00%
Industrials 8.25%
Consumer Discretionary 7.15%
Telecommunication Services 5.40%
Health Care 4.75%
Consumer Staples 4.40%
Information Technology 2.82%
Utilities 2.28%
Market Index 0.14%
99.72%
Canadian Equity99.72%
Short term and other0.28%
Canadian Equity99.72%
Short term and other0.28%
Performance of the Industrial Alliance Fund - Gross returnsReturns before deduction of management and administration fees
Compound returns SinceAs at September 30, 2015 YTD 1 month 3 months 6 months 1 year 2 years 3 years 4 years 5 years 10 years Nov. 2011
Fund (6.9) (3.6) (7.7) (9.3) (8.2) 4.9 5.8 6.6* 4.5* 4.9* 5.3Benchmark index1 (7.0) (3.7) (7.9) (9.4) (8.4) 5.0 5.7 6.6 4.5 4.8
Annual returnsAs at December 31 14 13 12 11 10 09 08 07 06 05
Fund 10.6 12.9 7.0 (8.6)* 17.5* 35.1* (32.8)* 9.9* 17.3* 24.0*Benchmark index1 10.6 13.0 7.2 (8.7) 17.6 35.1 (33.0) 9.8 17.3 24.1
1 S&P/TSX Composite Index.* Simulation of past returns as if the Fund had been in effect for these periods.
Asset mix of the Industrial Alliance FundAs at September 30, 2015 Distribution
Short term 0.06%Units of the underlying fund 99.94%
100.00%
Total net assets: $40.1 million
Group savings and retirement
Industrial AllianceQuarterly Update | Group Investment FundsThird quarter, ending September 30, 2015
Past performance is not a guarantee of future returns.
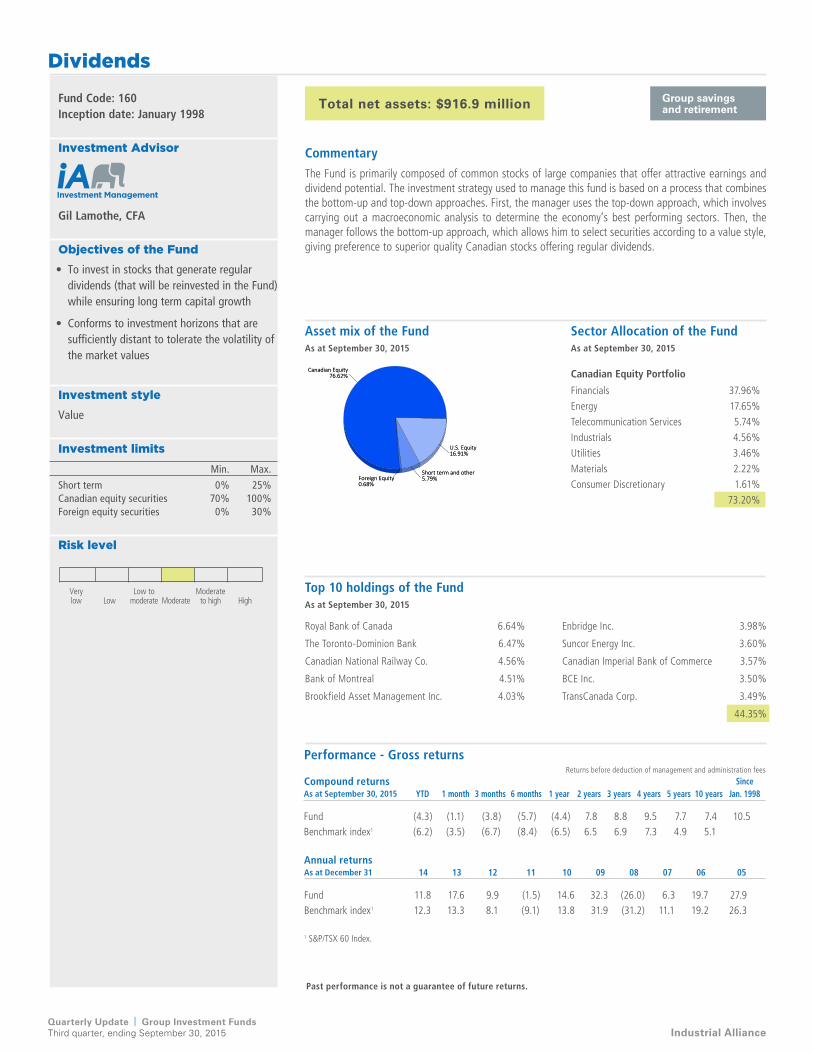
Dividends
Commentary
The Fund is primarily composed of common stocks of large companies that offer attractive earnings and dividend potential. The investment strategy used to manage this fund is based on a process that combines the bottom-up and top-down approaches. First, the manager uses the top-down approach, which involves carrying out a macroeconomic analysis to determine the economy’s best performing sectors. Then, the manager follows the bottom-up approach, which allows him to select securities according to a value style, giving preference to superior quality Canadian stocks offering regular dividends.
Asset mix of the FundAs at September 30, 2015
Fund Code: 160Inception date: January 1998
Investment Advisor
Gil Lamothe, CFA
Objectives of the Fund• To invest in stocks that generate regular
dividends (that will be reinvested in the Fund) while ensuring long term capital growth
• Conforms to investment horizons that are sufficiently distant to tolerate the volatility of the market values
Investment styleValue
Investment limits Min. Max.
Short term 0% 25%Canadian equity securities 70% 100%Foreign equity securities 0% 30%
Risk level
Very Low to Moderate low Low moderate Moderate to high High
Sector Allocation of the FundAs at September 30, 2015
Canadian Equity Portfolio
Financials 37.96%
Energy 17.65%
Telecommunication Services 5.74%
Industrials 4.56%
Utilities 3.46%
Materials 2.22%
Consumer Discretionary 1.61%
73.20%
Top 10 holdings of the FundAs at September 30, 2015
Royal Bank of Canada 6.64% Enbridge Inc. 3.98%
The Toronto-Dominion Bank 6.47% Suncor Energy Inc. 3.60%
Canadian National Railway Co. 4.56% Canadian Imperial Bank of Commerce 3.57%
Bank of Montreal 4.51% BCE Inc. 3.50%
Brookfield Asset Management Inc. 4.03% TransCanada Corp. 3.49%
44.35%
Canadian Equity76.62%
U.S. Equity16.91%
Short term and other5.79%Foreign Equity
0.68%
Canadian Equity76.62%
U.S. Equity16.91%
Short term and other5.79%Foreign Equity
0.68%
Performance - Gross returnsReturns before deduction of management and administration fees
Compound returns SinceAs at September 30, 2015 YTD 1 month 3 months 6 months 1 year 2 years 3 years 4 years 5 years 10 years Jan. 1998
Fund (4.3) (1.1) (3.8) (5.7) (4.4) 7.8 8.8 9.5 7.7 7.4 10.5Benchmark index1 (6.2) (3.5) (6.7) (8.4) (6.5) 6.5 6.9 7.3 4.9 5.1
Annual returnsAs at December 31 14 13 12 11 10 09 08 07 06 05
Fund 11.8 17.6 9.9 (1.5) 14.6 32.3 (26.0) 6.3 19.7 27.9Benchmark index1 12.3 13.3 8.1 (9.1) 13.8 31.9 (31.2) 11.1 19.2 26.3
1 S&P/TSX 60 Index.
Total net assets: $916.9 million

Group savings and retirement
Industrial AllianceQuarterly Update | Group Investment FundsThird quarter, ending September 30, 2015
Past performance is not a guarantee of future returns.
Canadian Focused Equity (Pyramis)
Commentary
The Fund’s investment strategy uses a bottom-up, fundamental approach designed to deliver the Pyramis Canadian equity research team’s best ideas. The portfolio manager constructs a concentrated portfolio based on fundamental research inputs where active sector and capitalization allocation are the result, primarily, of bottom-up stock selection. The fundation of this research is our large team of research analysts dedicated solely to the Canadian equity market.
Each analyst is assigned an industry group in the S&P/TSX Capped Composite Index and is responsible for rating the top stock ideas within his or her sector. The portfolio manager is responsible for constructing the portfolio and ensuring that the strategy adheres to the stated investment guidelines.
Asset mix of the underlying fundAs at September 30, 2015
Fund Code: 871Inception date: January 2012
Investment Advisor
Joe Overdevest Andrew Marchese
Objectives of the Fund• Seeks long term capital appreciation
by investing in a diversified portfolio of Canadian equities
• Conforms to investment horizons that are sufficiently distant to tolerate the volatility of the market values
Investment styleCore with a growth bias
Investment limits
Industrial Alliance Fund
Min. Max.
Short term 0% 20%Units of the underlying fund 80% 100%
Risk level
Underlying Fund�Pyramis Canadian Focused Equity Fund
Very Low to Moderate low Low moderate Moderate to high High
Sector Allocation of the underlying fundAs at September 30, 2015
Canadian Equity Portfolio
Financials 30.87%
Consumer Discretionary 14.44%
Energy 12.78%
Information Technology 8.92%
Consumer Staples 8.79%
Materials 7.85%
Industrials 6.29%
Health Care 5.22%
95.16%
Top 10 Holdings of the underlying fundAs at September 30, 2015
Royal Bank of Canada 8.55% Constellation Software Inc. 4.97%
The Toronto-Dominion Bank 7.84% Valeant Pharmaceuticals International Inc. 4.76%
Brookfield Asset Management Inc., Class A 6.83% Intact Financial Corp. 4.57%
Canadian Pacific Railway Co. 5.67% Restaurant Brands International Inc. 3.86%
Alimentation Couche-Tard Inc., Class B, SV 5.07% Enbridge Inc. 3.81%
55.93%
Canadian Equity95.16%
Short term and other4.84%
Canadian Equity95.16%
Short term and other4.84%
Performance of the Industrial Alliance Fund - Gross returnsReturns before deduction of management and administration fees
Compound returns SinceAs at September 30, 2015 YTD 1 month 3 months 6 months 1 year 2 years 3 years 4 years 5 years 10 years Jan. 2012
Fund 3.2 (3.1) (3.1) (3.7) 2.0 13.4 15.9 14.5* 11.5* 8.9* 13.9Benchmark index1 (7.0) (3.7) (7.9) (9.4) (8.4) 5.0 5.7 6.6 4.5 4.8
Annual returnsAs at December 31 14 13 12 11 10 09 08 07 06 05
Fund 12.4 28.9 10.1* (6.0)* 17.9* 34.5* (30.0)* 16.3* 14.6* 29.2*Benchmark index1 10.6 13.0 7.2 (8.7) 17.6 35.1 (33.0) 9.8 17.3 24.1
1 S&P/TSX Capped Composite Index.* Simulation of past returns as if the Fund had been in effect for these periods.
Asset mix of the Industrial Alliance FundAs at September 30, 2015 Distribution
Short term 0.11%Units of the underlying fund 99.89%
100.00%
Total net assets: $90.1 million

Group savings and retirement
Industrial AllianceQuarterly Update | Group Investment FundsThird quarter, ending September 30, 2015
Past performance is not a guarantee of future returns.
Canadian Equity Low Volatility (TD)
Commentary
The philosophy underlying the Fund is that capitalization-weighted market indices are not efficient and that portfolio optimization techniques focusing on minimizing expected return volatility can provide market-like returns over the long term with less volatility than the market capitalization-weighted index.
The manager seeks to construct a diversified portfolio with less return volatility than the S&P/TSX Composite Index. The Fund is expected to outperform in declining market environments. Note that the tracking error will be high relative to the index.
Asset mix of the underlying fundAs at September 30, 2015
Fund Code: 888First offering: November 2012Inception date: August 2012
Investment Advisor
Objectives of the Fund• Seeks long term capital growth mainly
through investments in Canadian equity securities
• Conforms to investment horizons that are sufficiently distant to tolerate the volatility of the market values
Investment styleQuantitative
Investment limits
Industrial Alliance Fund
Min. Max.
Short term 0% 20%Units of the underlying fund 80% 100%
Risk level
Underlying FundTD Emerald Low Volatility Canadian Equity Pooled Fund Trust
Very Low to Moderate low Low moderate Moderate to high High
Sector Allocation of the underlying fundAs at September 30, 2015
Canadian Equity Portfolio
Financials 25.26%
Consumer Discretionary 18.21%
Energy 15.73%
Consumer Staples 13.03%
Telecommunication Services 9.34%
Utilities 8.23%
Industrials 5.59%
Information Technology 2.47%
Materials 1.29%
Health Care 0.55%
99.70%
Top 10 Holdings of the underlying fundAs at September 30, 2015
Intact Financial Corp. 3.30% Shaw Communications Inc., Class B 2.95%
BCE Inc. 3.27% Manitoba Telecom Services Inc. 2.89%
Metro Inc. 3.13% TransCanada Corp. 2.69%
Fortis Inc. 3.01% Dollarama Inc. 2.49%
Thomson Reuters Corp. 2.99% Empire Co. Ltd., Class A, NV 2.48%
29.20%
Canadian Equity99.70%
Short term and other0.30%
Canadian Equity99.70%
Short term and other0.30%
Performance of the Industrial Alliance Fund - Gross returnsReturns before deduction of management and administration fees
Compound returns SinceAs at September 30, 2015 YTD 1 month 3 months 6 months 1 year 2 years 3 years 4 years 5 years 10 years Aug. 2012
Fund (2.6) (0.6) (1.8) (5.0) 3.6 11.4 11.2 11.9* 12.3* - 11.2Benchmark index1 (7.0) (3.7) (7.9) (9.4) (8.4) 5.0 5.7 6.6 4.5 -
Annual returnsAs at December 31 14 13 12 11 10 09 08 07 06 05
Fund 20.8 13.2 11.8* 15.1* 20.0* - - - - -Benchmark index1 10.6 13.0 7.2 (8.7) 17.6 - - - - -
1 S&P/TSX Composite Index.* Simulation of past returns as if the Fund had been in effect for these periods.
Asset mix of the Industrial Alliance FundAs at September 30, 2015 Distribution
Short term 0.12%Units of the underlying fund 99.88%
100.00%
Total net assets: $40.1 million
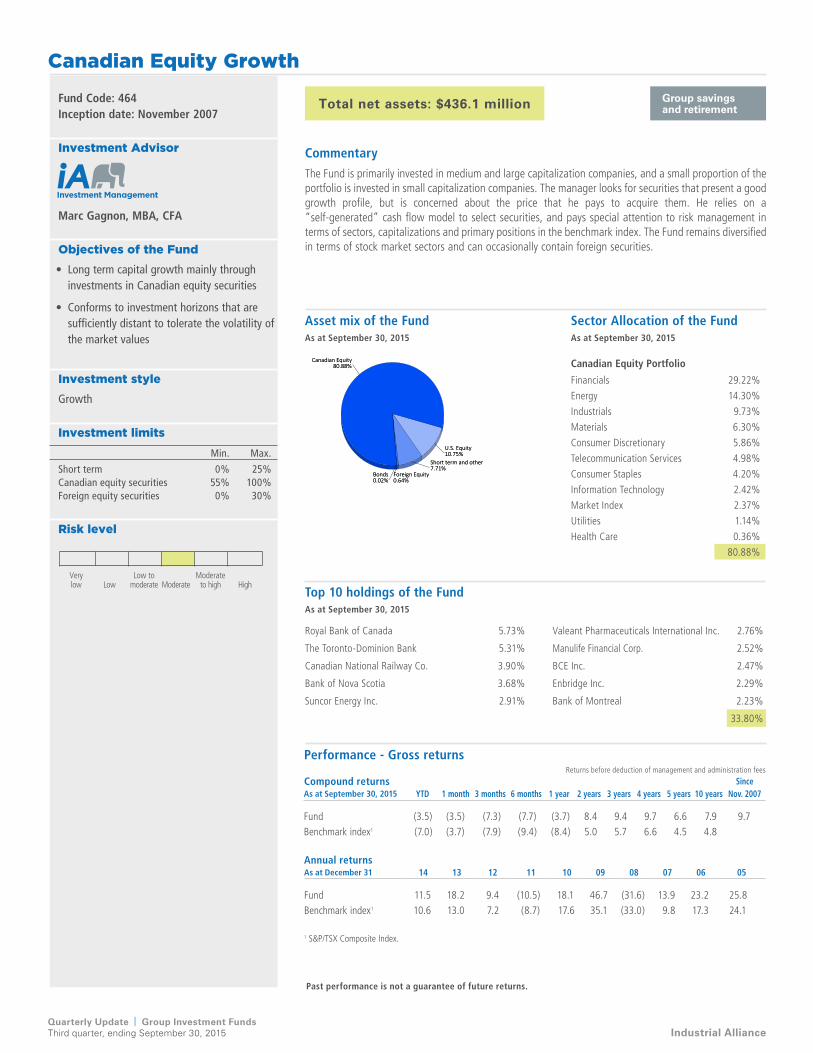
Group savings and retirement
Industrial AllianceQuarterly Update | Group Investment FundsThird quarter, ending September 30, 2015
Past performance is not a guarantee of future returns.
Canadian Equity Growth
Commentary
The Fund is primarily invested in medium and large capitalization companies, and a small proportion of the portfolio is invested in small capitalization companies. The manager looks for securities that present a good growth profile, but is concerned about the price that he pays to acquire them. He relies on a “self-generated” cash flow model to select securities, and pays special attention to risk management in terms of sectors, capitalizations and primary positions in the benchmark index. The Fund remains diversified in terms of stock market sectors and can occasionally contain foreign securities.
Asset mix of the FundAs at September 30, 2015
Fund Code: 464Inception date: November 2007
Investment Advisor
Marc Gagnon, MBA, CFA
Objectives of the Fund• Long term capital growth mainly through
investments in Canadian equity securities
• Conforms to investment horizons that are sufficiently distant to tolerate the volatility of the market values
Investment styleGrowth
Investment limits Min. Max.
Short term 0% 25%Canadian equity securities 55% 100%Foreign equity securities 0% 30%
Risk level
Very Low to Moderate low Low moderate Moderate to high High
Sector Allocation of the FundAs at September 30, 2015
Canadian Equity Portfolio
Financials 29.22%
Energy 14.30%
Industrials 9.73%
Materials 6.30%
Consumer Discretionary 5.86%
Telecommunication Services 4.98%
Consumer Staples 4.20%
Information Technology 2.42%
Market Index 2.37%
Utilities 1.14%
Health Care 0.36%
80.88%
Top 10 holdings of the FundAs at September 30, 2015
Royal Bank of Canada 5.73% Valeant Pharmaceuticals International Inc. 2.76%
The Toronto-Dominion Bank 5.31% Manulife Financial Corp. 2.52%
Canadian National Railway Co. 3.90% BCE Inc. 2.47%
Bank of Nova Scotia 3.68% Enbridge Inc. 2.29%
Suncor Energy Inc. 2.91% Bank of Montreal 2.23%
33.80%
Canadian Equity80.88%
U.S. Equity10.75%
Short term and other7.71%
Foreign Equity0.64%
Bonds0.02%
Canadian Equity80.88%
U.S. Equity10.75%
Short term and other7.71%
Foreign Equity0.64%
Bonds0.02%
Performance - Gross returnsReturns before deduction of management and administration fees
Compound returns SinceAs at September 30, 2015 YTD 1 month 3 months 6 months 1 year 2 years 3 years 4 years 5 years 10 years Nov. 2007
Fund (3.5) (3.5) (7.3) (7.7) (3.7) 8.4 9.4 9.7 6.6 7.9 9.7Benchmark index1 (7.0) (3.7) (7.9) (9.4) (8.4) 5.0 5.7 6.6 4.5 4.8
Annual returnsAs at December 31 14 13 12 11 10 09 08 07 06 05
Fund 11.5 18.2 9.4 (10.5) 18.1 46.7 (31.6) 13.9 23.2 25.8Benchmark index1 10.6 13.0 7.2 (8.7) 17.6 35.1 (33.0) 9.8 17.3 24.1
1 S&P/TSX Composite Index.
Total net assets: $436.1 million

Group savings and retirement
Industrial AllianceQuarterly Update | Group Investment FundsThird quarter, ending September 30, 2015
Past performance is not a guarantee of future returns.
Canadian Equity Small Cap (Montrusco)
Commentary
The fundamental investment objective of the fund is to achieve long term growth of capital through the investment of its assets primarily in issues of Canadian small cap corporations. The manager focuses on growth companies that have a track record of earnings and cash flow.
Asset mix of the underlying fundAs at September 30, 2015
Fund Code: 511Inception date: December 2004
Investment Advisor
Christian Godin, BBA, MSC
Objectives of the Fund• Long term capital growth through
investments in small capitalization Canadian companies
• Conforms to investment horizons that are sufficiently distant to tolerate the volatility of the market values
Investment styleGrowth at a reasonable price
Investment limits
Industrial Alliance Fund
Min. Max.
Short term 0% 20%Units of the underlying fund 80% 100%
Risk level
Underlying Fund�Montrusco Bolton Canadian Small Cap. Equity Fund
Very Low to Moderate low Low moderate Moderate to high High
Sector Allocation of the underlying fundAs at September 30, 2015
Canadian Equity Portfolio
Materials 20.81%
Industrials 17.04%
Financials 16.50%
Energy 14.08%
Information Technology 11.26%
Consumer Staples 10.34%
Consumer Discretionary 5.97%
Health Care 1.64%
97.64%
Top 10 Holdings of the underlying fundAs at September 30, 2015
Osisko gold royalties Ltd. 5.02% Kinaxis Inc. 3.69%
Parex Resources Inc. 3.80% Laurentian Bank of Canada 3.49%
Home Capital Group Inc. 3.79% Boyd Group Income Fund 3.35%
Lassonde Industries Inc., Class A, SV 3.78% Premium Brands Holdings Corp. 3.34%
Western Forest Products Inc. 3.75% High Liner Foods Inc. 3.22%
37.23%
Canadian Equity97.64%
Short term and other2.36%
Canadian Equity97.64%
Short term and other2.36%
Performance of the Industrial Alliance Fund - Gross returnsReturns before deduction of management and administration fees
Compound returns SinceAs at September 30, 2015 YTD 1 month 3 months 6 months 1 year 2 years 3 years 4 years 5 years 10 years Dec. 2004
Fund (13.2) (2.8) (13.7) (12.5) (17.4) (3.3) 0.6 4.0 2.7 5.9 7.6Benchmark index1 (14.3) (6.8) (15.2) (14.1) (21.8) (5.4) (4.1) (1.7) (2.7) 0.1
Annual returnsAs at December 31 14 13 12 11 10 09 08 07 06 05
Fund 0.4 19.2 4.2 (11.1) 39.6 68.3 (43.6) 17.3 15.2 24.1Benchmark index1 (2.3) 7.6 (2.2) (16.4) 35.1 62.4 (45.5) 0.9 11.6 10.6
1 S&P/TSX SmallCap Index.
Asset mix of the Industrial Alliance FundAs at September 30, 2015 Distribution
Short term 0.07%Units of the underlying fund 99.93%
100.00%
Total net assets: $46.4 million

Group savings and retirement
Industrial AllianceQuarterly Update | Group Investment FundsThird quarter, ending September 30, 2015
Past performance is not a guarantee of future returns.
Canadian Equity Small Cap (QV)
Commentary
QV Investors Inc. believes investing is the process of buying ownership stakes in businesses run by managers we want as long term partners. They seek to buy our investments at a price calculated to deliver a rate of return superior to the return on equity of Canadian corporations. They believe the study of the business environment can enhance returns by putting values, companies, credit and cultures in a global or thematic context. The elements of the portfolio management are as follows: - Quality, Value, Growth and Diversification - and relate to the management of portfolio risk. Quality is analysis of the integrity of management and corporate finance. Value is the calculation of a security’s price relative to its earning power and inflation. Growth in capital is the objective. Diversification is the means to modify risk.
Asset mix of the underlying fundAs at September 30, 2015
Fund Code: 541Inception date: November 2007
Investment Advisor
Management team composed of several managers
Objectives of the Fund• Long term capital growth through
investments in small capitalization Canadian companies
• Conforms to investment horizons that are sufficiently distant to tolerate the volatility of the market values
Investment styleValue
Investment limits
Industrial Alliance Fund
Min. Max.
Short term 0% 20%Units of the underlying fund 80% 100%
Risk level
Underlying Fund IA Clarington Canadian Small Cap. Fund
Very Low to Moderate low Low moderate Moderate to high High
Sector Allocation of the underlying fundAs at September 30, 2015
Canadian Equity Portfolio
Financials 24.55%
Industrials 21.76%
Energy 16.74%
Consumer Staples 8.92%
Consumer Discretionary 7.51%
Materials 7.05%
Telecommunication Services 5.94%
Information Technology 0.95%
93.42%
Top 10 Holdings of the underlying fundAs at September 30, 2015
Manitoba Telecom Services Inc. 5.94% Richelieu Hardware Ltd. 3.90%
Canadian Western Bank 5.73% Lassonde Industries Inc., Class A, SV 3.78%
E-L Financial Corp. Ltd. 5.19% Secure Energy Services Inc. 3.23%
Laurentian Bank of Canada 5.08% Empire Co. Ltd., Class A, NV 3.07%
New Flyer Industries Inc. 4.21% Leon's Furniture Ltd. 3.05%
43.18%
Canadian Equity93.42%
Short term and other4.84%U.S. Equity
1.74%
Canadian Equity93.42%
Short term and other4.84%U.S. Equity
1.74%
Performance of the Industrial Alliance Fund - Gross returnsReturns before deduction of management and administration fees
Compound returns SinceAs at September 30, 2015 YTD 1 month 3 months 6 months 1 year 2 years 3 years 4 years 5 years 10 years Nov. 2007
Fund (6.1) (2.8) (7.1) (6.1) (7.6) 7.5 14.5 17.1 13.9 9.9* 9.2Benchmark index1 (14.3) (6.8) (15.2) (14.1) (21.8) (5.4) (4.1) (1.7) (2.7) 0.1
Annual returnsAs at December 31 14 13 12 11 10 09 08 07 06 05
Fund 9.0 41.3 23.5 (0.5) 16.9 33.1 (31.0) 12.0 12.8* 28.2*Benchmark index1 (2.3) 7.6 (2.2) (16.4) 35.1 62.4 (45.5) 0.9 11.6 10.6
1 S&P/TSX SmallCap Index.* Simulation of past returns as if the Fund had been in effect for these periods.
Asset mix of the Industrial Alliance FundAs at September 30, 2015 Distribution
Short term (0.08)%Units of the underlying fund 100.08%
100.00%
Total net assets: $126.3 million
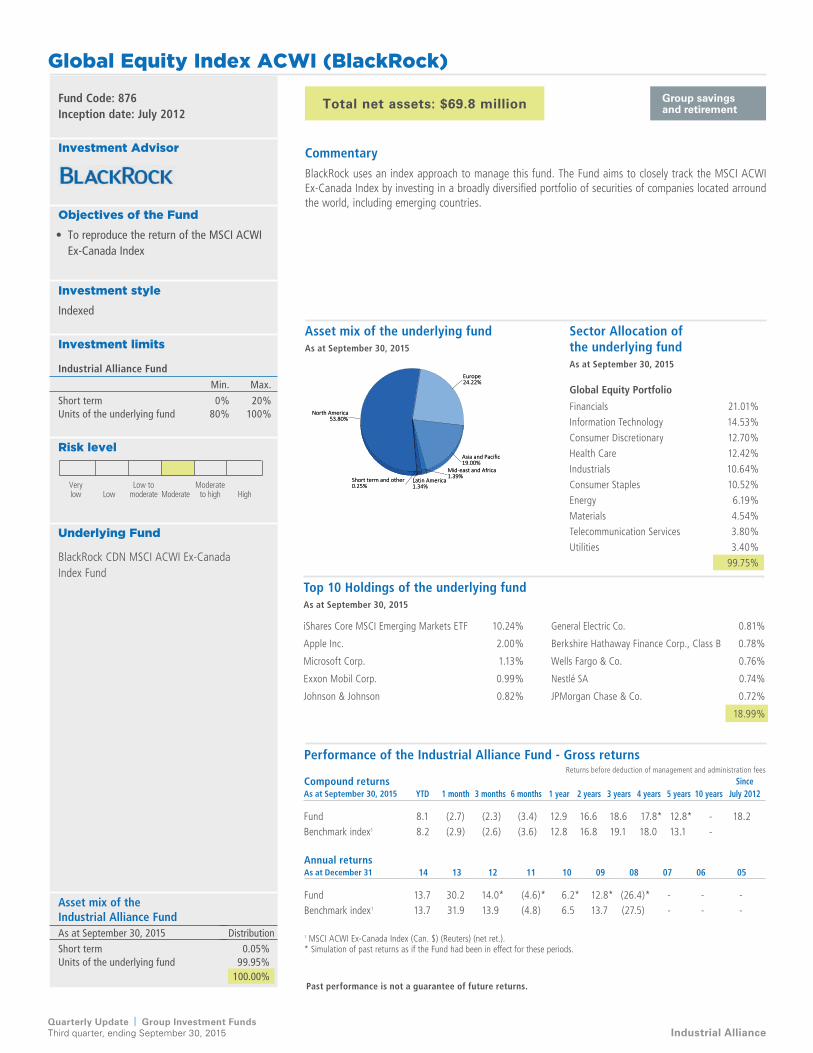
Group savingsand retirement
Industrial AllianceQuarterly Update | Group Investment FundsThird quarter, ending September 30, 2015
Past performance is not a guarantee of future returns.
Commentary
BlackRock uses an index approach to manage this fund. The Fund aims to closely track the MSCI ACWI Ex-Canada Index by investing in a broadly diversified portfolio of securities of companies located arround the world, including emerging countries.
Asset mix of the underlying fundAs at September 30, 2015
Fund Code: 876Inception date: July 2012
Investment Advisor
Objectives of the Fund• To reproduce the return of the MSCI ACWI
Ex-Canada Index
Investment styleIndexed
Investment limits
Industrial Alliance Fund
Min. Max.
Short term 0% 20%Units of the underlying fund 80% 100%
Risk level
Underlying Fund�
BlackRock CDN MSCI ACWI Ex-CanadaIndex Fund
Global Equity Index ACWI (BlackRock)
Very Low to Moderate low Low moderate Moderate to high High
North America53.80%
Europe24.22%
Asia and Pacific19.00%
Mid-east and Africa1.39%
Latin America1.34%
Short term and other0.25%
North America53.80%
Europe24.22%
Asia and Pacific19.00%
Mid-east and Africa1.39%
Latin America1.34%
Short term and other0.25%
Performance of the Industrial Alliance Fund - Gross returnsReturns before deduction of management and administration fees
Compound returns SinceAs at September 30, 2015 YTD 1 month 3 months 6 months 1 year 2 years 3 years 4 years 5 years 10 years July 2012
Fund 8.1 (2.7) (2.3) (3.4) 12.9 16.6 18.6 17.8* 12.8* - 18.2Benchmark index1 8.2 (2.9) (2.6) (3.6) 12.8 16.8 19.1 18.0 13.1 -
Annual returnsAs at December 31 14 13 12 11 10 09 08 07 06 05
Fund 13.7 30.2 14.0* (4.6)* 6.2* 12.8* (26.4)* - - -Benchmark index1 13.7 31.9 13.9 (4.8) 6.5 13.7 (27.5) - - -
1 MSCI ACWI Ex-Canada Index (Can. $) (Reuters) (net ret.).* Simulation of past returns as if the Fund had been in effect for these periods.
Top 10 Holdings of the underlying fundAs at September 30, 2015
iShares Core MSCI Emerging Markets ETF 10.24% General Electric Co. 0.81%
Apple Inc. 2.00% Berkshire Hathaway Finance Corp., Class B 0.78%
Microsoft Corp. 1.13% Wells Fargo & Co. 0.76%
Exxon Mobil Corp. 0.99% Nestlé SA 0.74%
Johnson & Johnson 0.82% JPMorgan Chase & Co. 0.72%
18.99%
Sector Allocation of the underlying fundAs at September 30, 2015
Global Equity Portfolio
Financials 21.01%
Information Technology 14.53%
Consumer Discretionary 12.70%
Health Care 12.42%
Industrials 10.64%
Consumer Staples 10.52%
Energy 6.19%
Materials 4.54%
Telecommunication Services 3.80%
Utilities 3.40%
99.75%
Asset mix of theIndustrial Alliance FundAs at September 30, 2015 Distribution
Short term 0.05%Units of the underlying fund 99.95%
100.00%
Total net assets: $69.8 million

Group savingsand retirement
Industrial AllianceQuarterly Update | Group Investment FundsThird quarter, ending September 30, 2015
Past performance is not a guarantee of future returns.
Global Equity (Hexavest)
Commentary
The Fund is invested in equity securities related to the global stock markets. The Fund is managed according to an approach that consists of actively managing each decisional level (regional allocation, choice of country, sector allocation, securities selection and management of currencies) in order to diversify the sources of value added and reduce the risk related to the portfolio. The managers place great importance in the preservation of their clients capital. The main decisions are guided by a fundamental analysis of macroeconomic factors (Top-Down style) and are backed by internally developed quantitative models.
Asset mix of the underlying fundAs at September 30, 2015
Fund Code: 500Inception date: January 2009
Investment Advisor
Management team composed of several managers
Objectives of the Fund• Targets long term capital appreciation
through investments in equity securities from around the world
• Conforms to an investment horizon that is long enough to endure the volatility of the market values
Investment styleValue
Investment limits
Industrial Alliance Fund
Min. Max.
Short term 0% 20%Units of the underlying fund 80% 100%
Underlying fund
Min. Max.
Short term 0% 10%Equity 90% 100%Currency 40% 100%
Risk level
Underlying Fund�Hexavest World Fund
Very Low to Moderate low Low moderate Moderate to high High
Top 10 Holdings of the underlying fundAs at September 30, 2015
AT&T Inc. 2.23% Verizon Communications Inc. 1.50%
Pfizer Inc. 2.04% Wal-Mart Stores Inc. 1.49%
The Southern Co. 1.78% Johnson & Johnson 1.43%
Eli Lilly and Co. 1.68% The Coca-Cola Co. 1.35%
Procter & Gamble Co. 1.57% Microsoft Corp. 1.31%
16.38%
North America52.42%
Europe19.91%
Asia and Pacific16.91%
Short term and other9.29%
Latin America0.76%
Mid-east and Africa0.71%
North America52.42%
Europe19.91%
Asia and Pacific16.91%
Short term and other9.29%
Latin America0.76%
Mid-east and Africa0.71%
Performance of the Industrial Alliance Fund - Gross returnsReturns before deduction of management and administration fees
Compound returns SinceAs at September 30, 2015 YTD 1 month 3 months 6 months 1 year 2 years 3 years 4 years 5 years 10 years Jan. 2009
Fund 11.0 (1.4) 1.6 (0.1) 16.7 18.6 19.6 18.0 13.6 7.9 7.8Benchmark index1 8.5 (2.4) (1.7) (3.0) 13.4 17.8 20.3 19.0 14.1 6.2
Annual returnsAs at December 31 14 13 12 11 10 09 08 07 06 05
Fund 15.0 32.5 9.8 0.1 3.0 10.5 (8.9) (9.9) 18.4 7.7*Benchmark index1 14.5 35.4 13.3 (3.4) 6.2 11.1 (26.5) (7.5) 20.0 6.1
1 MSCI - World Index (Can. $) (net ret.).* Simulation of past returns as if the Fund had been in effect for these periods.
Asset mix of theIndustrial Alliance FundAs at September 30, 2015 Distribution
Short term 0.03%Units of the underlying fund 99.97%
100.00%
Total net assets: $178.2 million

Group savings and retirement
Industrial AllianceQuarterly Update | Group Investment FundsThird quarter, ending September 30, 2015
Past performance is not a guarantee of future returns.
Global Equity (Templeton)
Commentary
The manager of this Fund favours a bottom-up approach, a vigorous investment method based on value and patience. The Fund’s value style means that the manager looks for securities that are undervalued by the market and have strong growth potential. The securities in the portfolio are therefore securities of established companies with mid to large market capitalizations, from different countries around the world. The allocation of these various countries is primarily a consequence of the manager’s bottom-up approach rather than his forecasts with respect to different areas of the world.
Asset mix of the underlying fundAs at September 30, 2015
Fund Code: 465Inception date: November 2001
Investment Advisor
Peter M. Moeschter, MBA, CFA
Objectives of the Fund• Targets long term capital appreciation
through investments in equity securities from around the world
• Conforms to an investment horizon that is long enough to endure the volatility of the market values
Investment styleValue
Investment limits
Industrial Alliance Fund
Min. Max.
Short term 0% 20%Units of the underlying fund 80% 100%
Risk level
Underlying Fund�Templeton Master Trust Fund, Series 1
Very Low to Moderate low Low moderate Moderate to high High
Top 10 Holdings of the underlying fundAs at September 30, 2015
Microsoft Corp. 2.53% JPMorgan Chase & Co. 1.77%
Gilead Sciences Inc. 2.25% Nissan Motor Co. Ltd. 1.72%
Teva Pharmaceutical Industries Ltd., Sponsored ADR 2.05% Morgan Stanley 1.69%
Citigroup Inc. 1.87% Amgen Inc. 1.69%
Allergan Inc. 1.83% Sky PLC 1.69%
19.09%
Europe42.89%
North America38.94%
Asia and Pacific13.74%
Short term and other2.38%Mid-east and Africa
2.05%
Europe42.89%
North America38.94%
Asia and Pacific13.74%
Short term and other2.38%Mid-east and Africa
2.05%
Performance of the Industrial Alliance Fund - Gross returnsReturns before deduction of management and administration fees
Compound returns SinceAs at September 30, 2015 YTD 1 month 3 months 6 months 1 year 2 years 3 years 4 years 5 years 10 years Nov. 2001
Fund 6.5 (4.1) (4.9) (4.5) 8.8 15.1 22.7 20.0 14.0 6.8 6.6Benchmark index1 8.5 (2.4) (1.7) (3.0) 13.4 17.8 20.3 19.0 14.1 6.2
Annual returnsAs at December 31 14 13 12 11 10 09 08 07 06 05
Fund 10.3 44.9 19.2 (8.1) 2.4 15.2 (28.9) (6.3) 27.7 7.1Benchmark index1 14.5 35.4 13.3 (3.4) 6.2 11.1 (26.5) (7.5) 20.0 6.1
1 MSCI - World Index (Can. $) (net ret.).
Asset mix of the Industrial Alliance FundAs at September 30, 2015 Distribution
Short term 0.09%Units of the underlying fund 99.91%
100.00%
Total net assets: $277.8 million

Group savingsand retirement
Industrial AllianceQuarterly Update | Group Investment FundsThird quarter, ending September 30, 2015
Past performance is not a guarantee of future returns.
Global Equity (Aberdeen)
Commentary
Aberdeen’s global equity strategy is built around a high conviction “best ideas” approach, designed to allow their Global Equity Team to capitalize on the expertise of their regional equity research teams.
As a bottom-up stock picking manager, Aberdeen believes that investing across the globe provides a wealth of opportunities.
It offers direct access to the very best and strongest companies from around the world. Such companies, as well as offering performance potential, are also well positioned to respond to a constantly changing economic and business environment.
By giving their fund managers free rein to invest anywhere in the global community, they are providing them with greater opportunities to deliver strong performance.
Asset mix of the underlying fundAs at September 30, 2015
Fund Code: 120Inception date: November 2013
Investment Advisor
Management team composed of several managers
Objectives of the Fund• Targets long term capital appreciation
through investments in equity securities from around the world
• Conforms to an investment horizon that is long enough to endure the volatility of the market values
Investment styleCore with a value bias
Investment limits
Industrial Alliance Fund
Min. Max.
Short term 0% 20%Units of the underlying fund 80% 100%
Underlying fund
Min. Max.
Short term 0% 20%Foreign equity securities 80% 100%
Risk level
Underlying Fund�Aberdeen Canada Global Equity Fund
Very Low to Moderate low Low moderate Moderate to high High
Top 10 Holdings of the underlying fundAs at September 30, 2015
EOG Resources Inc. 3.90% Taiwan Semiconductor Manufacturing Co. Ltd. 3.30%
Roche Holdings AG 3.60% Pepsico Inc. 2.70%
Novartis AG, ADR 3.50% Oracle Corp. 2.60%
CVS Health Corp. 3.50% Samsung Electronics Co. Ltd. 2.60%
British American Tobacco PLC 3.30% Shin-Etsu Chemical Co. Ltd. 2.50%
31.50%
Europe36.10%
North America35.10%
Asia and Pacific18.50%
Latin America5.00%
Mid-east and Africa2.70%Short term and other
2.60%
Europe36.10%
North America35.10%
Asia and Pacific18.50%
Latin America5.00%
Mid-east and Africa2.70%Short term and other
2.60%
Performance of the Industrial Alliance Fund - Gross returnsReturns before deduction of management and administration fees
Compound returns SinceAs at September 30, 2015 YTD 1 month 3 months 6 months 1 year 2 years 3 years 4 years 5 years 10 years Nov. 2013
Fund (0.4) (3.5) (6.3) (8.8) (0.7) 8.5* 12.0* 12.8* 10.3* - 6.8Benchmark index1 8.5 (2.4) (1.7) (3.0) 13.4 17.8 20.3 19.0 14.1 -
Annual returnsAs at December 31 14 13 12 11 10 09 08 07 06 05
Fund 10.6 21.6* 13.7* 2.0* 6.1* 12.2* - - - -Benchmark index1 14.5 35.4 13.3 (3.4) 6.2 11.1 - - - -
1 MSCI - World Index (Can. $) (net ret.).* Simulation of past returns as if the Fund had been in effect for these periods.
Asset mix of theIndustrial Alliance FundAs at September 30, 2015 Distribution
Short term 0.11%Units of the underlying fund 99.89%
100.00%
Total net assets: $7.0 million

Group savingsand retirement
Industrial AllianceQuarterly Update | Group Investment FundsThird quarter, ending September 30, 2015
Past performance is not a guarantee of future returns.
Global Equity Small Cap (Deutsche AWM)
Commentary
The mantra of Deutsche Asset & Wealth Management (Deutsche AWM) is to “find growth, avoid risk” and it does this by investing in small, high-quality small and mid cap growth companies globally through bottom-up research. The Fund strategy is driven by best ideas from a team of global, locally based analysts and portfolio managers. Deutsche AWM seeks to achieve favorable investment returns over the course of a full market cycle through a disciplined investment process and rigorous risk management. As a result, the portfolio has a long term investment horizon which can be seen by its low turnover rate. The Fund is benchmark aware but does not manage to the benchmark, therefore sector and country weightings are a residual of stock selection. The portfolio is well diversified and will typically hold between 75 and 125 securities.
Asset mix of the underlying fundAs at September 30, 2015
Fund Code: 531Inception date: March 2008
Investment Advisor
Management team composed of several managers
Objectives of the Fund• Targets long term capital appreciation
through investments in small and mid cap equity securities from around the world
• Conforms to an investment horizon that is long enough to endure the volatility of the market values
Investment styleGrowth
Investment limits Min. Max.
Short term 0% 20%Foreign equity securities 80% 100%
Risk level
The Fund is managed by Deutsche Asset & Wealth Management (Deutsche AWM) since March 31, 2008. Prior to this date, the Fund was managed by Evergreen Investments.
Very Low to Moderate low Low moderate Moderate to high High Top 10 Holdings of the underlying fund
As at September 30, 2015
United Internet AG 2.31% Providence Service Corp. 1.73%
Kusuri No Aoki Co. Ltd. 2.01% Nippon Seiki Co. Ltd. 1.69%
Flamel Technologies, Sponsored ADR 1.97% Casey's General Stores Inc. 1.60%
Ryanair Holdings PLC, Sponsored ADR 1.89% Middleby Corp. 1.49%
Babcock International Group PLC 1.85% Ai Holdings Corp. 1.42%
17.96%
Equity97.07%
Short term and other2.93%
Equity97.07%
Short term and other2.93%
Performance - Gross returnsReturns before deduction of management and administration fees
Compound returns SinceAs at September 30, 2015 YTD 1 month 3 months 6 months 1 year 2 years 3 years 4 years 5 years 10 years Mar. 2008
Fund 13.6 (3.3) (1.5) (1.7) 17.3 16.4 22.3 19.4 14.6 - 7.7Benchmark index1 10.8 (3.0) (3.0) (3.1) 17.9 17.3 22.6 21.1 15.9 -
Annual returnsAs at December 31 14 13 12 11 10 09 08 07 06 05
Fund 5.7 44.8 13.0 (6.8) 19.7 26.9 (36.1) 0.9 - -Benchmark index1 11.6 42.1 15.6 (6.6) 20.3 23.7 (27.6) (14.3) - -
1 MSCI - World Small Cap Index (Can. $).
Total net assets: $86.5 million

Group savingsand retirement
Industrial AllianceQuarterly Update | Group Investment FundsThird quarter, ending September 30, 2015
Past performance is not a guarantee of future returns.
Global Equity Small Cap (Mawer)
Commentary
The objective of the Global Equity Small Cap Fund is to make long term investments in equities which belong to small companies around the world. To do so, the Fund’s strategy is based on small cap value stocks and especially on the economic foundations of companies. The manager focuses on companies that have a good management team and stable cash flows, generate dividends and trade below their intrinsic value. The manager uses a very disciplined approach, based on research, which favours securities selection according to the bottom-up approach. The portfolio has a long term investment horizon, which can be seen by its low turnover rate, and therefore minimizes transaction costs.
Asset mix of the underlying fundAs at September 30, 2015
Fund Code: 130Inception date: November 2013
Investment Advisor
Management team composed of several managers
Objectives of the Fund• Aims to achieve long term capital growth
through investments in global small cap equity securities
• Conforms to investment horizons that are sufficiently distant to tolerate the volatility of the market values
Investment styleGrowth at a reasonable price
Investment limits
Industrial Alliance Fund
Min. Max.
Short term 0% 20%Units of the underlying fund 80% 100%
Risk level
Underlying FundMawer Global Small Cap Fund
Very Low to Moderate low Low moderate Moderate to high High
Top 10 Holdings of the underlying fundAs at September 30, 2015
NCC Group PLC 5.69% Loomis AB 3.60%
DCC PLC 5.12% Amsterdam Commodities NV 3.16%
PayPoint PLC 4.55% VZ Holdings AG 3.13%
Constellation Software Inc. 4.50% Origin Enterprises PLC 3.08%
Cineworld Group PLC 3.68% XP Power Ltd. 2.65%
39.16%
Europe55.09%
Asia and Pacific19.22%
North America12.06%
Short term and other11.07%
Mid-east and Africa2.56%
Europe55.09%
Asia and Pacific19.22%
North America12.06%
Short term and other11.07%
Mid-east and Africa2.56%
Performance of the Industrial Alliance Fund - Gross returnsReturns before deduction of management and administration fees
Compound returns SinceAs at September 30, 2015 YTD 1 month 3 months 6 months 1 year 2 years 3 years 4 years 5 years 10 years Nov. 2012
Fund 20.2 (0.3) 1.8 6.3 25.2 25.9* 30.7* 29.0* 24.6* - 23.0Benchmark index1 10.8 (3.0) (3.0) (3.1) 17.9 17.3 22.6 21.1 15.9 -
Annual returnsAs at December 31 14 13 12 11 10 09 08 07 06 05
Fund 14.0 50.0* 31.6* 2.2* 18.5* 42.2* (28.5)* - - -Benchmark index1 11.6 42.1 15.6 (6.6) 20.3 23.7 (27.6) - - -
1 MSCI – World Small Cap Index (Can. $).* Simulation of past returns as if the Fund had been in effect for these periods.
Asset mix of theIndustrial Alliance FundAs at September 30, 2015 Distribution
Short term 0.08%Units of the underlying fund 99.92%
100.00%
Total net assets: $19.1 million
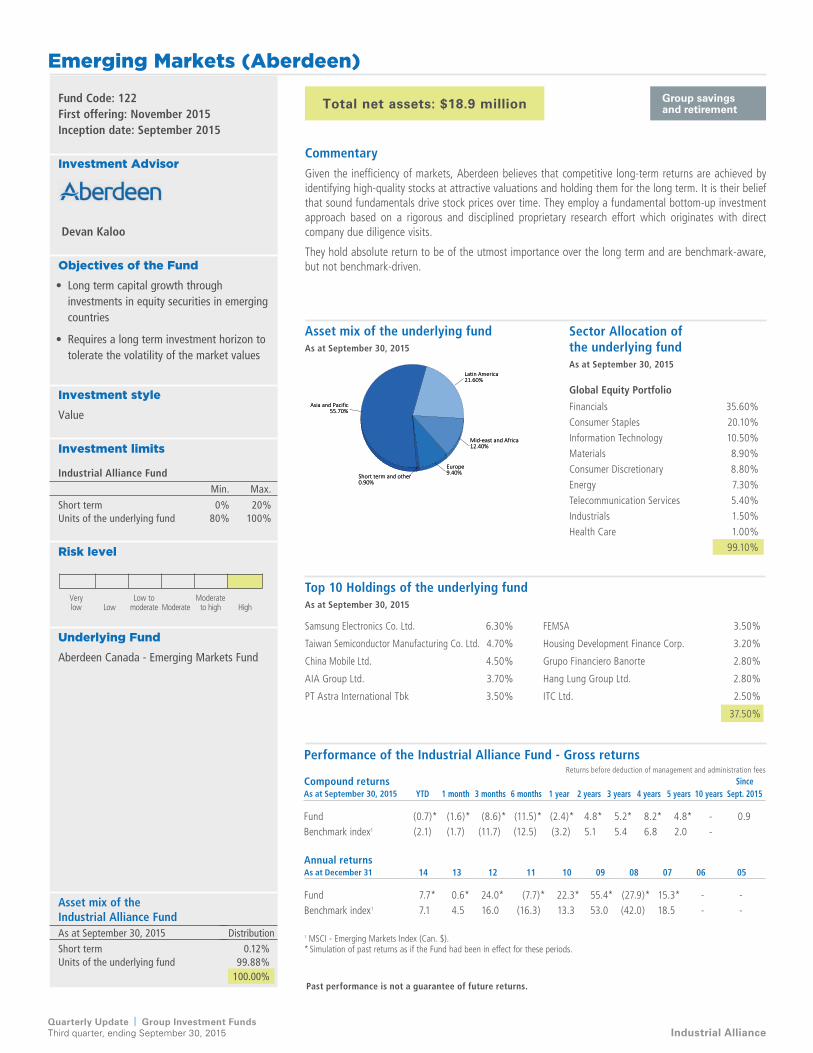
Group savingsand retirement
Industrial AllianceQuarterly Update | Group Investment FundsThird quarter, ending September 30, 2015
Past performance is not a guarantee of future returns.
Emerging Markets (Aberdeen)
Commentary
Given the inefficiency of markets, Aberdeen believes that competitive long-term returns are achieved by identifying high-quality stocks at attractive valuations and holding them for the long term. It is their belief that sound fundamentals drive stock prices over time. They employ a fundamental bottom-up investment approach based on a rigorous and disciplined proprietary research effort which originates with direct company due diligence visits.
They hold absolute return to be of the utmost importance over the long term and are benchmark-aware, but not benchmark-driven.
Asset mix of the underlying fundAs at September 30, 2015
Fund Code: 122First offering: November 2015Inception date: September 2015
Investment Advisor
Devan Kaloo
Objectives of the Fund• Long term capital growth through
investments in equity securities in emerging countries
• Requires a long term investment horizon to tolerate the volatility of the market values
Investment styleValue
Investment limits
Industrial Alliance Fund
Min. Max.
Short term 0% 20%Units of the underlying fund 80% 100%
Risk level
Underlying Fund�Aberdeen Canada - Emerging Markets Fund
Very Low to Moderate low Low moderate Moderate to high High
Top 10 Holdings of the underlying fundAs at September 30, 2015
Samsung Electronics Co. Ltd. 6.30% FEMSA 3.50%
Taiwan Semiconductor Manufacturing Co. Ltd. 4.70% Housing Development Finance Corp. 3.20%
China Mobile Ltd. 4.50% Grupo Financiero Banorte 2.80%
AIA Group Ltd. 3.70% Hang Lung Group Ltd. 2.80%
PT Astra International Tbk 3.50% ITC Ltd. 2.50%
37.50%
Asia and Pacific55.70%
Latin America21.60%
Mid-east and Africa12.40%
Europe9.40%Short term and other
0.90%
Asia and Pacific55.70%
Latin America21.60%
Mid-east and Africa12.40%
Europe9.40%Short term and other
0.90%
Performance of the Industrial Alliance Fund - Gross returnsReturns before deduction of management and administration fees
Compound returns SinceAs at September 30, 2015 YTD 1 month 3 months 6 months 1 year 2 years 3 years 4 years 5 years 10 years Sept. 2015
Fund (0.7)* (1.6)* (8.6)* (11.5)* (2.4)* 4.8* 5.2* 8.2* 4.8* - 0.9Benchmark index1 (2.1) (1.7) (11.7) (12.5) (3.2) 5.1 5.4 6.8 2.0 -
Annual returnsAs at December 31 14 13 12 11 10 09 08 07 06 05
Fund 7.7* 0.6* 24.0* (7.7)* 22.3* 55.4* (27.9)* 15.3* - -Benchmark index1 7.1 4.5 16.0 (16.3) 13.3 53.0 (42.0) 18.5 - -
1 MSCI - Emerging Markets Index (Can. $).* Simulation of past returns as if the Fund had been in effect for these periods.
Sector Allocation of the underlying fundAs at September 30, 2015
Global Equity Portfolio
Financials 35.60%
Consumer Staples 20.10%
Information Technology 10.50%
Materials 8.90%
Consumer Discretionary 8.80%
Energy 7.30%
Telecommunication Services 5.40%
Industrials 1.50%
Health Care 1.00%
99.10%
Asset mix of theIndustrial Alliance FundAs at September 30, 2015 Distribution
Short term 0.12%Units of the underlying fund 99.88%
100.00%
Total net assets: $18.9 million

Group savings and retirement
Industrial AllianceQuarterly Update | Group Investment FundsThird quarter, ending September 30, 2015
Past performance is not a guarantee of future returns.
Balanced-Risk Allocation (Invesco)
Commentary
The Fund’s investment philosophy is based on the conviction that the understanding, management and allocation of risk are fundamental to creating a good portfolio. The Fund’s strategy allows investors to take advantage of a risk premium by investing in stock markets, bond markets and commodities according to a process based on balanced risk allocation. More specifically, the team selects the asset that is best suited to this strategy, allocates it based on exclusive risk management techniques and then uses an active positioning process to improve expected returns. The primary objective is to create a portfolio that will generate good returns in various economic environments (recession, non-inflationary growth, inflationary growth).
Fund Code: 491Inception date: November 2013
Investment Advisor
Management team composed of several managers
Objectives of the Fund• Annualized return exceeding by at least 6%
that of the FTSE TMX Canada 91 Day T-Bill Index over moving four-year periods
• 8% target portfolio volatility
• Approach that focuses on balanced risk based on investments in stock markets, bond markets and commodities
• Good returns in various economic environments
Investment styleAbsolute return
Investment limits
Industrial Alliance Fund
Min. Max.
Short term 0% 20%Units of the underlying fund 80% 100%
Risk level
Underlying Fund�Invesco Balanced-Risk Allocation Fund
Very Low to Moderate low Low moderate Moderate to high High
Long Gilt Futures, expiring December 2015 16.91%
Canada 10 Year Bonds Futures, expiring December 2015 16.39%
Euro Bonds Futures, expiring December 2015 15.21%
Australian 10 Year Bonds Futures, expiring December 2015 12.19%
Japan 10 Year Bonds Futures, expiring December 2015 10.78%
U.S. Treasury Long Bonds Futures, expiring December 2015 8.45%
FTSE 100 Index Futures, expiring December 2015 6.11%
Dow Jones Eurostoxx 50 Futures, expiring December 2015 5.56%
Hang Seng Index Futures, expiring October 2015 4.50%
Russell 2000 Index Mini Futures, expiring December 2015 4.41%
Topix Tokyo Price Index Futures, expiring December 2015 3.95%
100 Ounce Gold Futures, expiring December 2015 3.74%
E-Mini S&P 500 Index Futures, expiring December 2015 3.20%
LME Copper Futures, expiring November 2015 2.60%
Silver Futures, expiring December 2015 2.44%
% of the underlying fund % of total notional value
Fixed-income futures contracts 79.93% 60.92%
Equity futures contracts 27.73% 21.13%
Commodity futures contracts 23.56% 17.95%
131.22% 100.00%
LME Primary Aluminum Futures, expiring November 2015 2.10%
Sugar #11, expiring March 2016 1.94%
RBOB Gasoline Futures, expiring November 2015 1.93%
Soybean Meal Futures, expiring December 2015 1.87%
Soybean Futures, expiring November 2015 1.80%
Brent Crude Oil Futures, expiring March 2016 1.03%
Cotton No. 2 Futures, expiring December 2015 1.01%
WTI Crude Futures, expiring March 2016 0.95%
Wheat Futures, expiring December 2015 0.52%
Soybean Oil Futures, expiring December 2015 0.44%
Corn Futures, expiring December 2015 0.39%
Gas Oil Futures, expiring December 2015 0.31%
Coffee 'C' Futures, expiring December 2015 0.31%
Natural Gas Futures, expiring December 2015 0.18%
131.22%
Asset class allocation of the underlying fundAs at September 30, 2015
Holdings of the underlying fundAs at September 30, 2015
Performance of the Industrial Alliance Fund - Gross returnsReturns before deduction of management and administration fees
Compound returns SinceAs at September 30, 2015 YTD 1 month 3 months 6 months 1 year 2 years 3 years 4 years 5 years 10 years Nov. 2013
Fund (1.9) (0.8) (3.8) (6.0) 0.3 3.9* - - - - 4.2Composite index1 5.9 (1.2) (0.4) (1.8) 9.7 12.4 - - - -
Annual returnsAs at December 31 14 13 12 11 10 09 08 07 06 05
Fund 9.3 3.2* - - - - - - - -Composite index1 11.5 19.5 - - - - - - - -
1 MSCI - World Index (Can. $) (net ret.) (60%), Barclays U.S. Aggregate Index (CAD Hedged) (40%).* Simulation of past returns as if the Fund had been in effect for these periods.
Asset mix of the Industrial Alliance FundAs at September 30, 2015 Distribution
Short term 0.11%Units of the underlying fund 99.89%
100.00%
Total net assets: $5.9 million

Group savingsand retirement
Industrial AllianceQuarterly Update | Group Investment FundsThird quarter, ending September 30, 2015
Past performance is not a guarantee of future returns.
Global Infrastructure (Lazard)
Commentary
Infrastructure is the basic facilities, services and installations needed for the functioning of a community or society. Lazard believes that infrastructure assets have a number of investment characteristics that make them attractive for investors. These include the long life of the assets, low risk of capital loss and inflation-linked returns. The Lazard Global Listed Infrastructure (Canada) Fund allows investors to access such opportunities by investing in companies listed on global stock exchanges.
Asset mix of the underlying fundAs at September 30, 2015
Fund Code: 757Inception date: November 2011
Investment Advisor
Management team composed of several managers
Objectives of the Fund• Targets long term capital appreciation
through investments in real estate equity securities of companies that operate in infrastructure sectors
• Conforms to an investment horizon that is long enough to endure the volatility of the market values
Investment styleValue
Investment limits
Industrial Alliance Fund
Min. Max.
Short term 0% 20%Units of the underlying fund 80% 100%
Risk level
Underlying Fund�Lazard Global Listed Infrastructure (Canada) Fund
Very Low to Moderate low Low moderate Moderate to high High
Sector Allocation of the underlying fundAs at September 30, 2015
Global Equity Portfolio
Toll Roads 26.40%
Electricity Utilities 16.00%
Railroads 12.80%
Diversified Utilities 12.30%
Communication Infrastructures 10.70%
Gas Utilities 9.70%
Airports 7.50%
Water Utilities 4.60%
100.00%
Top 10 Holdings of the underlying fundAs at September 30, 2015
Snam SpA 8.18% Abertis Infraestructuras SA 6.07%
Terna SpA 8.10% Norfolk Southern Corp. 6.06%
Atlantia SpA 6.96% SES SA 5.86%
Vinci SA 6.69% Great Plains Energy Inc. 5.30%
CSX Corp. 6.10% Eutelsat Communications 4.45%
63.77%
Europe62.61% North America
22.44%
Asia and Pacific14.95%
Europe62.61% North America
22.44%
Asia and Pacific14.95%
Performance of the Industrial Alliance Fund - Gross returnsReturns before deduction of management and administration fees
Compound returns SinceAs at September 30, 2015 YTD 1 month 3 months 6 months 1 year 2 years 3 years 4 years 5 years 10 years Nov. 2011
Fund 6.7 1.0 1.7 (2.6) 11.7 16.9 19.7 19.4* 15.4* - 19.8Benchmark index1 (0.3) (0.7) (0.9) (4.7) 6.2 12.4 14.9 14.7 11.5 -
Annual returnsAs at December 31 14 13 12 11 10 09 08 07 06 05
Fund 19.9 29.4 19.2 0.0* 10.5* 19.0* (32.6)* - - -Benchmark index1 20.9 21.0 13.3 0.3 4.3 14.8 (32.3) - - -
1 Since April 1, 2015: FTSE Developed Core Infrastructure 50/50 Before April 1, 2015: UBS Global 50/50 Infrastructure and Utilities Index (Local $).* Simulation of past returns as if the Fund had been in effect for these periods.
Asset mix of theIndustrial Alliance FundAs at September 30, 2015 Distribution
Short term 0.11%Units of the underlying fund 99.89%
100.00%
Total net assets: $14.9 million

Group savingsand retirement
Industrial AllianceQuarterly Update | Group Investment FundsThird quarter, ending September 30, 2015
Past performance is not a guarantee of future returns.
Global Direct Real Estate - Portfolios (UBS)
Commentary
The target allocation of the Fund is 75% in the UBS fund, 20% in the BlackRock fund and 5% in the Money Market fund. In order to offer diversified exposure to key global real estate markets, UBS Asset Management allocates the Fund’s assets among various high-quality specialized institutional fund managers offering different management styles and strategies. Investments are selected by a team of UBS Asset Management managers. Tactical overweighting and underweighting is the product of research activities and are based on the points of view of UBS Global Real Estate Research House. Allocation in the Americas is focused in the U.S. with exposure in Canada. Exposure in Europe is largely weighted in favour of the strongest and most defensive markets in the region, with an overweighting in the U.K.
BlackRock fund uses an index approach to manage its fund. To do so, it invests in all securities comprising its reference index in weightings that match the index’s weightings as closely as possible.
Geographical allocation of the underlying UBS fund†◊
As at August 31, 2015
Fund Code: 152First offering: November 2015Inception date: September 2015
Investment Advisor
Eric Byrne
Objectives of the Fund• Aims to offer diversified exposure to key
global real estate markets through a diversified portfolio which includes quality buildings around the world, invested in several direct real estate funds and also through a global real estate equity index fund, which serves to guarantee liquidity of the Fund
• Conforms to a medium and long term investment horizon
Investment styleMulti-management
Investment limits
Industrial Alliance Fund
Min. Max.
Short term 0% 20%Units of the underlying funds 80% 100%
Risk level
Underlying Funds • USB (Lux) Real Estate Funds Selection-Global
• BlackRock CDN Global Developed Real Estate Index Fund, Class D
• Money Market Fund
Very Low to Moderate low Low moderate Moderate to high High
United States35.56%
Short term and other21.65%
United Kingdom17.69%
Cont. Europe7.47%
Japan6.83%
Australia4.78%
Other APAC3.31%Canada
2.71%
United States35.56%
Short term and other21.65%
United Kingdom17.69%
Cont. Europe7.47%
Japan6.83%
Australia4.78%
Other APAC3.31%Canada
2.71%
North America55.22%
Asia and Pacific26.62%
Europe17.37%
Short term and other0.67%
Mid-east and Africa0.12%
North America55.22%
Asia and Pacific26.62%
Europe17.37%
Short term and other0.67%
Mid-east and Africa0.12%
Performance of the Industrial Alliance Fund - Gross returnsReturns before deduction of management and administration fees
Compound returns SinceAs at September 30, 2015 YTD 1 month 3 months 6 months 1 year 2 years 3 years 4 years 5 years 10 years Sept. 2015
Fund 5.6* 0.1* 0.7* 3.1* 7.1* 8.6* 8.5* - - - 0.1Benchmark index1 5.5 0.6 2.1 2.1 8.5 8.1 7.7 - - -
Annual returnsAs at December 31 14 13 12 11 10 09 08 07 06 05
Fund 9.5* 8.7* - - - - - - - -Benchmark index1 9.4 5.9 - - - - - - - -
1 CPI + 4% (75%), FTSE EPRA/NAREIT Developed Index (Can. $) (Reuters) (net ret.) (20%), FTSE TMX Canada 91 Day T-Bill Index (5%)* Simulation of past returns as if the Fund had been in effect for these periods.
Asset mix of theIndustrial Alliance FundAs at September 30, 2015 Distribution
Short term 0.14%Units of the underlying fund 99.86%
100.00%
Total net assets: $35.8 million
Geographical allocation of the underlying BlackRock fund†
As at September 30, 2015
†Consult the underlying fund page, available in the quarterly bulletin at ia.ca/business/group-retirement publications, to obtain additional details on its allocation.◊Approximate figures from last available underlying fund reports. Allocation numbers may not add up to 100% due to rounding differences.


![I Overview of the System and the Basic Statistics [1] General … · 2018-06-02 · 6 2010 2030 2055 2060 2010 2030 2055 2060 2010 2030 2055 2060 2010 2030 2055 2060 127.18 million!](https://img.dokumen.tips/doc/110x75/5f7bc0b24d489855d56d059e/i-overview-of-the-system-and-the-basic-statistics-1-general-2018-06-02-6-2010.jpg)