Embed Size (px)
Citation preview

© 2015 Quest Offshore Resources, Inc.
Your Leading Source for Strategic Offshore Oil & Gas Market Intelligence
Quest OffshOre PrOduct catalOg
Clarity. Insight. Vision.

Who We areQuest is a boutique strategic advisory and consulting firm to the Oil & Gas industry worldwide. Quest is a leading source of market intelligence focused primarily on deepwater oil & gas specifically technology-led solutions for exploration, development and exploitation activities.
our missionThrough a dedicated team of sector specialists that focus on qualitative and quantitative data, Quest provides market expertise, strategic analysis, marketing communication and consultancy services.
our clientsAll major participants in the deepwater oil and gas market utilize our strategic market intelligence products and services. International, National and Independent oil companies subscribe to Quest data and services to better understand market conditions and supply chain dynamics when making key decisions for their offshore developments. Over 60 leading oilfield service companies rely on Quest’s market forecasts to provide insight into future business opportunities. Over 50 global financial services companies subscribe to Quest data and market reports as another important tool when following key deepwater market segments for investment opportunities.
What We doResearch & Consulting: Quest Offshore is a leading provider of strategic market intelligence to the global oil & gas community through subscriptions to our proprietary market forecast databases in addition to client-directed initiatives to provide our expert industry advice to enhance our customers’ business strategies.
Industry Events: MCE Deepwater Development is Quest’s major industry event which travels between major European cities each spring attracting senior executives and strategic decision makers from the leading companies participating in the deepwater market to discuss the opportunites and challenges of meeting future energy demand in tandem with advanced technology solutions.
Quest’s industry events feature the Early Career Engineer Program which provides new engineers in our industry a meaningful platform from which to discuss the technologies they’re working on to overcome some of today’s toughest challenges.
Traditional Publishing: Quest offers one weekly and two monthly newsletters covering global, regional and market-specific activity. All available newsletters include articles detailing major contract awards, corporate activity and high-profile market events.
Maps: Quest’s leading knowledge of the global deepwater market led us to produce our popular series of regional wall maps. Quest’s highly recognizable deepwater maps feature pertinent forecast field development projects and major exploration prospects. Quest maps provide an illustrative visual of subsea, floating production and pipeline infrastructure.
About Quest Offshore Resources
Quest Data Subscriptions ................................................ 3 Quest Data Product Offerings ...................................7-14
Quest Consulting & Capabilities ..................................... 4 Quest Events & Maps .................................................... 15
Quest Market Forecast Methodology .............................. 6
Table of Contents
John Chadderdon, CEOPaul Hillegeist, President & COO
Paul Hillegeist, President & COOCaitlin Traver, Sr. Director Market Research, Data DivisionSean Shafer, Manager of ConsultingJosh Douglas, Sales Manager
Josh Douglas, Sales ManagerBo Howard, Sr. Sales Manager -‐ Conferences & Advertising
Paul Hillegeist, President & COODave Thomas, Sr Editor
John Chadderdon, CEOElena Parsons, Event DirectorAllison Tonkin, Marketing ManagerBo Howard, Sr. Sales Manager -‐ Exhibition & SponsorshipsCaitlin Traver, Director of Technical Content
E-‐mail address is first name.last [email protected]
Conferences
Quest Quick Contacts
Sales & Advertising
Research, Data & Consulting
Executive -‐ Parnters
News Publication
Email address is [email protected]
2

Quest Data Subscriptions
�������������������������������
���������� ��������������������
�������������������
�������������������������
��������
���������������
������������������������
�����������������������������
��������������
�����������������
������������������
������������������������������� �
������������
����������
�����
����������������������
�������������� ����������
������������������������
���������� ����������������������
���������� ������������������������
�������
������������������ ��������������
Quest Offshore offers a full suite of database subscriptions tailored to the major market segments for offshore oil and gas. Quest provides comprehensive market analysis and forecasting of key trends coupled with full transparency of working data and pertinent models, as well as downloads of the market-specific databases to maximize usability by our clients.
Quest Data Subscription Products stem from the Quest Enhanced Deepwater Development Database where our team tracks deepwater exploration and development opportunities globally. We follow development opportunities from the pre-exploration stage and continue tracking through discovery, engineering, procurement, installation & startup through to decommissioning. Key data including operators and working interest owners, location, water depth, milestone timing and scope of project are updated and modeled on a continual basis to provide the most up-to-date information possible.
Quest applies proprietary forecasting methodologies as well as our expert market knowledge to this project-level data to provide historical and forecast trends on key project milestones, including award, installation and startup activity for major offshore equipment and services. Extensive working files are provided to our clients containing all data driving the graphs seen in the market overview. With the working files, our clients can extrapolate figures to apply to internal models or company presentations. Quest offers great flexibility to our clients with respect to your subscription. If one product does not fully answer your market intelligence questions, we can bring in components of other databases to provide the most valuable solution for your company.
3

Quest Consulting ServicesSa
mpl
ing
of Q
uest
Con
sult
ancy
Del
iver
able
s
Major International Oil Companies Gulf of Mexico Field Development Study
FPS Fabrication Yard Report
Subsea Equipment Pricing Study
Deepwater Equipment Cost Indices
Analysis of Current and Future Subsea Processing Applications
Forecast Marine Construction Asset Day Rate Model
FPS Hull and Topside Cost Analysis
Analytics and Forecast of Deepwater Supply Chain
Independent Oil Companies Multi-Project Component and Total Cost / Reserve Analysis
Production Assets Acquisition Analysis
FPS Replacement Cost Valuation Analysis
Comprehensive Project Development Strategy Review
OEM and Equipment Suppliers Targeted Drilling Rig Equipment Market Sizing
Analysis of Industry Decision Centers Related to Forecast Demand
Global Competitive Analysis
Report on the Market for Steel Tubes in Umbilicals
Strategic Acquisition Target Identification
Marine Construction Contractors Global SURF Installation Spending Report
Subsea Equipment Trends Study / Business Plan Support
Newbuild Vessel Cost Analysis
Marine Construction Vessel Valuation
FPS Contractors Global FPS Market Study with an Emphasis on FPSOs
Report on the Market for FPS Moorings
Global Market Study for Novel FPS Design
Major Fabricators Government Required Cost Benefit Analysis
Due Diligence Support for New Fabrication Yard
Financial Clients Comprehensive Investor Briefing & Market Report for Buy Side Investment Firm
Newbuild Pipelay/Construction Valuation and Market Study for Private Equity Investor
Detailed Supply & Demand Analysis for SURF Components for Private Equity Investor
Comprehensive Analysis of Market Opportunities for Niche Player for Private Equity Investor
Market Due Diligence for IPO of Marine Construction Company
Market Due Diligence for Debt Financing Company
Market Due Diligence for Private Equity Investment in Spin Off of Oil & Gas Contractor Division
Industry Lobby Groups Analysis of Economic Impact of Offshore Industry
Regulatory Impact Analysis
Regulatory Expert Testimony
Large Steel Suppliers Large Diameter Pipeline Competitor Analysis
Region-specific Analysis of Deep and Ultra Deepwater Steel Demand
Detailed Global SURF Project CAPEX Analysis
GoM OCTG Market Analysis and Strategy
Quest consulting services & experienceQuest is a leading source for valuable, client-directed consulting products and expertise that enables companies to make well-informed decisions across the offshore oil and gas industry. Quest Offshore’s Consultancy Practice has grown considerably as an extension of our comprehensive market analysis, accurate forecasting and industry expertise honed through our subscription products. Utilizing the Quest Enhanced Deepwater Development Database, in combination with our global network of key industry contacts, Quest maintains the flexibility to speak to a wide variety of questions and requirements through a client-driven consulting process aimed at providing accurate and concise results in a format best fitting the customer’s needs.
Clients engage Quest’s Consultancy Practice from all business areas involved in deepwater oil and gas including oil companies, financial firms, engineering firms, key manufacturers and industrial conglomerates, trade groups, and law firms. Our clients contact Quest as they: branch-out into new areas of the market; further analyze the competitive landscape; gain knowledge of the current and future pricing environment; expand upon a market trend illustrated in a current subscription product, or otherwise utilize the data and expertise of Quest.
Prepared by:
Quest Offshore Resources, Inc. Prepared for:
1600 Highway 6, Suite 300 American Petroleum Institute (API)
Sugar Land, TX 77478 National Ocean Industries Association (NOIA)
June 2011
United States Gulf of Mexico Oil and Natural Gas Industry Economic Impact Analysis
The Economic Impacts of GOM Oil and Natural Gas Development on the U.S. Economy
i
Key Findings
This report has documented the decline in
capital expenditures and operational
spending of the GoM offshore oil and
natural gas industry that occurred over the
2008 to 2010 period. The principal reasons
for this decline include the economic
recession in 2008-09 and the establishment
of a moratorium on deepwater drilling and
subsequent slowdown of permit issuance in
both GoM deep and shallow waters in 2010
and into 2011. We estimate that tens of
thousands of jobs have been lost in
response to the decline in capital
expenditures and operational spending of
the offshore GoM oil and natural gas
industry over this period.
We also demonstrate the near term
potential of the offshore GoM oil and natural
gas industry to create jobs, boost GDP and
generate tax revenues at all levels of
government – if the government pursues
a balanced regulatory approach that
allows for the timely development of the
backlog of GoM projects in an
environmentally responsible manner.
Under such government policy, we
estimate total spending by the GoM
offshore oil and natural gas industry to
increase by over 70 percent by 2013
from 2010 levels, and capital
expenditures to increase by over 140
percent. If potential spending levels are
reached, total employment supported by
the Gulf of Mexico oil and natural gas
industry in 2013 could exceed 430
thousand jobs or a 77 percent increase
from 2010.
.
Table 1: Estimated Historical and Projected Capital and Operational Spending, GDP
Impacts, and Employment1 Supported by the Offshore Gulf of Mexico Oil and Natural Gas
Industry (2008-2013)*
*Projected spending, GDP, and employment contingent on returning to pre-Macondo permitting rates.
Source: Quest Offshore Resources, Inc.
1 Total employment includes direct, indirect, and income induced employment.
($b illions)
2008 2009 2010 2011 2012 2013
Operating Expenditures $16.7 $17.2 $17.7 $21.6 $25.0 $25.7
Capital Expenditures $11.9 $9.7 $6.5 $8.9 $10.4 $15.7
GDP Impacts $30.8 $29.1 $26.1 $32.9 $38.2 $44.5
Total Employment 306,870 285,042 242,317 311,023 356,174 429,208
Historical Projected
26
Table 8: Estimated Historical and Projected Gulf of Mexico Oil and Natural Gas Industry
Domestic Spending Trends by Detailed Spending Type*
* Projected spending contingent on returning to pre-Macondo permitting rates.
Source: Quest Offshore Resources, Inc.
From 2009-2010, overall spending (both
deep and shallow water) fell by 10 percent.
The most affected sector was the drilling
sector, which saw a 41 percent decrease in
spending during the period as deepwater
drilling all but halted for two quarters of the
year due to the moratorium and shallow
water drilling significantly declined due to the
extreme slowing of drilling permit issuances.
The drilling sector is also expected to see
the most significant growth in spending if a
return to historical conditions occurs, with
drilling spending in 2013 expected to rise
165 percent from 2010 levels to $9.1 billion.
Facilities spending is also expected to see
significant growth from 2010 to 2013, with
spending expected to be up by 113 percent
over 2008 levels reaching $3.2 billion. For
this particular category, 2010 spending was
2008 2009 2010 2011 2012 2013
G&G $0.1 $0.1 $0.1 $0.1 $0.1 $0.1
Drilling $2.6 $3.5 $1.8 $2.6 $3.5 $4.8
Facilities $0.0 $0.0 $1.2 $1.9 $0.8 $1.9
SURF $3.0 $2.9 $1.3 $1.3 $1.9 $2.9
Total Deepwater $5.8 $6.5 $4.3 $5.9 $6.3 $9.8
2008 2009 2010 2011 2012 2013
G&G $0.1 $0.1 $0.1 $0.1 $0.1 $0.1
Drilling $4.0 $2.4 $1.6 $1.3 $2.5 $4.3
Facilities $1.1 $0.4 $0.4 $1.4 $1.3 $1.3
SURF $0.8 $0.2 $0.1 $0.4 $0.3 $0.3
Total Shallow Water $6.1 $3.2 $2.2 $3.1 $4.1 $5.9
Total CAPEX $11.9 $9.7 $6.5 $8.9 $10.4 $15.7
2008 2009 2010 2011 2012 2013
Total Deepwater $5.8 $6.2 $6.7 $8.5 $9.9 $10.3
2008 2009 2010 2011 2012 2013
Total Shallow Water $10.9 $11.0 $11.1 $13.1 $15.1 $15.4
Total OPEX $16.7 $17.2 $17.7 $21.6 $25.0 $25.8
Total Spend $28.5 $26.9 $24.2 $30.5 $35.4 $41.5
Projected
Deepwater
Capital Expenditures (Billions)
Shallow Water
Historical
Operating Expenditures (Billions)
Shallow Water Shallow Water
Deepwater
Shallow Water
Deepwater Deepwater
4
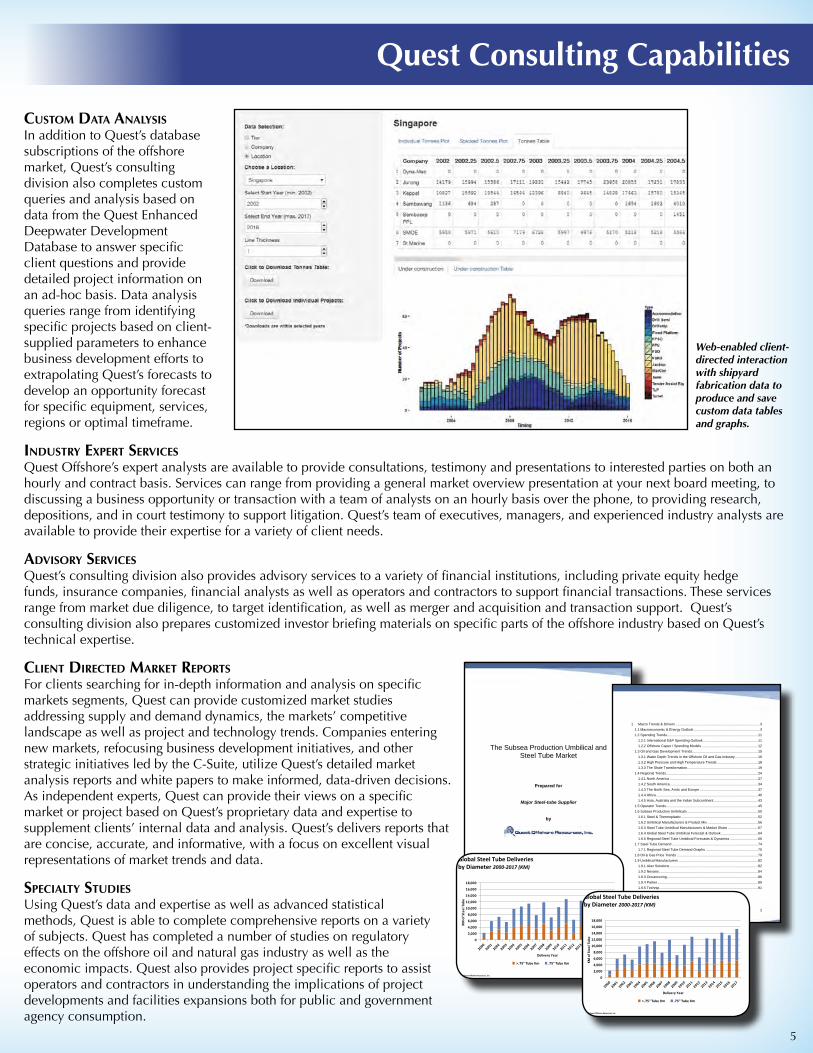
Quest Consulting Capabilities
custom data analysisIn addition to Quest’s database subscriptions of the offshore market, Quest’s consulting division also completes custom queries and analysis based on data from the Quest Enhanced Deepwater Development Database to answer specific client questions and provide detailed project information on an ad-hoc basis. Data analysis queries range from identifying specific projects based on client-supplied parameters to enhance business development efforts to extrapolating Quest’s forecasts to develop an opportunity forecast for specific equipment, services, regions or optimal timeframe.
industry expert servicesQuest Offshore’s expert analysts are available to provide consultations, testimony and presentations to interested parties on both an hourly and contract basis. Services can range from providing a general market overview presentation at your next board meeting, to discussing a business opportunity or transaction with a team of analysts on an hourly basis over the phone, to providing research, depositions, and in court testimony to support litigation. Quest’s team of executives, managers, and experienced industry analysts are available to provide their expertise for a variety of client needs.
advisory servicesQuest’s consulting division also provides advisory services to a variety of financial institutions, including private equity hedge funds, insurance companies, financial analysts as well as operators and contractors to support financial transactions. These services range from market due diligence, to target identification, as well as merger and acquisition and transaction support. Quest’s consulting division also prepares customized investor briefing materials on specific parts of the offshore industry based on Quest’s technical expertise.
client directed market reportsFor clients searching for in-depth information and analysis on specific markets segments, Quest can provide customized market studies addressing supply and demand dynamics, the markets’ competitive landscape as well as project and technology trends. Companies entering new markets, refocusing business development initiatives, and other strategic initiatives led by the C-Suite, utilize Quest’s detailed market analysis reports and white papers to make informed, data-driven decisions. As independent experts, Quest can provide their views on a specific market or project based on Quest’s proprietary data and expertise to supplement clients’ internal data and analysis. Quest’s delivers reports that are concise, accurate, and informative, with a focus on excellent visual representations of market trends and data.
specialty studiesUsing Quest’s data and expertise as well as advanced statistical methods, Quest is able to complete comprehensive reports on a variety of subjects. Quest has completed a number of studies on regulatory effects on the offshore oil and natural gas industry as well as the economic impacts. Quest also provides project specific reports to assist operators and contractors in understanding the implications of project developments and facilities expansions both for public and government agency consumption.
Web-enabled client-directed interaction with shipyard fabrication data to produce and save custom data tables and graphs.
1
The Subsea Production Umbilical and
Steel Tube Market
Prepared for
Major Steel-tube Supplier
by
2
1 Macro Trends & Drivers ....................................................................................... 3 Macroeconomic & Energy Outlook .................................................................... 3 1.1 Spending Trends .............................................................................................. 11 1.2
International E&P Spending Outlook ......................................................... 11 1.2.1 Offshore Capex / Spending Models .......................................................... 12 1.2.2
Oil and Gas Development Trends .................................................................... 15 1.3 Water Depth Trends in the Offshore Oil and Gas Industry ........................ 16 1.3.1 High Pressure and High Temperature Trends .......................................... 18 1.3.2 The Shale Transformation ......................................................................... 19 1.3.3
Regional Trends ............................................................................................... 24 1.4 North America ........................................................................................... 27 1.4.1 South America ........................................................................................... 34 1.4.2 The North Sea, Arctic and Europe ............................................................ 37 1.4.3 Africa ......................................................................................................... 40 1.4.4 Asia, Australia and the Indian Subcontinent .............................................. 43 1.4.5
Operator Trends ............................................................................................... 45 1.5 Subsea Production Umbilicals ......................................................................... 50 1.6
Steel & Thermoplastic ............................................................................... 52 1.6.1 Umbilical Manufacturers & Product Mix .................................................... 56 1.6.2 Steel Tube Umbilical Manufacturers & Market Share ............................... 57 1.6.3 Global Steel Tube Umbilical Forecast & Outlook ...................................... 64 1.6.4 Regional Steel Tube Umbilical Forecasts & Dynamics ............................. 66 1.6.5
Steel Tube Demand ......................................................................................... 74 1.7 Regional Steel Tube Demand Graphs ...................................................... 75 1.7.1
Oil & Gas Price Trends .................................................................................... 79 1.8 Umbilical Manufacturers .................................................................................. 82 1.9
Aker Solutions ........................................................................................... 82 1.9.1 Nexans ...................................................................................................... 84 1.9.2 Oceaneering .............................................................................................. 86 1.9.3 Parker ........................................................................................................ 89 1.9.4 Technip ...................................................................................................... 91 1.9.5
© 2014 Quest Offshore Resources, Inc.
Global Steel Tube Deliveries by Diameter 2000-‐2017 (KM)
0
2,000
4,000
6,000
8,000
10,000
12,000
14,000
16,000
18,000
KM of Steel Tub
e
Delivery Year
>.75" Tube Km .75" Tube Km
© 2014 Quest Offshore Resources, Inc.
Global Steel Tube Deliveries by Diameter 2000-‐2017 (KM)
0
2,000
4,000
6,000
8,000
10,000
12,000
14,000
16,000
18,000
KM of Steel Tub
e
Delivery Year
>.75" Tube Km .75" Tube Km
5
Where? Country, Block, Water Depth
Lease/Licensing Explora<on
Who? Operator, WI
Owner
What? Expl/Appr, Status, TDs, Drilling Rig
When? Spud Date,
Discovery Date
Discoveries
What? Forecast # SS
Trees, Flowlines, SPU, FPS
When? Forecast Bid, Award,
Installa<on and Startup Dates
Under
Development
Who? Engineering
Contractors, Mfg & Installa<on Bidders
Ongoing Communica<on/Research to Refine Scope and Timing of Project
Execu<on,
Startup & Life of Field
Who? EPC Contractors, Mfg/Suppliers/Fabricators,
Installa<ons Contractors
Where? Fabrica<on
Loca<ons, Supply Bases
What? Volume, Value, Type of all major SS & FPS
Equipment
When? Delivery Dates, Installa<on Dates, Startup & Decomm
Dates
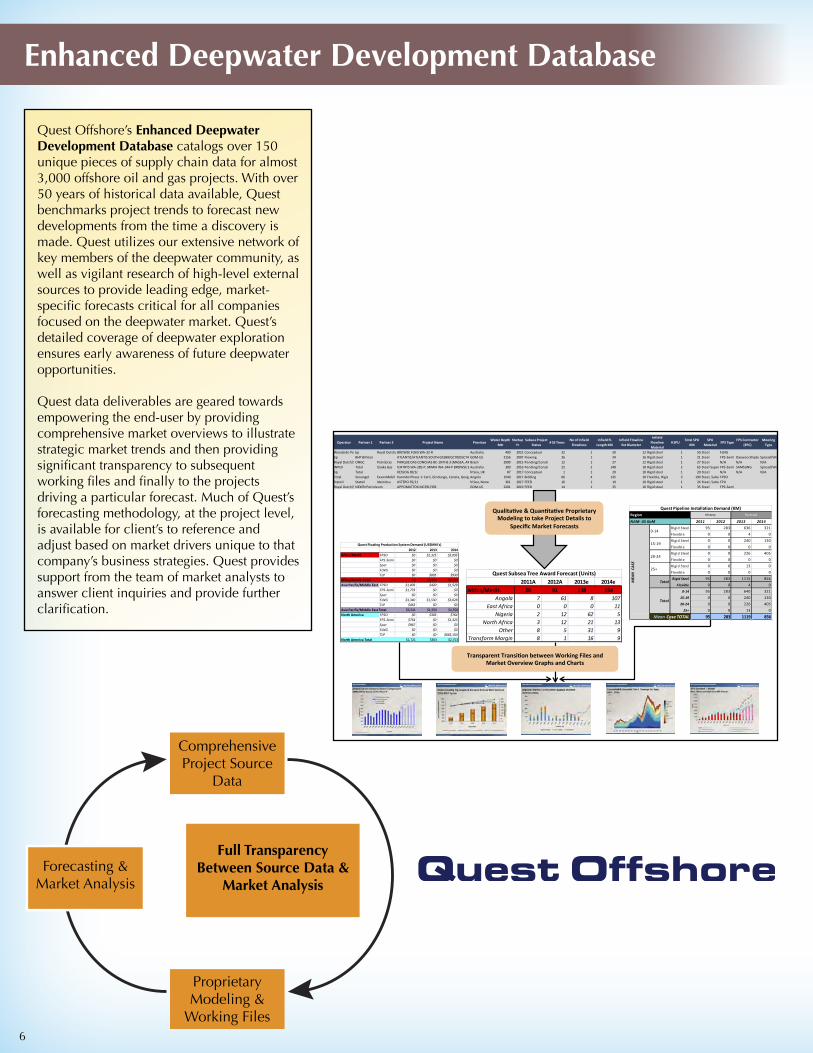
Enhanced Deepwater Development Database
Quest Offshore’s Enhanced Deepwater Development Database catalogs over 150 unique pieces of supply chain data for almost 3,000 offshore oil and gas projects. With over 50 years of historical data available, Quest benchmarks project trends to forecast new developments from the time a discovery is made. Quest utilizes our extensive network of key members of the deepwater community, as well as vigilant research of high-level external sources to provide leading edge, market-specific forecasts critical for all companies focused on the deepwater market. Quest’s detailed coverage of deepwater exploration ensures early awareness of future deepwater opportunities.
Quest data deliverables are geared towards empowering the end-user by providing comprehensive market overviews to illustrate strategic market trends and then providing significant transparency to subsequent working files and finally to the projects driving a particular forecast. Much of Quest’s forecasting methodology, at the project level, is available for client’s to reference and adjust based on market drivers unique to that company’s business strategies. Quest provides support from the team of market analysts to answer client inquiries and provide further clarification.
Comprehensive Project Source
Data
Proprietary Modeling &
Working Files
Forecasting & Market Analysis
Full Transparency Between Source Data &
Market Analysis
Operator Partner 1 Partner 2 Project Name ProvinceWater Depth
MtrStartup Yr
Subsea Project Status
# SS TreesNo of Infield Flowlines
Infield FL Length KM
Infield Flowline Ext Diameter
Infield Flowline Material
# SPUTotal SPU
KMSPU
MaterialFPS Type
FPS Contractor (EPC)
Mooring Type
Woodside Petroleumbp Royal Dutch/ShellBROWSE FLNG WA-‐32-‐R Australia 400 2021 Conceptual 32 1 50 12 Rigid steel 1 50 Steel FLNGbp BHP Billiton ATLANTIS/ATLANTIS SOUTH GC699/GC700/GC742/GC743/GC744GOM-‐US 2156 2007 Flowing 26 1 24 16 Rigid steel 1 21 Steel FPS-‐Semi Daewoo ShipbuildingSpread/Wire ChainRoyal Dutch/ShellONGC Petrobras PARQUE DAS CONCHAS BC-‐10 PHS 3 (MASSA, ARGONAUTA O-‐SOUTH)Brazil 2000 2015 Pending/Construction 12 1 27 12 Rigid steel 1 27 Steel N/A N/A N/AINPEX Total Osaka Gas ICHTHYS WA-‐285-‐P, MIMIA WA-‐344-‐P BROWSE BASIN (BREWSTER)Australia 300 2016 Pending/Construction 22 2 148 18 Rigid steel 2 63 Steel Super DuplexFPS-‐Semi SAMSUNG Spread/Wire Chainbp Total KESSOG 30/1c N Sea, UK 87 2017 Conceptual 1 1 20 10 Rigid steel 1 20 Steel N/A N/A N/ATotal Sonangol ExxonMobil Kaombo Phase 1: Caril, Gindungo, Canela, Gengibre, Louro, and Mostarda (Central South East pole project BLOCK 32)Angola 1540 2017 Bidding 66 4 135 10 Flexible, Rigid steel, 3 190 Steel, Subsea PowerFPSOStatoil Statoil Idemitsu ASTERO 35/11 N Sea, Norway 361 2017 FEED 16 1 10 10 Rigid steel 1 24 Steel, Subsea PowerFPURoyal Dutch/ShellNEXEN Petroleum APPOMATTOX MC391/392 GOM-‐US 2201 2019 FEED 14 1 35 10 Rigid steel 1 35 Steel FPS-‐Semi
Qualita<ve & Quan<ta<ve Proprietary Modeling to take Project Details to
Specific Market Forecasts
2012 2013 2014Africa/Medit. FPSO $0 $2,325 $5,095
FPS-‐Semi $0 $0 $0Spar $0 $0 $0FLNG $0 $0 $0TLP $0 $895 $930
Africa/Medit. Total $0 $3,220 $6,025Asia Pacific/Middle East FPSO $1,003 $420 $1,529
FPS-‐Semi $1,733 $0 $0Spar $0 $0 $0FLNG $3,340 $1,530 $3,028TLP $463 $0 $0
Asia Pacific/Middle East Total $6,541 $1,950 $4,558North America FPSO $0 $303 $764
FPS-‐Semi $754 $0 $1,323Spar $967 $0 $0FLNG $0 $0 $0TLP $0 $0 $665,150
North America Total $1,721 $303 $2,753
Quest Floating Production System Demand (US$MM's)
2011 2012 2013 2014Rigid Steel 95 283 636 321Flexible 0 0 4 0Rigid Steel 0 0 240 130Flexible 0 0 0 0Rigid Steel 0 0 226 405Flexible 0 0 0 0Rigid Steel 0 0 13 0Flexible 0 0 0 0Rigid Steel 95 283 1115 856
Flexible 0 0 4 00-‐14 95 283 640 32115-‐19 0 0 240 13020-‐24 0 0 226 40525+ 0 0 13 0
95 283 1119 856
Quest Pipeline Installation Demand (KM)
MEA
N CAS
E
0-‐14
15-‐19
20-‐24
25+
Total
Total
Mean Case TOTAL
Region History Forecast
NAM-‐ US GoM
2011A 2012A 2013e 2014eAfrica/Medit. 28 91 138 154
Angola 7 61 8 107East Africa 0 0 0 11
Nigeria 2 12 62 5North Africa 3 12 21 13
Other 8 5 31 9Transform Margin 8 1 16 9
Quest Subsea Tree Award Forecast (Units)
Transparent Transi<on between Working Files and Market Overview Graphs and Charts
6
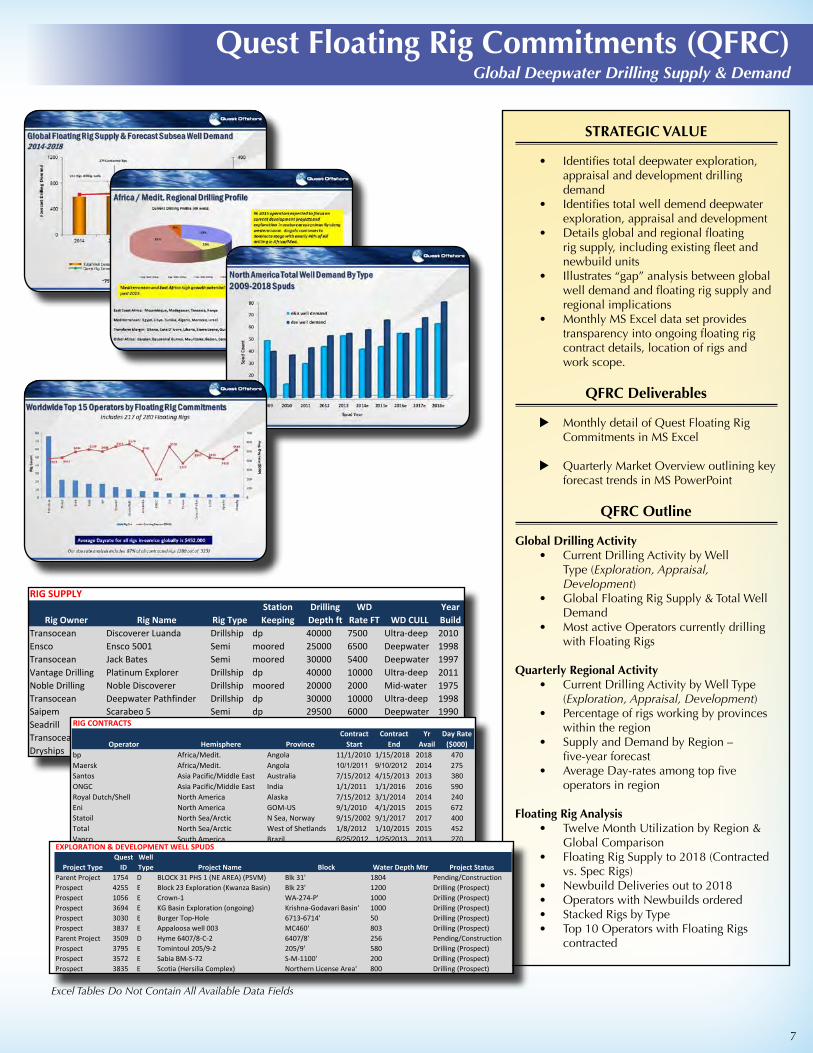
Quest Floating Rig Commitments (QFRC) Global Deepwater Drilling Supply & Demand
STRATEGIC VALUE
• Identifies total deepwater exploration, appraisal and development drilling demand
• Identifies total well demend deepwater exploration, appraisal and development
• Details global and regional floating rig supply, including existing fleet and newbuild units
• Illustrates “gap” analysis between global well demand and floating rig supply and regional implications
• Monthly MS Excel data set provides transparency into ongoing floating rig contract details, location of rigs and work scope.
QFRC Deliverables
u Monthly detail of Quest Floating Rig Commitments in MS Excel
u Quarterly Market Overview outlining key forecast trends in MS PowerPoint
QFRC Outline
Global Drilling Activity• Current Drilling Activity by Well
Type (Exploration, Appraisal, Development)
• Global Floating Rig Supply & Total Well Demand
• Most active Operators currently drilling with Floating Rigs
Quarterly Regional Activity• Current Drilling Activity by Well Type
(Exploration, Appraisal, Development)• Percentage of rigs working by provinces
within the region• Supply and Demand by Region –
five-year forecast• Average Day-rates among top five
operators in region
Floating Rig Analysis• Twelve Month Utilization by Region &
Global Comparison• Floating Rig Supply to 2018 (Contracted
vs. Spec Rigs)• Newbuild Deliveries out to 2018• Operators with Newbuilds ordered• Stacked Rigs by Type• Top 10 Operators with Floating Rigs
contracted
RIG SUPPLY
Rig Owner Rig Name Rig TypeStation Keeping
Drilling Depth ft
WD Rate FT WD CULL
Year Build
Transocean Discoverer Luanda Drillship dp 40000 7500 Ultra-deep 2010Ensco Ensco 5001 Semi moored 25000 6500 Deepwater 1998Transocean Jack Bates Semi moored 30000 5400 Deepwater 1997Vantage Drilling Platinum Explorer Drillship dp 40000 10000 Ultra-deep 2011Noble Drilling Noble Discoverer Drillship moored 20000 2000 Mid-water 1975Transocean Deepwater Pathfinder Drillship dp 30000 10000 Ultra-deep 1998Saipem Scarabeo 5 Semi dp 29500 6000 Deepwater 1990Seadrill West Phoenix Semi dp 30000 10000 Ultra-deep 2008Transocean GSF Arctic I Semi moored 25000 3400 Mid-water 1996Dryships Leiv Eirikson Semi dp 30000 10000 Ultra-deep 2002
RIG CONTRACTS
Operator Hemisphere ProvinceContract
Start Contract
EndYr
AvailDay Rate
($000)bp Africa/Medit. Angola 11/1/2010 1/15/2018 2018 470Maersk Africa/Medit. Angola 2014 275Santos Asia Pacific/Middle East Australia 7/15/2012 4/15/2013 2013 ONGC Asia Pacific/Middle East India 1/1/2011 1/1/2016 2016 590Royal Dutch/Shell North America Alaska 7/15/2012 3/1/2014 2014 240Eni North America GOM-US 9/1/2010 4/1/2015 2015 672Statoil North Sea/Arctic N Sea, Norway 9/15/2002 9/1/2017 2017 400Total North Sea/Arctic West of Shetlands 1/8/2012 1/10/2015 2015 452Vanco South America Brazil 2013 Borders & Southern (FOGL) South America Falkland Island 2016 EXPLORATION & DEVELOPMENT WELL SPUDS
Project TypeQuest
IDWell Type Project Name Block Water Depth Mtr Project Status
Parent Project 1754 D BLOCK 31 PHS 1 (NE AREA) (PSVM) Blk 31' 1804 Pending/ConstructionProspect 4255 E Block 23 Exploration (Kwanza Basin) Blk 23' 1200 Drilling (Prospect)Prospect 1056 E Crown-1 WA-274-P' 1000 Drilling (Prospect)Prospect 3694 E KG Basin Exploration (ongoing) Krishna-Godavari Basin' 1000 Drilling (Prospect)Prospect 3030 E Burger Top-Hole 6713-6714' 50 Drilling (Prospect)Prospect 3837 E Appaloosa well 003 MC460' 803 Drilling (Prospect)Parent Project 3509 D Hyme 6407/8-C-2 6407/8' 256 Pending/ConstructionProspect 3795 E Tomintoul 205/9-2 205/9' 580 Drilling (Prospect)Prospect 3572 E Sabia BM-S-72 S-M-1100' 200 Drilling (Prospect)Prospect 3835 E Scotia (Hersilia Complex) Northern License Area' 800 Drilling (Prospect)
Excel Tables Do Not Contain All Available Data Fields
7

Quest Global Prospects Report & Quarterly (QGPR/QGPQ)
STRATEGIC VALUE
• Outlines global deepwater exploration opportunities
• Leading indicator for long-term deepwater development activity
• Highlights upcoming areas of focus and operator interest for E&P activity
• Prospect-level data enabling users to identify which drilling programs are driving future trends
QGPR/QGPQ Deliverables
u Monthly snapshot of exploration activity (MS Excel)
u Quarterly Market Overview & analysis of global and regional exploration trends (MS PowerPoint)
QGPR/QGPQ Outline
Global Deepwater Exploration Activity
• Drilled and undrilled activity: by hemisphere
by key water depth category by current status by operator classification
Operators’ Activity Highlights• Top 15 Most Active, Most Successful and
Least Successful drillers• Global Deepwater Exploration Drilling
Activity – Five-Year Rolling Forecast• Identified Exploration and Appraisal total
well counts • Forecast drilling compared to actual
drilling by hemisphere
Quarterly Regional Activity• Comparison of activity levels by regions• Operator activity in a specific region• Exploration activity levels by water
depth category• Drilling Success Rates since 2004
© 2015 Quest Offshore Resources Inc.
0
50
100
150
200
250
2004 2005 2006 2007 2008 2009 2010 2011 2012 2013 2014
Num
ber o
f Discoveries
Discovery Year
Africa Med Asia Pacific North America North Sea South America
Discoveries by Year Announced 2004 – 2014 1,801 Discoveries
Global discoveries down 35% in 2014 compared to 2013
© 2015 Quest Offshore Resources Inc.
Global Exploration & Appraisal Drilling Forecast 2009a – 2018e
0
50
100
150
200
250
300
350
400
2009a 2010a 2011a 2012a 2013a 2014e 2015e 2016e 2017e 2018e
S. America
N. Sea / Arctic
N. America
Asia-‐Pac.
Africa/Med.
© 2015 Quest Offshore Resources Inc.
North America Exploration Success 2004 – 2014
0
50
100
150
2004 2005 2006 2007 2008 2009 2010 2011 2012 2013 2014
Cou
nt
Spud Year
Spuds Discoveries
At 39%, success rates for 2014 in the NAM region is slightly below its
average
© 2015 Quest Offshore Resources Inc.
0
25
50
75
100
2009 2010 2011 2012 2013 2014 2015 2016 2017 2018
>5000 FSW
1001-‐5000 FSW
0-‐1000 FSW
Spud
Cou
nt
Africa/Mediterranean Exploration Forecast 2009 – 2018 659 Spuds
Exploration & Appraisal Drilling Expected to Grow by 13% Over Next 5 Years
PROSPECT-LEVEL DATAOperator Prospect Name Hemisphere Province Block Water Depth Mtr
Petrobras 2013 BM-ES-22 exp well South America Brazil 'ES-M-468' 2100Wintershall 35/9-10S (PL418) North Sea/Arctic N Sea, Norway '35/9' 365Sterling Energy, PLC Ambilobe Block Africa/Medit. Madagascar 'Ambilobe' 500Royal Dutch/Shell Appomattox Well F North America GOM-US 'MC391/MC392' 2200ConocoPhillips Barossa appraisal Asia Pacific/Middle EastAustralia 'NT/P69' 100Total Block 41 Africa/Medit. Oman 'Blk 41' 2000Anadarko Petroleum Carrack / Caravel Asia Pacific/Middle EastNew Zealand 'PEP 38262' 1000Statoil DRIVIS PL532 North Sea/Arctic Barents Sea 403WELL-‐LEVEL DATAWell Type Spud Mo Spud Yr Status Rig Name Drilling Notes
Exploration 7 2014 Prospect Statoil purchased Vale share (Dec2012); one exp well planned for 2013Appraisal 10 2013 Drilling Transocean Arctic spud after Gohta (Lundin)Exploration 9 2015 Prospect phase 1 & 2 coimmitments:2D&3D seismic phase 3: 1 well by september 2016Appraisal 3 2015 Prospect Deepwater NautilusAppraisal 12 2013 Drilling Nanhai VI appraisal drilling to start in 2013 for blocks NT/P61 & NT/P69Exploration 6 2016 Prospect new PSC for 2014; will start with seabed coring in 2014Exploration 2 2014 Prospect Noble Bob Douglas spud after Romney in PEP38451Exploration 2 2014 Prospect West Hercules Fifth prospect in program, after Kramsno
Excel Tables Do Not Contain All Available Data Fields
8
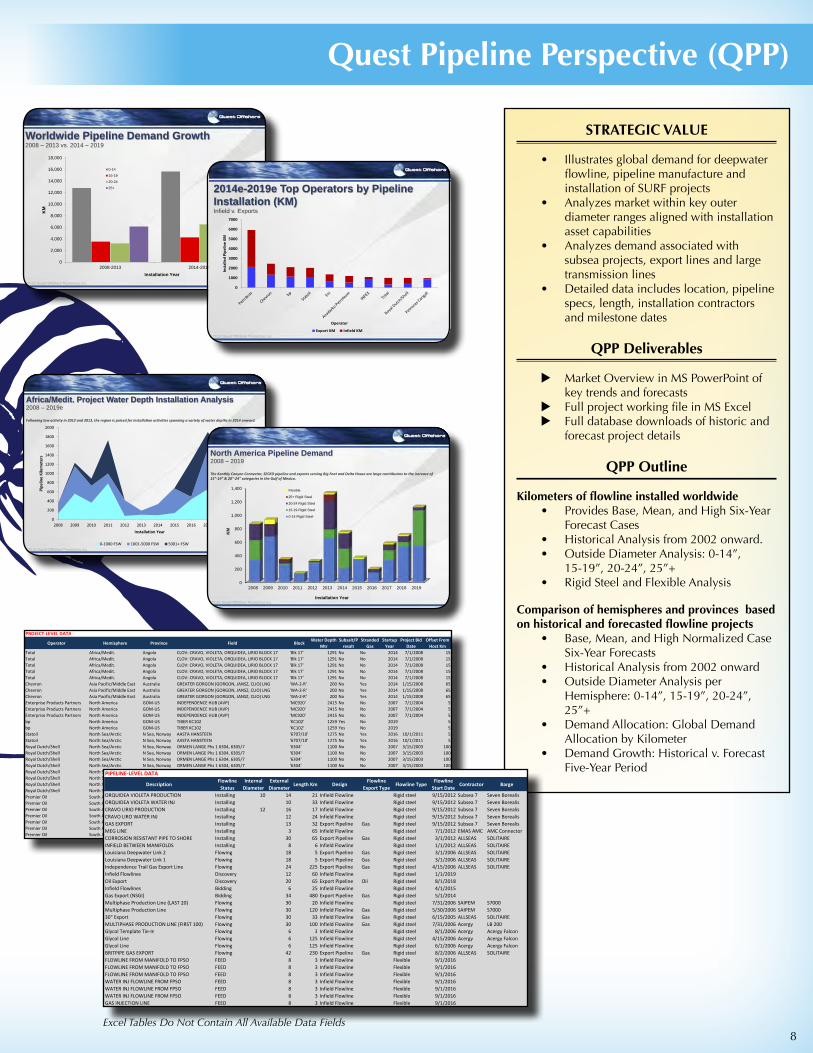
Quest Pipeline Perspective (QPP)
STRATEGIC VALUE
• Illustrates global demand for deepwater flowline, pipeline manufacture and installation of SURF projects
• Analyzes market within key outer diameter ranges aligned with installation asset capabilities
• Analyzes demand associated with subsea projects, export lines and large transmission lines
• Detailed data includes location, pipeline specs, length, installation contractors and milestone dates
QPP Deliverables
u Market Overview in MS PowerPoint of key trends and forecasts
u Full project working file in MS Excel u Full database downloads of historic and
forecast project details
QPP Outline
Kilometers of flowline installed worldwide • Provides Base, Mean, and High Six-Year
Forecast Cases • Historical Analysis from 2002 onward.• Outside Diameter Analysis: 0-14”,
15-19”, 20-24”, 25”+• Rigid Steel and Flexible Analysis
Comparison of hemispheres and provinces based on historical and forecasted flowline projects
• Base, Mean, and High Normalized Case Six-Year Forecasts
• Historical Analysis from 2002 onward• Outside Diameter Analysis per
Hemisphere: 0-14”, 15-19”, 20-24”, 25”+
• Demand Allocation: Global Demand Allocation by Kilometer
• Demand Growth: Historical v. Forecast Five-Year Period
PROJECT-LEVEL DATA
Operator Hemisphere Province Field BlockWater Depth
MtrSubsalt/P
resaltStranded
GasStartup
YearProject Bid
DateOffset From
Host KmTotal Africa/Medit. Angola CLOV: CRAVO, VIOLETA, ORQUIDEA, LIRIO BLOCK 17 'Blk 17' 1291 No No 2014 7/1/2008 15Total Africa/Medit. Angola CLOV: CRAVO, VIOLETA, ORQUIDEA, LIRIO BLOCK 17 'Blk 17' 1291 No No 2014 7/1/2008 15Total Africa/Medit. Angola CLOV: CRAVO, VIOLETA, ORQUIDEA, LIRIO BLOCK 17 'Blk 17' 1291 No No 2014 7/1/2008 15Total Africa/Medit. Angola CLOV: CRAVO, VIOLETA, ORQUIDEA, LIRIO BLOCK 17 'Blk 17' 1291 No No 2014 7/1/2008 15Total Africa/Medit. Angola CLOV: CRAVO, VIOLETA, ORQUIDEA, LIRIO BLOCK 17 'Blk 17' 1291 No No 2014 7/1/2008 15Chevron Asia Pacific/Middle East Australia GREATER GORGON (GORGON, JANSZ, CLIO) LNG 'WA-2-R' 200 No Yes 2014 1/15/2008 65Chevron Asia Pacific/Middle East Australia GREATER GORGON (GORGON, JANSZ, CLIO) LNG 'WA-2-R' 200 No Yes 2014 1/15/2008 65Chevron Asia Pacific/Middle East Australia GREATER GORGON (GORGON, JANSZ, CLIO) LNG 'WA-2-R' 200 No Yes 2014 1/15/2008 65Enterprise Products Partners North America GOM-US INDEPENDENCE HUB (AVP) 'MC920' 2415 No No 2007 7/1/2004 5Enterprise Products Partners North America GOM-US INDEPENDENCE HUB (AVP) 'MC920' 2415 No No 2007 7/1/2004 5Enterprise Products Partners North America GOM-US INDEPENDENCE HUB (AVP) 'MC920' 2415 No No 2007 7/1/2004 5bp North America GOM-US TIBER KC102 'KC102' 1259 Yes No 2019 5bp North America GOM-US TIBER KC102 'KC102' 1259 Yes No 2019 5Statoil North Sea/Arctic N Sea, Norway AASTA HANSTEEN '6707/10' 1275 No Yes 2016 10/1/2011 5Statoil North Sea/Arctic N Sea, Norway AASTA HANSTEEN '6707/10' 1275 No Yes 2016 10/1/2011 5Royal Dutch/Shell North Sea/Arctic N Sea, Norway ORMEN LANGE Phs 1 6304, 6305/7 '6304' 1100 No No 2007 3/15/2003 100Royal Dutch/Shell North Sea/Arctic N Sea, Norway ORMEN LANGE Phs 1 6304, 6305/7 '6304' 1100 No No 2007 3/15/2003 100Royal Dutch/Shell North Sea/Arctic N Sea, Norway ORMEN LANGE Phs 1 6304, 6305/7 '6304' 1100 No No 2007 3/15/2003 100Royal Dutch/Shell North Sea/Arctic N Sea, Norway ORMEN LANGE Phs 1 6304, 6305/7 '6304' 1100 No No 2007 3/15/2003 100Royal Dutch/Shell North Sea/Arctic N Sea, Norway ORMEN LANGE Phs 1 6304, 6305/7 '6304' 1100 No No 2007 3/15/2003 100Royal Dutch/Shell North Sea/Arctic N Sea, Norway ORMEN LANGE Phs 1 6304, 6305/7 '6304' 1100 No No 2007 3/15/2003 100Royal Dutch/Shell North Sea/Arctic N Sea, Norway ORMEN LANGE Phs 1 6304, 6305/7 '6304' 1100 No No 2007 3/15/2003 100Royal Dutch/Shell North Sea/Arctic N Sea, Norway ORMEN LANGE Phs 1 6304, 6305/7 '6304' 1100 No No 2007 3/15/2003 100Royal Dutch/Shell North Sea/Arctic N Sea, Norway ORMEN LANGE Phs 1 6304, 6305/7 '6304' 1100 No No 2007 3/15/2003 100Premier Oil South America Falkland Island SEA LION 14/10-3 '14/10-B' 400 No No 2017 3Premier Oil South America Falkland Island SEA LION 14/10-3 '14/10-B' 400 No No 2017 3Premier Oil South America Falkland Island SEA LION 14/10-3 '14/10-B' 400 No No 2017 3Premier Oil South America Falkland Island SEA LION 14/10-3 '14/10-B' 400 No No 2017 3Premier Oil South America Falkland Island SEA LION 14/10-3 '14/10-B' 400 No No 2017 3Premier Oil South America Falkland Island SEA LION 14/10-3 '14/10-B' 400 No No 2017 3Premier Oil South America Falkland Island SEA LION 14/10-3 '14/10-B' 400 No No 2017 3
PIPELINE-LEVEL DATA
DescriptionFlowline
StatusInternal
DiameterExternal
DiameterLength Km Design
Flowline Export Type
Flowline TypeFlowline
Start DateContractor Barge
ORQUIDEA VIOLETA PRODUCTION Installing 10 14 21 Infield Flowline Rigid steel 9/15/2012 Subsea 7 Seven BorealisORQUIDEA VIOLETA WATER INJ Installing 10 33 Infield Flowline Rigid steel 9/15/2012 Subsea 7 Seven BorealisCRAVO LIRIO PRODUCTION Installing 12 16 17 Infield Flowline Rigid steel 9/15/2012 Subsea 7 Seven BorealisCRAVO LIRO WATER INJ Installing 12 24 Infield Flowline Rigid steel 9/15/2012 Subsea 7 Seven BorealisGAS EXPORT Installing 13 32 Export Pipeline Gas Rigid steel 9/15/2012 Subsea 7 Seven BorealisMEG LINE Installing 3 65 Infield Flowline Rigid steel 7/1/2012 EMAS AMC AMC ConnectorCORROSION RESISTANT PIPE TO SHORE Installing 30 65 Export Pipeline Gas Rigid steel 3/1/2012 ALLSEAS SOLITAIREINFIELD BETWEEN MANIFOLDS Installing 8 6 Infield Flowline Rigid steel 1/1/2012 ALLSEAS SOLITAIRELouisiana Deepwater Link 2 Flowing 18 5 Export Pipeline Gas Rigid steel 3/1/2006 ALLSEAS SOLITAIRELouisiana Deepwater Link 1 Flowing 18 5 Export Pipeline Gas Rigid steel 3/1/2006 ALLSEAS SOLITAIREIndependence Trail Gas Export Line Flowing 24 225 Export Pipeline Gas Rigid steel 4/15/2006 ALLSEAS SOLITAIREInfield Flowlines Discovery 12 60 Infield Flowline Rigid steel 1/1/2019Oil Export Discovery 20 65 Export Pipeline Oil Rigid steel 8/1/2018Infield Flowlines Bidding 6 25 Infield Flowline Rigid steel 4/1/2015Gas Export (NSGI) Bidding 34 480 Export Pipeline Gas Rigid steel 5/1/2014Multiphase Production Line (LAST 20) Flowing 30 20 Infield Flowline Rigid steel 7/31/2006 SAIPEM S7000Multiphase Production Line Flowing 30 120 Infield Flowline Gas Rigid steel 5/30/2006 SAIPEM S700030" Export Flowing 30 33 Infield Flowline Gas Rigid steel 6/15/2005 ALLSEAS SOLITAIREMULTIPHASE PRODUCTION LINE (FIRST 100) Flowing 30 100 Infield Flowline Gas Rigid steel 7/31/2006 Acergy LB 200Glycol Template Tie-In Flowing 6 3 Infield Flowline Rigid steel 8/1/2006 Acergy Acergy FalconGlycol Template Tie-In Flowing 6 3 Infield Flowline Rigid steel 8/1/2006 Acergy Acergy FalconGlycol Line Flowing 6 125 Infield Flowline Rigid steel 4/15/2006 Acergy Acergy FalconGlycol Line Flowing 6 125 Infield Flowline Rigid steel 6/1/2006 Acergy Acergy FalconBRITPIPE GAS EXPORT Flowing 42 230 Export Pipeline Gas Rigid steel 8/2/2006 ALLSEAS SOLITAIREFLOWLINE FROM MANIFOLD TO FPSO FEED 8 3 Infield Flowline Flexible 9/1/2016FLOWLINE FROM MANIFOLD TO FPSO FEED 8 3 Infield Flowline Flexible 9/1/2016FLOWLINE FROM MANIFOLD TO FPSO FEED 8 3 Infield Flowline Flexible 9/1/2016WATER INJ FLOWLINE FROM FPSO FEED 8 3 Infield Flowline Flexible 9/1/2016WATER INJ FLOWLINE FROM FPSO FEED 8 3 Infield Flowline Flexible 9/1/2016WATER INJ FLOWLINE FROM FPSO FEED 8 3 Infield Flowline Flexible 9/1/2016GAS INJECTION LINE FEED 8 3 Infield Flowline Flexible 9/1/2016
Excel Tables Do Not Contain All Available Data Fields
© 2015 Quest Offshore Resources Inc.
Worldwide Pipeline Demand Growth 2008 – 2013 vs. 2014 – 2019
0
2,000
4,000
6,000
8,000
10,000
12,000
14,000
16,000
18,000
2008-2013 2014-2019
KM
Installation Year
0-14
15-19
20-24
25+
© 2015 Quest Offshore Resources Inc.
2014e-2019e Top Operators by Pipeline Installation (KM) Infield v. Exports
0
1000
2000
3000
4000
5000
6000
7000Installed Pipe
line KM
Operator
Export KM Infield KM
© 2015 Quest Offshore Resources Inc.
Africa/Medit. Project Water Depth Installation Analysis 2008 – 2019e
Following low ac+vity in 2012 and 2013, the region is poised for installa+on ac+vi+es spanning a variety of water depths in 2014 onward.
0
200
400
600
800
1000
1200
1400
1600
1800
2000
2008 2009 2010 2011 2012 2013 2014 2015 2016 2017 2018 2019
Pipe
line Kilometers
Installation Year
0-‐1000 FSW 1001-‐5000 FSW 5001+ FSW
© 2015 Quest Offshore Resources Inc.
North America Pipeline Demand 2008 – 2019
The Keathly Canyon Connector, SECKO pipeline and exports serving Big Foot and Delta House are large contributors to the increase of 15”-‐19” & 20”-‐24” categories in the Gulf of Mexico.
0
200
400
600
800
1,000
1,200
1,400
2008 2009 2010 2011 2012 2013 2014 2015 2016 2017 2018 2019
KM
Installation Year
Flexible
25+ Rigid Steel
20-24 Rigid Steel
15-19 Rigid Steel
0-14 Rigid Steel
8

Quest Subsea Database (QSDB)
STRATEGIC VALUE
• Industry leading forecast of subsea tree awards & associated hardware
• Market forecasts illustrate near and long-term dynamic of overall subsea industry
• Key analysis around regional, operator and water depth trends for subsea tree awards and startups
• Historic and forecast subsea CAPEX analysis
QSDB Deliverables
u Market Overview in MS PowerPoint of key trends and forecasts
u Full project working files in MS Excel u Full database downloads of historic and
forecast subsea wells
QSDB Outline
Subsea Project Spend by Onstream (Startup) Year• Illustrations of global historical and
forecast spending for entire subsea production package
Market Forecast Subsea Awards• Quest applies a base, mean and
high case to all projects to take into consideration the location, timing, status, etc. of a project in calculating forecasted trees. Current market dynamics also influence the base and high case scenarios for projects.
• Historical and five-year forecast of global subsea tree awards: By Region, By Water Depth, CAPEX analysis for tree, control and manifold hardware (Only)
• Top operators classified by their mean case tree award forecast
Market Analysis Subsea Tree Startups• Illustrates historic and forecast installed
base of subsea tree awards• From 1996 and includes six-year
forecast: By Region, By Water Depth
Market Share Analysis• Long-term regional subsea tree
market share• Current quarter analysis of subsea tree
and control awards• Current quarter and YTD review of
subsea tree, control and manifold awards by manufacturer and estimated value (US$)
HISTORICAL TREE-LEVEL DATA
Province Operator Project Name StatusTree Booked
DateTree Delivery
YearSubsea Contract
($000)Number Of Manifolds
Manifold Mfg Tree Mfg Controller Mfg
N Sea, Norway BG Group KNARR CENTRAL & WEST Pending/Construction 9/20/2011 2014 $135,000.00 2 FMC Technologies FMC Technologies FMC TechnologiesN Sea, Norway BG Group KNARR CENTRAL & WEST Pending/Construction 5/5/2012 2014 $135,000.00 2 FMC Technologies FMC Technologies FMC TechnologiesN Sea, Norway BG Group KNARR CENTRAL & WEST Pending/Construction 5/5/2012 2014 $135,000.00 2 FMC Technologies FMC Technologies FMC TechnologiesN Sea, Norway BG Group KNARR CENTRAL & WEST Pending/Construction 9/20/2011 2013 $135,000.00 2 FMC Technologies FMC Technologies FMC TechnologiesN Sea, Norway BG Group KNARR CENTRAL & WEST Pending/Construction 9/20/2011 2013 $135,000.00 2 FMC Technologies FMC Technologies FMC TechnologiesN Sea, Norway BG Group KNARR CENTRAL & WEST Pending/Construction 9/20/2011 2013 $135,000.00 2 FMC Technologies FMC Technologies FMC TechnologiesN Sea, Norway BG Group KNARR CENTRAL & WEST Pending/Construction 9/20/2011 2014 $135,000.00 2 FMC Technologies FMC Technologies FMC TechnologiesN Sea, Norway BG Group KNARR CENTRAL & WEST Pending/Construction 9/20/2011 2014 $135,000.00 2 FMC Technologies FMC Technologies FMC Technologies
SUBSEA FORECAST-LEVEL DATA
StatusSubsea Tree
CountTree Bid Date Tree Award Date Tree Award Qtr Award Year Bidder 1 Bidder 2 Bidder 3
Bidding 58 9/1/2012 6/1/2013 2 2013 Aker Solutions FMC TechnologiesFEED 5 6/1/2013 1/1/2014 1 2014 CameronFEED 18 9/1/2013 3/1/2014 1 2014 GE Oil & Gas FMC TechnologiesConceptual 10 1/1/2015 6/1/2015 2 2015
Conceptual 10 6/1/2013 3/1/2014 1 2014 FMC Technologies GE Oil & Gas
FEED 6 6/1/2014 6/1/2015 2 2015 FMC Technologies Cameron GE Oil & GasFEED 8 1/1/2013 6/1/2013 2 2013 FMC TechnologiesFEED 8 1/1/2013 6/1/2013 2 2013 FMC TechnologiesConceptual 15 1/1/2014 12/1/2014 4 2014FEED 36 1/1/2014 6/1/2014 2 2014
PROJECT-LEVEL DATA
Hemisphere Province Operator Project Name BlockWater
Depth MtrStartup
YearHost Field Name
Offset From Host Km
Africa/Medit. Angola Total Kaombo Phase 1 (BLOCK 32) '32' 1540 2018 Kaombo Phase 1 20Africa/Medit. Israel Noble Energy LEVIATHAN EPS (DOMESTIC SUPPLY) 'Rachel License' 1000 2017 LEVIATHAN EPS (DOMESTIC SUPPLY) 3Asia Pacific/Middle East Indonesia INPEX ABADI GAS FIELD FLNG (MASELA BLOCK) 'Masela' 500 2017 ABADI GAS FIELD FLNG (MASELA BLOCK) 5Asia Pacific/Middle East Indonesia Chevron KUTEI BASIN: RANGGAS (RAPAK PSC) 'Rapak PSC' 1600 2018 MAKASSAR STRAIGHT PHS 3 11
North America GOM-Mexico Pemex LAKACH-LABAY COMPLEX'Deep Coatzacoalcos'
1500 2016 50
North America GOM-US ExxonMobil JULIA WR627 'WR627' 2160 2017 HADRIAN NORTH KC919 75North America GOM-US Royal Dutch/Shell STONES FFD WR508 'WR508' 2900 2015 STONES FFD WR508 5North Sea/Arctic N Sea, UK Enquest PLC KRAKEN 9/2b '9-2' 118 2016 KRAKEN 9/2b 3North Sea/Arctic West of Shetlands Hurricane Exp LANCASTER 205/21A PHS 1 '205/21a' 157 2016 LANCASTER 205/21A PHS 1 3South America Falkland Island Premier Oil SEA LION 14/10-3 '14/10-B' 400 2017 SEA LION 14/10-3 3
Excel Tables Do Not Contain All Available Data Fields
© 2015 Quest Offshore Resources Inc.
$0
$2,000
$4,000
$6,000
$8,000
$10,000
$12,000
$14,000
$16,000
$MM
Startup Year
Africa/Medit. Asia Pacific/Middle East North Sea North America South America
Forecast Spending 2015-2020e Global Subsea CAPEX
56% Increase
Future growth driven largely by Africa, followed by the North
Sea and North America.
© 2015 Quest Offshore Resources Inc.
Top 20 Operators 2015 – 2019e Forecast Subsea Tree Awards
AFM = Africa/Medit; ASP = Asia Pacific; NSEA = North Sea; NAM = North America; SAM = South America
0
50
100
150
200
250
300
350
400
450
500# Su
bsea Tree Aw
ards
Operator
AFM28%
ASP13%
NAM19%
NSEA11%
SAM29%
© 2015 Quest Offshore Resources Inc.
2000a – 2019e Awards Global Subsea Forecast Award Comparison
•2015-2019e Awards = Mean Case
0
100
200
300
400
500
600
700
800
# of Sub
sea Trees
Award Year
Tree Orders (Forecast Mean)
Trees Orders (Awarded)
Tree Orders (High)
Tree Orders (Base)
© 2015 Quest Offshore Resources Inc.
1996 – 2020e Startups – Normalized Case Global Subsea Tree Startups by Water Depth
0
100
200
300
400
500
600
1996
1997
1998
1999
2000
2001
e20
0220
0320
0420
0520
0620
0720
0820
0920
1020
1120
1220
1320
1420
15e
2016
e20
17e
2018
e20
19e
2020
e
# of Sub
sea Trees
Startup Year
0-‐1000fsw 1001-‐5000fsw 5001+fsw
10
© 2015 Quest Offshore Resources Inc.
Africa/Medit. Consolidated Market Share
0%
10%
20%
30%
40%
50%
60%
70%
80%
90%
% M
kt Sha
re
Award Yr
AS DQ FTI GE OneSubsea

Quest Subsea Production Umbilical Database (QSPUD)
STRATEGIC VALUE
• Illustrates global demand trends for the subsea production umbilical (SPU) market
• Delineates market into steel-tubed and thermoplastic-hosed SPU demand
• Analyzes market in terms of volume (KM) and value (US$MM)
• Provides comprehensive market share analysis of historical global awards
QSPUD Deliverables
u Market Overview in MS PowerPoint of key trends and forecasts
u Full project working files in MS Excel u Full database downloads of historic and
forecast subsea production umbilicals
QSPUD Outline
Market Forecast of Subsea Production Umbilical Capex by Award Year
• Top operators classified by their historic and forecast demand
• Comparison of region demand based on historical and forecasted SPU awards
• Includes comparison between steel and thermoplastic SPU’s for each region
Subsea Production Umbilical Forecast Awards• Kilometers of SPU awarded (historical
and forecast) vs. number of trees awarded (historical and forecast)
• Comparison between hemispheres based on SPU awards in kilometers and equivalent US$
• Illustration of dynamics between steel and thermoplastic demand within the SPU market historically and in the next five years.
Historical Umbilical Market Share • Market share of SPU manufacturers• Regional Comparison between
hemispheres based on historical-to-date awards
• Steel vs. thermoplastic comparison
Forecast Umbilical-Level Data
Umbilical Status Umbilical Type Bid Date Award DateInstall Date
Length Meters Mfg Bidder 1 Mfg Bidder 2 Mfg Bidder 3
LOI (Letter of Intent) Steel Super Duplex 6/1/2007 4/1/2015 1/1/2017 104585 Technip DUCOBidding Steel Super Duplex 4/2/2012 12/20/2012 9/1/2014 43443 Aker Solutions Oceaneering Umbilical SolutionsTechnip DUCOFEED Steel 6/1/2013 3/1/2014 8/1/2015 25000 NEXANS JDR Umbilical Systems Technip DUCOBidding Thermoplastic 9/1/2012 1/1/2013 7/1/2013 10000 JDR Umbilical SystemsBidding Steel 3/1/2012 12/1/2012 1/1/2015 1000 NEXANS Oceaneering Umbilical SolutionsConceptual Steel 6/1/2014 1/1/2015 1/1/2018 20000 NEXANSConceptual Subsea Power 6/1/2014 1/1/2015 1/1/2017 20000 NEXANSBidding Steel 6/1/2012 3/1/2013 4/15/2015 25000 Aker Solutions NEXANS Oceaneering Umbilical SolutionsFEED Thermoplastic 1/1/2013 10/1/2013 6/1/2015 60000 Oceaneering Umbilical SolutionsBidding Thermoplastic 6/1/2011 12/20/2012 4/1/2013 10000 Oceaneering Umbilical Solutions
Project-Level Data
Hemisphere Province Operator Project Name BlockWater Depth
MtrStartup
YearOffset From
Host KmAfrica/Medit. Angola bp BLOCK 31 PHS 3 (CHTMCP) 'Blk 31' 1602 2017 5Africa/Medit. Angola Chevron LIANZI ANGOLA-CONGO UZ BLOCK 14 '14' 909 2015 43Asia Pacific/Middle East China CNOOC LIUHUA 16-2 '16-2' 400 2016 2Asia Pacific/Middle East Philippines Otto GALOC PHS 2 'SC 14C' 290 2013 5North America GOM-US bp ATLANTIS PHS 2B GC699/GC700/GC743/GC743/GC744 'GC787' 2156 2015 9North America GOM-US bp Kaskida KC292 'KC292' 1786 2018 5North America GOM-US bp Kaskida KC292 'KC292' 1786 2018 5North Sea/Arctic N Sea, Norway Statoil AASTA HANSTEEN (6707/10-2 ,6706/10 ) '6707/10' 1275 2016 5South America Brazil Petrobras FRANCO-1 TRANSFER OF RIGHTS FPSO P-74 ANP Transfer of Rights 2100 2016 3South America Brazil OGX TUBARAO AZUL (FRMR WAIMEA) PHASE 2 BM-C-41 (OSX-2) 'BM-C-41' 140 2013 5
Excel Tables Do Not Contain All Available Data Fields
© 2015 Quest Offshore Resources Inc.
Mean Case SPU KM Activity Trends
0
500
1000
1500
2000
2500
3000
3500
KM
Award Yr
Global (Steel Awarded)
Global (Steel Unawarded -‐Mean Case)
Global (Thermoplastic Awarded)
Global (Thermoplastic Unawarded -‐Mean Case)
Global (All Types -‐ High Case)
Global (All Types -‐ Base Case)
© 2015 Quest Offshore Resources Inc.
Top 14 Operators US $4,108 MM • Mean Case 2014e – 2018e SPU Total Forecast Awards US – $6,036 MM
$0
$100
$200
$300
$400
$500
$600
$700
$800
$900
$1,000$M
M
Operator
Thermoplastic $MM
Steel $MM
© 2015 Quest Offshore Resources Inc.
US$10.34 BN, Forecast US$4.4 BN • Mean Case Worldwide Steel SPU Demand
3
$0
$50
$100
$150
$200
$250
$300
$350
$400
Steel $MM (M
ean Ca
se)
Award Yr
Africa/Medit (Mean Case) Asia Pacific (Mean Case) North Sea (Mean Case)
North America (Mean Case) South America (Mean Case)
© 2015 Quest Offshore Resources Inc.
Global SPU Manufacturer Market Share SS Power3%
Steel62%
Thermoplastic35%
0%
10%
20%
30%
40%
50%
60%
70%
80%
90%
100%
% M
arke
t Sha
re (K
M)
Award Year
Aker Solutions MFX NEXANS Oceaneering Umbilical Solutions Other Parker Prysmian Technip DUCO
11
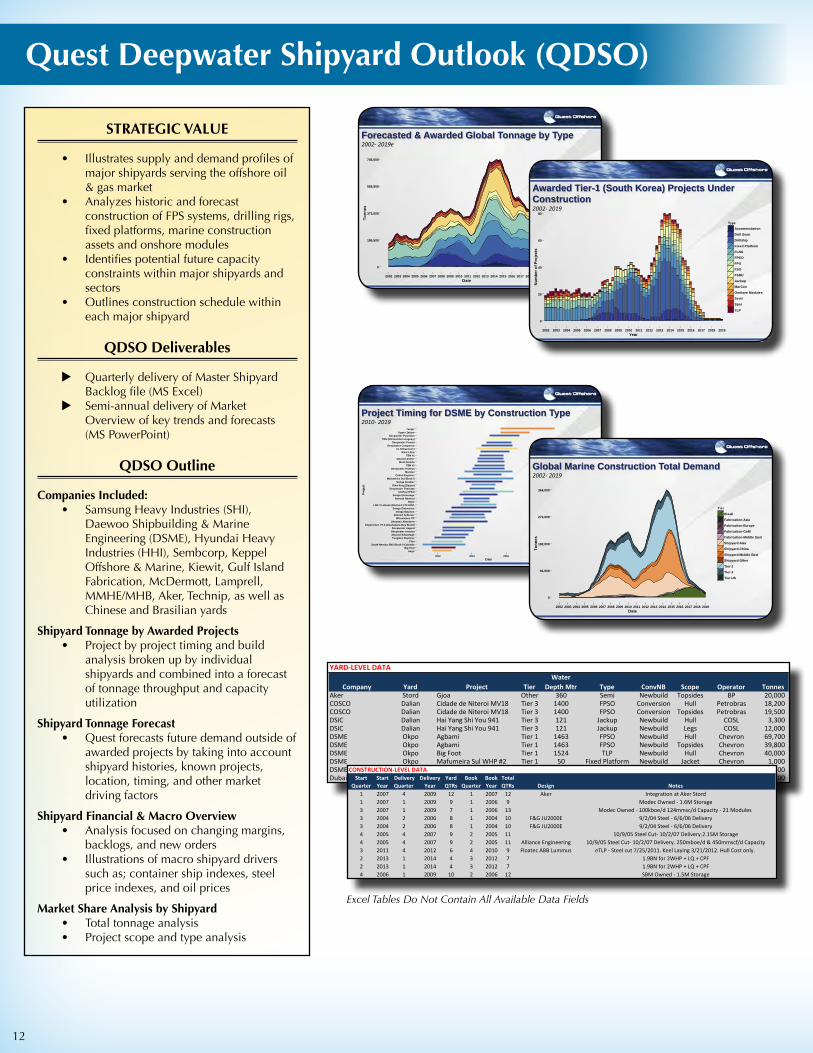
Quest Deepwater Shipyard Outlook (QDSO)
STRATEGIC VALUE
• Illustrates supply and demand profiles of major shipyards serving the offshore oil & gas market
• Analyzes historic and forecast construction of FPS systems, drilling rigs, fixed platforms, marine construction assets and onshore modules
• Identifies potential future capacity constraints within major shipyards and sectors
• Outlines construction schedule within each major shipyard
QDSO Deliverables
u Quarterly delivery of Master Shipyard Backlog file (MS Excel)
u Semi-annual delivery of Market Overview of key trends and forecasts (MS PowerPoint)
QDSO Outline
Companies Included:• Samsung Heavy Industries (SHI),
Daewoo Shipbuilding & Marine Engineering (DSME), Hyundai Heavy Industries (HHI), Sembcorp, Keppel Offshore & Marine, Kiewit, Gulf Island Fabrication, McDermott, Lamprell, MMHE/MHB, Aker, Technip, as well as Chinese and Brasilian yards
Shipyard Tonnage by Awarded Projects• Project by project timing and build
analysis broken up by individual shipyards and combined into a forecast of tonnage throughput and capacity utilization
Shipyard Tonnage Forecast • Quest forecasts future demand outside of
awarded projects by taking into account shipyard histories, known projects, location, timing, and other market driving factors
Shipyard Financial & Macro Overview• Analysis focused on changing margins,
backlogs, and new orders• Illustrations of macro shipyard drivers
such as; container ship indexes, steel price indexes, and oil prices
Market Share Analysis by Shipyard• Total tonnage analysis• Project scope and type analysis
©2014 Quest Offshore Resources Inc. 1
0
186,500
373,000
559,500
746,000
2002 2003 2004 2005 2006 2007 2008 2009 2010 2011 2012 2013 2014 2015 2016 2017 2018 2019Date
Tonn
es
TypeAccommodation
Drill Semi
Drillship
Fixed Platform
FLNG
FPSO
FPU
FSO
FSRU
Jackup
MarCon
Onshore Modules
Semi
Spar
Tender Assist Rig
TLP
Turret
Forecasted & Awarded Global Tonnage by Type 2002-‐ 2019e
©2014 Quest Offshore Resources Inc. 2
0
20
40
60
80
2002 2003 2004 2005 2006 2007 2008 2009 2010 2011 2012 2013 2014 2015 2016 2017 2018 2019Year
Num
ber o
f Pro
ject
s
TypeAccommodation
Drill Semi
Drillship
Fixed Platform
FLNG
FPSO
FPU
FSO
FSRU
Jackup
MarCon
Onshore Modules
Semi
Spar
TLP
Awarded Tier-1 (South Korea) Projects Under Construction 2002-‐ 2019
©2014 Quest Offshore Resources Inc. 3
AegirBig Foot
South Nemba SNX Block 0 CabindaClov
Tungsten ExplorerAtwood AdvantageDeepwater InvictusDeepwater Asgard
Experience VT-3 (Guanabara Bay Brasil)Deepsea Aberdeen
Wheatstone PFAtwood Achiever
Songa EquinoxSonga Endurance
LNG 1 Labuan (Kanowit ) PFLNG1Hejre
Atwood AdmiralSonga Encourage
Ichthys FPSODeepwater Thalassa
Gina Krog (Dagny)Songa Enabler
Mafumeira Sul Block 0Cobalt Explorer
MarinerDeepwater Proteus
TBN #2West Dorado
Atwood ArcherTBN #1
West LibraXL Enhanced 4
Deepwater ConquerorDeepwater Pontus
TBN (Montevideo Uruguay)Deepwater Poseidon
Upper ZakumTengiz
2012 2014 2016 2018Date
Proj
ect
Type
Drill Semi
Drillship
Fixed Platform
FLNG
FPSO
FSRU
Jackup
MarCon
Onshore Modules
TLP
Project Timing for DSME by Construction Type 2010-‐ 2019
©2014 Quest Offshore Resources Inc. 4
Global Marine Construction Total Demand 2002-‐ 2019
0
91,000
182,000
273,000
364,000
2002 2003 2004 2005 2006 2007 2008 2009 2010 2011 2012 2013 2014 2015 2016 2017 2018 2019Date
Tonn
es
Tier
Brasil
Fabrication-Asia
Fabrication-Europe
Fabrication-GoM
Fabrication-Middle East
Shipyard-Asia
Shipyard-China
Shipyard-Middle East
Shipyard-Other
Tier-1
Tier-2
Tier-US
YARD-LEVEL DATA
Company Yard Project TierWater
Depth Mtr Type ConvNB Scope Operator Tonnes Aker Stord Gjoa Other 360 Semi Newbuild Topsides BP 20,000 COSCO Dalian Cidade de Niteroi MV18 Tier 3 1400 FPSO Conversion Hull Petrobras 18,200 COSCO Dalian Cidade de Niteroi MV18 Tier 3 1400 FPSO Conversion Topsides Petrobras 19,500 DSIC Dalian Hai Yang Shi You 941 Tier 3 121 Jackup Newbuild Hull COSL 3,300 DSIC Dalian Hai Yang Shi You 941 Tier 3 121 Jackup Newbuild Legs COSL 12,000 DSME Okpo Agbami Tier 1 1463 FPSO Newbuild Hull Chevron 69,700 DSME Okpo Agbami Tier 1 1463 FPSO Newbuild Topsides Chevron 39,800 DSME Okpo Big Foot Tier 1 1524 TLP Newbuild Hull Chevron 40,000 DSME Okpo Mafumeira Sul WHP #2 Tier 1 50 Fixed Platform Newbuild Jacket Chevron 1,000 DSME Okpo Mafumeira Sul WHP #2 Tier 1 50 Fixed Platform Newbuild Topsides Chevron 1,300 Dubai Dry Docks Dubai Frade Tier 3 1067 FPSO Conversion Hull Chevron 13,500
CONSTRUCTION-LEVEL DATAStart
QuarterStart Year
Delivery Quarter
Delivery Year
Yard QTRs
Book Quarter
Book Year
Total QTRs Design Notes
1 2007 4 2009 12 1 2007 12 Aker Integration at Aker Stord1 2007 1 2009 9 1 2006 9 Modec Owned - 1.6M Storage3 2007 1 2009 7 1 2006 13 Modec Owned - 100kboe/d 124mmsc/d Capacity - 21 Modules 3 2004 2 2006 8 1 2004 10 F&G JU2000E 9/2/04 Steel - 6/6/06 Delivery3 2004 2 2006 8 1 2004 10 F&G JU2000E 9/2/04 Steel - 6/6/06 Delivery4 2005 4 2007 9 2 2005 11 10/9/05 Steel Cut- 10/2/07 Delivery.2.15M Storage4 2005 4 2007 9 2 2005 11 Alliance Engineering 10/9/05 Steel Cut- 10/2/07 Delivery. 250mboe/d & 450mmscf/d Capacity3 2011 4 2012 6 4 2010 9 Floatec ABB Lummus eTLP - Steel cut 7/25/2011. Keel Laying 3/21/2012. Hull Cost only. 2 2013 1 2014 4 3 2012 7 1.9BN for 2WHP + LQ + CPF2 2013 1 2014 4 3 2012 7 1.9BN for 2WHP + LQ + CPF4 2006 1 2009 10 2 2006 12 SBM Owned - 1.5M Storage
Excel Tables Do Not Contain All Available Data Fields
12

Quest Floating Production Database (QFPD)
13
STRATEGIC VALUE
• Leading indicator of significant global deepwater development activity and investment
• Analyzes the global market for floating production demand in terms of volume and value (US$MM)
• Breaks demand into specific FPS type (FPSO, SPARS, TLP, FLNG, Semi-Submersibles)
• Breaks demand into region• Provides key historic market share
analysis by shipyards and FPS owner
QFPD Deliverables
u Market Overview in MS PowerPoint of key trends and forecasts
u Full project working files in MS Excel u Full database downloads of historical
project information and forecasted project demand
QFPD Outline
Executive Overview • Changes from Previous Forecast• Award vs. Startup Trends by Hemisphere
Floating Production System Forecast • Base, mean and high case forecasts by
award year• Startups and awards by hemisphere
and type• Forecasted volume of units and
value ($US)• Top operators
Floating Production System Analysis• Availability of leased FPSOs and FSOs• FPSO leasing market share• FPSO newbuild vs. conversion analysis
Project Update Overview• Major changes over previous quarter
© 2015 Quest Offshore Resources Inc.
Regional Contribution Thousands of US Dollars by FPS Award Year (Mean Case) Worldwide Forecast FPS Spending by Year
1
South America, Africa and Asia will be the key drivers for increases in spending. Despite the lowering of the award forecast due to current oil market condi=ons spending is s=ll expected to grow due to the
increased size and complexity of FPS units.
Source file: Q3 QFPD Tables, Lookups, and Graph Sources.xls
© 2015 Quest Offshore Resources Inc.
Share By FPS Type (Mean Case) Worldwide Forecast Floating Activity by Startup Year 2004 – 2018e
2
Source file: Q3 QFPD Tables, Lookups, and Graph Sources.xls
© 2015 Quest Offshore Resources Inc.
(Mean Case) 12 Units, 10 Under Construction Africa/Med Forecast FPS Construction by Startup Year 2014 – 2018e
3
Source file: Q3 QFPD Tables, Lookups, and Graph Sources.xls
© 2015 Quest Offshore Resources Inc.
2000 – 2018e (Mean Case) Worldwide FPSO New Build vs. Conversion
4 Source file: Q3 QFPD Tables, Lookups, and Graph Sources.xls
PROJECT-LEVEL DATA
Operator Hemisphere Province Project NameWater
Depth MtrStartup
Yearbp Africa/Medit. Angola BLOCK 31 PHS 1 (NE AREA) PLUTAO,SATURNO,VENUS,MARTE,TERRA (PSVM) 1804 2013Eni Africa/Medit. Mozambique CORAL FLNG (MOZAMBIQUE AREA 4) 2261 2019CNOOC Asia Pacific/Middle East China WENCHANG 8-3, 14-3, 15-1, 19-1 120 2008Reliance Industries Asia Pacific/Middle East India MA OILFIELD PHS 1&2, BLK D6 (AKA KG-DWN-98/3), FPSO DHIRUBHAI-1 (FRMLY SMART 1) 1300 2008Royal Dutch/Shell North America GOM-US APPOMATTOX MC391/392 2201 2019Williams North America GOM-US GULFSTAR HUB (TUBULAR BELLS HOST) MC768 1341 2014Statoil North Sea/Arctic Barents Sea JOHAN CASTBERG (SKRUGARD/HAVIS) 7220/8 300 2019Marathon Oil North Sea/Arctic N Sea, Norway ALVHEIM DEVP (BOA,KNELER,KAMELEON,VILJE) Odin FPSO 110 2008Premier Oil North Sea/Arctic N Sea, UK SHELLEY 22/2B FPSO SEVAN VOYAGEUR 95 2009Petrobras South America Brazil CERNAMBI NORTH BM-S-11 (FPSO CIDADE DE ITAGUAI) 2210 2015FPS-‐LEVEL DATA
FPS Type Hull Status FPS Owner Prod Cap Oil (BOPD)
Prod Cap Gas (MMCPFD)
Prod Cap Water (BWPD)
Storage Capacity (Bbls)
Surface Well Count Mooring Type
FPSO Flowing MODEC 157,000 245 195,000 1,800,000 0 Turret-‐ExternalFLNG ConceptualFPSO Flowing 100,000 700,000 0 Turret-‐SubmergedFPSO Flowing Aker Floating Production ASA 80,000 318 20,000 1,300,000 0 TurretFPS-‐Semi LOI (Letter of Intent)Classic Spar Pending/Construction Williams 60,000 200 0 Spread/Poly ChainFPSO Conceptual 200,000 0FPSO Flowing Maersk 123,000 124 130,000 560,000 0 Turret-‐SubmergedFPSO ROUNDSHIP Re-‐Deployed Teekay/Sevan Marine 30,000 20,000 300,000 0 Spread/Wire ChainFPSO Pending/Construction Schahin/Modec 150,000 281 1,600,000 0 Spread/Poly Chain
CONSTRUCTION-LEVEL DATA
EPC ContractorHull Award
DateHull Designer Hull Fabricator Hull Fabricator Shipyard Topsides Designer Topsides Fabricator
Topsides Fabricator Shipyard
MODEC 12/1/2008 MODEC Jurong Shipyard Singapore, Singapore MODEC Jurong Shipyard Singapore, Singapore1/1/2016
COOEC 11/1/2005 COOEC Dalian New Shipyard COOEC Dalian New ShipyardAker Solutions 1/11/2007 Aker Floating Production ASA Jurong Shipyard Aker Floating Production ASA Jurong Shipyard
3/1/2014 SAMSUNG Kiewit Offshore ServicesWilliams 5/11/2011 Williams Gulf Marine Fabricators Aransas Pass, TX USA Alliance Engineering Gulf Island L.L.C. Houma, LA
6/1/2016Maersk 3/15/2005 Maersk Keppel Shipyard Singapore, Singapore Vetco-Aibel Vetco-AibelSevan Marine 5/1/2006 Sevan Marine Yantai Raffles Shipyard Ltd Rotterdam, Netherlands Sevan Marine Keppel VerolmeSchahin/Modec 10/15/2012 Schahin/Modec Schahin/Modec Schahin/Modec Schahin/Modec
Excel Tables Do Not Contain All Available Data Fields

Quest Marine Construction Vessels (QMCV/QCVS)
14
STRATEGIC VALUE
• Provides global insight into supply and demand dynamics of major marine construction assets
• Illustrates vessel-by-vessel schedule for over 125 assets of booked and bidding construction work
• Details strategic installation and construction capabilities of a wide range of marine assets
QMCV / QCVS Deliverables
u Quest Construction Vessel Schedule in MS Project and PDF (QCVS)
u Quest Construction Vessel Schedule PLUS (MS Excel)
u Quarterly Market Overview of key trends and forecasts (MS PowerPoint)
u Quarterly deliverable of the Quest Vessel Function Database (MS Excel)
QMCV / QCVS Outline
Construction Vessel Schedule (MS-Project or PDF format)
• Details over 125 vessels’ current commitments and schedule and includes detailed information on project, timing and scope of work
• Shows potential installation opportunities Construction Vessel Schedule PLUS (MS Excel)
• Combines data from Quest Construction Vessel Schedule with high level fields from the Quest Enhanced Deepwater Database
• Allows analysis to be performed around installation trends at the vessel, owner, and capability level due to the user friendliness of MS Excel
Market Report Overviews• Global Marine Construction Supply and
Demand Balance• Marine Contractor Market Share• Global Marine Construction Booked Demand –
Installation Days• Historical Utilization by vessel category
Quest Vessel Function Database (QVFDB)• Includes high level vessel specifications for each
vessel tracked in the Quest Construction Vessel Schedule and more (details over 200 vessels)
© 2015 Quest Offshore Resources Inc.
Global Marine Construction Total Demand Worldwide Pipeline (Days)
0
2,000
4,000
6,000
8,000
10,000
12,000
14,000
16,000
Days
Installation Year
Africa/Medit. Asia Pacific -‐ Other Australaisia Middle East and India N. America N. Sea S. America
© 2015 Quest Offshore Resources Inc.
Regional Marine Construction Booked Demand North Sea (Days)
*Total Demand in future includes unbooked work
0
1,000
2,000
3,000
4,000
5,000
6,000
Days
Installation Year
0-‐14/Flex/SPU 15-‐24 25+ Total Demand
© 2015 Quest Offshore Resources Inc.
Booked Days by Contractor – Reel Lay Africa-Medit. 2010-2015
*Acergy and Subsea 7 have been combined for the historical period. * Please note the booked days for 2014 & 2015 are unknown and the market share slides are subject to change.
0.0%
10.0%
20.0%
30.0%
40.0%
50.0%
60.0%
70.0%
80.0%
90.0%
100.0%
2010 2011 2012 2013 2014 2015
% M
arket S
hare (D
ays)
Installation Year
EMAS AMC McDermott Subsea 7 Technip
© 2015 Quest Offshore Resources Inc.
Worldwide Deepwater Pipelay Vessels 2003 – November 2014: 34,933 Total Booked Days
0
2
4
6
8
10
12
14
16
18
20
0
100
200
300
400
500
Book
ed Days
Installation Year
Booked Days Cont. Supply
ID Task Name Duration Start
1 DEEPWATER PIPELAY 0 days Tue 1/1/022 Technip 2642 days Wed 12/24/083 DEEP BLUE 1338 days Wed 6/27/124 Shell - West Boreas 21 days Tue 12/11/125 Chevron - WR Gas Export Line 102 days Sun 1/6/136 IDLE/Standby - Vitoria, Brazil 1 day Sat 3/23/137 Shell - BC-10 Phase 2 35 days Sun 3/24/138 IDLE/Standby - Mississippi River, United States of America1 day Mon 5/27/139 IDLE/Standby - Mobile, United States of America 1 day Tue 6/25/13
10 Murphy Oil; Ecopetrol - Dalmatian 60 days Mon 7/15/1311 IDLE/Standby - Mobile, United States of America 1 day Mon 7/22/1312 Shell - Cardamom SSTB 21 days Thu 8/1/1313 IDLE/Standby - LOOP Terminal, United States of America 1 day Thu 8/22/1314 IDLE/Standby - Mobile, United States of America 1 day Wed 9/25/1315 Chevron - Jack & St. Malo 62 days Tue 10/1/1316 ExxonMobil - Hadrian South 30 days Mon 12/2/1317 IDLE/Standby - Mobile, United States of America 1 day Mon 12/16/1318 Anadarko/ExxonMobil - GoM Lucius - 2nd Campaign 82 days Wed 1/1/1419 BP - Quad 204 Schiehallion Redevelopment 91 days Sat 5/10/1420 Shell - Stones 25 days Mon 9/1/1421 LLOG - Delta House 35 days Wed 10/1/1422 Total - Kaombo 180 days Thu 1/1/1523 Targeting - Noble Energy - Leviathan 90 days Thu 1/1/1524 ExxonMobil - Julia 45 days Wed 4/1/1525 Tullow Oil Ghana - TEN Project 100 days Thu 10/1/1526 Targeting - Chevron - Nsiko 55 days Fri 1/1/1627 Bidding - Anadarko - Heidelberg 72 days Fri 4/1/1628 Bidding - BP - Block 31 SE Phase 2 95 days Tue 11/1/1629 Targeting - Hess - Stampede (Pony & Knotty Head) 29 days Sun 1/1/17
NAME - Shell - West Boreas - install of 20km FL (LOI)NAME -Chevron - Jack Gas Export Line phs1; install of 306km 10" gas export pipeline and 1 SCR...
IDLE/Standby - Vitoria, Brazil - Destination: Espirito Santo Bc 10SAME - Shell - BC-10 Phase 2 - Install of 20km 12"FL + 29km SPU
IDLE/Standby - Mississippi River, United States of America - Destination: BP ThunderhorseIDLE/Standby - Mobile, United States of America - Destination: Enbridge Wrgs
NAME - Murphy Oil; Ecopetrol - Dalmatian - SURF - EPIC - gas riser , oil riser, 38km FL, 34km PIP FL, PLETs &* jumpers, control umb, infield umb, flying leads, & pre-commissioning.IDLE/Standby - Mobile, United States of America - Destination: Mobile Alabama
NAME - Shell - Cardamom SSTB - install of East & West Loop PIP (2) 12.8km 6'-8' FL + PLETs & Risers (Pioneer to assist)...IDLE/Standby - LOOP Terminal, United States of America - Destination: Shell Llano
IDLE/Standby - Mobile, United States of America - Destination: Chevron JSMNAME - Chevron - Jack & St. Malo; URF install of 85Km of 10" flowlines and Subsea Hardware
NAME - ExxonMobil - Hadrian South - Project management, Procurement and Install of two 11.265km 6" FL + 14.5km SPU, jumpers and flying leads + pre-commissioning.IDLE/Standby - Mobile, United States of America - Destination: Theodore Mobile
NAME - Anadarko/ExxonMobil - GoM Lucius - Install of multiple gas lift jumpers, main gas lift, infield SPU, ss distribution units, flying leads and rigid jumpersNSEA - BP - Quad 204 Schiehallion Redevelopment - SURF $800mm - recovery of all existing flex risers(3) and dynamic SPU systems(4), install of a new FPSO, mooring system & anchor piles, 21 dynamic flex risers, 4 static & dynamic SPU, 15 steel PL, tota...
NAME - Shell - Stones - EPI of subsea production system and lateral gas line (45km 8")NAME - LLOG - Delta House - Install of 125km infield FL
AFM - Total - Kaombo - SURF - Install of 135km FL + 190km SPUAFM - Total - Kaombo - SURF - Install of 135km FL + 190km SPUAFM - Targeting - Noble Energy - Leviathan - Gas Exports to Beach 240km 16"
NAME - ExxonMobil - Julia; EPIC of 48Km of 11" infield, steel catenary risers & flowline end terminations.AFM - Tullow Oil Ghana TEN; $730mm - engineering, fabrication and installation of 9 flex risers, 3 flex FL & 12 flex spools totaling 48km engineering, fabrication and installation of 33km of water injection & gas injection rigid FL;...
AFM - Targeting - Chevron - Nsiko; install of 50Km of 12" Export and 10Km of 12" InfieldNAME - Bidding - Anadarko - Heidelberg - Install of 54km 20" oil export NAME - Bidding - Anadarko - Heidelberg - Install of 54km 20" oil export
AFM - Bidding - BP - Block 31 SE Phase 2; install of 150Km of 12"AFM - Bidding - BP - Block 31 SE Phase 2; install of 150Km of 12"NAME - Targeting - Hess - Stampede (Pony & Knotty Head); ~32km export
H1 H2 H1 H2 H1 H2 H1 H2 H1 H2 H1 H2 H1 H2 H1 H2 H12013 2014 2015 2016 2017 2018 2019 2020 2021
BOOKED WORK
BOOKED WORK FOR LTC
BIDDING WORK
TARGETED
FAVORED
SHIPYARD/TRANSIT
IDLE/STANDBY
Quest CVS - Deep Blue Sample Fri 1/17/14 2:23 PM
Quest Construction Vessel Schedule
(C) 2013 Quest Offshore Resources, Inc. Page 1
Quest CVS - Deep Blue Sample Date: Fri 1/17/14
Excel Tables Do Not Contain All Available Data Fields
QUEST VESSEL FUNCTION DATABASE EXCERPT
Contractor Vessel Name Vessel Category Length (m)Min Pipe Dia (in)
Mx Pipe Dia (in)
Tension Capacity (tonnes)
CRANE CAP (tonnes)
No Cranes
AHCA&R
(tonnes)No
ROVsBuild Year
Allseas Solitaire DW PL 300.0 2 60 1050 850 3 1 1997Helix Caesar DW PL 146.5 2 42 405 300 5 450 2007Saipem Castorone DW PL 330.0 60 750 600 5 Yes 900 2 2012Technip Deep Blue DW PL 206.5 4 28 770 400 3 Yes 150 2 2001Technip Global 1200 DW PL 162.3 4 60 640 1200 2 400 2011Heerema DCV Thialf Heavy-Lift DCV 165.3 0 14200 1985Subsea 7 Sapura 3000 Heavy-Lift DCV 151.2 4 60 400 3000 3 360 2 2007
Helix Q4000 Intervention 95.2725.74 (Riser
Tension)360 2 1 2002
Saipem Castoro 7 Pipelay Trunkline 179.5 8 60 340 64.8 4 340 1975CEONA Giant 3 Reel Lay 184.0 550 400 Yes 2012McDermott North Ocean 108 Reel Lay 130.2 4 16 362.8 362.8 Yes 2012Subsea 7 Acergy Condor Reel Lay 145.0 230 70 2 250 2 1982Subsea 7 Kommandor 3000 Reel Lay 118.4 150 200 2 200 2 1984Aker Solutions Aker Wayfarer SS Const 1 156.9 400 2 Yes 2 2009Subsea 7 Skandi Neptune SS Const 2 104.2 16 100 250 3 Yes 2 2001
QUEST CVS PLUS EXCERPT
Vessel CategoryVessel
ContractorVessel Name Task Name Duration Start Finish Hemisphere Province Operator Status
DEEPWATER PIPELAY Technip DEEP BLUE ExxonMobil - Hadrian South 30 days 12/2/2013 1/1/2014 North America GOM-US ExxonMobil BookedDEEPWATER PIPELAY Technip DEEP BLUE IDLE/Standby - Mobile, United States of America 1 day 12/16/2013 12/17/2013 North America Idle/StandbyDEEPWATER PIPELAY Technip DEEP BLUE Anadarko/ExxonMobil - GoM Lucius - 2nd Campaign 82 days 1/1/2014 3/24/2014 North America GOM-US Anadarko Petroleum BookedDEEPWATER PIPELAY Technip DEEP BLUE BP - Quad 204 Schiehallion Redevelopment 91 days 5/10/2014 8/9/2014 North Sea/Arctic West of Shetlands bp BookedDEEPWATER PIPELAY Technip DEEP BLUE Shell - Stones 25 days 9/1/2014 9/26/2014 North America GOM-US Royal Dutch/Shell BookedDEEPWATER PIPELAY Technip DEEP BLUE LLOG - Delta House 35 days 10/1/2014 11/5/2014 North America GOM-US LLOG BookedDEEPWATER PIPELAY Technip DEEP BLUE Total - Kaombo 180 days 1/1/2015 6/30/2015 Africa/Medit. Angola Total BiddingDEEPWATER PIPELAY Technip DEEP BLUE Targeting - Noble Energy - Leviathan 90 days 1/1/2015 4/1/2015 Africa/Medit. Israel Noble Energy TargetedDEEPWATER PIPELAY Technip DEEP BLUE ExxonMobil - Julia 45 days 4/1/2015 5/16/2015 North America GOM-US ExxonMobil BookedDEEPWATER PIPELAY Technip DEEP BLUE Tullow Oil Ghana - TEN Project 100 days 10/1/2015 1/9/2016 Africa/Medit. Ghana Tullow Oil BookedDEEPWATER PIPELAY Technip DEEP BLUE Targeting - Chevron - Nsiko 55 days 1/1/2016 2/25/2016 Africa/Medit. Nigeria Chevron TargetedDEEPWATER PIPELAY Technip DEEP BLUE Bidding - Anadarko - Heidelberg 72 days 4/1/2016 6/12/2016 North America GOM-US Anadarko Petroleum BiddingDEEPWATER PIPELAY Technip DEEP BLUE Bidding - BP - Block 31 SE Phase 2 95 days 11/1/2016 2/4/2017 Africa/Medit. Angola bp BiddingDEEPWATER PIPELAY Technip DEEP BLUE Targeting - Hess - Stampede (Pony & Knotty Head) 29 days 1/1/2017 1/30/2017 North America GOM-US Hess Targeted

Quest Events and Maps
mce deepWater development exhibition & technical conference - europe’s flagship event
With over a decade of events, Marine, Construction & Engineering (MCE) Deepwater Development is recognized as the leading conference addressing technical issues related
to engineering, development, and production of oil and gas in deep and ultra deepwater arenas around the world. As our industry confronts new
challenges, the sharing of deepwater experience will play a critical role in improving the quality, safety, and economics
vital to the future of the industry.
The mission of MCE Deepwater Development is to provide a focused event, based in Europe and
completely dedicated to the advancement of global exploration and production. The conference
addresses the myriad of technical issues and challenges confronting this industry, while offering
networking opportunities unrivaled by any other industry event.
Through our sponsorship and exhibition opportunities, Quest’s goal is to provide a first class service with maximum
marketing exposure. The hospitable staff and stand builder assist to make set-up and dismantle smooth at MCE Deepwater Development. If you want, you can even send your
marketing information to be printed on the panels and they will be set-up for you when you arrive. Exhibiting has never been easier!
The MCE Deepwater Development Technical Program grows in strength each year as our distinguished Advisory Board reaches into the industry to highlight the pertinent topics and
secures the experts in those areas to share their experiences. The International, National and Independent Oil companies make up around 50 percent of the program with the major supply chain companies and engineering houses adding strategic insight into what’s driving the future of the deepwater industry.
regional Wall mapsQuest provides an excellent marketing and branding platform through our regional wall maps illustrating subsea and floating production infrastructure with a focus on future developments. Maps are distributed to high-level members of the deepwater industry at leading companies within the market.
Each map notes the project scope in terms of number of subsea trees and type of floating production unit used and the related major trunklines. Quest also details upcoming exploratory drilling prospects on each map so you can see where the future developments may be in relation to flowing or future developments. We also provide status of developments, operator and block number as well as major lease area name.
West Africa2008 Infrastructure & Quest Offshore’s
Subsea & Float ing Product ion Systems Forecast .
The active and forecast subsea & floating production systems depicted on this map are from proprietarydatabases and remain the copyright of Quest Offshore Resources Inc.This map offers an insight into the
currently known active, planned or forecast field developments and their allocated systems and is based on continuous research by Quest Offshore analysts. Quest Offshore, however, cannot
guarantee that all the known fields or systems are shown.
All subsea data detailed on this map is available in the "Quest Subsea Database"All floating production system data detailed on this map is available in the "Quest Floating Production Database"
– for further information, please contact [email protected] or visit www.questoffshore.com.
Quest Offshore Resources Inc.: 1600 Highway 6, Suite 300, Sugar Land TX 77478 USA,Tel: 281 491 5900, Fax: 281 491 5902Quest Offshore (Europe): 57 Rosebushes, Epsom Downs, Surrey KT17 3NT UK,Tel: 44 1 737 371704, Fax: 44 1 737 371284
Email: [email protected]
www.questoffshore.comThis map is the sole property of the publisher and may not be copied in whole or in part without written permission
from the publisher. Copyright 2008, Quest Offshore Resources Inc.
NOTICEThis map has been produced with the greatest care and accuracy and the map and the data depicted were believed to be correct at the time of printing.
Unauthorized disclosure, use, reproduction, reprocessing or transfer of this Data to or by any unauthorized entity is strictly prohibited.This data reflects information as of October 2008. Nothwithstanding, Quest Offshore and/or InduComm cannot and do not warrant the accuracy of this map nor do they
accept or assume any liability or responsibility for any consequence, financial or otherwise, direct or consequential, foreseeable or not, by any entity relying on the data for anypurpose whatsoever and said entity does so entirely at its own risk and accepts it “as is”.
The data should not be used for navigation.
CTPSOUTH
CTP DEEP
Our market-leading subsea safety systems – and our world-renowned Tronic and Matre
subsea connectors and sensors – provide our customers with the technology and
expertise essential to meet the demands of the challenging deepwater environment.
Expro – the safe choice for the well flow management of your subsea wells.
Find out more from: www.exprogroup.com
Expro delivers the ultimatein reliability subsea.
Meeting all lubricant and subsea control fluid needsensuring supply through local distributors.
For further information email: [email protected]
Sea Trucks GroupSERVING THE INSHORE AND OFFSHORE
OIL & GAS INDUSTRY
www.seatrucksgroup.com
� pipelay
� accommodation
� installation
� fabrication
Jascon 8
Cameron – raising performance with a proven approach to subsea systems equipmentengineering that delivers improved reliability and production uptime you can measurein dollars and cents. www.c-a-m.com/subseasystems
R A I S I N G P E R F O R M A N C E . T O G E T H E R ™
PerformanceRELIABILITY AND UPTIME DELIVERED
S U B S E A S Y S T E M SFor leading offshore oil and gas operators, Cameron is the Subsea Systems equipment expert that helpsyou continuously raise performance through our proven technical expertise, project management, andglobal manufacturing and service network.
TC9513
from surface to seabed,integrated subsea services …
Offshore construction andsupport vessels
Project management andengineering
Survey and positioningoperations
Diving operations
ROV operations
delivering solutions at any depthwww.dofsubsea.com
Flowing Floater & Subsea Projects
Block Field / Project Operator SS Trees Host
Angola4 Jimbao / Gimboa Sonangol 8 FPSO3 Canuku (Ocean Producer) Total 8 FPSO17 Dalia Phase 1 Total 42 FPSO17 Girassol Total 47 FPSO18 Greater Plutonio: Galio, Cromio,
Paladio, Cobalto, Platina BP 45 FPSO17 Jasmim Phase I & II Total 10 Subsea4 Kiabo 4-26 Sonangol 4 Subsea15 Kizomba A Phase 1A Hungo, Chocalho ExxonMobil 23 FPSO15 Kizomba B Phase 2 Kissanje, Dikanza ExxonMobil 19 FPSO15 Kizomba C (Mondo, Saxi, Batuque) ExxonMobil 37 FPSO14 Kuito (All Phases) Chevron 40 FPSO14 Lobito-Tomboco (BBLT Phase 2) Chevron 22 SubseaArea A Malongo (Berge Troll) Chevron 0 FSO15 North Marimba ExxonMobil 4 Subsea3/5 A Oombo Total 4 Subsea17 Rosa Total 27 Subsea15 Xikomba ExxonMobil 9 FPSO
CameroonChad Chad Offshore Facilities Project ExxonMobil 0 FSO
CongoMarine V Djambala 6 & Phase 2 Eni 5 SubseaHaute Mer Moho Bilondo (Mobim & Bilondo Haute Mer) Total 12 FPUHaute Mer N'Kossa II Total 3 FSOMarine XI Sounda 7 Eni 2 SubseaMarine X Tchendo Total 7 Subsea
Equatorial GuineaBlock S Ceiba Hess 20 FPSOBlock S Okume Complex (Elon, Oveng,
Okume,Ebano) Ceiba Expansion Hess 11 TLPB Opalo ExxonMobil 2 SubseaB Topacio ExxonMobil 1 SubseaB Zafiro Phase 1&2 ExxonMobil 37 FPSOB Zafiro South Sea ExxonMobil 31 FPSO
GabonEtame EEA Etame Phase 1 & 2 Vaalco 5 FPSO
GhanaDeep Tano South Tano Ghana Nat. Pet. 1 Subsea
Ivory CoastCI-40 Baobab FPSO, Baobab Ivorien MV10 CNR 20 FPSO
MauritaniaArea B, Block 4 Chinguetti Phase I & 2 Petronas Carigali 19 FPSO
NigeriaOML 125 Abo Eni 14 FPSOOML 127 / OML 128 Agbami Chevron 22 FPSOOML 99 / OML 70 Amenam Phase 1 & 2 / Kpono Total 0 FSOOML 118 Bonga Shell 31 FPSOOML 79 EA Shell 0 FPSOOML 102 Ekanga Notch ExxonMobil 5 SubseaOML 133 Erha & Erha North ExxonMobil 36 FPSOOML 119 Okono / Okpoho Eni 4 FPSOOML 126 Okwori Addax 16 FPSO
South AfricaBlock 9 Mosselbay Soekor 9 SubseaE-BT Oribi (Orca Semisub) PetroSA 3 FPS-SemiE-BD Sable (FPSO Glas Dowr) Soekor 6 FPSOBlock 9 South Coast Gas Project (SCG) PetroSA 8 Subsea
www.tdw.com
TIDEWATER
DORIS Engineering
www.doris-engineering.com
MOREINNOVATIVETHAN EVER
Global capability in complex offshore engineering and marine operations
www.nobledenton.com
With an established presence in all major oil & gas centres; including North & South America, Europe,the Middle & Far East and the development of new offices in emerging markets, the Noble Denton nameis synonymous with integrity and technical excellence.
Innovation and Experience lead to superior Mooring Technology.
Vryhof anchors are by far the most applied in the Offshore Industry
• Design & manufacturing of anchors for drilling rigs, FPSO’s and CALM buoy’s • Turnkey rental of the Stevtensioner with supervision for offshore installation• Soil data analysis and mooring recommendation• Stevtrack anchor position monitoring system • Representation of manufacturers of mooring line components
Vryhof Anchors Always a step ahead www.vryhof.com
Quest WA08 DEF 26-01-2009 16:10 Pagina 1
15For More Information, Please Contact Bo Howard ([email protected])

Quest Offshore is a leading provider of industry analysis, tactical data, news, influential market intelligence reports, consulting and technical conferences to the offshore oil and gas industry. Our niche canvasses subsea technology, FPS
fabrication, umbilicals, riser & flowlines, and marine construction segments globally.
Quest is your source for strategic insight on the global deepwater oil & gas industry.
www.QuestOffshore.com
Corporate HeadquartersQuest Offshore Resources Inc.77 Sugar Creek Blvd, Suite 500
Sugar Land, TX 77478 USAMain: (281) 491-5900Fax: (281) 491-5902Contact Josh Douglas
Brazil InquiriesQBr Empreendimentos
Caixa Postal 105004CEP: 24.230-970 Niteroi RJ
BrazilMain: +55 21 3619 2344
Contact Romero [email protected]
Clarity. Insight. Vision.