Embed Size (px)
Citation preview

““You’ll find that the only thing you can do You’ll find that the only thing you can do easily is be wrong, and that’s hardly worth easily is be wrong, and that’s hardly worth
the effortthe effort””
Norton JusterNorton Juster The Phantom TollboothThe Phantom Tollbooth

• Water Properties• Heat capacity, latent heat, saturation vapor pressure, etc…
•Precipitation• Condensation, rainfall (spatial & temporal)
• Evaporation• Evaporation, transpiration, mass/energy balance
U6115: Climate & WaterU6115: Climate & WaterFriday, July 18 2003Friday, July 18 2003

Water – Precipitation/EvaporationWater – Precipitation/Evaporation1)1) Temporal and spatial change in energy of atmosphere Temporal and spatial change in energy of atmosphere
will affect the amount of moisture and thus heat transferwill affect the amount of moisture and thus heat transfer2)2) Regional water mass balance will be affectedRegional water mass balance will be affected..3)3) Precipitation is primary input of water to a catchmentPrecipitation is primary input of water to a catchment4)4) Evaporation is (often) the primary output from a Evaporation is (often) the primary output from a
catchmentcatchment..

Nature and Cause of FloodsNature and Cause of Floods
The nature of each hydrograph depends upon watershed and The nature of each hydrograph depends upon watershed and storm characteristics storm characteristics strong relationship between hyetograph strong relationship between hyetograph (precipitation) and hydrograph (stream runoff):(precipitation) and hydrograph (stream runoff):
-) The resulting peak in the hydrograph is called a -) The resulting peak in the hydrograph is called a floodflood regardless of whether the river actually leaves its banks and regardless of whether the river actually leaves its banks and causes damage!causes damage!-) Background discharge between floods is called -) Background discharge between floods is called baseflowbaseflow and is supplied by inflow of groundwaters (Sta Cruz river in and is supplied by inflow of groundwaters (Sta Cruz river in AZ)AZ)

Nature and Cause of FloodsNature and Cause of Floods
• in rivers, floods and low flows are expressions of the temporal variability in rainfall or snowmelt interacting with river basin characteristics (basin form, hillslope properties, channel network properties)
• flooding may also be the result of sudden release of water from dams or lakes, ice jams
• floods cause the biggest natural hazard damage in the US, example: Mississippi flood, 1993; Honduras, Hurricane Mitch
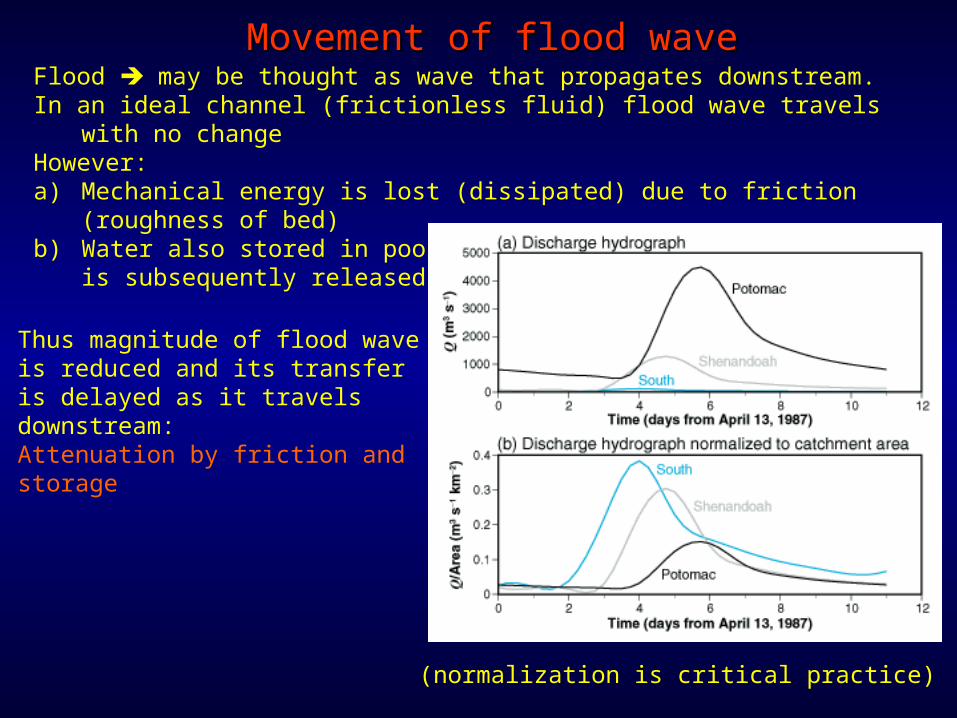
Flood may be thought as wave that propagates downstream.In an ideal channel (frictionless fluid) flood wave travels with no changeHowever:a) Mechanical energy is lost (dissipated) due to friction (roughness of
bed)b) Water also stored in pools, wetlands, and backwaters, and is
subsequently released (delay)
Movement of flood waveMovement of flood wave
Thus magnitude of flood wave is reduced and its transfer is delayed as it travels downstream:Attenuation by friction and storage
(normalization is critical practice)
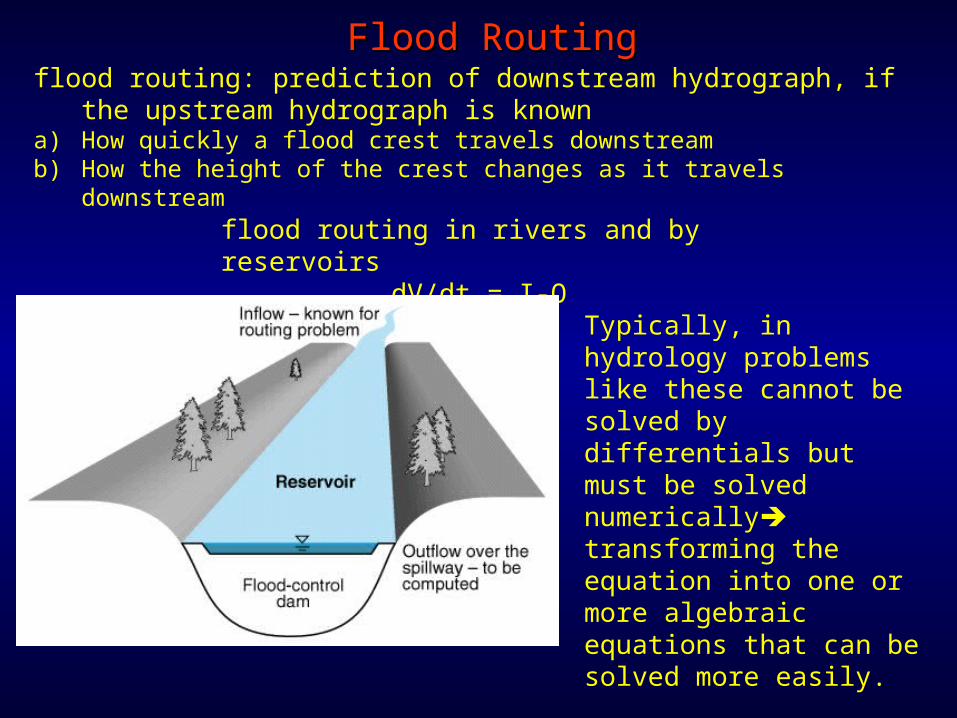
flood routing: prediction of downstream hydrograph, if the upstream hydrograph is known
a) How quickly a flood crest travels downstreamb) How the height of the crest changes as it travels downstream
Flood RoutingFlood Routing
flood routing in rivers and by reservoirs
dV/dt = I-OTypically, in hydrology problems like these cannot be solved by differentials but must be solved numerically transforming the equation into one or more algebraic equations that can be solved more easily.

Prediction of downstream hydrographs requiresa) An estimate of speed of wave crestb) An estimate of the volume added by inflowc) Influence of frictiond) A complete understanding of hydrology & hydraulics of drainage
basin
Flood RoutingFlood Routing
Solving this equation requires 2 equations-) statement of conservation of mass-) conservation of momentumNeed numerical method to transform DFQ into algebraic one:
Vn+1 - Vn/t = In +In+1/2 - On+On+1/2
The 2 most important variables:a) Depthb) velocity
dV/dt = I-O

Reservoirs’ size and volume affect the routing very rapidly. When reservoirs increase in size (and volume) they store more water and rise in water (h) is smaller increase in outflow is smaller (delay and reduction of O).
A flood wave in rivers, on the other hand, must move through a long stretch of river before peak discharge is reduced as much as moderate-size reservoirs can accomplish in a relative short distance
Flood RoutingFlood Routing
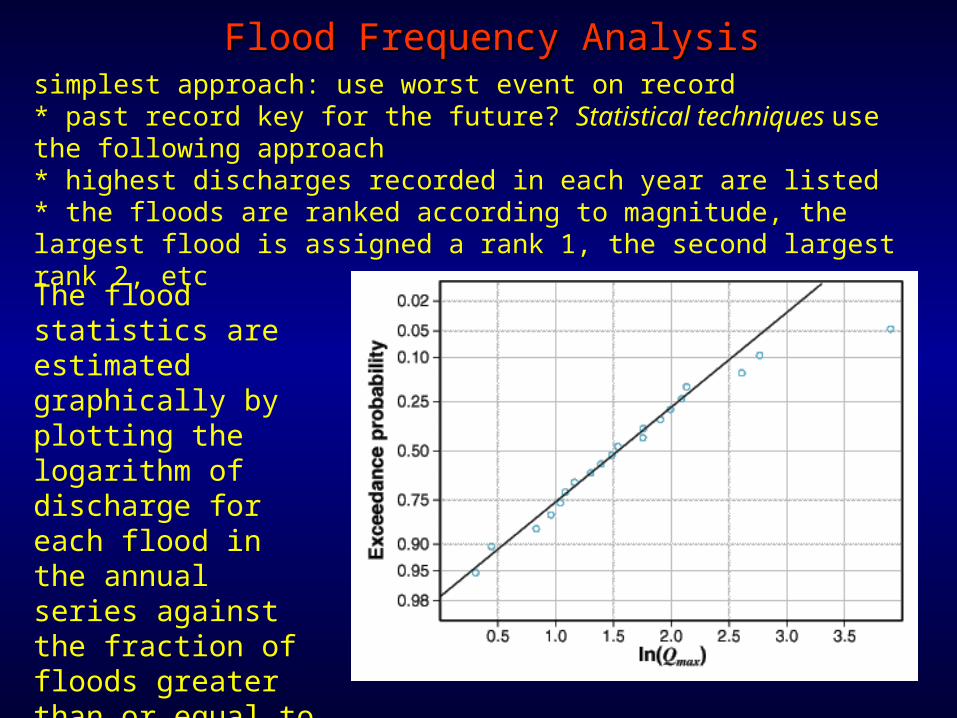
simplest approach: use worst event on record* past record key for the future? Statistical techniques use the following approach* highest discharges recorded in each year are listed* the floods are ranked according to magnitude, the largest flood is assigned a rank 1, the second largest rank 2, etc
Flood Frequency AnalysisFlood Frequency Analysis
The flood statistics are estimated graphically by plotting the logarithm of discharge for each flood in the annual series against the fraction of floods greater than or equal to that flood:
r/(n+1) where r is the rank of the particular flood

* The return period, the average span of time between any flood and one equaling or exceeding it, is calculated as Treturn = 1/(exceedance probability).* The 100 years flood can then be estimated from the graph* Normal distribution works often well with precipitation data and ln normal for discharge* Problems: not deterministic, based usually on non-adequate data, climate and terrestrial environment is variable
Flood Frequency AnalysisFlood Frequency Analysis
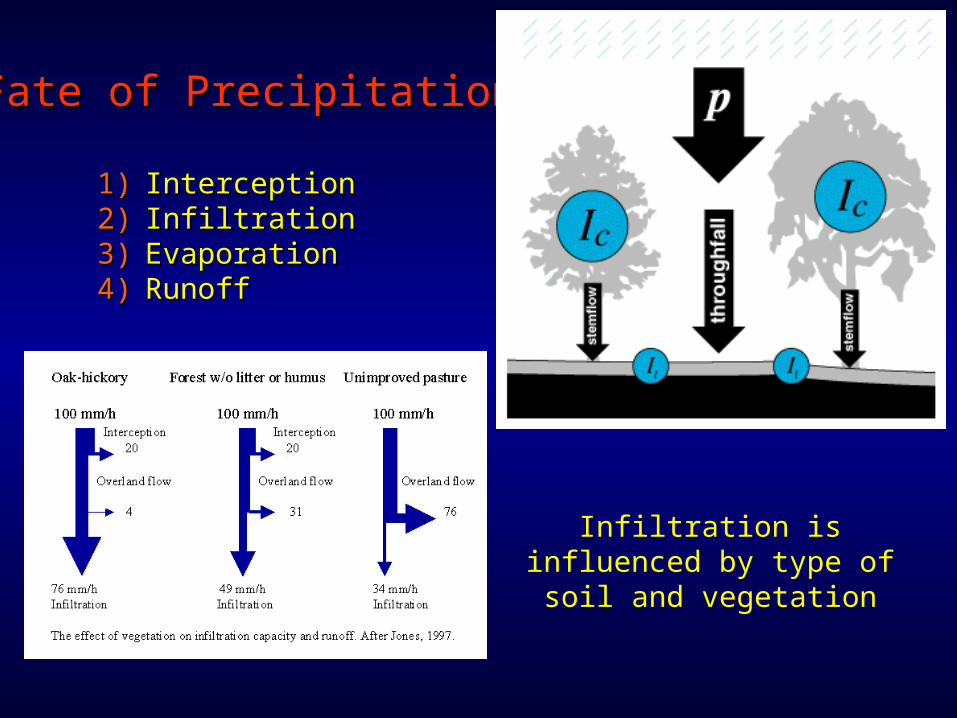
1)1) InterceptionInterception2)2) InfiltrationInfiltration3)3) EvaporationEvaporation4)4) RunoffRunoff
Fate of PrecipitationFate of Precipitation
Infiltration is influenced by type of soil and vegetation

evapotranspiration summarizes all processes that return liquid water back into water vapor
- evaporation: direct transfer of water from open water bodies- transpiration: indirect transfer of water from root-stomatal
system
• water needed as well as solar energy• of the water taken up by plants, ~95% is returned to the atmosphere through their stomata (only 5% is turned into biomass!)• potential evaporation (PE), i.e. the evaporation rate given an unrestricted water supply - different from actual evaporation• how can the actual evapotranspiration be measured?
• water balance• energy balance• or combination of both
Evapotranspiration

Apart from precipitation, the most significant component of the hydrologic budget is evapotranspiration. Evapotranspiration varies regionally and seasonally; during a drought it varies according to weather and wind conditions
Slightly more than 10% of atmospheric moisture (40,000 bg) is precipitated as rain, sleet, hail, or snow in the conterminous USA. The disposition of this precipitation is illustrated below.
Evapotranspiration
Evapotranspiration: ~ 67%(majority of loss through transpiration)Runoff: 29%Groundwater outflow: ~2%Consumption: ~2%
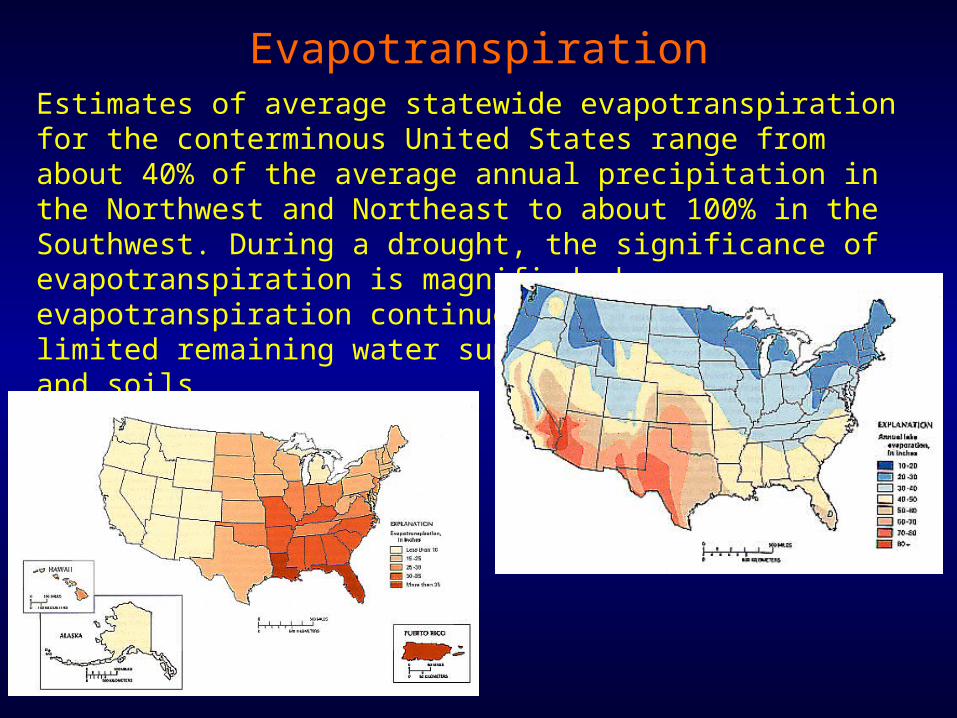
Estimates of average statewide evapotranspiration for the conterminous United States range from about 40% of the average annual precipitation in the Northwest and Northeast to about 100% in the Southwest. During a drought, the significance of evapotranspiration is magnified, because evapotranspiration continues to deplete the limited remaining water supplies in water bodies and soils
Evapotranspiration

Estimation of ET1) from the water balancethis approach may suffer from the uncertainties in the numbers, example:
dV/dt = p + rsi - rso - et = 0 et = p + rsi - rso
p = 107±5x10⁵ m3/y (±5%)rsi = 109±1.5x10⁸ m3/y (±15%)rso = 9.95x10⁸±1.5x10⁸ m3/y (±15%)
Here, if we neglect the groundwater inflows and outflows, we can use these values to solve for et.
Evapotranspiration
The results, accumulating the errors as we go, is:
1.5x10⁷±3x10⁸ m3/yUnrealistic to expect to be able to quantify accurately all terms in a water balance for a catchment to solve for et, especially over short periods where storage changes are both substantial and difficult to measure precisely (or predict).
Diagnostic NOT predictive approach

Estimation of ET2) from the Energy balanceFirst Law of Thermodynamics: conservation of energy (E)Thermodynamic principles hold that the net radiant energy arriving across the boundary of a surface land system (including a very thin top soil layer, vegetation, and immediate surrounding air), must be exactly balanced by other energy fluxes across the boundary and the net change in energy held within the volume.
Total incoming E = Outgoing E + any increase in the body’s internal E (Q)
Evapotranspiration
dQ/dt = Rn-G-H-El
Rn = net (solar) radiation
G = output (conduction) to the ground
H = output (sensible heat) to atmosphere
El = output of latent heat

Estimation of ET2) from the Energy balanceAll matter has internal energy (expressed in calories or joules)a) Specific heat capacity provides a measure of how a substance’s internal energy changes with temperature
Cp = (dEu/m)/dT
Water has a specific heat of 1.0 cal/g.°C or 4.2x10³ J/kg.°C
b) Latent heat is the amount of internal energy that is released or absorbed during phase change (no change in temperature), at a constant temperature.
v = 2.5 - (2.18x10⁻³xT) x106 J/kgAt 20°C v = 2.45x10⁶ J/kg
Evapotranspiration

Estimation of ET2) from the Energy balanceThe rate of evaporation can be described, in the context of the energy balance equation, as an energy flux
dQ/dt = Rn - G - H - El
orEl = Rn - G - H - dQ/dt
Since the heat flux is related to the rate of evapotranspiration (through latent heat of vaporization)
et = El/(wxv)We can then substitute this later equation into the previous one:
et = (Rn - G - H - dQ/dt)/(wxv)
Evapotranspiration
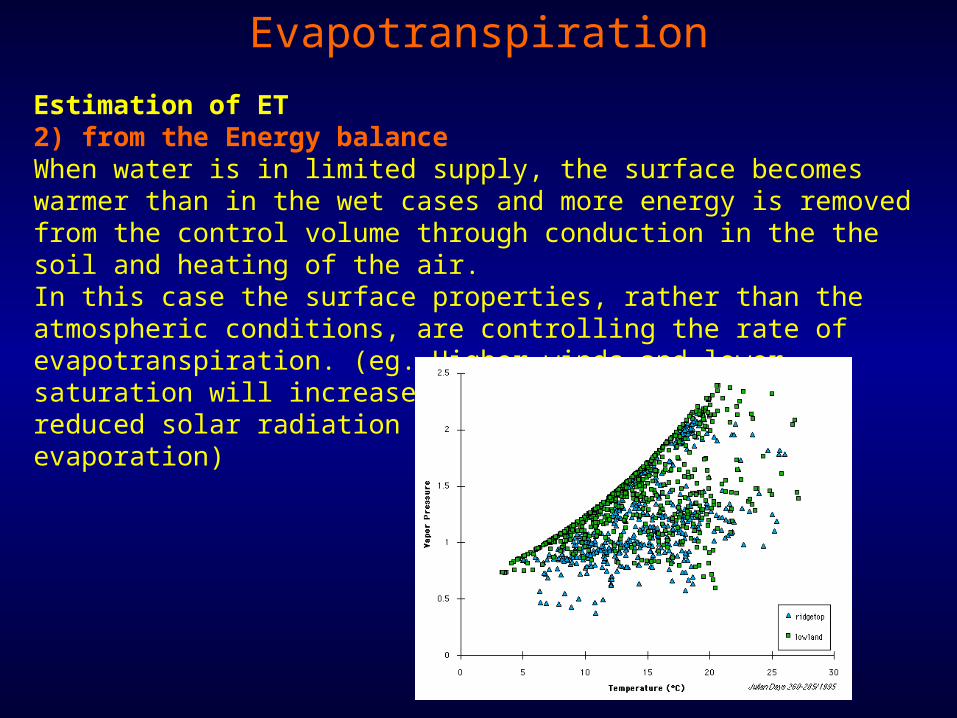
Estimation of ET2) from the Energy balanceWhen water is in limited supply, the surface becomes warmer than in the wet cases and more energy is removed from the control volume through conduction in the the soil and heating of the air.In this case the surface properties, rather than the atmospheric conditions, are controlling the rate of evapotranspiration. (eg. Higher winds and lower saturation will increase evaporation rate, while reduced solar radiation - clouds - will reduce evaporation)
Evapotranspiration

Estimation of ET2) from the Energy balanceRelationship between surface wetness and the partitioning of received energy between evaporation and heating of air and soil
Evapotranspiration

Estimation of ET2) from the Energy balanceThe rate of et that occurs under prevailing solar input and atmospheric properties, if the surface is fully wet, is commonly referred as Potential Evapotranspiration (PET). For a catchment water balance, we are interested in the actual et (rate at which water is actually removed).
When a surface is wet et/PET = 1, when it is dry et/PET ~ 0
Evapotranspiration
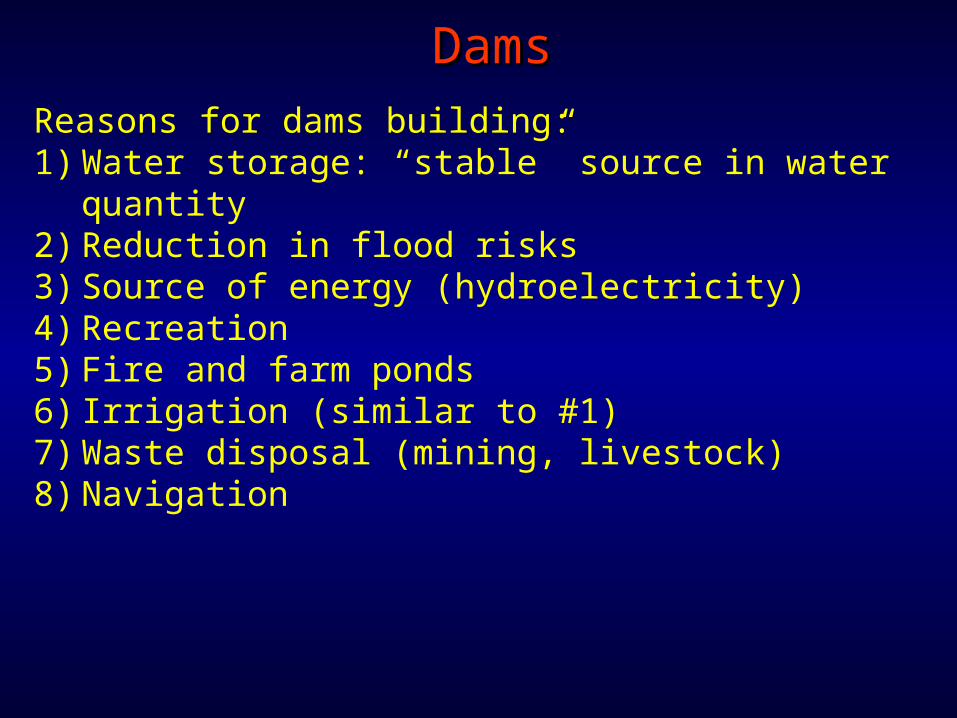
Reasons for dams building: 1) Water storage: “stable” source in water
quantity2) Reduction in flood risks3) Source of energy (hydroelectricity)4) Recreation5) Fire and farm ponds6) Irrigation (similar to #1)7) Waste disposal (mining, livestock)8) Navigation
DamsDams

The US now has the capacity to store the equivalent of almost a full year’s runoff in reservoirs behind ~ 80,000 structures
DamsDams
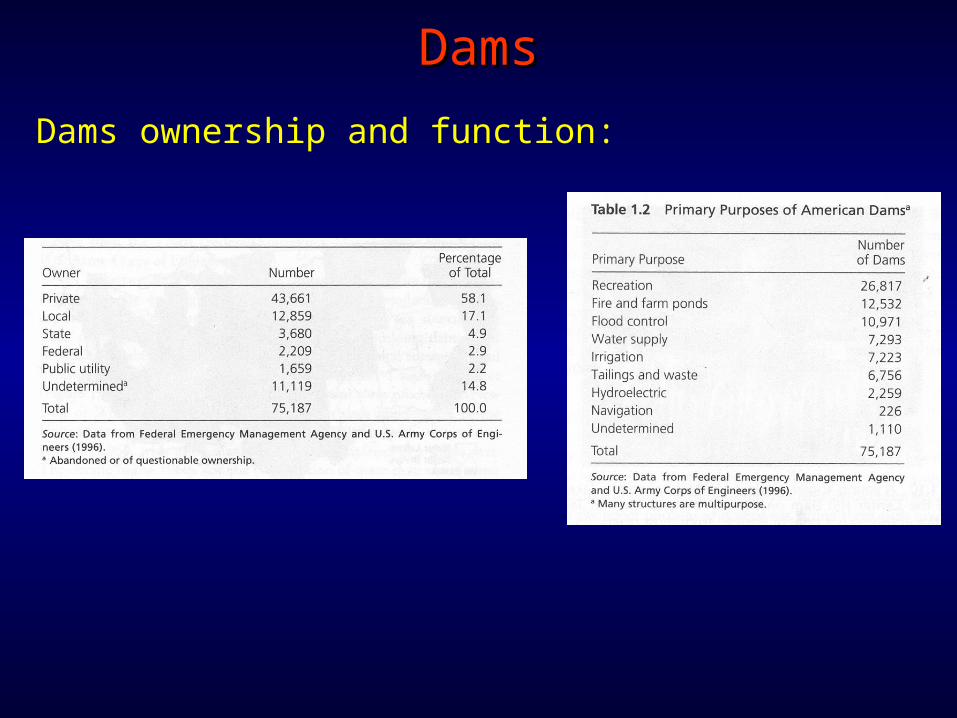
Dams ownership and function:
DamsDams
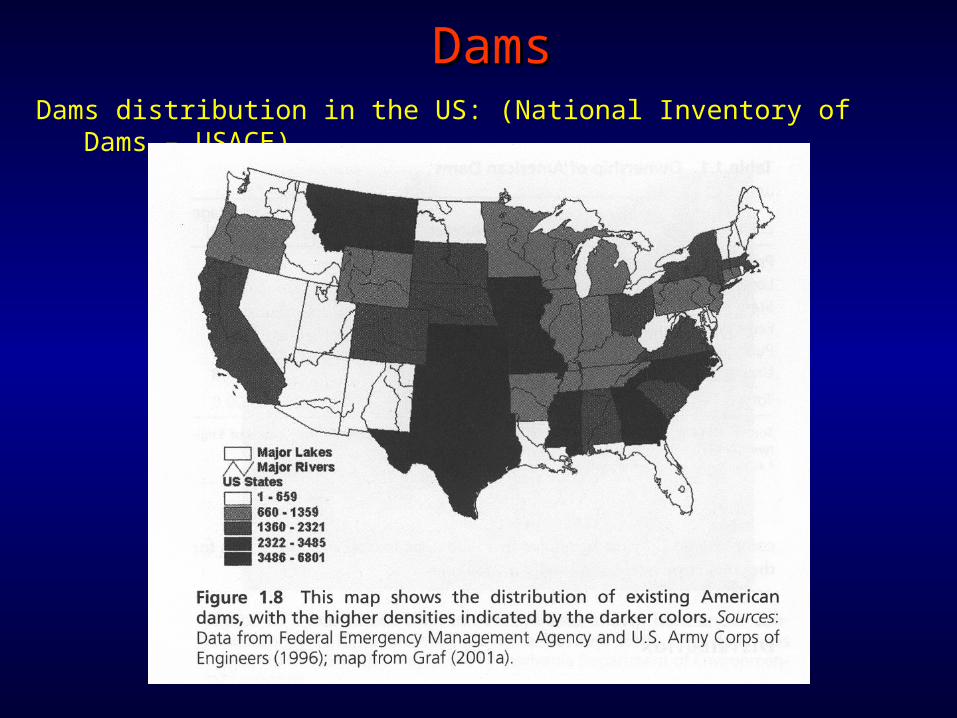
Dams distribution in the US: (National Inventory of Dams – USACE)
DamsDams

Colorado Colorado RiverRiver
hydrographhydrographQuestions:Questions: When does discharge peak When does discharge peak
and why?and why? The hydrographs were The hydrographs were
taken at different locations taken at different locations of the river, what is the of the river, what is the difference in the difference in the hydrographs and why is hydrographs and why is there one?there one?
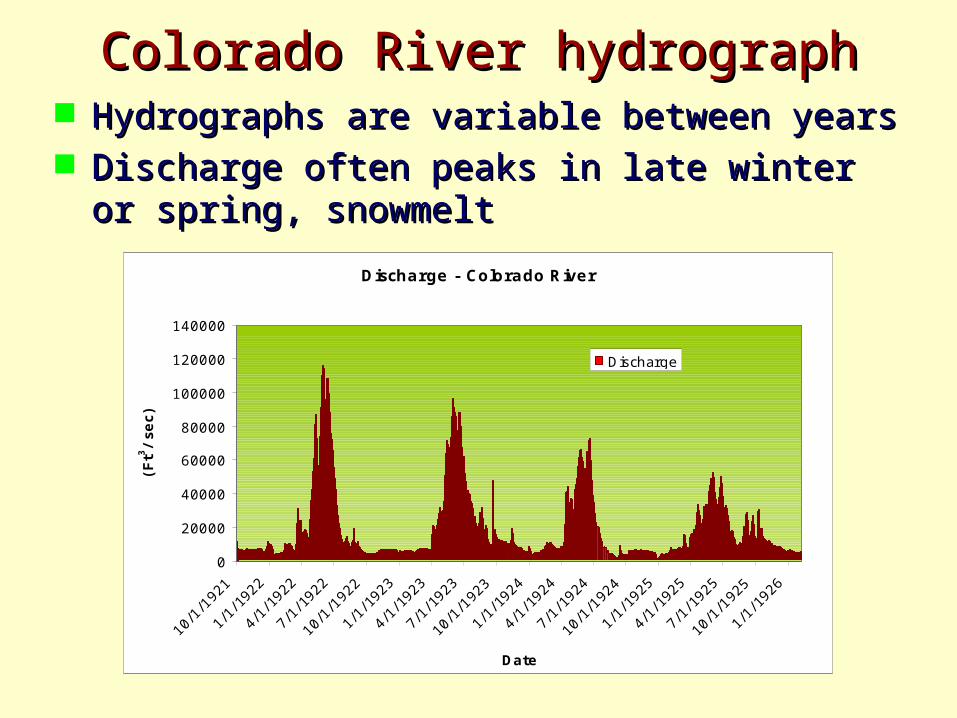
Hydrographs are variable between yearsHydrographs are variable between years Discharge often peaks in late winter or Discharge often peaks in late winter or
spring, snowmeltspring, snowmelt
Colorado River hydrographColorado River hydrograph
Discharge - Colorado River
0
20000
40000
60000
80000
100000
120000
140000
10/1
/192
1
1/1/
1922
4/1/
1922
7/1/
1922
10/1
/192
2
1/1/
1923
4/1/
1923
7/1/
1923
10/1
/192
3
1/1/
1924
4/1/
1924
7/1/
1924
10/1
/192
4
1/1/
1925
4/1/
1925
7/1/
1925
10/1
/192
5
1/1/
1926
Date
(Ft3
/se
c)
Discharge

Reservoirs smooth out extremesReservoirs smooth out extremes
Colorado River hydrographColorado River hydrograph
Discharge - Colorado River
0
20000
40000
60000
80000
100000
120000
140000
10/1/
1921
10/1/
1926
10/1/
1931
10/1/
1936
10/1/
1941
10/1/
1946
10/1/
1951
10/1/
1956
10/1/
1961
10/1/
1966
10/1/
1971
10/1/
1976
10/1/
1981
10/1/
1986
10/1/
1991
10/1/
1996
10/1/
2001
Date
(Ft3
/sec)
Discharge
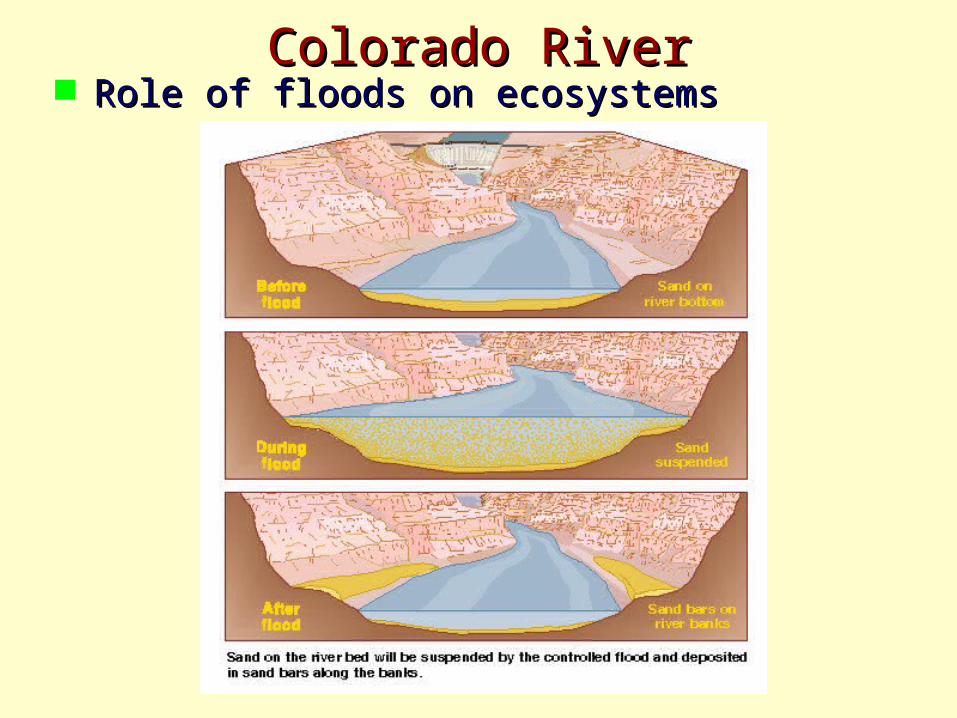
Role of floods on ecosystemsRole of floods on ecosystemsColorado RiverColorado River

DamsDams
Dams generate 1) Reduction in sediment load
Factors that control Factors that control sedimentationsedimentation
• Relationship between Relationship between average grain size and average grain size and energy of bottom currentsenergy of bottom currents
• Erosion, Transport and Erosion, Transport and Deposition Deposition (sedimentation) depend (sedimentation) depend on velocity of current on velocity of current and grain sizeand grain size
• Settling rate of Settling rate of suspended particles suspended particles varies with diameter varies with diameter (Stokes Law)(Stokes Law)
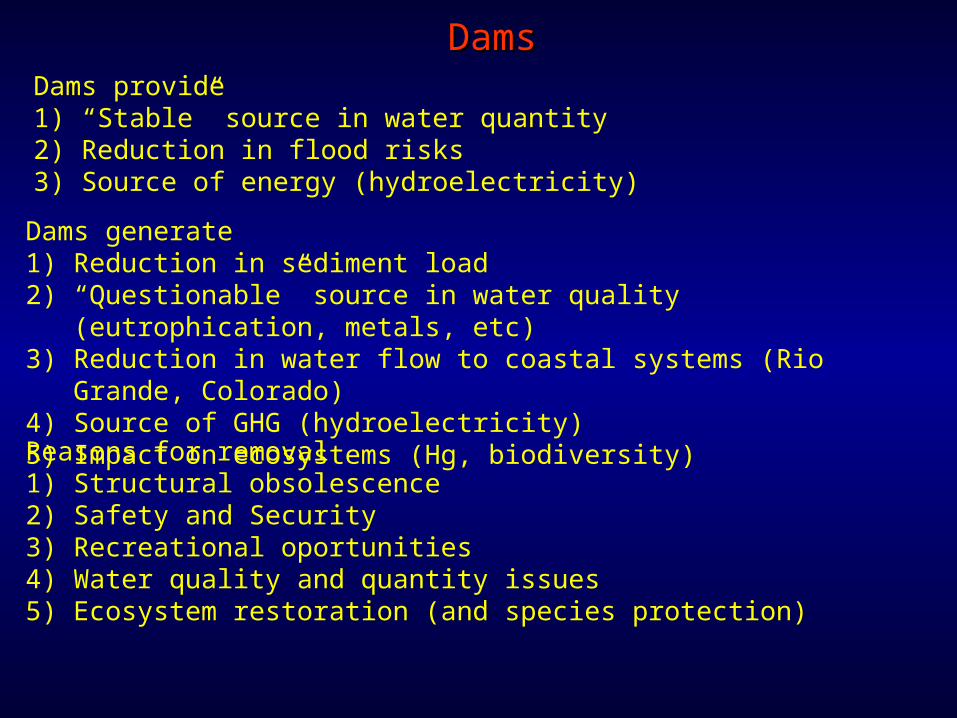
Dams provide 1) “Stable” source in water quantity2) Reduction in flood risks3) Source of energy (hydroelectricity)
DamsDams
Dams generate 1) Reduction in sediment load2) “Questionable” source in water quality (eutrophication, metals,
etc)3) Reduction in water flow to coastal systems (Rio Grande,
Colorado)4) Source of GHG (hydroelectricity)5) Impact on ecosystems (Hg, biodiversity)Reasons for removal 1) Structural obsolescence2) Safety and Security3) Recreational oportunities4) Water quality and quantity issues5) Ecosystem restoration (and species protection)

Dams removed in the US: (National Inventory of Dams – USACE)
DamsDams