Embed Size (px)
Citation preview
YouGov / HR Media Survey Results
Sample size: 2011 UK adults that work either full or part
time
Fieldwork: 30th August - 3rd September 2013
Male Female 18-34 35-44 45-54 55+ ABC1 C2DE North Midlands East London South Wales ScotlandNorthern
Ireland
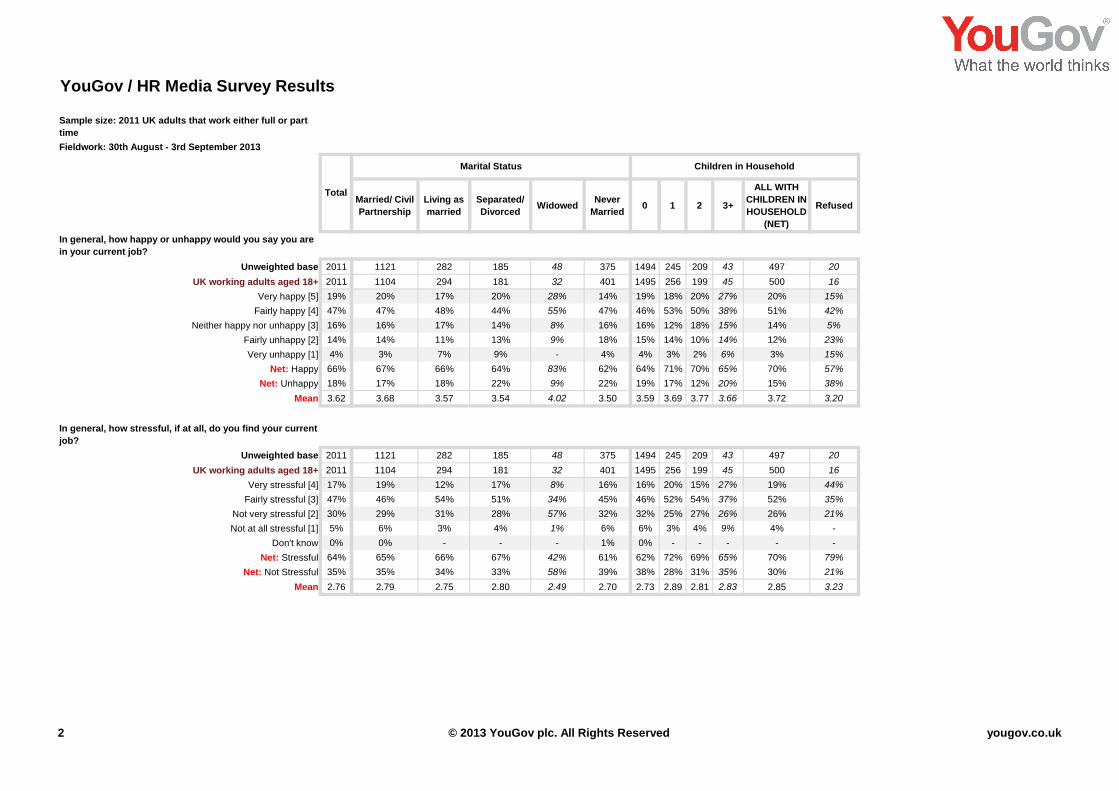
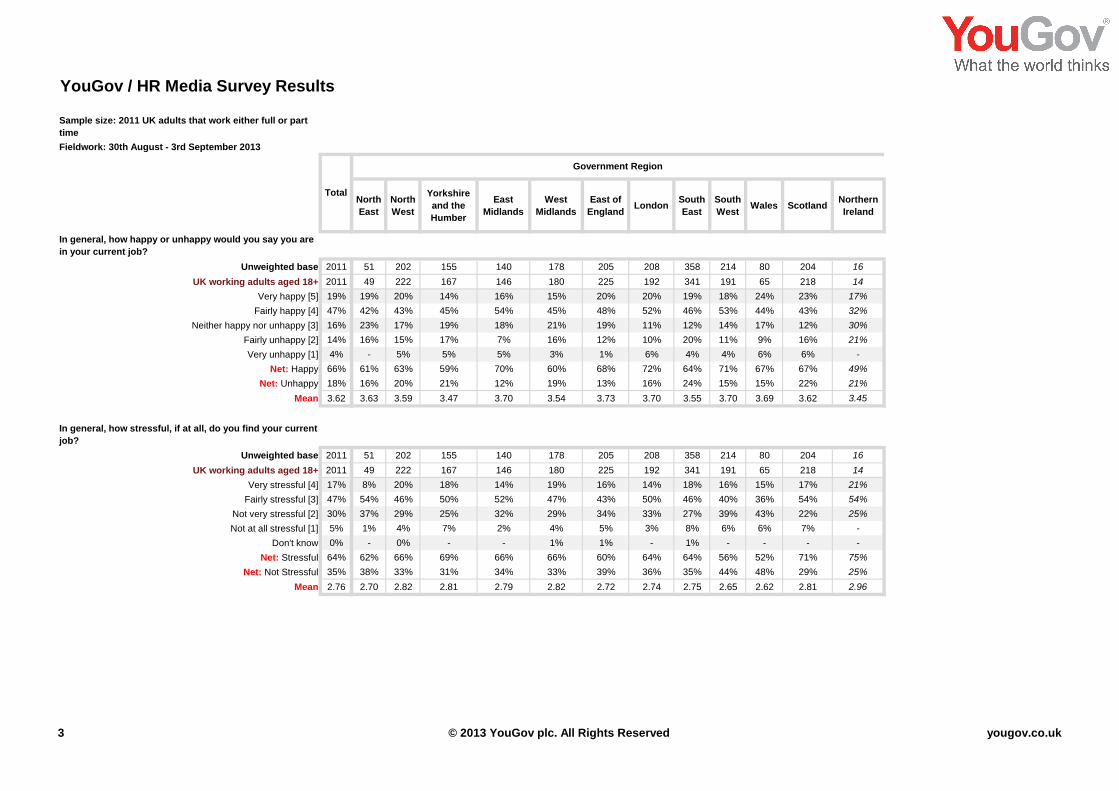
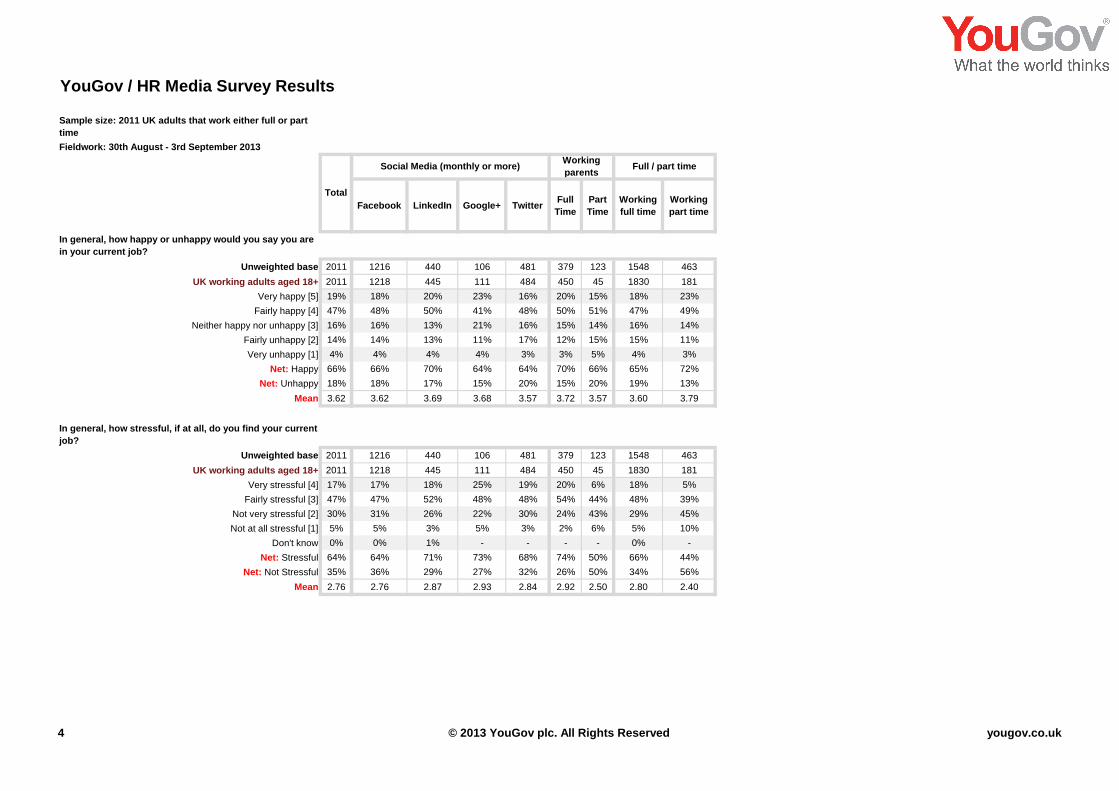
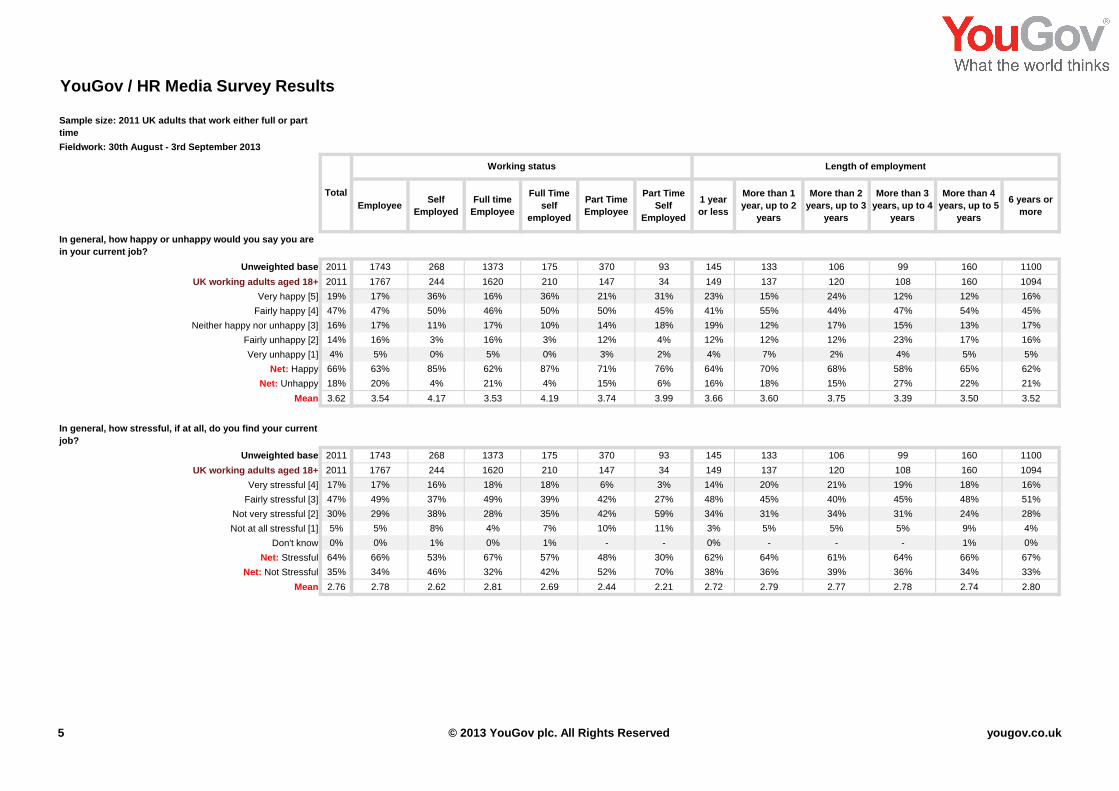
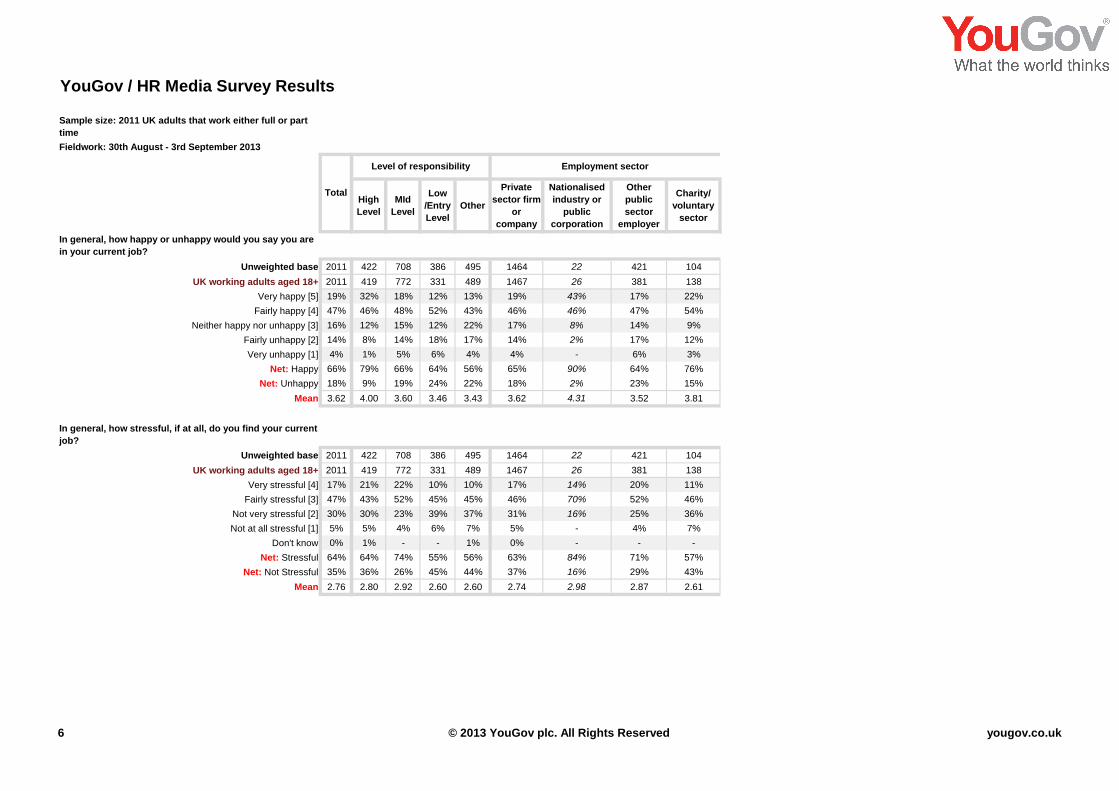
In general, how happy or unhappy would you say you are
in your current job?
Unweighted base 2011 1102 909 336 403 504 768 1348 663 408 318 205 208 572 80 204 16
UK working adults aged 18+ 2011 1347 664 348 439 520 703 1293 718 438 326 225 192 533 65 218 14
Very happy [5] 19% 18% 20% 17% 15% 19% 22% 21% 15% 18% 16% 20% 20% 18% 24% 23% 17%
Fairly happy [4] 47% 46% 49% 53% 45% 43% 48% 47% 46% 44% 49% 48% 52% 48% 44% 43% 32%
Neither happy nor unhappy [3] 16% 16% 16% 13% 19% 17% 15% 15% 18% 18% 20% 19% 11% 13% 17% 12% 30%
Fairly unhappy [2] 14% 15% 13% 13% 15% 17% 12% 13% 17% 16% 12% 12% 10% 17% 9% 16% 21%
Very unhappy [1] 4% 4% 3% 4% 6% 4% 3% 4% 4% 4% 4% 1% 6% 4% 6% 6% -
Net: Happy 66% 64% 68% 70% 60% 62% 70% 68% 61% 61% 65% 68% 72% 67% 67% 67% 49%
Net: Unhappy 18% 20% 16% 17% 21% 21% 16% 17% 21% 20% 16% 13% 16% 21% 15% 22% 21%
Mean 3.62 3.59 3.69 3.66 3.48 3.56 3.73 3.68 3.51 3.55 3.61 3.73 3.70 3.60 3.69 3.62 3.45
In general, how stressful, if at all, do you find your current
job?
Unweighted base 2011 1102 909 336 403 504 768 1348 663 408 318 205 208 572 80 204 16
UK working adults aged 18+ 2011 1347 664 348 439 520 703 1293 718 438 326 225 192 533 65 218 14
Very stressful [4] 17% 18% 15% 18% 18% 18% 15% 17% 16% 18% 17% 16% 14% 17% 15% 17% 21%
Fairly stressful [3] 47% 45% 52% 50% 48% 50% 43% 50% 42% 49% 49% 43% 50% 44% 36% 54% 54%
Not very stressful [2] 30% 31% 29% 28% 32% 27% 33% 28% 34% 28% 30% 34% 33% 31% 43% 22% 25%
Not at all stressful [1] 5% 6% 4% 4% 2% 4% 9% 4% 8% 5% 3% 5% 3% 7% 6% 7% -
Don't know 0% 0% 0% 0% 0% 1% - 0% 0% 0% 0% 1% - 0% - - -
Net: Stressful 64% 63% 67% 68% 66% 68% 58% 68% 58% 67% 66% 60% 64% 61% 52% 71% 75%
Net: Not Stressful 35% 37% 33% 32% 34% 31% 42% 32% 42% 33% 33% 39% 36% 38% 48% 29% 25%
Mean 2.76 2.75 2.79 2.82 2.82 2.83 2.65 2.81 2.67 2.80 2.81 2.72 2.74 2.72 2.62 2.81 2.96
Age Region
Total
Gender Social Grade
1 © 2013 YouGov plc. All Rights Reserved yougov.co.uk
YouGov / HR Media Survey Results
Sample size: 2011 UK adults that work either full or part
time
Fieldwork: 30th August - 3rd September 2013
In general, how happy or unhappy would you say you are
in your current job?
Unweighted base 2011
UK working adults aged 18+ 2011
Very happy [5] 19%
Fairly happy [4] 47%
Neither happy nor unhappy [3] 16%
Fairly unhappy [2] 14%
Very unhappy [1] 4%
Net: Happy 66%
Net: Unhappy 18%
Mean 3.62
In general, how stressful, if at all, do you find your current
job?
Unweighted base 2011
UK working adults aged 18+ 2011
Very stressful [4] 17%
Fairly stressful [3] 47%
Not very stressful [2] 30%
Not at all stressful [1] 5%
Don't know 0%
Net: Stressful 64%
Net: Not Stressful 35%
Mean 2.76
TotalMarried/ Civil
Partnership
Living as
married
Separated/
DivorcedWidowed
Never
Married0 1 2 3+
ALL WITH
CHILDREN IN
HOUSEHOLD
(NET)
Refused
1121 282 185 48 375 1494 245 209 43 497 20
1104 294 181 32 401 1495 256 199 45 500 16
20% 17% 20% 28% 14% 19% 18% 20% 27% 20% 15%
47% 48% 44% 55% 47% 46% 53% 50% 38% 51% 42%
16% 17% 14% 8% 16% 16% 12% 18% 15% 14% 5%
14% 11% 13% 9% 18% 15% 14% 10% 14% 12% 23%
3% 7% 9% - 4% 4% 3% 2% 6% 3% 15%
67% 66% 64% 83% 62% 64% 71% 70% 65% 70% 57%
17% 18% 22% 9% 22% 19% 17% 12% 20% 15% 38%
3.68 3.57 3.54 4.02 3.50 3.59 3.69 3.77 3.66 3.72 3.20
1121 282 185 48 375 1494 245 209 43 497 20
1104 294 181 32 401 1495 256 199 45 500 16
19% 12% 17% 8% 16% 16% 20% 15% 27% 19% 44%
46% 54% 51% 34% 45% 46% 52% 54% 37% 52% 35%
29% 31% 28% 57% 32% 32% 25% 27% 26% 26% 21%
6% 3% 4% 1% 6% 6% 3% 4% 9% 4% -
0% - - - 1% 0% - - - - -
65% 66% 67% 42% 61% 62% 72% 69% 65% 70% 79%
35% 34% 33% 58% 39% 38% 28% 31% 35% 30% 21%
2.79 2.75 2.80 2.49 2.70 2.73 2.89 2.81 2.83 2.85 3.23
Marital Status Children in Household
2 © 2013 YouGov plc. All Rights Reserved yougov.co.uk
YouGov / HR Media Survey Results
Sample size: 2011 UK adults that work either full or part
time
Fieldwork: 30th August - 3rd September 2013
In general, how happy or unhappy would you say you are
in your current job?
Unweighted base 2011
UK working adults aged 18+ 2011
Very happy [5] 19%
Fairly happy [4] 47%
Neither happy nor unhappy [3] 16%
Fairly unhappy [2] 14%
Very unhappy [1] 4%
Net: Happy 66%
Net: Unhappy 18%
Mean 3.62
In general, how stressful, if at all, do you find your current
job?
Unweighted base 2011
UK working adults aged 18+ 2011
Very stressful [4] 17%
Fairly stressful [3] 47%
Not very stressful [2] 30%
Not at all stressful [1] 5%
Don't know 0%
Net: Stressful 64%
Net: Not Stressful 35%
Mean 2.76
TotalNorth
East
North
West
Yorkshire
and the
Humber
East
Midlands
West
Midlands
East of
EnglandLondon
South
East
South
WestWales Scotland
Northern
Ireland
51 202 155 140 178 205 208 358 214 80 204 16
49 222 167 146 180 225 192 341 191 65 218 14
19% 20% 14% 16% 15% 20% 20% 19% 18% 24% 23% 17%
42% 43% 45% 54% 45% 48% 52% 46% 53% 44% 43% 32%
23% 17% 19% 18% 21% 19% 11% 12% 14% 17% 12% 30%
16% 15% 17% 7% 16% 12% 10% 20% 11% 9% 16% 21%
- 5% 5% 5% 3% 1% 6% 4% 4% 6% 6% -
61% 63% 59% 70% 60% 68% 72% 64% 71% 67% 67% 49%
16% 20% 21% 12% 19% 13% 16% 24% 15% 15% 22% 21%
3.63 3.59 3.47 3.70 3.54 3.73 3.70 3.55 3.70 3.69 3.62 3.45
51 202 155 140 178 205 208 358 214 80 204 16
49 222 167 146 180 225 192 341 191 65 218 14
8% 20% 18% 14% 19% 16% 14% 18% 16% 15% 17% 21%
54% 46% 50% 52% 47% 43% 50% 46% 40% 36% 54% 54%
37% 29% 25% 32% 29% 34% 33% 27% 39% 43% 22% 25%
1% 4% 7% 2% 4% 5% 3% 8% 6% 6% 7% -
- 0% - - 1% 1% - 1% - - - -
62% 66% 69% 66% 66% 60% 64% 64% 56% 52% 71% 75%
38% 33% 31% 34% 33% 39% 36% 35% 44% 48% 29% 25%
2.70 2.82 2.81 2.79 2.82 2.72 2.74 2.75 2.65 2.62 2.81 2.96
Government Region
3 © 2013 YouGov plc. All Rights Reserved yougov.co.uk
YouGov / HR Media Survey Results
Sample size: 2011 UK adults that work either full or part
time
Fieldwork: 30th August - 3rd September 2013
In general, how happy or unhappy would you say you are
in your current job?
Unweighted base 2011
UK working adults aged 18+ 2011
Very happy [5] 19%
Fairly happy [4] 47%
Neither happy nor unhappy [3] 16%
Fairly unhappy [2] 14%
Very unhappy [1] 4%
Net: Happy 66%
Net: Unhappy 18%
Mean 3.62
In general, how stressful, if at all, do you find your current
job?
Unweighted base 2011
UK working adults aged 18+ 2011
Very stressful [4] 17%
Fairly stressful [3] 47%
Not very stressful [2] 30%
Not at all stressful [1] 5%
Don't know 0%
Net: Stressful 64%
Net: Not Stressful 35%
Mean 2.76
Total
Facebook LinkedIn Google+ TwitterFull
Time
Part
Time
Working
full time
Working
part time
1216 440 106 481 379 123 1548 463
1218 445 111 484 450 45 1830 181
18% 20% 23% 16% 20% 15% 18% 23%
48% 50% 41% 48% 50% 51% 47% 49%
16% 13% 21% 16% 15% 14% 16% 14%
14% 13% 11% 17% 12% 15% 15% 11%
4% 4% 4% 3% 3% 5% 4% 3%
66% 70% 64% 64% 70% 66% 65% 72%
18% 17% 15% 20% 15% 20% 19% 13%
3.62 3.69 3.68 3.57 3.72 3.57 3.60 3.79
1216 440 106 481 379 123 1548 463
1218 445 111 484 450 45 1830 181
17% 18% 25% 19% 20% 6% 18% 5%
47% 52% 48% 48% 54% 44% 48% 39%
31% 26% 22% 30% 24% 43% 29% 45%
5% 3% 5% 3% 2% 6% 5% 10%
0% 1% - - - - 0% -
64% 71% 73% 68% 74% 50% 66% 44%
36% 29% 27% 32% 26% 50% 34% 56%
2.76 2.87 2.93 2.84 2.92 2.50 2.80 2.40
Working
parentsSocial Media (monthly or more) Full / part time
4 © 2013 YouGov plc. All Rights Reserved yougov.co.uk
YouGov / HR Media Survey Results
Sample size: 2011 UK adults that work either full or part
time
Fieldwork: 30th August - 3rd September 2013
In general, how happy or unhappy would you say you are
in your current job?
Unweighted base 2011
UK working adults aged 18+ 2011
Very happy [5] 19%
Fairly happy [4] 47%
Neither happy nor unhappy [3] 16%
Fairly unhappy [2] 14%
Very unhappy [1] 4%
Net: Happy 66%
Net: Unhappy 18%
Mean 3.62
In general, how stressful, if at all, do you find your current
job?
Unweighted base 2011
UK working adults aged 18+ 2011
Very stressful [4] 17%
Fairly stressful [3] 47%
Not very stressful [2] 30%
Not at all stressful [1] 5%
Don't know 0%
Net: Stressful 64%
Net: Not Stressful 35%
Mean 2.76
Total
EmployeeSelf
Employed
Full time
Employee
Full Time
self
employed
Part Time
Employee
Part Time
Self
Employed
1 year
or less
More than 1
year, up to 2
years
More than 2
years, up to 3
years
More than 3
years, up to 4
years
More than 4
years, up to 5
years
6 years or
more
1743 268 1373 175 370 93 145 133 106 99 160 1100
1767 244 1620 210 147 34 149 137 120 108 160 1094
17% 36% 16% 36% 21% 31% 23% 15% 24% 12% 12% 16%
47% 50% 46% 50% 50% 45% 41% 55% 44% 47% 54% 45%
17% 11% 17% 10% 14% 18% 19% 12% 17% 15% 13% 17%
16% 3% 16% 3% 12% 4% 12% 12% 12% 23% 17% 16%
5% 0% 5% 0% 3% 2% 4% 7% 2% 4% 5% 5%
63% 85% 62% 87% 71% 76% 64% 70% 68% 58% 65% 62%
20% 4% 21% 4% 15% 6% 16% 18% 15% 27% 22% 21%
3.54 4.17 3.53 4.19 3.74 3.99 3.66 3.60 3.75 3.39 3.50 3.52
1743 268 1373 175 370 93 145 133 106 99 160 1100
1767 244 1620 210 147 34 149 137 120 108 160 1094
17% 16% 18% 18% 6% 3% 14% 20% 21% 19% 18% 16%
49% 37% 49% 39% 42% 27% 48% 45% 40% 45% 48% 51%
29% 38% 28% 35% 42% 59% 34% 31% 34% 31% 24% 28%
5% 8% 4% 7% 10% 11% 3% 5% 5% 5% 9% 4%
0% 1% 0% 1% - - 0% - - - 1% 0%
66% 53% 67% 57% 48% 30% 62% 64% 61% 64% 66% 67%
34% 46% 32% 42% 52% 70% 38% 36% 39% 36% 34% 33%
2.78 2.62 2.81 2.69 2.44 2.21 2.72 2.79 2.77 2.78 2.74 2.80
Length of employmentWorking status
5 © 2013 YouGov plc. All Rights Reserved yougov.co.uk
YouGov / HR Media Survey Results
Sample size: 2011 UK adults that work either full or part
time
Fieldwork: 30th August - 3rd September 2013
In general, how happy or unhappy would you say you are
in your current job?
Unweighted base 2011
UK working adults aged 18+ 2011
Very happy [5] 19%
Fairly happy [4] 47%
Neither happy nor unhappy [3] 16%
Fairly unhappy [2] 14%
Very unhappy [1] 4%
Net: Happy 66%
Net: Unhappy 18%
Mean 3.62
In general, how stressful, if at all, do you find your current
job?
Unweighted base 2011
UK working adults aged 18+ 2011
Very stressful [4] 17%
Fairly stressful [3] 47%
Not very stressful [2] 30%
Not at all stressful [1] 5%
Don't know 0%
Net: Stressful 64%
Net: Not Stressful 35%
Mean 2.76
TotalHigh
Level
MId
Level
Low
/Entry
Level
Other
Private
sector firm
or
company
Nationalised
industry or
public
corporation
Other
public
sector
employer
Charity/
voluntary
sector
422 708 386 495 1464 22 421 104
419 772 331 489 1467 26 381 138
32% 18% 12% 13% 19% 43% 17% 22%
46% 48% 52% 43% 46% 46% 47% 54%
12% 15% 12% 22% 17% 8% 14% 9%
8% 14% 18% 17% 14% 2% 17% 12%
1% 5% 6% 4% 4% - 6% 3%
79% 66% 64% 56% 65% 90% 64% 76%
9% 19% 24% 22% 18% 2% 23% 15%
4.00 3.60 3.46 3.43 3.62 4.31 3.52 3.81
422 708 386 495 1464 22 421 104
419 772 331 489 1467 26 381 138
21% 22% 10% 10% 17% 14% 20% 11%
43% 52% 45% 45% 46% 70% 52% 46%
30% 23% 39% 37% 31% 16% 25% 36%
5% 4% 6% 7% 5% - 4% 7%
1% - - 1% 0% - - -
64% 74% 55% 56% 63% 84% 71% 57%
36% 26% 45% 44% 37% 16% 29% 43%
2.80 2.92 2.60 2.60 2.74 2.98 2.87 2.61
Level of responsibility Employment sector
6 © 2013 YouGov plc. All Rights Reserved yougov.co.uk
Fieldwork: 30th August - 3rd September 2013
Male Female 18-34 35-44 45-54 55+ ABC1 C2DE North Midlands East London South Wales ScotlandNorthern
Ireland
Age Region
Total
Gender Social Grade
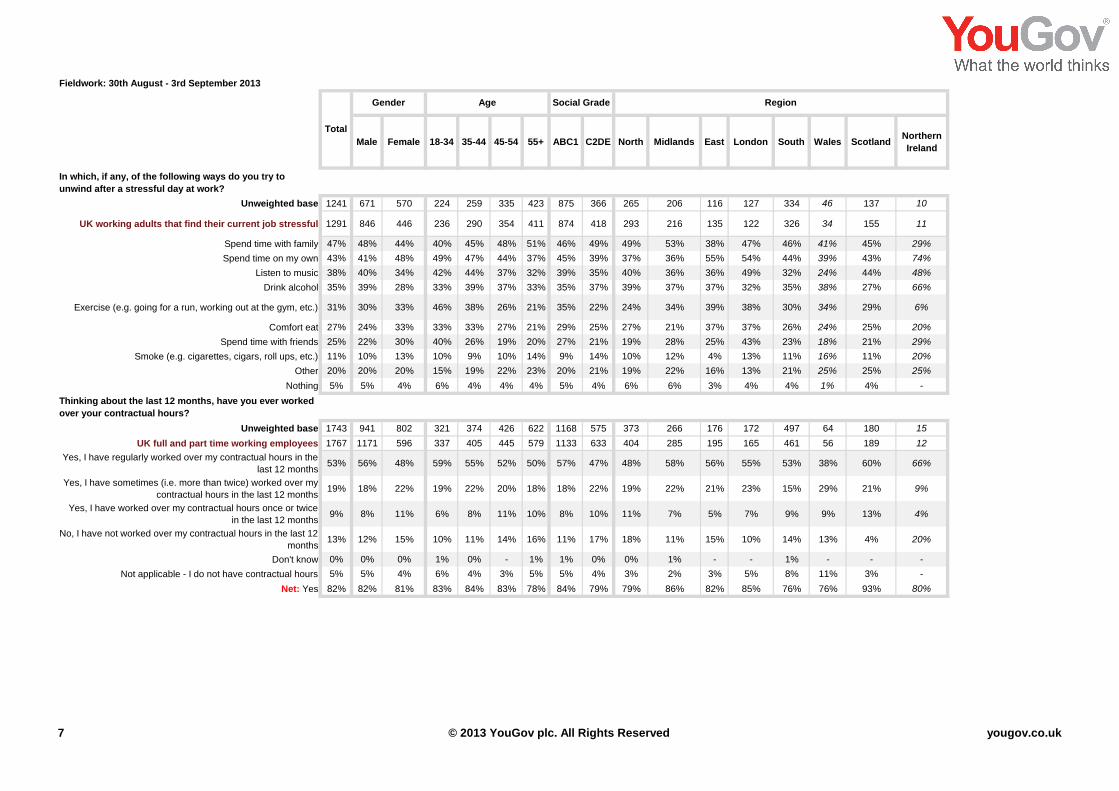
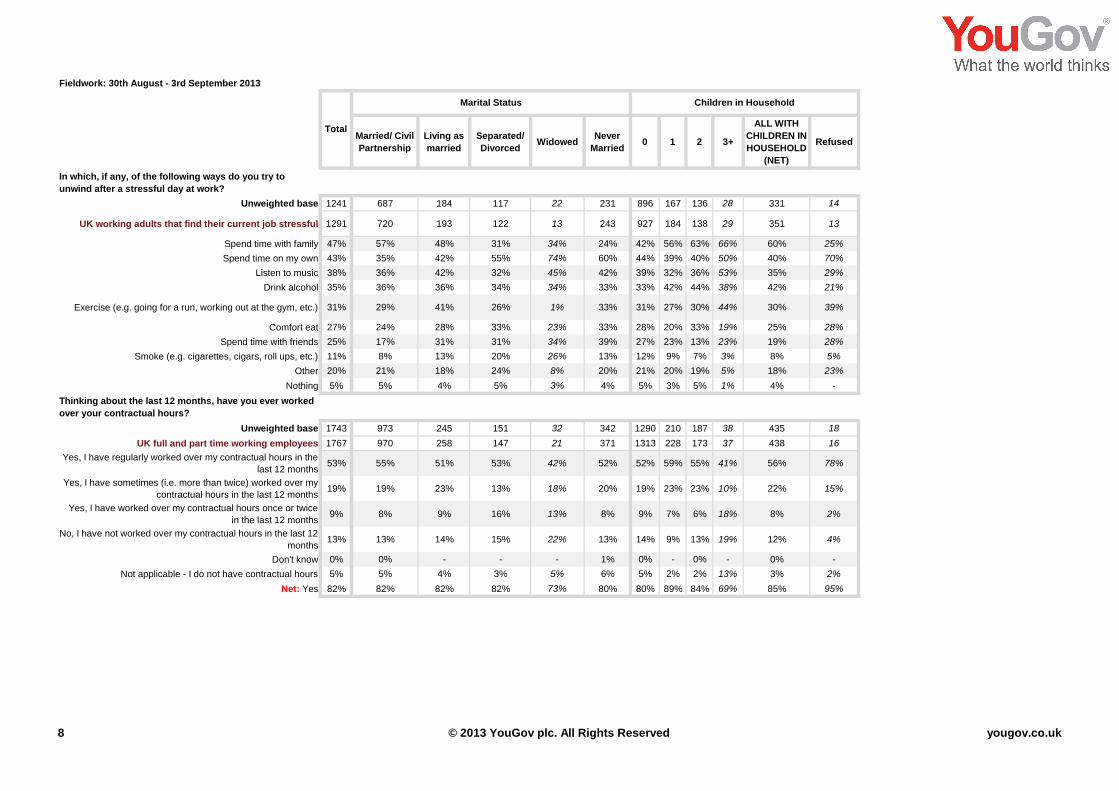
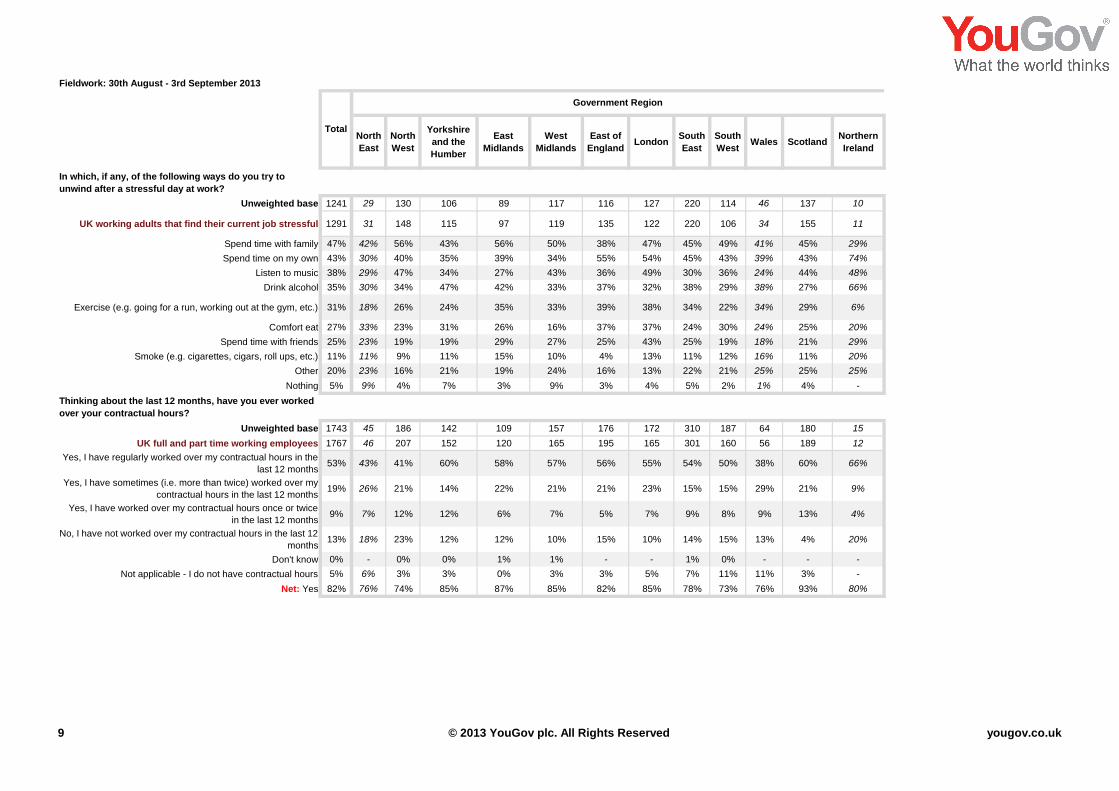
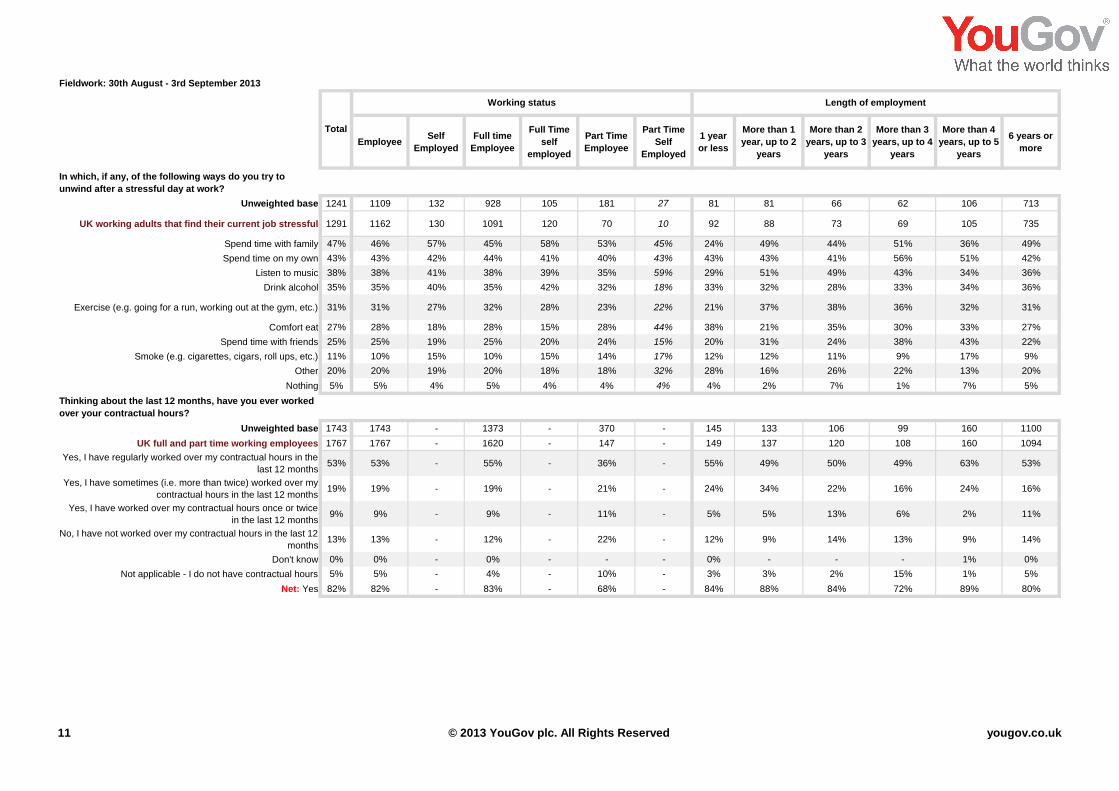
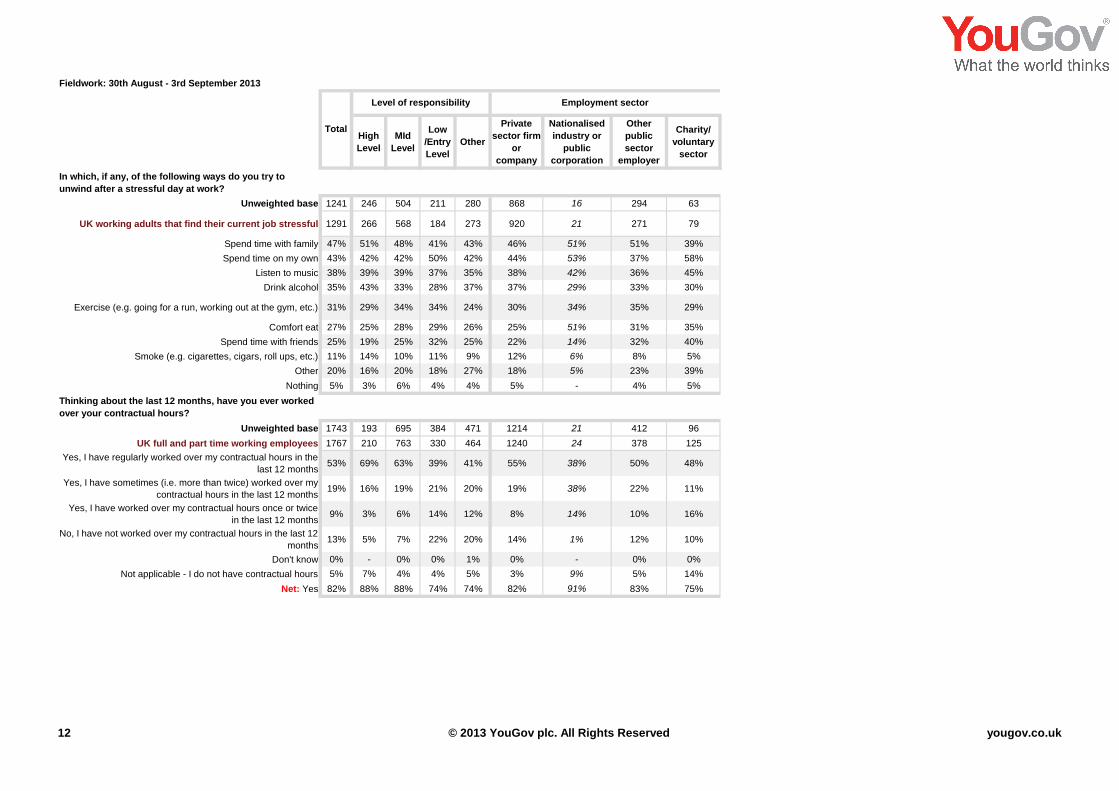
In which, if any, of the following ways do you try to
unwind after a stressful day at work?
Unweighted base 1241 671 570 224 259 335 423 875 366 265 206 116 127 334 46 137 10
UK working adults that find their current job stressful 1291 846 446 236 290 354 411 874 418 293 216 135 122 326 34 155 11
Spend time with family 47% 48% 44% 40% 45% 48% 51% 46% 49% 49% 53% 38% 47% 46% 41% 45% 29%
Spend time on my own 43% 41% 48% 49% 47% 44% 37% 45% 39% 37% 36% 55% 54% 44% 39% 43% 74%
Listen to music 38% 40% 34% 42% 44% 37% 32% 39% 35% 40% 36% 36% 49% 32% 24% 44% 48%
Drink alcohol 35% 39% 28% 33% 39% 37% 33% 35% 37% 39% 37% 37% 32% 35% 38% 27% 66%
Exercise (e.g. going for a run, working out at the gym, etc.) 31% 30% 33% 46% 38% 26% 21% 35% 22% 24% 34% 39% 38% 30% 34% 29% 6%
Comfort eat 27% 24% 33% 33% 33% 27% 21% 29% 25% 27% 21% 37% 37% 26% 24% 25% 20%
Spend time with friends 25% 22% 30% 40% 26% 19% 20% 27% 21% 19% 28% 25% 43% 23% 18% 21% 29%
Smoke (e.g. cigarettes, cigars, roll ups, etc.) 11% 10% 13% 10% 9% 10% 14% 9% 14% 10% 12% 4% 13% 11% 16% 11% 20%
Other 20% 20% 20% 15% 19% 22% 23% 20% 21% 19% 22% 16% 13% 21% 25% 25% 25%
Nothing 5% 5% 4% 6% 4% 4% 4% 5% 4% 6% 6% 3% 4% 4% 1% 4% -
Thinking about the last 12 months, have you ever worked
over your contractual hours?
Unweighted base 1743 941 802 321 374 426 622 1168 575 373 266 176 172 497 64 180 15
UK full and part time working employees 1767 1171 596 337 405 445 579 1133 633 404 285 195 165 461 56 189 12
Yes, I have regularly worked over my contractual hours in the
last 12 months53% 56% 48% 59% 55% 52% 50% 57% 47% 48% 58% 56% 55% 53% 38% 60% 66%
Yes, I have sometimes (i.e. more than twice) worked over my
contractual hours in the last 12 months19% 18% 22% 19% 22% 20% 18% 18% 22% 19% 22% 21% 23% 15% 29% 21% 9%
Yes, I have worked over my contractual hours once or twice
in the last 12 months9% 8% 11% 6% 8% 11% 10% 8% 10% 11% 7% 5% 7% 9% 9% 13% 4%
No, I have not worked over my contractual hours in the last 12
months13% 12% 15% 10% 11% 14% 16% 11% 17% 18% 11% 15% 10% 14% 13% 4% 20%
Don't know 0% 0% 0% 1% 0% - 1% 1% 0% 0% 1% - - 1% - - -
Not applicable - I do not have contractual hours 5% 5% 4% 6% 4% 3% 5% 5% 4% 3% 2% 3% 5% 8% 11% 3% -
Net: Yes 82% 82% 81% 83% 84% 83% 78% 84% 79% 79% 86% 82% 85% 76% 76% 93% 80%
7 © 2013 YouGov plc. All Rights Reserved yougov.co.uk
Fieldwork: 30th August - 3rd September 2013
In general, how happy or unhappy would you say you are
in your current job?
Total
In which, if any, of the following ways do you try to
unwind after a stressful day at work?
Unweighted base 1241
UK working adults that find their current job stressful 1291
Spend time with family 47%
Spend time on my own 43%
Listen to music 38%
Drink alcohol 35%
Exercise (e.g. going for a run, working out at the gym, etc.) 31%
Comfort eat 27%
Spend time with friends 25%
Smoke (e.g. cigarettes, cigars, roll ups, etc.) 11%
Other 20%
Nothing 5%
Thinking about the last 12 months, have you ever worked
over your contractual hours?
Unweighted base 1743
UK full and part time working employees 1767
Yes, I have regularly worked over my contractual hours in the
last 12 months53%
Yes, I have sometimes (i.e. more than twice) worked over my
contractual hours in the last 12 months19%
Yes, I have worked over my contractual hours once or twice
in the last 12 months9%
No, I have not worked over my contractual hours in the last 12
months13%
Don't know 0%
Not applicable - I do not have contractual hours 5%
Net: Yes 82%
Married/ Civil
Partnership
Living as
married
Separated/
DivorcedWidowed
Never
Married0 1 2 3+
ALL WITH
CHILDREN IN
HOUSEHOLD
(NET)
Refused
Marital Status Children in Household
687 184 117 22 231 896 167 136 28 331 14
720 193 122 13 243 927 184 138 29 351 13
57% 48% 31% 34% 24% 42% 56% 63% 66% 60% 25%
35% 42% 55% 74% 60% 44% 39% 40% 50% 40% 70%
36% 42% 32% 45% 42% 39% 32% 36% 53% 35% 29%
36% 36% 34% 34% 33% 33% 42% 44% 38% 42% 21%
29% 41% 26% 1% 33% 31% 27% 30% 44% 30% 39%
24% 28% 33% 23% 33% 28% 20% 33% 19% 25% 28%
17% 31% 31% 34% 39% 27% 23% 13% 23% 19% 28%
8% 13% 20% 26% 13% 12% 9% 7% 3% 8% 5%
21% 18% 24% 8% 20% 21% 20% 19% 5% 18% 23%
5% 4% 5% 3% 4% 5% 3% 5% 1% 4% -
973 245 151 32 342 1290 210 187 38 435 18
970 258 147 21 371 1313 228 173 37 438 16
55% 51% 53% 42% 52% 52% 59% 55% 41% 56% 78%
19% 23% 13% 18% 20% 19% 23% 23% 10% 22% 15%
8% 9% 16% 13% 8% 9% 7% 6% 18% 8% 2%
13% 14% 15% 22% 13% 14% 9% 13% 19% 12% 4%
0% - - - 1% 0% - 0% - 0% -
5% 4% 3% 5% 6% 5% 2% 2% 13% 3% 2%
82% 82% 82% 73% 80% 80% 89% 84% 69% 85% 95%
8 © 2013 YouGov plc. All Rights Reserved yougov.co.uk
Fieldwork: 30th August - 3rd September 2013
In general, how happy or unhappy would you say you are
in your current job?
Total
In which, if any, of the following ways do you try to
unwind after a stressful day at work?
Unweighted base 1241
UK working adults that find their current job stressful 1291
Spend time with family 47%
Spend time on my own 43%
Listen to music 38%
Drink alcohol 35%
Exercise (e.g. going for a run, working out at the gym, etc.) 31%
Comfort eat 27%
Spend time with friends 25%
Smoke (e.g. cigarettes, cigars, roll ups, etc.) 11%
Other 20%
Nothing 5%
Thinking about the last 12 months, have you ever worked
over your contractual hours?
Unweighted base 1743
UK full and part time working employees 1767
Yes, I have regularly worked over my contractual hours in the
last 12 months53%
Yes, I have sometimes (i.e. more than twice) worked over my
contractual hours in the last 12 months19%
Yes, I have worked over my contractual hours once or twice
in the last 12 months9%
No, I have not worked over my contractual hours in the last 12
months13%
Don't know 0%
Not applicable - I do not have contractual hours 5%
Net: Yes 82%
North
East
North
West
Yorkshire
and the
Humber
East
Midlands
West
Midlands
East of
EnglandLondon
South
East
South
WestWales Scotland
Northern
Ireland
Government Region
29 130 106 89 117 116 127 220 114 46 137 10
31 148 115 97 119 135 122 220 106 34 155 11
42% 56% 43% 56% 50% 38% 47% 45% 49% 41% 45% 29%
30% 40% 35% 39% 34% 55% 54% 45% 43% 39% 43% 74%
29% 47% 34% 27% 43% 36% 49% 30% 36% 24% 44% 48%
30% 34% 47% 42% 33% 37% 32% 38% 29% 38% 27% 66%
18% 26% 24% 35% 33% 39% 38% 34% 22% 34% 29% 6%
33% 23% 31% 26% 16% 37% 37% 24% 30% 24% 25% 20%
23% 19% 19% 29% 27% 25% 43% 25% 19% 18% 21% 29%
11% 9% 11% 15% 10% 4% 13% 11% 12% 16% 11% 20%
23% 16% 21% 19% 24% 16% 13% 22% 21% 25% 25% 25%
9% 4% 7% 3% 9% 3% 4% 5% 2% 1% 4% -
45 186 142 109 157 176 172 310 187 64 180 15
46 207 152 120 165 195 165 301 160 56 189 12
43% 41% 60% 58% 57% 56% 55% 54% 50% 38% 60% 66%
26% 21% 14% 22% 21% 21% 23% 15% 15% 29% 21% 9%
7% 12% 12% 6% 7% 5% 7% 9% 8% 9% 13% 4%
18% 23% 12% 12% 10% 15% 10% 14% 15% 13% 4% 20%
- 0% 0% 1% 1% - - 1% 0% - - -
6% 3% 3% 0% 3% 3% 5% 7% 11% 11% 3% -
76% 74% 85% 87% 85% 82% 85% 78% 73% 76% 93% 80%
9 © 2013 YouGov plc. All Rights Reserved yougov.co.uk

Fieldwork: 30th August - 3rd September 2013
In general, how happy or unhappy would you say you are
in your current job?
Total
In which, if any, of the following ways do you try to
unwind after a stressful day at work?
Unweighted base 1241
UK working adults that find their current job stressful 1291
Spend time with family 47%
Spend time on my own 43%
Listen to music 38%
Drink alcohol 35%
Exercise (e.g. going for a run, working out at the gym, etc.) 31%
Comfort eat 27%
Spend time with friends 25%
Smoke (e.g. cigarettes, cigars, roll ups, etc.) 11%
Other 20%
Nothing 5%
Thinking about the last 12 months, have you ever worked
over your contractual hours?
Unweighted base 1743
UK full and part time working employees 1767
Yes, I have regularly worked over my contractual hours in the
last 12 months53%
Yes, I have sometimes (i.e. more than twice) worked over my
contractual hours in the last 12 months19%
Yes, I have worked over my contractual hours once or twice
in the last 12 months9%
No, I have not worked over my contractual hours in the last 12
months13%
Don't know 0%
Not applicable - I do not have contractual hours 5%
Net: Yes 82%
Facebook LinkedIn Google+ TwitterFull
Time
Part
Time
Working
full time
Working
part time
Working
parentsSocial Media (monthly or more) Full / part time
743 306 70 306 279 60 1033 208
778 315 81 327 333 22 1211 80
46% 48% 49% 46% 56% 78% 46% 52%
48% 50% 42% 49% 41% 38% 43% 40%
40% 50% 47% 48% 36% 33% 38% 38%
37% 38% 36% 40% 45% 41% 36% 30%
32% 38% 21% 38% 31% 28% 31% 23%
31% 29% 33% 34% 25% 24% 27% 30%
28% 28% 26% 27% 19% 25% 25% 23%
11% 7% 10% 9% 6% 17% 11% 14%
21% 22% 34% 20% 19% 20% 20% 19%
4% 4% 1% 4% 5% 2% 5% 4%
1076 357 83 421 335 107 1373 370
1093 380 86 440 397 40 1620 147
54% 66% 47% 55% 58% 37% 55% 36%
21% 20% 19% 22% 22% 28% 19% 21%
9% 2% 10% 7% 7% 8% 9% 11%
11% 6% 13% 11% 10% 22% 12% 22%
1% 1% 3% 0% 0% - 0% -
5% 5% 7% 4% 3% 5% 4% 10%
84% 88% 76% 84% 87% 73% 83% 68%
10 © 2013 YouGov plc. All Rights Reserved yougov.co.uk
Fieldwork: 30th August - 3rd September 2013
In general, how happy or unhappy would you say you are
in your current job?
Total
In which, if any, of the following ways do you try to
unwind after a stressful day at work?
Unweighted base 1241
UK working adults that find their current job stressful 1291
Spend time with family 47%
Spend time on my own 43%
Listen to music 38%
Drink alcohol 35%
Exercise (e.g. going for a run, working out at the gym, etc.) 31%
Comfort eat 27%
Spend time with friends 25%
Smoke (e.g. cigarettes, cigars, roll ups, etc.) 11%
Other 20%
Nothing 5%
Thinking about the last 12 months, have you ever worked
over your contractual hours?
Unweighted base 1743
UK full and part time working employees 1767
Yes, I have regularly worked over my contractual hours in the
last 12 months53%
Yes, I have sometimes (i.e. more than twice) worked over my
contractual hours in the last 12 months19%
Yes, I have worked over my contractual hours once or twice
in the last 12 months9%
No, I have not worked over my contractual hours in the last 12
months13%
Don't know 0%
Not applicable - I do not have contractual hours 5%
Net: Yes 82%
EmployeeSelf
Employed
Full time
Employee
Full Time
self
employed
Part Time
Employee
Part Time
Self
Employed
1 year
or less
More than 1
year, up to 2
years
More than 2
years, up to 3
years
More than 3
years, up to 4
years
More than 4
years, up to 5
years
6 years or
more
Length of employmentWorking status
1109 132 928 105 181 27 81 81 66 62 106 713
1162 130 1091 120 70 10 92 88 73 69 105 735
46% 57% 45% 58% 53% 45% 24% 49% 44% 51% 36% 49%
43% 42% 44% 41% 40% 43% 43% 43% 41% 56% 51% 42%
38% 41% 38% 39% 35% 59% 29% 51% 49% 43% 34% 36%
35% 40% 35% 42% 32% 18% 33% 32% 28% 33% 34% 36%
31% 27% 32% 28% 23% 22% 21% 37% 38% 36% 32% 31%
28% 18% 28% 15% 28% 44% 38% 21% 35% 30% 33% 27%
25% 19% 25% 20% 24% 15% 20% 31% 24% 38% 43% 22%
10% 15% 10% 15% 14% 17% 12% 12% 11% 9% 17% 9%
20% 19% 20% 18% 18% 32% 28% 16% 26% 22% 13% 20%
5% 4% 5% 4% 4% 4% 4% 2% 7% 1% 7% 5%
1743 - 1373 - 370 - 145 133 106 99 160 1100
1767 - 1620 - 147 - 149 137 120 108 160 1094
53% - 55% - 36% - 55% 49% 50% 49% 63% 53%
19% - 19% - 21% - 24% 34% 22% 16% 24% 16%
9% - 9% - 11% - 5% 5% 13% 6% 2% 11%
13% - 12% - 22% - 12% 9% 14% 13% 9% 14%
0% - 0% - - - 0% - - - 1% 0%
5% - 4% - 10% - 3% 3% 2% 15% 1% 5%
82% - 83% - 68% - 84% 88% 84% 72% 89% 80%
11 © 2013 YouGov plc. All Rights Reserved yougov.co.uk
Fieldwork: 30th August - 3rd September 2013
In general, how happy or unhappy would you say you are
in your current job?
Total
In which, if any, of the following ways do you try to
unwind after a stressful day at work?
Unweighted base 1241
UK working adults that find their current job stressful 1291
Spend time with family 47%
Spend time on my own 43%
Listen to music 38%
Drink alcohol 35%
Exercise (e.g. going for a run, working out at the gym, etc.) 31%
Comfort eat 27%
Spend time with friends 25%
Smoke (e.g. cigarettes, cigars, roll ups, etc.) 11%
Other 20%
Nothing 5%
Thinking about the last 12 months, have you ever worked
over your contractual hours?
Unweighted base 1743
UK full and part time working employees 1767
Yes, I have regularly worked over my contractual hours in the
last 12 months53%
Yes, I have sometimes (i.e. more than twice) worked over my
contractual hours in the last 12 months19%
Yes, I have worked over my contractual hours once or twice
in the last 12 months9%
No, I have not worked over my contractual hours in the last 12
months13%
Don't know 0%
Not applicable - I do not have contractual hours 5%
Net: Yes 82%
High
Level
MId
Level
Low
/Entry
Level
Other
Private
sector firm
or
company
Nationalised
industry or
public
corporation
Other
public
sector
employer
Charity/
voluntary
sector
Level of responsibility Employment sector
246 504 211 280 868 16 294 63
266 568 184 273 920 21 271 79
51% 48% 41% 43% 46% 51% 51% 39%
42% 42% 50% 42% 44% 53% 37% 58%
39% 39% 37% 35% 38% 42% 36% 45%
43% 33% 28% 37% 37% 29% 33% 30%
29% 34% 34% 24% 30% 34% 35% 29%
25% 28% 29% 26% 25% 51% 31% 35%
19% 25% 32% 25% 22% 14% 32% 40%
14% 10% 11% 9% 12% 6% 8% 5%
16% 20% 18% 27% 18% 5% 23% 39%
3% 6% 4% 4% 5% - 4% 5%
193 695 384 471 1214 21 412 96
210 763 330 464 1240 24 378 125
69% 63% 39% 41% 55% 38% 50% 48%
16% 19% 21% 20% 19% 38% 22% 11%
3% 6% 14% 12% 8% 14% 10% 16%
5% 7% 22% 20% 14% 1% 12% 10%
- 0% 0% 1% 0% - 0% 0%
7% 4% 4% 5% 3% 9% 5% 14%
88% 88% 74% 74% 82% 91% 83% 75%
12 © 2013 YouGov plc. All Rights Reserved yougov.co.uk
Fieldwork: 30th August - 3rd September 2013
Male Female 18-34 35-44 45-54 55+ ABC1 C2DE North Midlands East London South Wales ScotlandNorthern
Ireland
Age Region
Total
Gender Social Grade
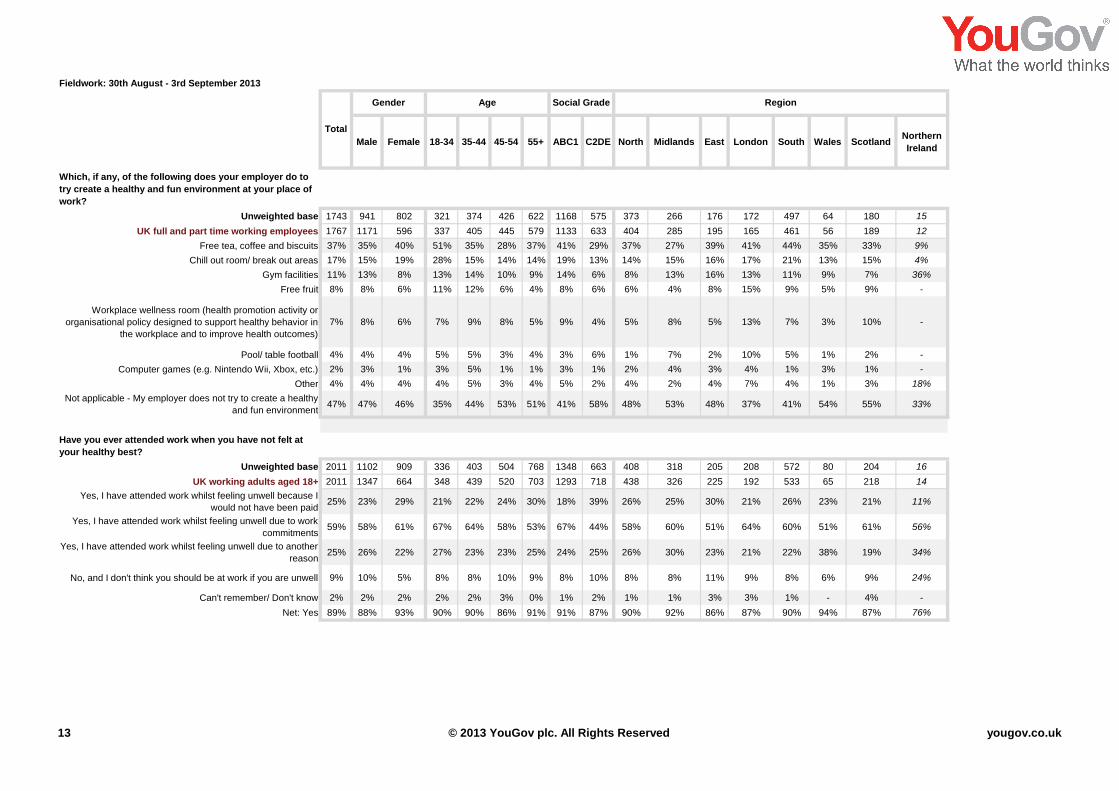
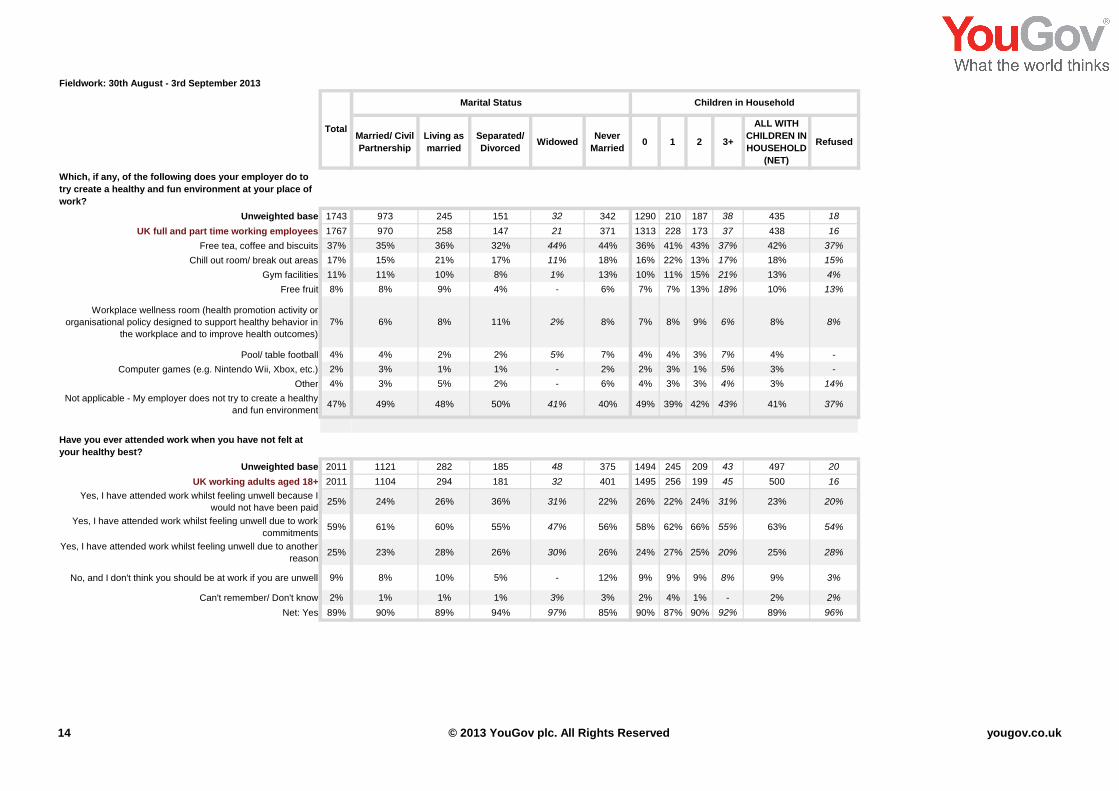
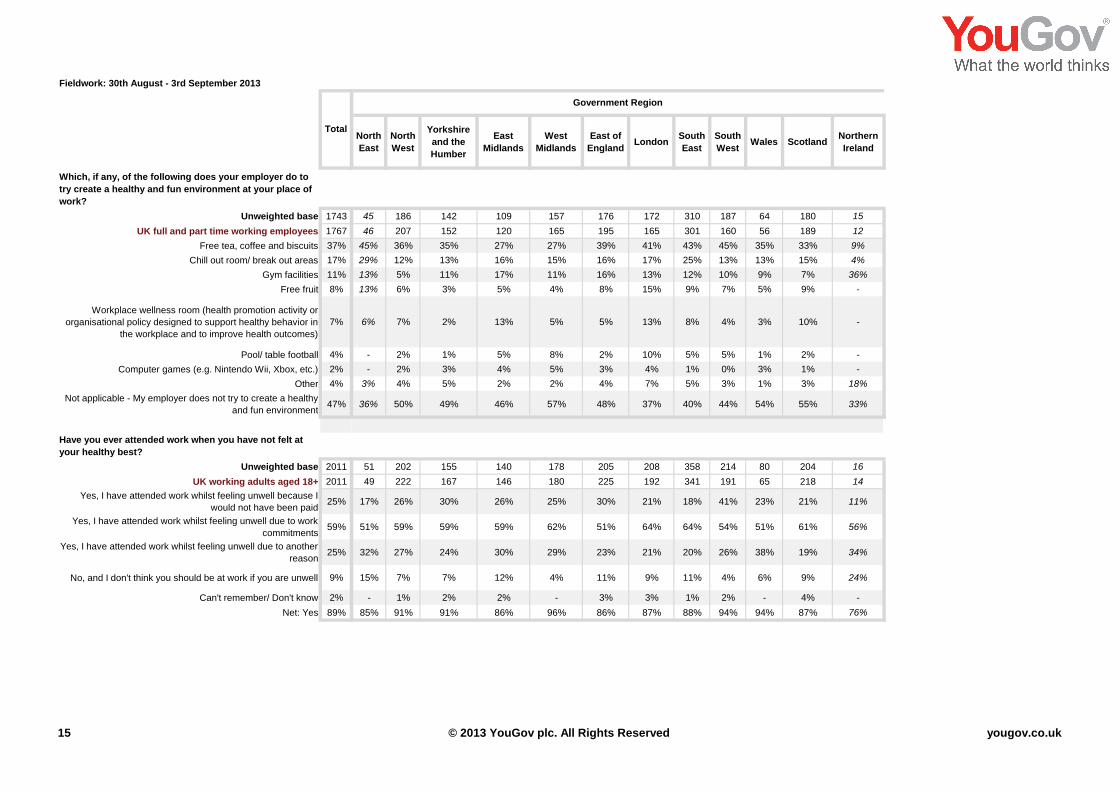
Which, if any, of the following does your employer do to
try create a healthy and fun environment at your place of
work?
Unweighted base 1743 941 802 321 374 426 622 1168 575 373 266 176 172 497 64 180 15
UK full and part time working employees 1767 1171 596 337 405 445 579 1133 633 404 285 195 165 461 56 189 12
Free tea, coffee and biscuits 37% 35% 40% 51% 35% 28% 37% 41% 29% 37% 27% 39% 41% 44% 35% 33% 9%
Chill out room/ break out areas 17% 15% 19% 28% 15% 14% 14% 19% 13% 14% 15% 16% 17% 21% 13% 15% 4%
Gym facilities 11% 13% 8% 13% 14% 10% 9% 14% 6% 8% 13% 16% 13% 11% 9% 7% 36%
Free fruit 8% 8% 6% 11% 12% 6% 4% 8% 6% 6% 4% 8% 15% 9% 5% 9% -
Workplace wellness room (health promotion activity or
organisational policy designed to support healthy behavior in
the workplace and to improve health outcomes)
7% 8% 6% 7% 9% 8% 5% 9% 4% 5% 8% 5% 13% 7% 3% 10% -
Pool/ table football 4% 4% 4% 5% 5% 3% 4% 3% 6% 1% 7% 2% 10% 5% 1% 2% -
Computer games (e.g. Nintendo Wii, Xbox, etc.) 2% 3% 1% 3% 5% 1% 1% 3% 1% 2% 4% 3% 4% 1% 3% 1% -
Other 4% 4% 4% 4% 5% 3% 4% 5% 2% 4% 2% 4% 7% 4% 1% 3% 18%
Not applicable - My employer does not try to create a healthy
and fun environment47% 47% 46% 35% 44% 53% 51% 41% 58% 48% 53% 48% 37% 41% 54% 55% 33%
Have you ever attended work when you have not felt at
your healthy best?
Unweighted base 2011 1102 909 336 403 504 768 1348 663 408 318 205 208 572 80 204 16
UK working adults aged 18+ 2011 1347 664 348 439 520 703 1293 718 438 326 225 192 533 65 218 14
Yes, I have attended work whilst feeling unwell because I
would not have been paid25% 23% 29% 21% 22% 24% 30% 18% 39% 26% 25% 30% 21% 26% 23% 21% 11%
Yes, I have attended work whilst feeling unwell due to work
commitments59% 58% 61% 67% 64% 58% 53% 67% 44% 58% 60% 51% 64% 60% 51% 61% 56%
Yes, I have attended work whilst feeling unwell due to another
reason25% 26% 22% 27% 23% 23% 25% 24% 25% 26% 30% 23% 21% 22% 38% 19% 34%
No, and I don't think you should be at work if you are unwell 9% 10% 5% 8% 8% 10% 9% 8% 10% 8% 8% 11% 9% 8% 6% 9% 24%
Can't remember/ Don't know 2% 2% 2% 2% 2% 3% 0% 1% 2% 1% 1% 3% 3% 1% - 4% -
Net: Yes 89% 88% 93% 90% 90% 86% 91% 91% 87% 90% 92% 86% 87% 90% 94% 87% 76%
13 © 2013 YouGov plc. All Rights Reserved yougov.co.uk
Fieldwork: 30th August - 3rd September 2013
In general, how happy or unhappy would you say you are
in your current job?
Total
Which, if any, of the following does your employer do to
try create a healthy and fun environment at your place of
work?
Unweighted base 1743
UK full and part time working employees 1767
Free tea, coffee and biscuits 37%
Chill out room/ break out areas 17%
Gym facilities 11%
Free fruit 8%
Workplace wellness room (health promotion activity or
organisational policy designed to support healthy behavior in
the workplace and to improve health outcomes)
7%
Pool/ table football 4%
Computer games (e.g. Nintendo Wii, Xbox, etc.) 2%
Other 4%
Not applicable - My employer does not try to create a healthy
and fun environment47%
Have you ever attended work when you have not felt at
your healthy best?
Unweighted base 2011
UK working adults aged 18+ 2011
Yes, I have attended work whilst feeling unwell because I
would not have been paid25%
Yes, I have attended work whilst feeling unwell due to work
commitments59%
Yes, I have attended work whilst feeling unwell due to another
reason25%
No, and I don't think you should be at work if you are unwell 9%
Can't remember/ Don't know 2%
Net: Yes 89%
Married/ Civil
Partnership
Living as
married
Separated/
DivorcedWidowed
Never
Married0 1 2 3+
ALL WITH
CHILDREN IN
HOUSEHOLD
(NET)
Refused
Marital Status Children in Household
973 245 151 32 342 1290 210 187 38 435 18
970 258 147 21 371 1313 228 173 37 438 16
35% 36% 32% 44% 44% 36% 41% 43% 37% 42% 37%
15% 21% 17% 11% 18% 16% 22% 13% 17% 18% 15%
11% 10% 8% 1% 13% 10% 11% 15% 21% 13% 4%
8% 9% 4% - 6% 7% 7% 13% 18% 10% 13%
6% 8% 11% 2% 8% 7% 8% 9% 6% 8% 8%
4% 2% 2% 5% 7% 4% 4% 3% 7% 4% -
3% 1% 1% - 2% 2% 3% 1% 5% 3% -
3% 5% 2% - 6% 4% 3% 3% 4% 3% 14%
49% 48% 50% 41% 40% 49% 39% 42% 43% 41% 37%
1121 282 185 48 375 1494 245 209 43 497 20
1104 294 181 32 401 1495 256 199 45 500 16
24% 26% 36% 31% 22% 26% 22% 24% 31% 23% 20%
61% 60% 55% 47% 56% 58% 62% 66% 55% 63% 54%
23% 28% 26% 30% 26% 24% 27% 25% 20% 25% 28%
8% 10% 5% - 12% 9% 9% 9% 8% 9% 3%
1% 1% 1% 3% 3% 2% 4% 1% - 2% 2%
90% 89% 94% 97% 85% 90% 87% 90% 92% 89% 96%
14 © 2013 YouGov plc. All Rights Reserved yougov.co.uk
Fieldwork: 30th August - 3rd September 2013
In general, how happy or unhappy would you say you are
in your current job?
Total
Which, if any, of the following does your employer do to
try create a healthy and fun environment at your place of
work?
Unweighted base 1743
UK full and part time working employees 1767
Free tea, coffee and biscuits 37%
Chill out room/ break out areas 17%
Gym facilities 11%
Free fruit 8%
Workplace wellness room (health promotion activity or
organisational policy designed to support healthy behavior in
the workplace and to improve health outcomes)
7%
Pool/ table football 4%
Computer games (e.g. Nintendo Wii, Xbox, etc.) 2%
Other 4%
Not applicable - My employer does not try to create a healthy
and fun environment47%
Have you ever attended work when you have not felt at
your healthy best?
Unweighted base 2011
UK working adults aged 18+ 2011
Yes, I have attended work whilst feeling unwell because I
would not have been paid25%
Yes, I have attended work whilst feeling unwell due to work
commitments59%
Yes, I have attended work whilst feeling unwell due to another
reason25%
No, and I don't think you should be at work if you are unwell 9%
Can't remember/ Don't know 2%
Net: Yes 89%
North
East
North
West
Yorkshire
and the
Humber
East
Midlands
West
Midlands
East of
EnglandLondon
South
East
South
WestWales Scotland
Northern
Ireland
Government Region
45 186 142 109 157 176 172 310 187 64 180 15
46 207 152 120 165 195 165 301 160 56 189 12
45% 36% 35% 27% 27% 39% 41% 43% 45% 35% 33% 9%
29% 12% 13% 16% 15% 16% 17% 25% 13% 13% 15% 4%
13% 5% 11% 17% 11% 16% 13% 12% 10% 9% 7% 36%
13% 6% 3% 5% 4% 8% 15% 9% 7% 5% 9% -
6% 7% 2% 13% 5% 5% 13% 8% 4% 3% 10% -
- 2% 1% 5% 8% 2% 10% 5% 5% 1% 2% -
- 2% 3% 4% 5% 3% 4% 1% 0% 3% 1% -
3% 4% 5% 2% 2% 4% 7% 5% 3% 1% 3% 18%
36% 50% 49% 46% 57% 48% 37% 40% 44% 54% 55% 33%
51 202 155 140 178 205 208 358 214 80 204 16
49 222 167 146 180 225 192 341 191 65 218 14
17% 26% 30% 26% 25% 30% 21% 18% 41% 23% 21% 11%
51% 59% 59% 59% 62% 51% 64% 64% 54% 51% 61% 56%
32% 27% 24% 30% 29% 23% 21% 20% 26% 38% 19% 34%
15% 7% 7% 12% 4% 11% 9% 11% 4% 6% 9% 24%
- 1% 2% 2% - 3% 3% 1% 2% - 4% -
85% 91% 91% 86% 96% 86% 87% 88% 94% 94% 87% 76%
15 © 2013 YouGov plc. All Rights Reserved yougov.co.uk
Fieldwork: 30th August - 3rd September 2013
In general, how happy or unhappy would you say you are
in your current job?
Total
Which, if any, of the following does your employer do to
try create a healthy and fun environment at your place of
work?
Unweighted base 1743
UK full and part time working employees 1767
Free tea, coffee and biscuits 37%
Chill out room/ break out areas 17%
Gym facilities 11%
Free fruit 8%
Workplace wellness room (health promotion activity or
organisational policy designed to support healthy behavior in
the workplace and to improve health outcomes)
7%
Pool/ table football 4%
Computer games (e.g. Nintendo Wii, Xbox, etc.) 2%
Other 4%
Not applicable - My employer does not try to create a healthy
and fun environment47%
Have you ever attended work when you have not felt at
your healthy best?
Unweighted base 2011
UK working adults aged 18+ 2011
Yes, I have attended work whilst feeling unwell because I
would not have been paid25%
Yes, I have attended work whilst feeling unwell due to work
commitments59%
Yes, I have attended work whilst feeling unwell due to another
reason25%
No, and I don't think you should be at work if you are unwell 9%
Can't remember/ Don't know 2%
Net: Yes 89%
Facebook LinkedIn Google+ TwitterFull
Time
Part
Time
Working
full time
Working
part time
Working
parentsSocial Media (monthly or more) Full / part time
1076 357 83 421 335 107 1373 370
1093 380 86 440 397 40 1620 147
40% 44% 31% 44% 39% 42% 37% 37%
17% 20% 16% 17% 18% 18% 17% 15%
12% 14% 4% 13% 16% 8% 12% 5%
7% 15% 11% 9% 12% 5% 8% 5%
7% 10% 5% 8% 11% 3% 8% 2%
4% 3% 6% 5% 4% 7% 4% 5%
2% 2% 1% 4% 3% 1% 2% 1%
5% 7% 10% 3% 3% 3% 4% 3%
44% 38% 57% 39% 39% 46% 47% 50%
1216 440 106 481 379 123 1548 463
1218 445 111 484 450 45 1830 181
25% 18% 30% 20% 24% 29% 25% 31%
61% 72% 62% 67% 65% 51% 60% 48%
27% 21% 25% 27% 24% 25% 24% 28%
8% 8% 2% 6% 9% 7% 9% 11%
1% 1% 1% 2% 2% 2% 2% 1%
91% 91% 96% 92% 89% 91% 90% 89%
16 © 2013 YouGov plc. All Rights Reserved yougov.co.uk
Fieldwork: 30th August - 3rd September 2013
In general, how happy or unhappy would you say you are
in your current job?
Total
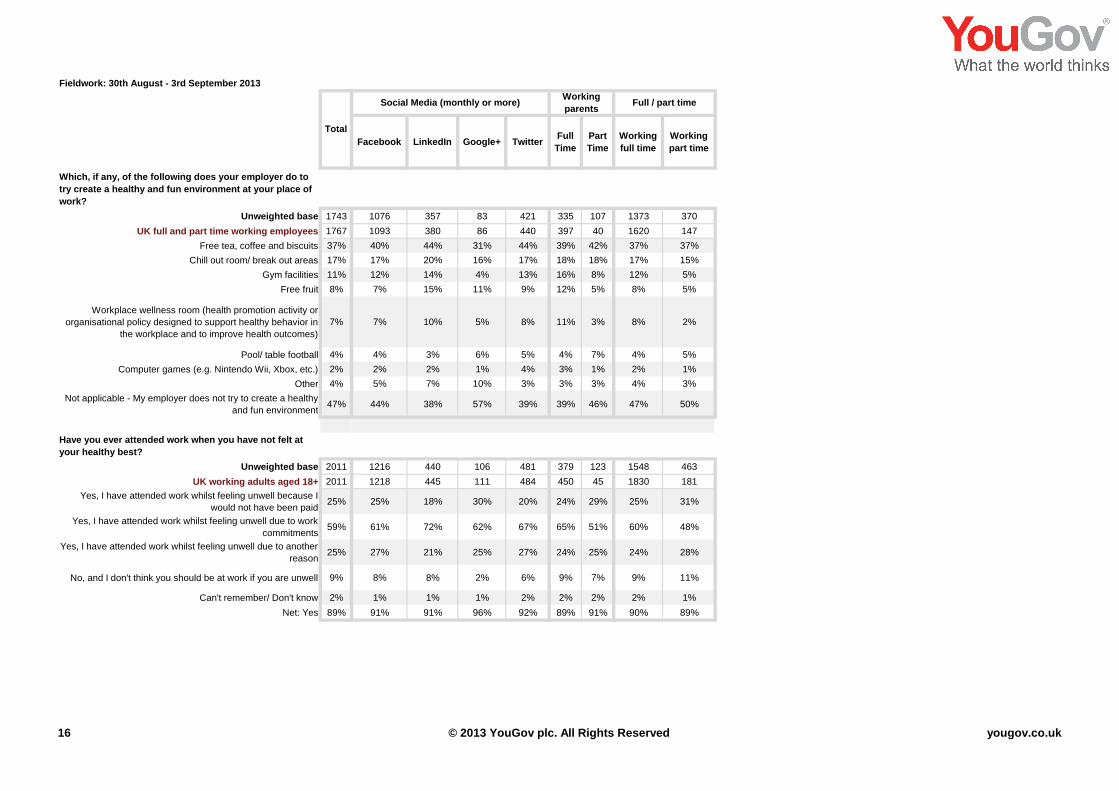
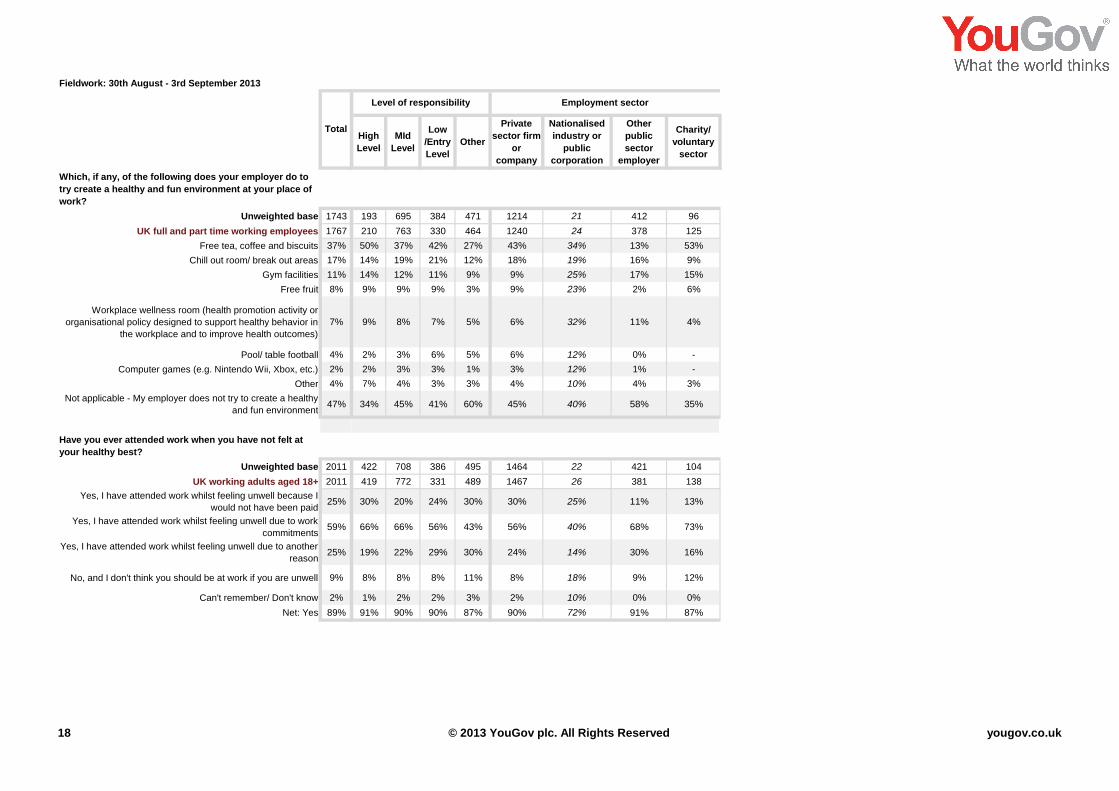
Which, if any, of the following does your employer do to
try create a healthy and fun environment at your place of
work?
Unweighted base 1743
UK full and part time working employees 1767
Free tea, coffee and biscuits 37%
Chill out room/ break out areas 17%
Gym facilities 11%
Free fruit 8%
Workplace wellness room (health promotion activity or
organisational policy designed to support healthy behavior in
the workplace and to improve health outcomes)
7%
Pool/ table football 4%
Computer games (e.g. Nintendo Wii, Xbox, etc.) 2%
Other 4%
Not applicable - My employer does not try to create a healthy
and fun environment47%
Have you ever attended work when you have not felt at
your healthy best?
Unweighted base 2011
UK working adults aged 18+ 2011
Yes, I have attended work whilst feeling unwell because I
would not have been paid25%
Yes, I have attended work whilst feeling unwell due to work
commitments59%
Yes, I have attended work whilst feeling unwell due to another
reason25%
No, and I don't think you should be at work if you are unwell 9%
Can't remember/ Don't know 2%
Net: Yes 89%
EmployeeSelf
Employed
Full time
Employee
Full Time
self
employed
Part Time
Employee
Part Time
Self
Employed
1 year
or less
More than 1
year, up to 2
years
More than 2
years, up to 3
years
More than 3
years, up to 4
years
More than 4
years, up to 5
years
6 years or
more
Length of employmentWorking status
1743 - 1373 - 370 - 145 133 106 99 160 1100
1767 - 1620 - 147 - 149 137 120 108 160 1094
37% - 37% - 37% - 47% 36% 37% 45% 44% 34%
17% - 17% - 15% - 18% 19% 17% 17% 21% 16%
11% - 12% - 5% - 10% 6% 13% 13% 13% 11%
8% - 8% - 5% - 11% 10% 14% 5% 8% 6%
7% - 8% - 2% - 10% 11% 5% 0% 10% 7%
4% - 4% - 5% - 3% 3% 5% 4% 9% 4%
2% - 2% - 1% - 2% 0% 6% 4% 5% 1%
4% - 4% - 3% - 6% 5% 5% 4% 4% 4%
47% - 47% - 50% - 38% 41% 46% 45% 38% 50%
1743 268 1373 175 370 93 145 133 106 99 160 1100
1767 244 1620 210 147 34 149 137 120 108 160 1094
22% 44% 22% 47% 31% 30% 31% 34% 33% 27% 20% 19%
59% 60% 60% 59% 45% 62% 56% 51% 44% 59% 63% 61%
25% 23% 24% 23% 29% 23% 17% 17% 20% 23% 24% 27%
9% 9% 9% 9% 10% 11% 11% 11% 14% 8% 9% 8%
2% 1% 2% 2% 1% - 4% 3% 2% - 1% 2%
89% 90% 90% 90% 88% 89% 85% 86% 84% 92% 90% 91%
17 © 2013 YouGov plc. All Rights Reserved yougov.co.uk
Fieldwork: 30th August - 3rd September 2013
In general, how happy or unhappy would you say you are
in your current job?
Total
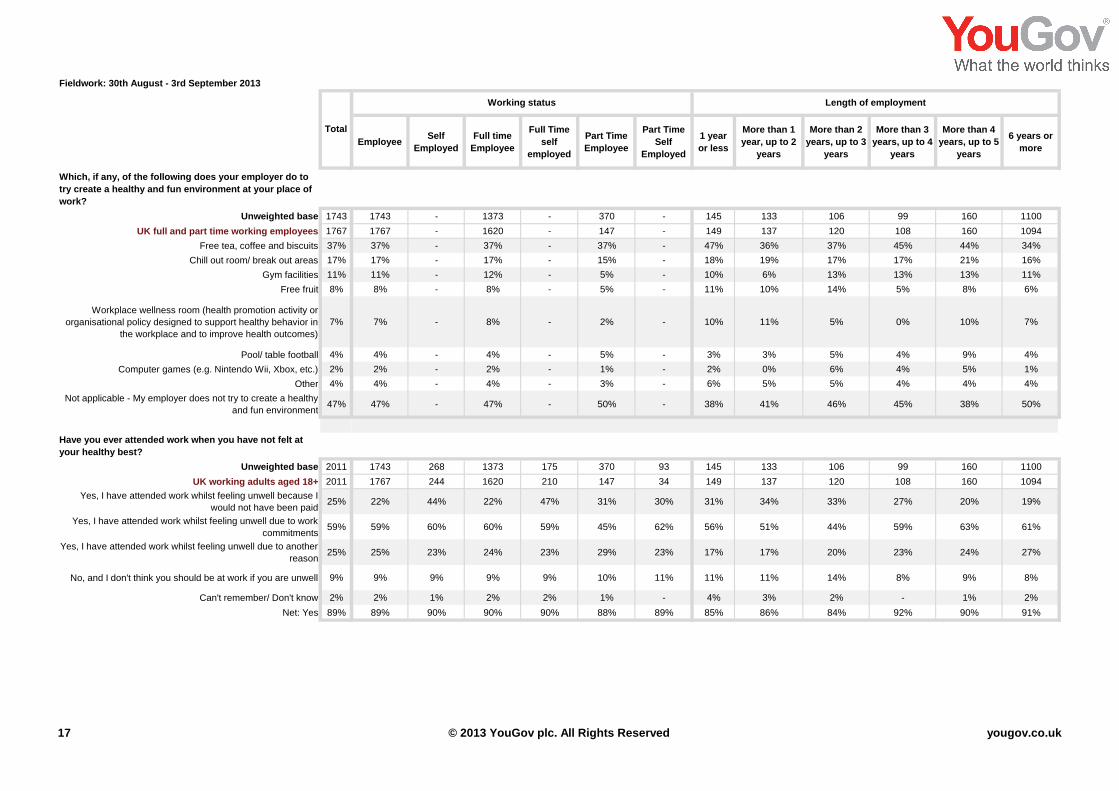
Which, if any, of the following does your employer do to
try create a healthy and fun environment at your place of
work?
Unweighted base 1743
UK full and part time working employees 1767
Free tea, coffee and biscuits 37%
Chill out room/ break out areas 17%
Gym facilities 11%
Free fruit 8%
Workplace wellness room (health promotion activity or
organisational policy designed to support healthy behavior in
the workplace and to improve health outcomes)
7%
Pool/ table football 4%
Computer games (e.g. Nintendo Wii, Xbox, etc.) 2%
Other 4%
Not applicable - My employer does not try to create a healthy
and fun environment47%
Have you ever attended work when you have not felt at
your healthy best?
Unweighted base 2011
UK working adults aged 18+ 2011
Yes, I have attended work whilst feeling unwell because I
would not have been paid25%
Yes, I have attended work whilst feeling unwell due to work
commitments59%
Yes, I have attended work whilst feeling unwell due to another
reason25%
No, and I don't think you should be at work if you are unwell 9%
Can't remember/ Don't know 2%
Net: Yes 89%
High
Level
MId
Level
Low
/Entry
Level
Other
Private
sector firm
or
company
Nationalised
industry or
public
corporation
Other
public
sector
employer
Charity/
voluntary
sector
Level of responsibility Employment sector
193 695 384 471 1214 21 412 96
210 763 330 464 1240 24 378 125
50% 37% 42% 27% 43% 34% 13% 53%
14% 19% 21% 12% 18% 19% 16% 9%
14% 12% 11% 9% 9% 25% 17% 15%
9% 9% 9% 3% 9% 23% 2% 6%
9% 8% 7% 5% 6% 32% 11% 4%
2% 3% 6% 5% 6% 12% 0% -
2% 3% 3% 1% 3% 12% 1% -
7% 4% 3% 3% 4% 10% 4% 3%
34% 45% 41% 60% 45% 40% 58% 35%
422 708 386 495 1464 22 421 104
419 772 331 489 1467 26 381 138
30% 20% 24% 30% 30% 25% 11% 13%
66% 66% 56% 43% 56% 40% 68% 73%
19% 22% 29% 30% 24% 14% 30% 16%
8% 8% 8% 11% 8% 18% 9% 12%
1% 2% 2% 3% 2% 10% 0% 0%
91% 90% 90% 87% 90% 72% 91% 87%
18 © 2013 YouGov plc. All Rights Reserved yougov.co.uk
Fieldwork: 30th August - 3rd September 2013
Male Female 18-34 35-44 45-54 55+ ABC1 C2DE North Midlands East London South Wales ScotlandNorthern
Ireland
Age Region
Total
Gender Social Grade
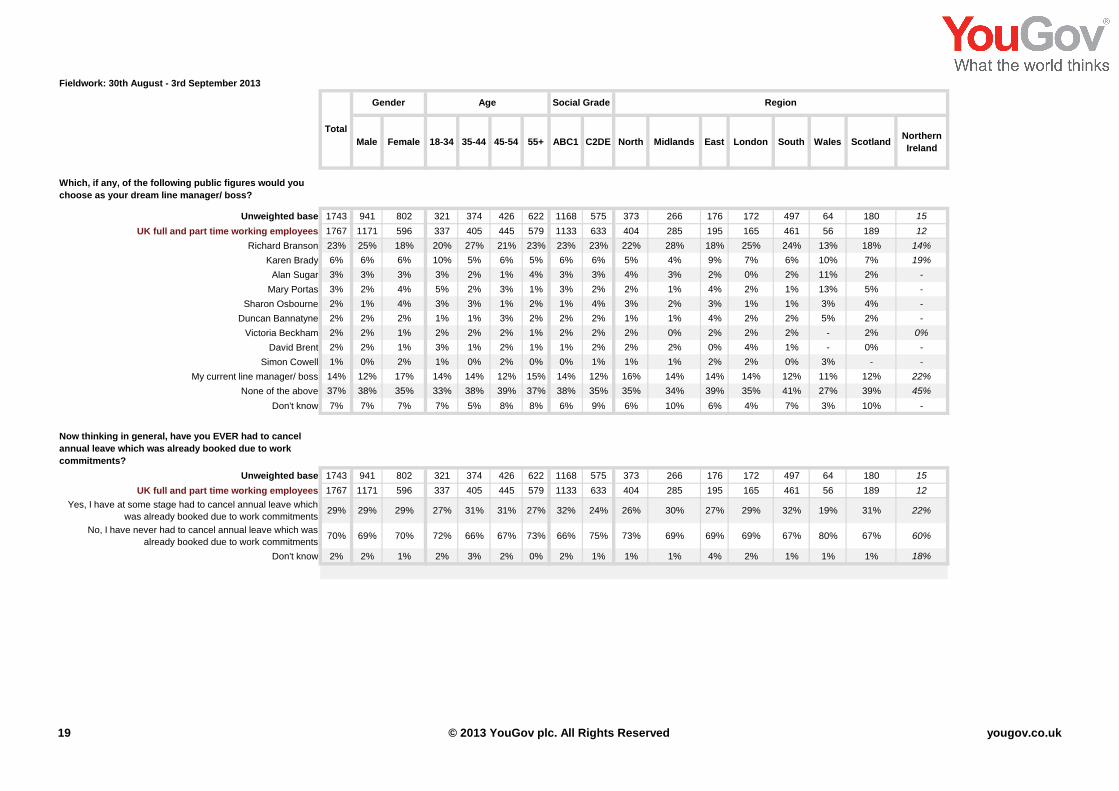
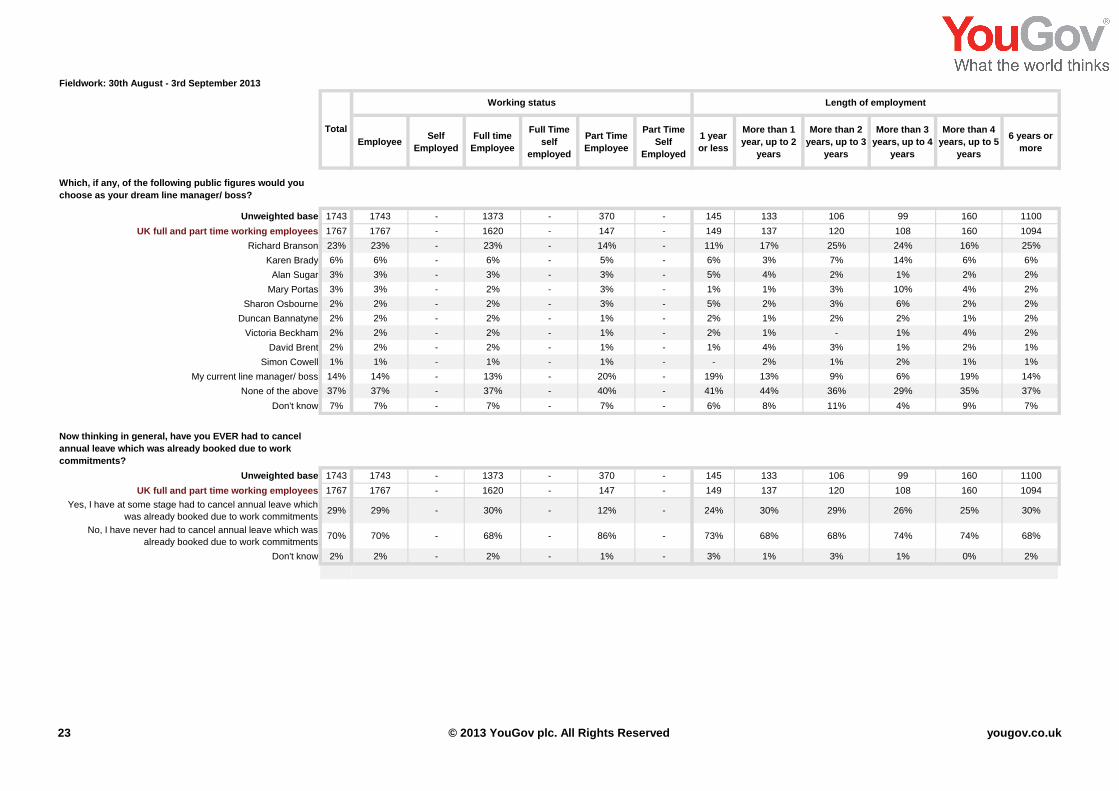
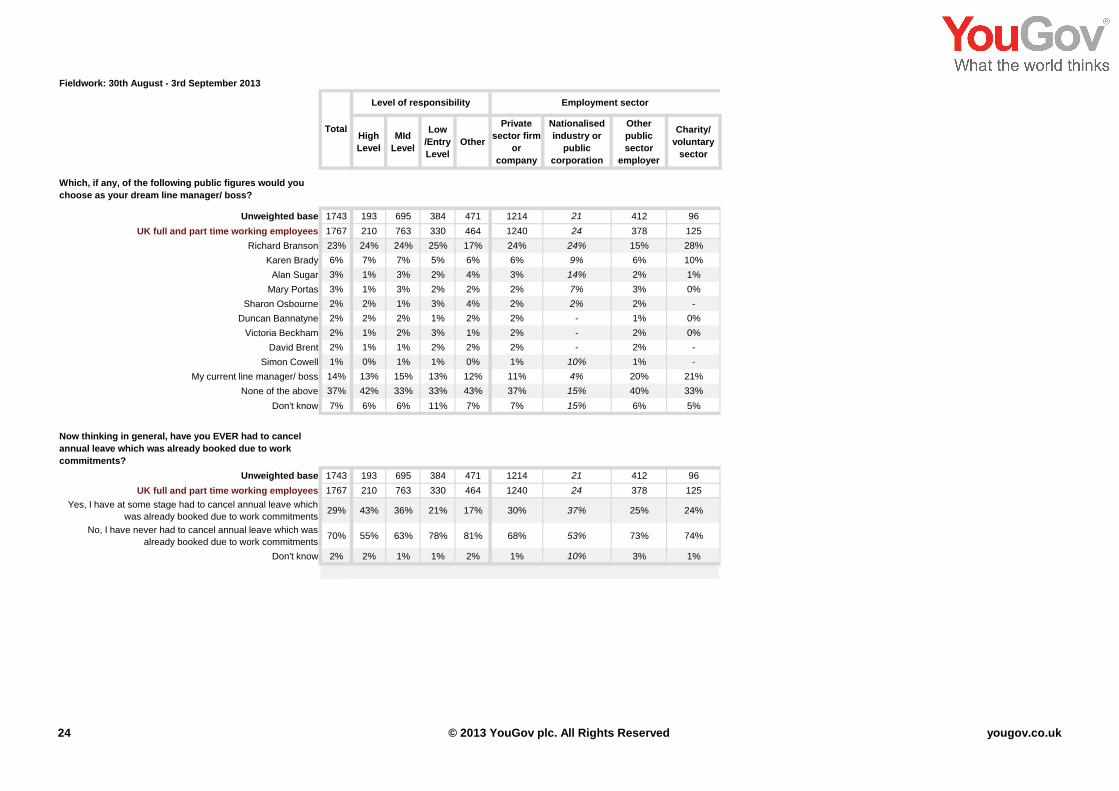
Which, if any, of the following public figures would you
choose as your dream line manager/ boss?
Unweighted base 1743 941 802 321 374 426 622 1168 575 373 266 176 172 497 64 180 15
UK full and part time working employees 1767 1171 596 337 405 445 579 1133 633 404 285 195 165 461 56 189 12
Richard Branson 23% 25% 18% 20% 27% 21% 23% 23% 23% 22% 28% 18% 25% 24% 13% 18% 14%
Karen Brady 6% 6% 6% 10% 5% 6% 5% 6% 6% 5% 4% 9% 7% 6% 10% 7% 19%
Alan Sugar 3% 3% 3% 3% 2% 1% 4% 3% 3% 4% 3% 2% 0% 2% 11% 2% -
Mary Portas 3% 2% 4% 5% 2% 3% 1% 3% 2% 2% 1% 4% 2% 1% 13% 5% -
Sharon Osbourne 2% 1% 4% 3% 3% 1% 2% 1% 4% 3% 2% 3% 1% 1% 3% 4% -
Duncan Bannatyne 2% 2% 2% 1% 1% 3% 2% 2% 2% 1% 1% 4% 2% 2% 5% 2% -
Victoria Beckham 2% 2% 1% 2% 2% 2% 1% 2% 2% 2% 0% 2% 2% 2% - 2% 0%
David Brent 2% 2% 1% 3% 1% 2% 1% 1% 2% 2% 2% 0% 4% 1% - 0% -
Simon Cowell 1% 0% 2% 1% 0% 2% 0% 0% 1% 1% 1% 2% 2% 0% 3% - -
My current line manager/ boss 14% 12% 17% 14% 14% 12% 15% 14% 12% 16% 14% 14% 14% 12% 11% 12% 22%
None of the above 37% 38% 35% 33% 38% 39% 37% 38% 35% 35% 34% 39% 35% 41% 27% 39% 45%
Don't know 7% 7% 7% 7% 5% 8% 8% 6% 9% 6% 10% 6% 4% 7% 3% 10% -
Now thinking in general, have you EVER had to cancel
annual leave which was already booked due to work
commitments?
Unweighted base 1743 941 802 321 374 426 622 1168 575 373 266 176 172 497 64 180 15
UK full and part time working employees 1767 1171 596 337 405 445 579 1133 633 404 285 195 165 461 56 189 12
Yes, I have at some stage had to cancel annual leave which
was already booked due to work commitments29% 29% 29% 27% 31% 31% 27% 32% 24% 26% 30% 27% 29% 32% 19% 31% 22%
No, I have never had to cancel annual leave which was
already booked due to work commitments70% 69% 70% 72% 66% 67% 73% 66% 75% 73% 69% 69% 69% 67% 80% 67% 60%
Don't know 2% 2% 1% 2% 3% 2% 0% 2% 1% 1% 1% 4% 2% 1% 1% 1% 18%
19 © 2013 YouGov plc. All Rights Reserved yougov.co.uk
Fieldwork: 30th August - 3rd September 2013
In general, how happy or unhappy would you say you are
in your current job?
Total
Which, if any, of the following public figures would you
choose as your dream line manager/ boss?
Unweighted base 1743
UK full and part time working employees 1767
Richard Branson 23%
Karen Brady 6%
Alan Sugar 3%
Mary Portas 3%
Sharon Osbourne 2%
Duncan Bannatyne 2%
Victoria Beckham 2%
David Brent 2%
Simon Cowell 1%
My current line manager/ boss 14%
None of the above 37%
Don't know 7%
Now thinking in general, have you EVER had to cancel
annual leave which was already booked due to work
commitments?
Unweighted base 1743
UK full and part time working employees 1767
Yes, I have at some stage had to cancel annual leave which
was already booked due to work commitments29%
No, I have never had to cancel annual leave which was
already booked due to work commitments70%
Don't know 2%
Married/ Civil
Partnership
Living as
married
Separated/
DivorcedWidowed
Never
Married0 1 2 3+
ALL WITH
CHILDREN IN
HOUSEHOLD
(NET)
Refused
Marital Status Children in Household
973 245 151 32 342 1290 210 187 38 435 18
970 258 147 21 371 1313 228 173 37 438 16
22% 26% 19% 21% 23% 22% 22% 26% 17% 23% 16%
6% 6% 6% - 8% 7% 4% 6% 11% 6% -
3% 1% 4% - 2% 2% 5% 2% 1% 4% -
2% 6% 2% - 2% 2% 4% 2% 1% 3% -
2% 3% 4% - 2% 2% 3% 2% 7% 3% -
2% 1% 5% 10% 1% 2% 1% 1% - 1% -
2% 1% 2% 2% 2% 2% 2% 2% - 2% 2%
2% 4% - - 1% 2% 2% 1% 4% 2% -
1% 0% 3% - 1% 1% 1% 1% - 1% 2%
15% 12% 14% 26% 10% 14% 15% 11% 23% 14% 4%
37% 36% 36% 37% 38% 37% 35% 36% 33% 35% 62%
7% 6% 6% 3% 9% 7% 6% 9% 1% 7% 14%
973 245 151 32 342 1290 210 187 38 435 18
970 258 147 21 371 1313 228 173 37 438 16
29% 23% 41% 15% 28% 28% 36% 26% 28% 31% 42%
69% 75% 58% 84% 70% 71% 61% 72% 71% 67% 54%
1% 2% 1% 1% 2% 1% 3% 1% 1% 2% 4%
20 © 2013 YouGov plc. All Rights Reserved yougov.co.uk
Fieldwork: 30th August - 3rd September 2013
In general, how happy or unhappy would you say you are
in your current job?
Total
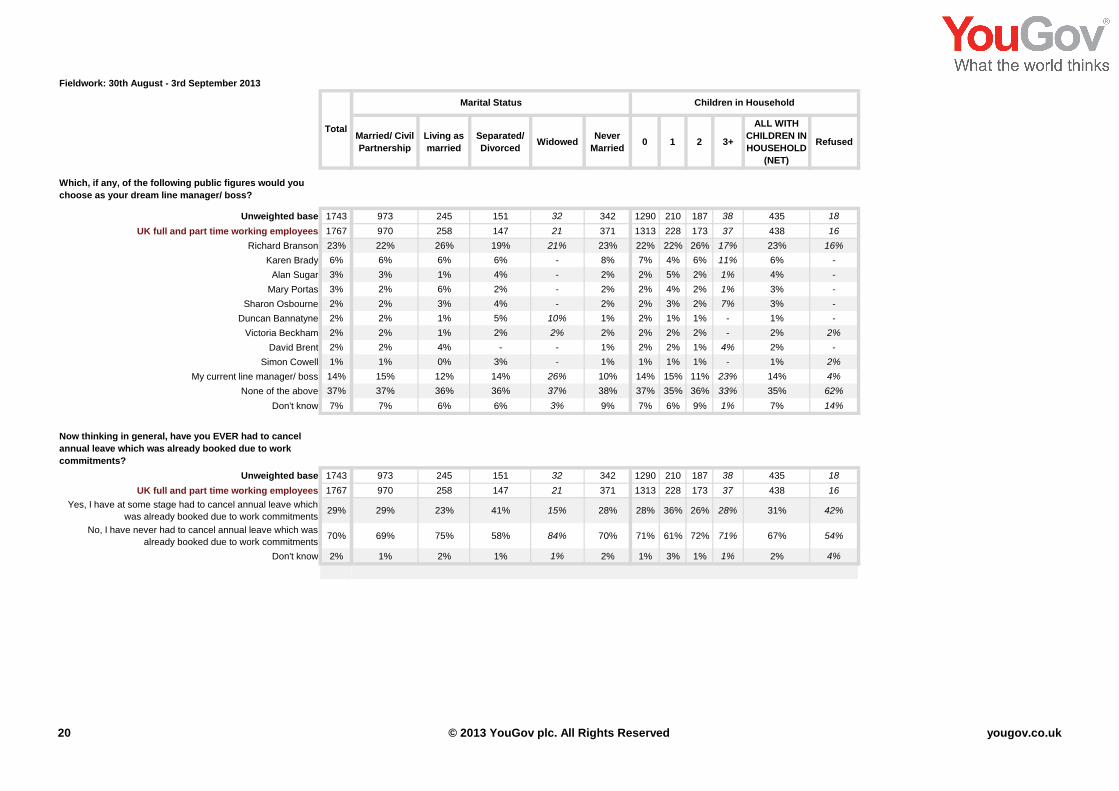
Which, if any, of the following public figures would you
choose as your dream line manager/ boss?
Unweighted base 1743
UK full and part time working employees 1767
Richard Branson 23%
Karen Brady 6%
Alan Sugar 3%
Mary Portas 3%
Sharon Osbourne 2%
Duncan Bannatyne 2%
Victoria Beckham 2%
David Brent 2%
Simon Cowell 1%
My current line manager/ boss 14%
None of the above 37%
Don't know 7%
Now thinking in general, have you EVER had to cancel
annual leave which was already booked due to work
commitments?
Unweighted base 1743
UK full and part time working employees 1767
Yes, I have at some stage had to cancel annual leave which
was already booked due to work commitments29%
No, I have never had to cancel annual leave which was
already booked due to work commitments70%
Don't know 2%
North
East
North
West
Yorkshire
and the
Humber
East
Midlands
West
Midlands
East of
EnglandLondon
South
East
South
WestWales Scotland
Northern
Ireland
Government Region
45 186 142 109 157 176 172 310 187 64 180 15
46 207 152 120 165 195 165 301 160 56 189 12
20% 25% 19% 20% 33% 18% 25% 24% 25% 13% 18% 14%
- 5% 6% 7% 2% 9% 7% 4% 11% 10% 7% 19%
2% 5% 5% 5% 1% 2% 0% 1% 3% 11% 2% -
- 3% 3% 1% 1% 4% 2% 1% 1% 13% 5% -
3% 4% 1% 3% 1% 3% 1% 2% 1% 3% 4% -
- 0% 3% 2% - 4% 2% 2% 3% 5% 2% -
4% 3% 1% 1% 0% 2% 2% 2% 1% - 2% 0%
- 3% 1% 3% 2% 0% 4% 2% 0% - 0% -
1% 0% 1% - 1% 2% 2% 0% 0% 3% - -
15% 14% 19% 13% 15% 14% 14% 10% 16% 11% 12% 22%
47% 30% 37% 34% 33% 39% 35% 45% 34% 27% 39% 45%
9% 8% 4% 11% 10% 6% 4% 7% 5% 3% 10% -
45 186 142 109 157 176 172 310 187 64 180 15
46 207 152 120 165 195 165 301 160 56 189 12
26% 26% 26% 23% 34% 27% 29% 32% 31% 19% 31% 22%
74% 72% 74% 74% 65% 69% 69% 67% 69% 80% 67% 60%
- 2% - 3% 0% 4% 2% 1% - 1% 1% 18%
21 © 2013 YouGov plc. All Rights Reserved yougov.co.uk
Fieldwork: 30th August - 3rd September 2013
In general, how happy or unhappy would you say you are
in your current job?
Total
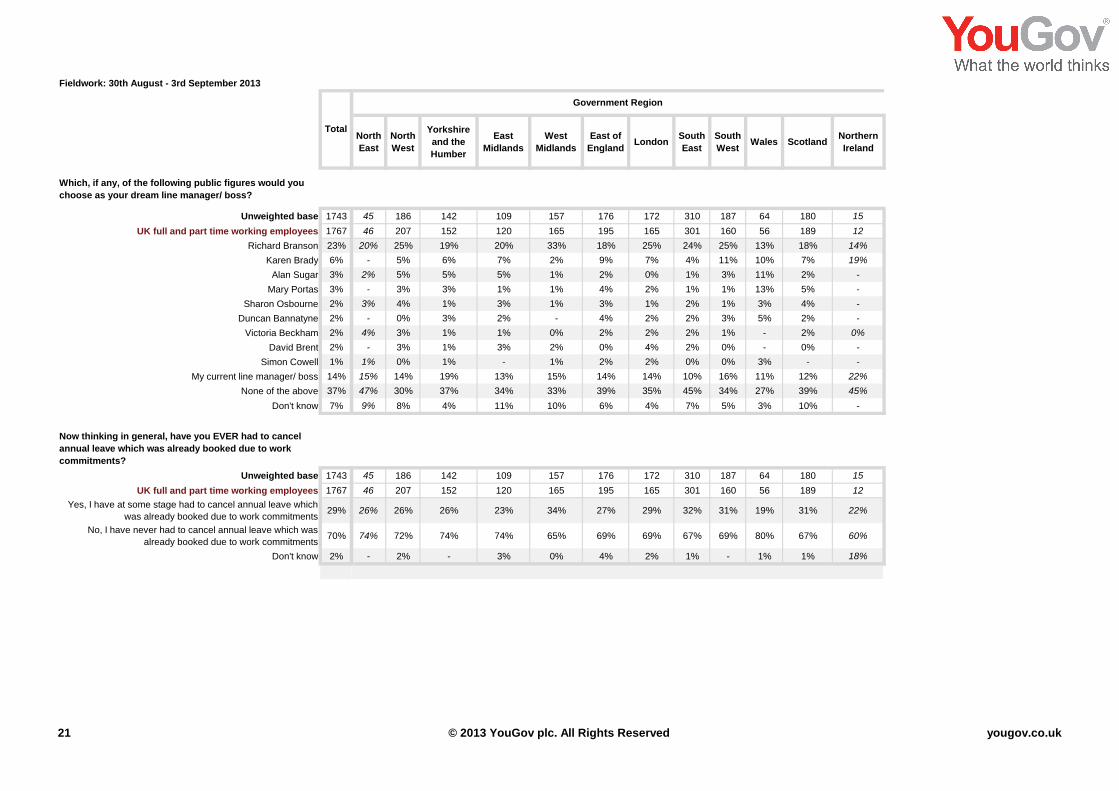
Which, if any, of the following public figures would you
choose as your dream line manager/ boss?
Unweighted base 1743
UK full and part time working employees 1767
Richard Branson 23%
Karen Brady 6%
Alan Sugar 3%
Mary Portas 3%
Sharon Osbourne 2%
Duncan Bannatyne 2%
Victoria Beckham 2%
David Brent 2%
Simon Cowell 1%
My current line manager/ boss 14%
None of the above 37%
Don't know 7%
Now thinking in general, have you EVER had to cancel
annual leave which was already booked due to work
commitments?
Unweighted base 1743
UK full and part time working employees 1767
Yes, I have at some stage had to cancel annual leave which
was already booked due to work commitments29%
No, I have never had to cancel annual leave which was
already booked due to work commitments70%
Don't know 2%
Facebook LinkedIn Google+ TwitterFull
Time
Part
Time
Working
full time
Working
part time
Working
parentsSocial Media (monthly or more) Full / part time
1076 357 83 421 335 107 1373 370
1093 380 86 440 397 40 1620 147
23% 28% 15% 28% 22% 15% 23% 14%
7% 7% 6% 8% 6% 7% 6% 5%
3% 2% - 2% 3% 2% 3% 3%
3% 2% 5% 3% 3% 7% 2% 3%
2% 1% 6% 2% 2% 6% 2% 3%
2% 1% 1% 2% 1% - 2% 1%
2% 1% 4% 2% 2% 2% 2% 1%
1% 2% 1% 1% 2% 2% 2% 1%
1% 0% - 0% 1% 1% 1% 1%
14% 11% 13% 12% 15% 12% 13% 20%
36% 40% 41% 34% 35% 44% 37% 40%
6% 5% 8% 6% 7% 3% 7% 7%
1076 357 83 421 335 107 1373 370
1093 380 86 440 397 40 1620 147
30% 40% 37% 31% 36% 10% 30% 12%
69% 59% 62% 68% 62% 89% 68% 86%
1% 1% 1% 1% 2% 1% 2% 1%
22 © 2013 YouGov plc. All Rights Reserved yougov.co.uk
Fieldwork: 30th August - 3rd September 2013
In general, how happy or unhappy would you say you are
in your current job?
Total
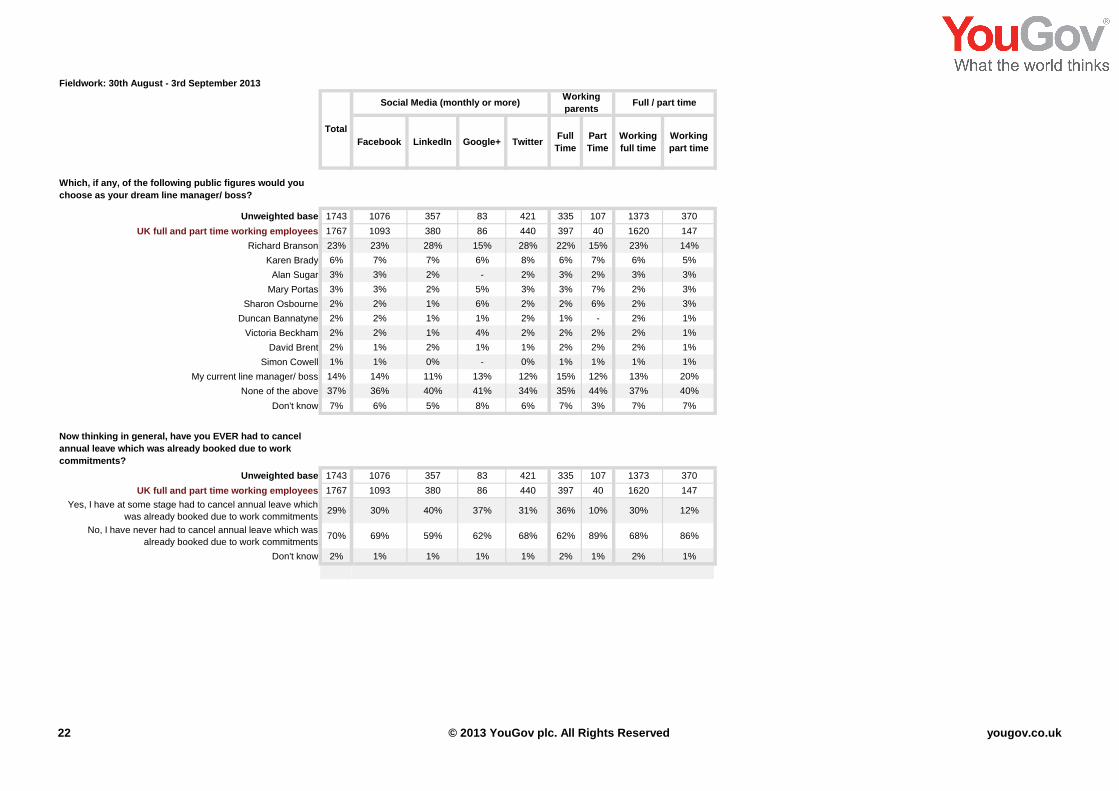
Which, if any, of the following public figures would you
choose as your dream line manager/ boss?
Unweighted base 1743
UK full and part time working employees 1767
Richard Branson 23%
Karen Brady 6%
Alan Sugar 3%
Mary Portas 3%
Sharon Osbourne 2%
Duncan Bannatyne 2%
Victoria Beckham 2%
David Brent 2%
Simon Cowell 1%
My current line manager/ boss 14%
None of the above 37%
Don't know 7%
Now thinking in general, have you EVER had to cancel
annual leave which was already booked due to work
commitments?
Unweighted base 1743
UK full and part time working employees 1767
Yes, I have at some stage had to cancel annual leave which
was already booked due to work commitments29%
No, I have never had to cancel annual leave which was
already booked due to work commitments70%
Don't know 2%
EmployeeSelf
Employed
Full time
Employee
Full Time
self
employed
Part Time
Employee
Part Time
Self
Employed
1 year
or less
More than 1
year, up to 2
years
More than 2
years, up to 3
years
More than 3
years, up to 4
years
More than 4
years, up to 5
years
6 years or
more
Length of employmentWorking status
1743 - 1373 - 370 - 145 133 106 99 160 1100
1767 - 1620 - 147 - 149 137 120 108 160 1094
23% - 23% - 14% - 11% 17% 25% 24% 16% 25%
6% - 6% - 5% - 6% 3% 7% 14% 6% 6%
3% - 3% - 3% - 5% 4% 2% 1% 2% 2%
3% - 2% - 3% - 1% 1% 3% 10% 4% 2%
2% - 2% - 3% - 5% 2% 3% 6% 2% 2%
2% - 2% - 1% - 2% 1% 2% 2% 1% 2%
2% - 2% - 1% - 2% 1% - 1% 4% 2%
2% - 2% - 1% - 1% 4% 3% 1% 2% 1%
1% - 1% - 1% - - 2% 1% 2% 1% 1%
14% - 13% - 20% - 19% 13% 9% 6% 19% 14%
37% - 37% - 40% - 41% 44% 36% 29% 35% 37%
7% - 7% - 7% - 6% 8% 11% 4% 9% 7%
1743 - 1373 - 370 - 145 133 106 99 160 1100
1767 - 1620 - 147 - 149 137 120 108 160 1094
29% - 30% - 12% - 24% 30% 29% 26% 25% 30%
70% - 68% - 86% - 73% 68% 68% 74% 74% 68%
2% - 2% - 1% - 3% 1% 3% 1% 0% 2%
23 © 2013 YouGov plc. All Rights Reserved yougov.co.uk
Fieldwork: 30th August - 3rd September 2013
In general, how happy or unhappy would you say you are
in your current job?
Total
Which, if any, of the following public figures would you
choose as your dream line manager/ boss?
Unweighted base 1743
UK full and part time working employees 1767
Richard Branson 23%
Karen Brady 6%
Alan Sugar 3%
Mary Portas 3%
Sharon Osbourne 2%
Duncan Bannatyne 2%
Victoria Beckham 2%
David Brent 2%
Simon Cowell 1%
My current line manager/ boss 14%
None of the above 37%
Don't know 7%
Now thinking in general, have you EVER had to cancel
annual leave which was already booked due to work
commitments?
Unweighted base 1743
UK full and part time working employees 1767
Yes, I have at some stage had to cancel annual leave which
was already booked due to work commitments29%
No, I have never had to cancel annual leave which was
already booked due to work commitments70%
Don't know 2%
High
Level
MId
Level
Low
/Entry
Level
Other
Private
sector firm
or
company
Nationalised
industry or
public
corporation
Other
public
sector
employer
Charity/
voluntary
sector
Level of responsibility Employment sector
193 695 384 471 1214 21 412 96
210 763 330 464 1240 24 378 125
24% 24% 25% 17% 24% 24% 15% 28%
7% 7% 5% 6% 6% 9% 6% 10%
1% 3% 2% 4% 3% 14% 2% 1%
1% 3% 2% 2% 2% 7% 3% 0%
2% 1% 3% 4% 2% 2% 2% -
2% 2% 1% 2% 2% - 1% 0%
1% 2% 3% 1% 2% - 2% 0%
1% 1% 2% 2% 2% - 2% -
0% 1% 1% 0% 1% 10% 1% -
13% 15% 13% 12% 11% 4% 20% 21%
42% 33% 33% 43% 37% 15% 40% 33%
6% 6% 11% 7% 7% 15% 6% 5%
193 695 384 471 1214 21 412 96
210 763 330 464 1240 24 378 125
43% 36% 21% 17% 30% 37% 25% 24%
55% 63% 78% 81% 68% 53% 73% 74%
2% 1% 1% 2% 1% 10% 3% 1%
24 © 2013 YouGov plc. All Rights Reserved yougov.co.uk
Fieldwork: 30th August - 3rd September 2013
Male Female 18-34 35-44 45-54 55+ ABC1 C2DE North Midlands East London South Wales ScotlandNorthern
Ireland
Age Region
Total
Gender Social Grade
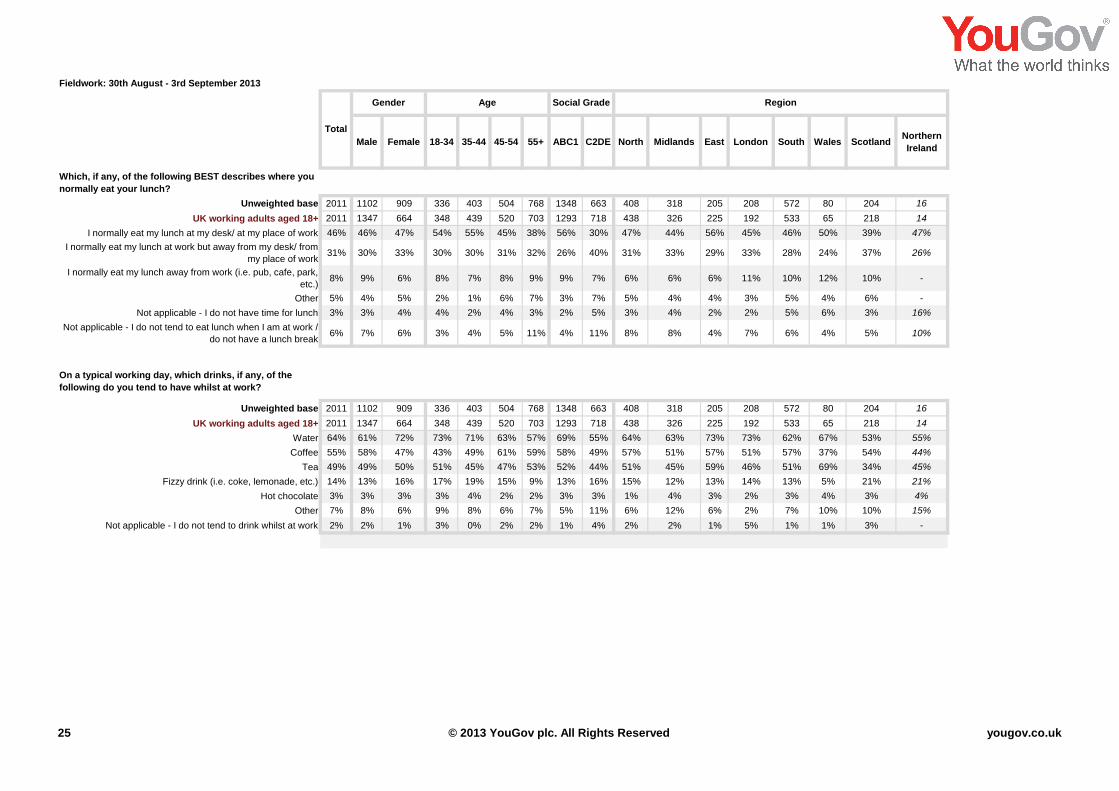
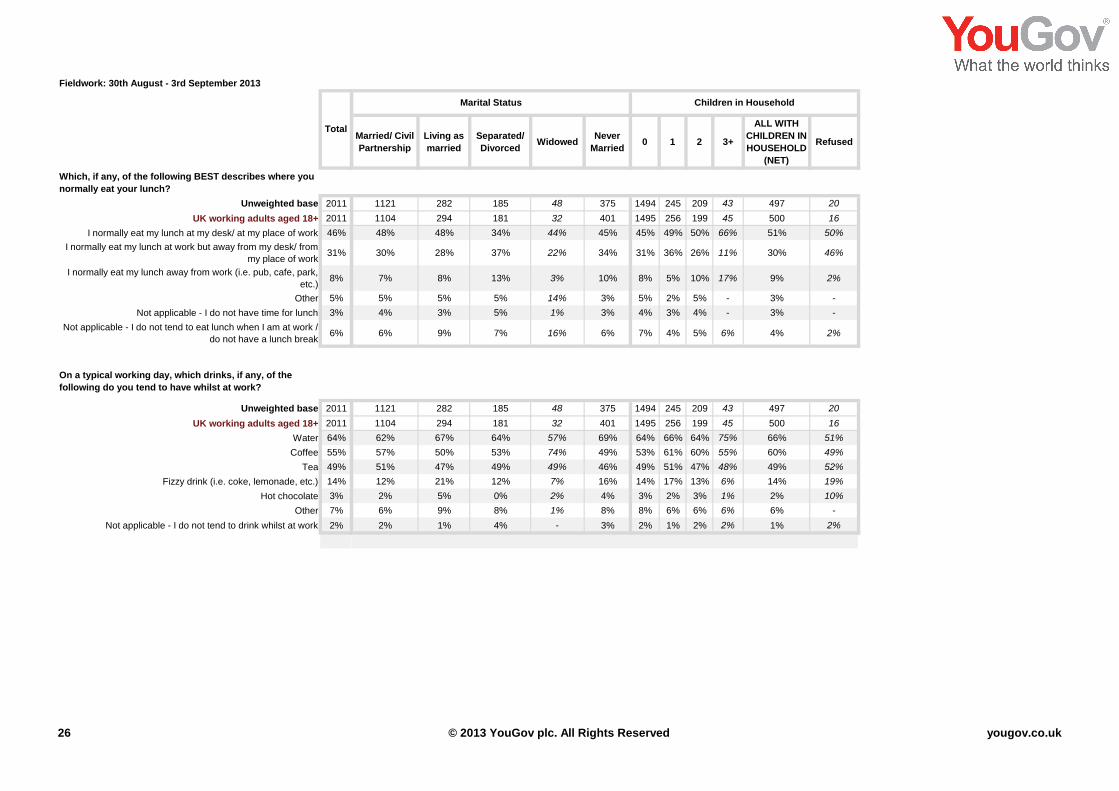
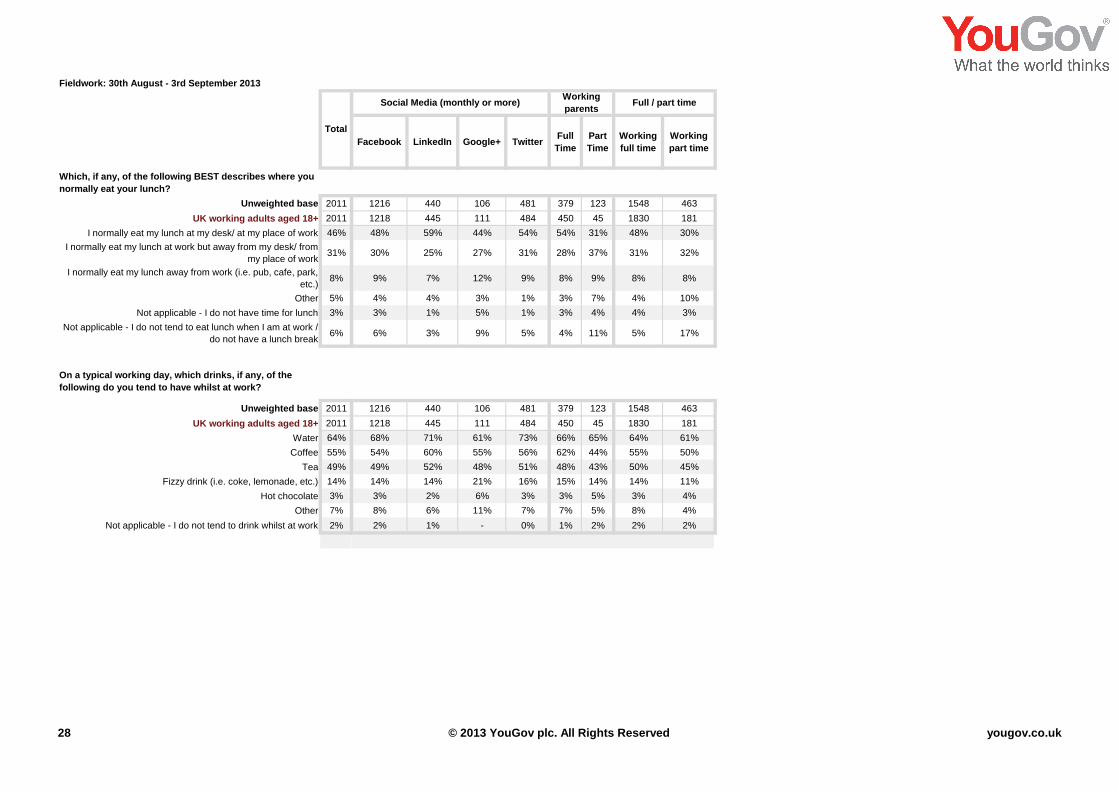
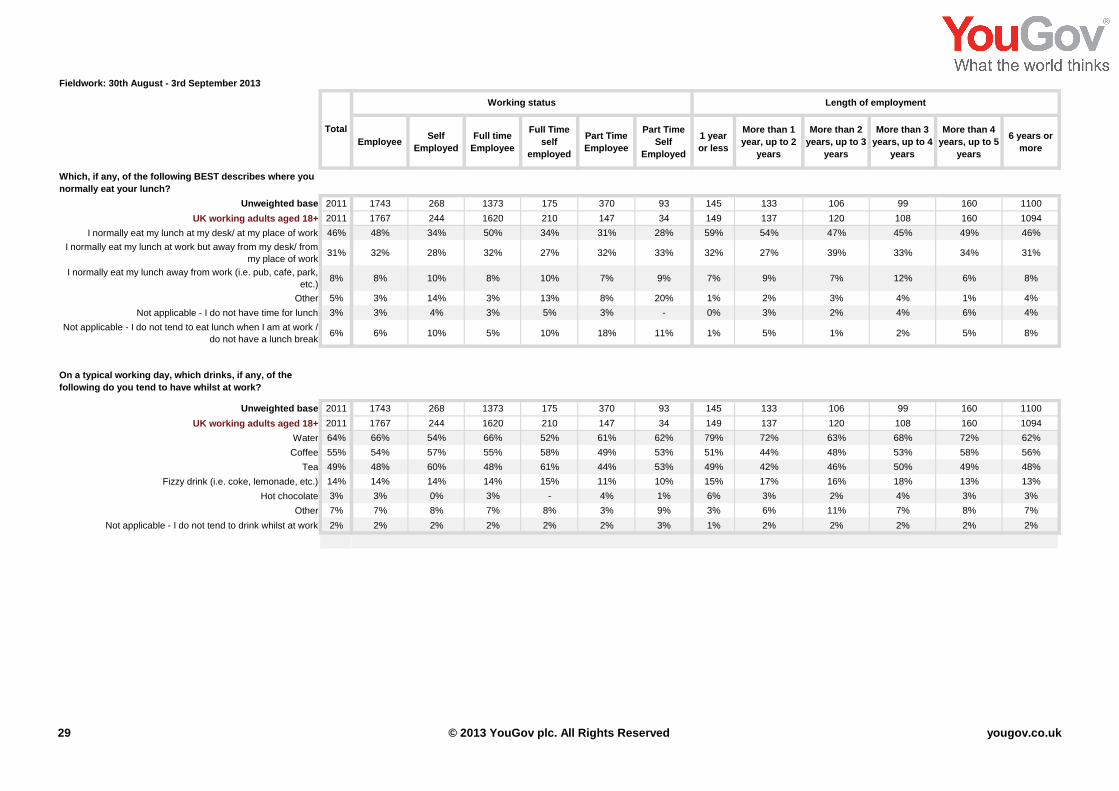
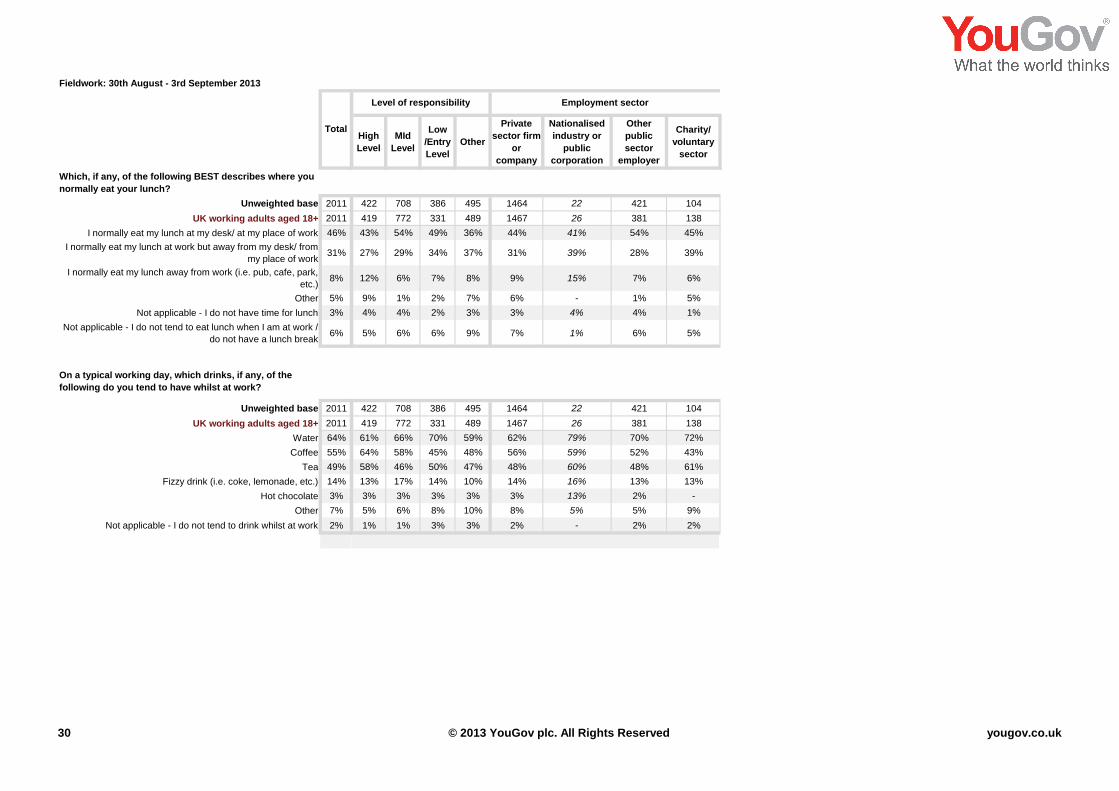
Which, if any, of the following BEST describes where you
normally eat your lunch?
Unweighted base 2011 1102 909 336 403 504 768 1348 663 408 318 205 208 572 80 204 16
UK working adults aged 18+ 2011 1347 664 348 439 520 703 1293 718 438 326 225 192 533 65 218 14
I normally eat my lunch at my desk/ at my place of work 46% 46% 47% 54% 55% 45% 38% 56% 30% 47% 44% 56% 45% 46% 50% 39% 47%
I normally eat my lunch at work but away from my desk/ from
my place of work31% 30% 33% 30% 30% 31% 32% 26% 40% 31% 33% 29% 33% 28% 24% 37% 26%
I normally eat my lunch away from work (i.e. pub, cafe, park,
etc.)8% 9% 6% 8% 7% 8% 9% 9% 7% 6% 6% 6% 11% 10% 12% 10% -
Other 5% 4% 5% 2% 1% 6% 7% 3% 7% 5% 4% 4% 3% 5% 4% 6% -
Not applicable - I do not have time for lunch 3% 3% 4% 4% 2% 4% 3% 2% 5% 3% 4% 2% 2% 5% 6% 3% 16%
Not applicable - I do not tend to eat lunch when I am at work /
do not have a lunch break6% 7% 6% 3% 4% 5% 11% 4% 11% 8% 8% 4% 7% 6% 4% 5% 10%
On a typical working day, which drinks, if any, of the
following do you tend to have whilst at work?
Unweighted base 2011 1102 909 336 403 504 768 1348 663 408 318 205 208 572 80 204 16
UK working adults aged 18+ 2011 1347 664 348 439 520 703 1293 718 438 326 225 192 533 65 218 14
Water 64% 61% 72% 73% 71% 63% 57% 69% 55% 64% 63% 73% 73% 62% 67% 53% 55%
Coffee 55% 58% 47% 43% 49% 61% 59% 58% 49% 57% 51% 57% 51% 57% 37% 54% 44%
Tea 49% 49% 50% 51% 45% 47% 53% 52% 44% 51% 45% 59% 46% 51% 69% 34% 45%
Fizzy drink (i.e. coke, lemonade, etc.) 14% 13% 16% 17% 19% 15% 9% 13% 16% 15% 12% 13% 14% 13% 5% 21% 21%
Hot chocolate 3% 3% 3% 3% 4% 2% 2% 3% 3% 1% 4% 3% 2% 3% 4% 3% 4%
Other 7% 8% 6% 9% 8% 6% 7% 5% 11% 6% 12% 6% 2% 7% 10% 10% 15%
Not applicable - I do not tend to drink whilst at work 2% 2% 1% 3% 0% 2% 2% 1% 4% 2% 2% 1% 5% 1% 1% 3% -
25 © 2013 YouGov plc. All Rights Reserved yougov.co.uk
Fieldwork: 30th August - 3rd September 2013
In general, how happy or unhappy would you say you are
in your current job?
Total
Which, if any, of the following BEST describes where you
normally eat your lunch?
Unweighted base 2011
UK working adults aged 18+ 2011
I normally eat my lunch at my desk/ at my place of work 46%
I normally eat my lunch at work but away from my desk/ from
my place of work31%
I normally eat my lunch away from work (i.e. pub, cafe, park,
etc.)8%
Other 5%
Not applicable - I do not have time for lunch 3%
Not applicable - I do not tend to eat lunch when I am at work /
do not have a lunch break6%
On a typical working day, which drinks, if any, of the
following do you tend to have whilst at work?
Unweighted base 2011
UK working adults aged 18+ 2011
Water 64%
Coffee 55%
Tea 49%
Fizzy drink (i.e. coke, lemonade, etc.) 14%
Hot chocolate 3%
Other 7%
Not applicable - I do not tend to drink whilst at work 2%
Married/ Civil
Partnership
Living as
married
Separated/
DivorcedWidowed
Never
Married0 1 2 3+
ALL WITH
CHILDREN IN
HOUSEHOLD
(NET)
Refused
Marital Status Children in Household
1121 282 185 48 375 1494 245 209 43 497 20
1104 294 181 32 401 1495 256 199 45 500 16
48% 48% 34% 44% 45% 45% 49% 50% 66% 51% 50%
30% 28% 37% 22% 34% 31% 36% 26% 11% 30% 46%
7% 8% 13% 3% 10% 8% 5% 10% 17% 9% 2%
5% 5% 5% 14% 3% 5% 2% 5% - 3% -
4% 3% 5% 1% 3% 4% 3% 4% - 3% -
6% 9% 7% 16% 6% 7% 4% 5% 6% 4% 2%
1121 282 185 48 375 1494 245 209 43 497 20
1104 294 181 32 401 1495 256 199 45 500 16
62% 67% 64% 57% 69% 64% 66% 64% 75% 66% 51%
57% 50% 53% 74% 49% 53% 61% 60% 55% 60% 49%
51% 47% 49% 49% 46% 49% 51% 47% 48% 49% 52%
12% 21% 12% 7% 16% 14% 17% 13% 6% 14% 19%
2% 5% 0% 2% 4% 3% 2% 3% 1% 2% 10%
6% 9% 8% 1% 8% 8% 6% 6% 6% 6% -
2% 1% 4% - 3% 2% 1% 2% 2% 1% 2%
26 © 2013 YouGov plc. All Rights Reserved yougov.co.uk

Fieldwork: 30th August - 3rd September 2013
In general, how happy or unhappy would you say you are
in your current job?
Total
Which, if any, of the following BEST describes where you
normally eat your lunch?
Unweighted base 2011
UK working adults aged 18+ 2011
I normally eat my lunch at my desk/ at my place of work 46%
I normally eat my lunch at work but away from my desk/ from
my place of work31%
I normally eat my lunch away from work (i.e. pub, cafe, park,
etc.)8%
Other 5%
Not applicable - I do not have time for lunch 3%
Not applicable - I do not tend to eat lunch when I am at work /
do not have a lunch break6%
On a typical working day, which drinks, if any, of the
following do you tend to have whilst at work?
Unweighted base 2011
UK working adults aged 18+ 2011
Water 64%
Coffee 55%
Tea 49%
Fizzy drink (i.e. coke, lemonade, etc.) 14%
Hot chocolate 3%
Other 7%
Not applicable - I do not tend to drink whilst at work 2%
North
East
North
West
Yorkshire
and the
Humber
East
Midlands
West
Midlands
East of
EnglandLondon
South
East
South
WestWales Scotland
Northern
Ireland
Government Region
51 202 155 140 178 205 208 358 214 80 204 16
49 222 167 146 180 225 192 341 191 65 218 14
61% 40% 51% 37% 50% 56% 45% 51% 38% 50% 39% 47%
24% 35% 29% 42% 26% 29% 33% 26% 33% 24% 37% 26%
8% 7% 5% 6% 6% 6% 11% 9% 10% 12% 10% -
0% 5% 7% 4% 5% 4% 3% 4% 6% 4% 6% -
- 5% 1% 3% 5% 2% 2% 4% 6% 6% 3% 16%
6% 9% 7% 8% 8% 4% 7% 6% 6% 4% 5% 10%
51 202 155 140 178 205 208 358 214 80 204 16
49 222 167 146 180 225 192 341 191 65 218 14
70% 62% 66% 61% 65% 73% 73% 66% 55% 67% 53% 55%
57% 58% 57% 47% 54% 57% 51% 54% 64% 37% 54% 44%
47% 52% 51% 53% 39% 59% 46% 51% 52% 69% 34% 45%
22% 14% 13% 9% 15% 13% 14% 12% 14% 5% 21% 21%
4% 1% 1% 3% 5% 3% 2% 4% 2% 4% 3% 4%
4% 6% 6% 18% 7% 6% 2% 7% 6% 10% 10% 15%
- 3% 1% 4% 0% 1% 5% 1% 1% 1% 3% -
27 © 2013 YouGov plc. All Rights Reserved yougov.co.uk
Fieldwork: 30th August - 3rd September 2013
In general, how happy or unhappy would you say you are
in your current job?
Total
Which, if any, of the following BEST describes where you
normally eat your lunch?
Unweighted base 2011
UK working adults aged 18+ 2011
I normally eat my lunch at my desk/ at my place of work 46%
I normally eat my lunch at work but away from my desk/ from
my place of work31%
I normally eat my lunch away from work (i.e. pub, cafe, park,
etc.)8%
Other 5%
Not applicable - I do not have time for lunch 3%
Not applicable - I do not tend to eat lunch when I am at work /
do not have a lunch break6%
On a typical working day, which drinks, if any, of the
following do you tend to have whilst at work?
Unweighted base 2011
UK working adults aged 18+ 2011
Water 64%
Coffee 55%
Tea 49%
Fizzy drink (i.e. coke, lemonade, etc.) 14%
Hot chocolate 3%
Other 7%
Not applicable - I do not tend to drink whilst at work 2%
Facebook LinkedIn Google+ TwitterFull
Time
Part
Time
Working
full time
Working
part time
Working
parentsSocial Media (monthly or more) Full / part time
1216 440 106 481 379 123 1548 463
1218 445 111 484 450 45 1830 181
48% 59% 44% 54% 54% 31% 48% 30%
30% 25% 27% 31% 28% 37% 31% 32%
9% 7% 12% 9% 8% 9% 8% 8%
4% 4% 3% 1% 3% 7% 4% 10%
3% 1% 5% 1% 3% 4% 4% 3%
6% 3% 9% 5% 4% 11% 5% 17%
1216 440 106 481 379 123 1548 463
1218 445 111 484 450 45 1830 181
68% 71% 61% 73% 66% 65% 64% 61%
54% 60% 55% 56% 62% 44% 55% 50%
49% 52% 48% 51% 48% 43% 50% 45%
14% 14% 21% 16% 15% 14% 14% 11%
3% 2% 6% 3% 3% 5% 3% 4%
8% 6% 11% 7% 7% 5% 8% 4%
2% 1% - 0% 1% 2% 2% 2%
28 © 2013 YouGov plc. All Rights Reserved yougov.co.uk
Fieldwork: 30th August - 3rd September 2013
In general, how happy or unhappy would you say you are
in your current job?
Total
Which, if any, of the following BEST describes where you
normally eat your lunch?
Unweighted base 2011
UK working adults aged 18+ 2011
I normally eat my lunch at my desk/ at my place of work 46%
I normally eat my lunch at work but away from my desk/ from
my place of work31%
I normally eat my lunch away from work (i.e. pub, cafe, park,
etc.)8%
Other 5%
Not applicable - I do not have time for lunch 3%
Not applicable - I do not tend to eat lunch when I am at work /
do not have a lunch break6%
On a typical working day, which drinks, if any, of the
following do you tend to have whilst at work?
Unweighted base 2011
UK working adults aged 18+ 2011
Water 64%
Coffee 55%
Tea 49%
Fizzy drink (i.e. coke, lemonade, etc.) 14%
Hot chocolate 3%
Other 7%
Not applicable - I do not tend to drink whilst at work 2%
EmployeeSelf
Employed
Full time
Employee
Full Time
self
employed
Part Time
Employee
Part Time
Self
Employed
1 year
or less
More than 1
year, up to 2
years
More than 2
years, up to 3
years
More than 3
years, up to 4
years
More than 4
years, up to 5
years
6 years or
more
Length of employmentWorking status
1743 268 1373 175 370 93 145 133 106 99 160 1100
1767 244 1620 210 147 34 149 137 120 108 160 1094
48% 34% 50% 34% 31% 28% 59% 54% 47% 45% 49% 46%
32% 28% 32% 27% 32% 33% 32% 27% 39% 33% 34% 31%
8% 10% 8% 10% 7% 9% 7% 9% 7% 12% 6% 8%
3% 14% 3% 13% 8% 20% 1% 2% 3% 4% 1% 4%
3% 4% 3% 5% 3% - 0% 3% 2% 4% 6% 4%
6% 10% 5% 10% 18% 11% 1% 5% 1% 2% 5% 8%
1743 268 1373 175 370 93 145 133 106 99 160 1100
1767 244 1620 210 147 34 149 137 120 108 160 1094
66% 54% 66% 52% 61% 62% 79% 72% 63% 68% 72% 62%
54% 57% 55% 58% 49% 53% 51% 44% 48% 53% 58% 56%
48% 60% 48% 61% 44% 53% 49% 42% 46% 50% 49% 48%
14% 14% 14% 15% 11% 10% 15% 17% 16% 18% 13% 13%
3% 0% 3% - 4% 1% 6% 3% 2% 4% 3% 3%
7% 8% 7% 8% 3% 9% 3% 6% 11% 7% 8% 7%
2% 2% 2% 2% 2% 3% 1% 2% 2% 2% 2% 2%
29 © 2013 YouGov plc. All Rights Reserved yougov.co.uk
Fieldwork: 30th August - 3rd September 2013
In general, how happy or unhappy would you say you are
in your current job?
Total
Which, if any, of the following BEST describes where you
normally eat your lunch?
Unweighted base 2011
UK working adults aged 18+ 2011
I normally eat my lunch at my desk/ at my place of work 46%
I normally eat my lunch at work but away from my desk/ from
my place of work31%
I normally eat my lunch away from work (i.e. pub, cafe, park,
etc.)8%
Other 5%
Not applicable - I do not have time for lunch 3%
Not applicable - I do not tend to eat lunch when I am at work /
do not have a lunch break6%
On a typical working day, which drinks, if any, of the
following do you tend to have whilst at work?
Unweighted base 2011
UK working adults aged 18+ 2011
Water 64%
Coffee 55%
Tea 49%
Fizzy drink (i.e. coke, lemonade, etc.) 14%
Hot chocolate 3%
Other 7%
Not applicable - I do not tend to drink whilst at work 2%
High
Level
MId
Level
Low
/Entry
Level
Other
Private
sector firm
or
company
Nationalised
industry or
public
corporation
Other
public
sector
employer
Charity/
voluntary
sector
Level of responsibility Employment sector
422 708 386 495 1464 22 421 104
419 772 331 489 1467 26 381 138
43% 54% 49% 36% 44% 41% 54% 45%
27% 29% 34% 37% 31% 39% 28% 39%
12% 6% 7% 8% 9% 15% 7% 6%
9% 1% 2% 7% 6% - 1% 5%
4% 4% 2% 3% 3% 4% 4% 1%
5% 6% 6% 9% 7% 1% 6% 5%
422 708 386 495 1464 22 421 104
419 772 331 489 1467 26 381 138
61% 66% 70% 59% 62% 79% 70% 72%
64% 58% 45% 48% 56% 59% 52% 43%
58% 46% 50% 47% 48% 60% 48% 61%
13% 17% 14% 10% 14% 16% 13% 13%
3% 3% 3% 3% 3% 13% 2% -
5% 6% 8% 10% 8% 5% 5% 9%
1% 1% 3% 3% 2% - 2% 2%
30 © 2013 YouGov plc. All Rights Reserved yougov.co.uk
Fieldwork: 30th August - 3rd September 2013
Male Female 18-34 35-44 45-54 55+ ABC1 C2DE North Midlands East London South Wales ScotlandNorthern
Ireland
Age Region
Total
Gender Social Grade
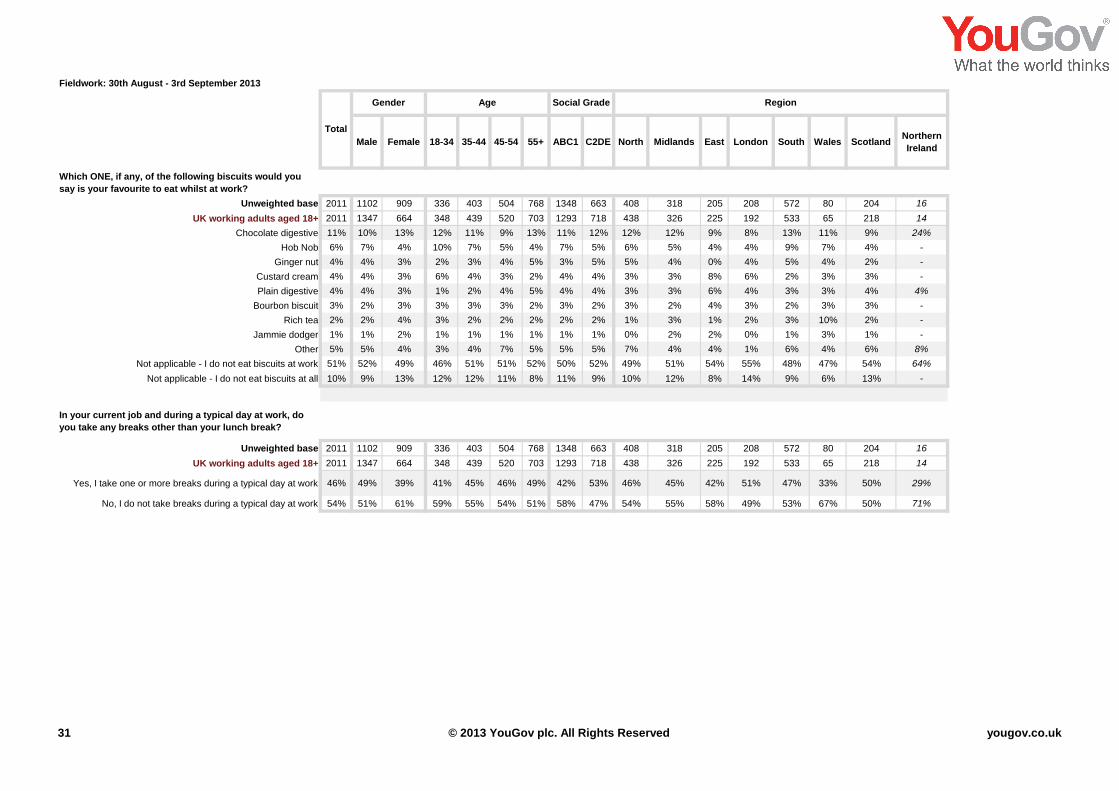
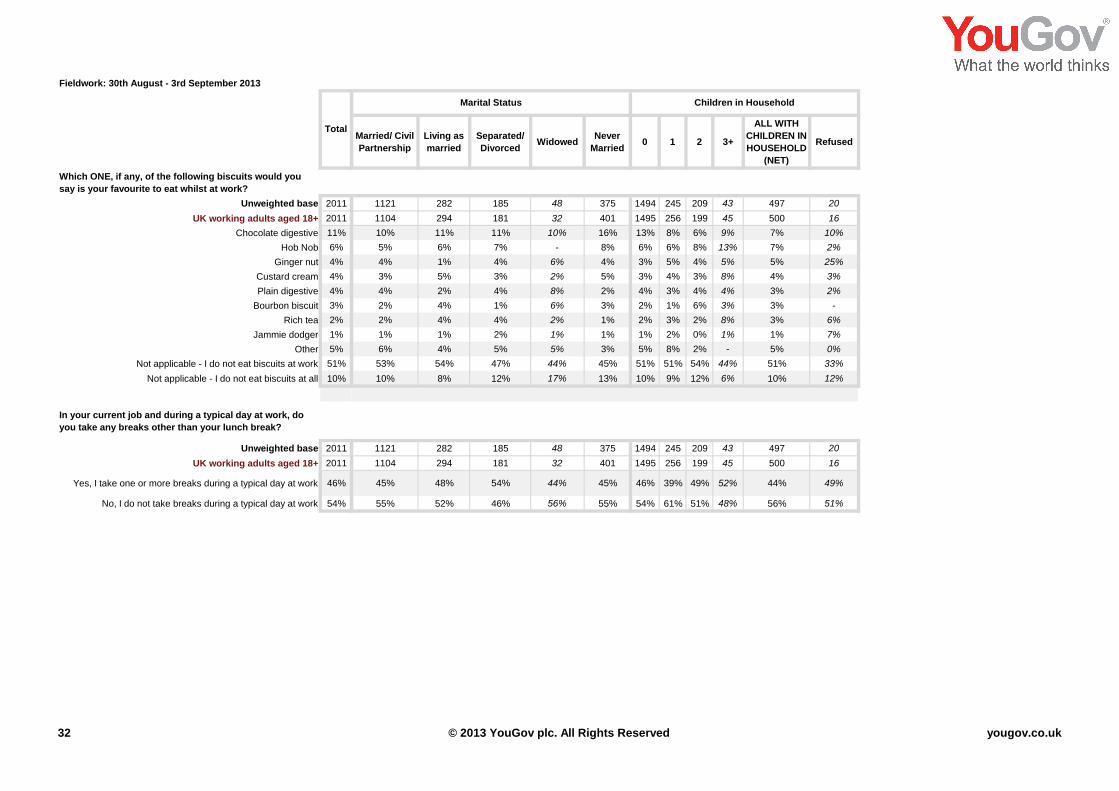
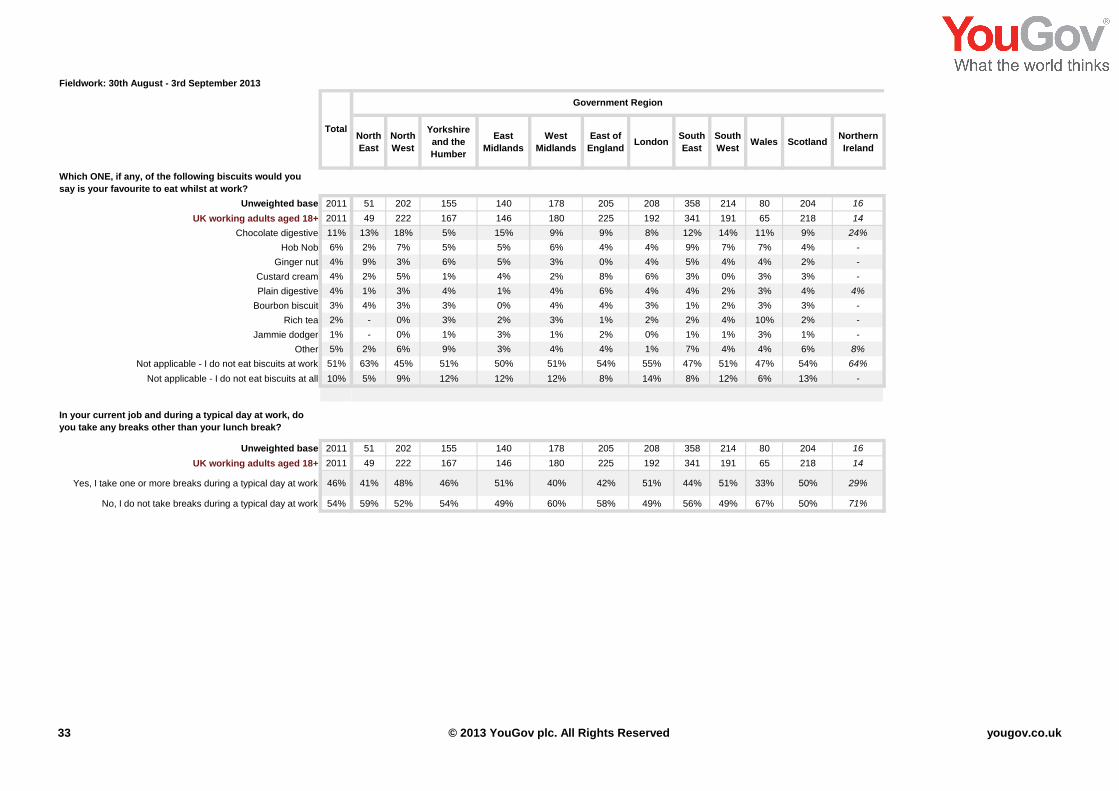
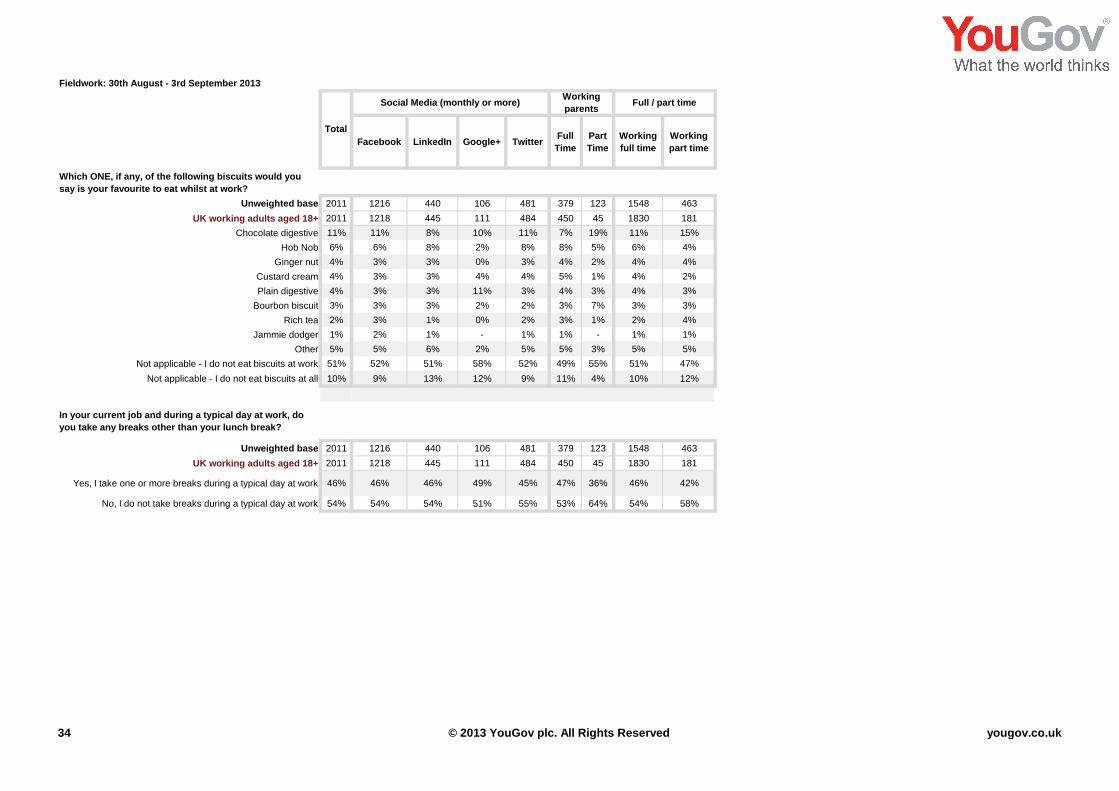
Which ONE, if any, of the following biscuits would you
say is your favourite to eat whilst at work?
Unweighted base 2011 1102 909 336 403 504 768 1348 663 408 318 205 208 572 80 204 16
UK working adults aged 18+ 2011 1347 664 348 439 520 703 1293 718 438 326 225 192 533 65 218 14
Chocolate digestive 11% 10% 13% 12% 11% 9% 13% 11% 12% 12% 12% 9% 8% 13% 11% 9% 24%
Hob Nob 6% 7% 4% 10% 7% 5% 4% 7% 5% 6% 5% 4% 4% 9% 7% 4% -
Ginger nut 4% 4% 3% 2% 3% 4% 5% 3% 5% 5% 4% 0% 4% 5% 4% 2% -
Custard cream 4% 4% 3% 6% 4% 3% 2% 4% 4% 3% 3% 8% 6% 2% 3% 3% -
Plain digestive 4% 4% 3% 1% 2% 4% 5% 4% 4% 3% 3% 6% 4% 3% 3% 4% 4%
Bourbon biscuit 3% 2% 3% 3% 3% 3% 2% 3% 2% 3% 2% 4% 3% 2% 3% 3% -
Rich tea 2% 2% 4% 3% 2% 2% 2% 2% 2% 1% 3% 1% 2% 3% 10% 2% -
Jammie dodger 1% 1% 2% 1% 1% 1% 1% 1% 1% 0% 2% 2% 0% 1% 3% 1% -
Other 5% 5% 4% 3% 4% 7% 5% 5% 5% 7% 4% 4% 1% 6% 4% 6% 8%
Not applicable - I do not eat biscuits at work 51% 52% 49% 46% 51% 51% 52% 50% 52% 49% 51% 54% 55% 48% 47% 54% 64%
Not applicable - I do not eat biscuits at all 10% 9% 13% 12% 12% 11% 8% 11% 9% 10% 12% 8% 14% 9% 6% 13% -
In your current job and during a typical day at work, do
you take any breaks other than your lunch break?
Unweighted base 2011 1102 909 336 403 504 768 1348 663 408 318 205 208 572 80 204 16
UK working adults aged 18+ 2011 1347 664 348 439 520 703 1293 718 438 326 225 192 533 65 218 14
Yes, I take one or more breaks during a typical day at work 46% 49% 39% 41% 45% 46% 49% 42% 53% 46% 45% 42% 51% 47% 33% 50% 29%
No, I do not take breaks during a typical day at work 54% 51% 61% 59% 55% 54% 51% 58% 47% 54% 55% 58% 49% 53% 67% 50% 71%
31 © 2013 YouGov plc. All Rights Reserved yougov.co.uk
Fieldwork: 30th August - 3rd September 2013
In general, how happy or unhappy would you say you are
in your current job?
Total
Which ONE, if any, of the following biscuits would you
say is your favourite to eat whilst at work?
Unweighted base 2011
UK working adults aged 18+ 2011
Chocolate digestive 11%
Hob Nob 6%
Ginger nut 4%
Custard cream 4%
Plain digestive 4%
Bourbon biscuit 3%
Rich tea 2%
Jammie dodger 1%
Other 5%
Not applicable - I do not eat biscuits at work 51%
Not applicable - I do not eat biscuits at all 10%
In your current job and during a typical day at work, do
you take any breaks other than your lunch break?
Unweighted base 2011
UK working adults aged 18+ 2011
Yes, I take one or more breaks during a typical day at work 46%
No, I do not take breaks during a typical day at work 54%
Married/ Civil
Partnership
Living as
married
Separated/
DivorcedWidowed
Never
Married0 1 2 3+
ALL WITH
CHILDREN IN
HOUSEHOLD
(NET)
Refused
Marital Status Children in Household
1121 282 185 48 375 1494 245 209 43 497 20
1104 294 181 32 401 1495 256 199 45 500 16
10% 11% 11% 10% 16% 13% 8% 6% 9% 7% 10%
5% 6% 7% - 8% 6% 6% 8% 13% 7% 2%
4% 1% 4% 6% 4% 3% 5% 4% 5% 5% 25%
3% 5% 3% 2% 5% 3% 4% 3% 8% 4% 3%
4% 2% 4% 8% 2% 4% 3% 4% 4% 3% 2%
2% 4% 1% 6% 3% 2% 1% 6% 3% 3% -
2% 4% 4% 2% 1% 2% 3% 2% 8% 3% 6%
1% 1% 2% 1% 1% 1% 2% 0% 1% 1% 7%
6% 4% 5% 5% 3% 5% 8% 2% - 5% 0%
53% 54% 47% 44% 45% 51% 51% 54% 44% 51% 33%
10% 8% 12% 17% 13% 10% 9% 12% 6% 10% 12%
1121 282 185 48 375 1494 245 209 43 497 20
1104 294 181 32 401 1495 256 199 45 500 16
45% 48% 54% 44% 45% 46% 39% 49% 52% 44% 49%
55% 52% 46% 56% 55% 54% 61% 51% 48% 56% 51%
32 © 2013 YouGov plc. All Rights Reserved yougov.co.uk
Fieldwork: 30th August - 3rd September 2013
In general, how happy or unhappy would you say you are
in your current job?
Total
Which ONE, if any, of the following biscuits would you
say is your favourite to eat whilst at work?
Unweighted base 2011
UK working adults aged 18+ 2011
Chocolate digestive 11%
Hob Nob 6%
Ginger nut 4%
Custard cream 4%
Plain digestive 4%
Bourbon biscuit 3%
Rich tea 2%
Jammie dodger 1%
Other 5%
Not applicable - I do not eat biscuits at work 51%
Not applicable - I do not eat biscuits at all 10%
In your current job and during a typical day at work, do
you take any breaks other than your lunch break?
Unweighted base 2011
UK working adults aged 18+ 2011
Yes, I take one or more breaks during a typical day at work 46%
No, I do not take breaks during a typical day at work 54%
North
East
North
West
Yorkshire
and the
Humber
East
Midlands
West
Midlands
East of
EnglandLondon
South
East
South
WestWales Scotland
Northern
Ireland
Government Region
51 202 155 140 178 205 208 358 214 80 204 16
49 222 167 146 180 225 192 341 191 65 218 14
13% 18% 5% 15% 9% 9% 8% 12% 14% 11% 9% 24%
2% 7% 5% 5% 6% 4% 4% 9% 7% 7% 4% -
9% 3% 6% 5% 3% 0% 4% 5% 4% 4% 2% -
2% 5% 1% 4% 2% 8% 6% 3% 0% 3% 3% -
1% 3% 4% 1% 4% 6% 4% 4% 2% 3% 4% 4%
4% 3% 3% 0% 4% 4% 3% 1% 2% 3% 3% -
- 0% 3% 2% 3% 1% 2% 2% 4% 10% 2% -
- 0% 1% 3% 1% 2% 0% 1% 1% 3% 1% -
2% 6% 9% 3% 4% 4% 1% 7% 4% 4% 6% 8%
63% 45% 51% 50% 51% 54% 55% 47% 51% 47% 54% 64%
5% 9% 12% 12% 12% 8% 14% 8% 12% 6% 13% -
51 202 155 140 178 205 208 358 214 80 204 16
49 222 167 146 180 225 192 341 191 65 218 14
41% 48% 46% 51% 40% 42% 51% 44% 51% 33% 50% 29%
59% 52% 54% 49% 60% 58% 49% 56% 49% 67% 50% 71%
33 © 2013 YouGov plc. All Rights Reserved yougov.co.uk
Fieldwork: 30th August - 3rd September 2013
In general, how happy or unhappy would you say you are
in your current job?
Total
Which ONE, if any, of the following biscuits would you
say is your favourite to eat whilst at work?
Unweighted base 2011
UK working adults aged 18+ 2011
Chocolate digestive 11%
Hob Nob 6%
Ginger nut 4%
Custard cream 4%
Plain digestive 4%
Bourbon biscuit 3%
Rich tea 2%
Jammie dodger 1%
Other 5%
Not applicable - I do not eat biscuits at work 51%
Not applicable - I do not eat biscuits at all 10%
In your current job and during a typical day at work, do
you take any breaks other than your lunch break?
Unweighted base 2011
UK working adults aged 18+ 2011
Yes, I take one or more breaks during a typical day at work 46%
No, I do not take breaks during a typical day at work 54%
Facebook LinkedIn Google+ TwitterFull
Time
Part
Time
Working
full time
Working
part time
Working
parentsSocial Media (monthly or more) Full / part time
1216 440 106 481 379 123 1548 463
1218 445 111 484 450 45 1830 181
11% 8% 10% 11% 7% 19% 11% 15%
6% 8% 2% 8% 8% 5% 6% 4%
3% 3% 0% 3% 4% 2% 4% 4%
3% 3% 4% 4% 5% 1% 4% 2%
3% 3% 11% 3% 4% 3% 4% 3%
3% 3% 2% 2% 3% 7% 3% 3%
3% 1% 0% 2% 3% 1% 2% 4%
2% 1% - 1% 1% - 1% 1%
5% 6% 2% 5% 5% 3% 5% 5%
52% 51% 58% 52% 49% 55% 51% 47%
9% 13% 12% 9% 11% 4% 10% 12%
1216 440 106 481 379 123 1548 463
1218 445 111 484 450 45 1830 181
46% 46% 49% 45% 47% 36% 46% 42%
54% 54% 51% 55% 53% 64% 54% 58%
34 © 2013 YouGov plc. All Rights Reserved yougov.co.uk
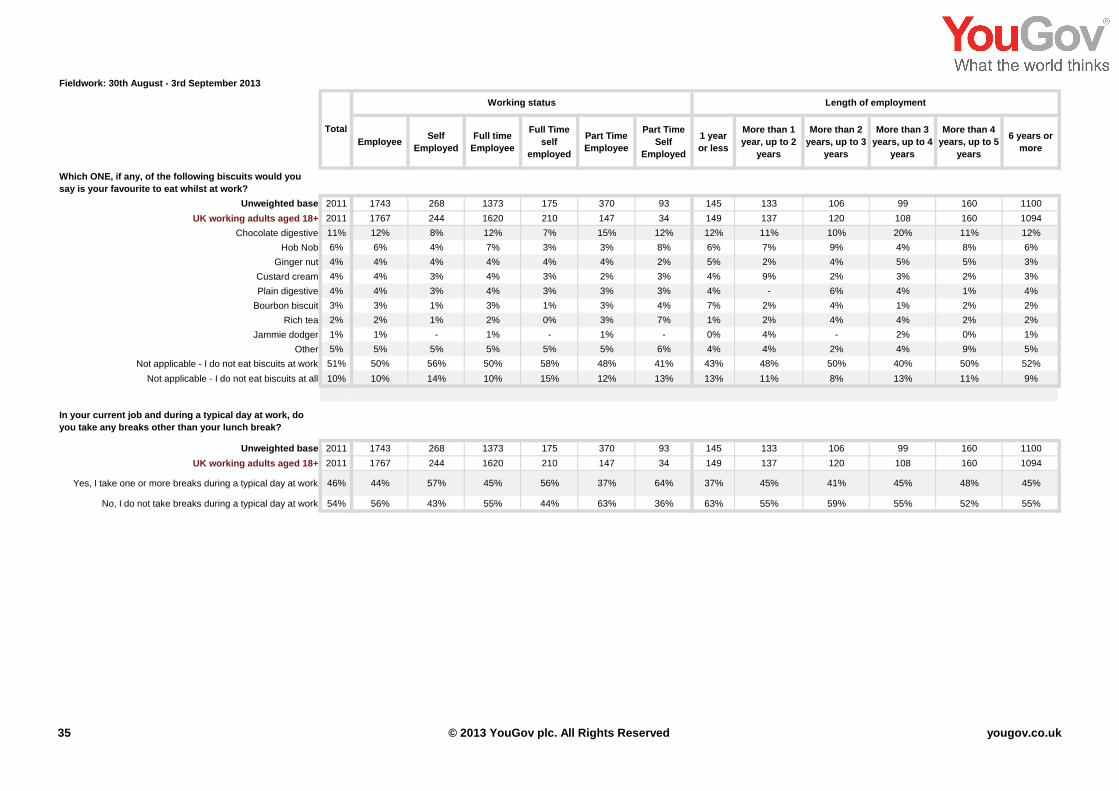
Fieldwork: 30th August - 3rd September 2013
In general, how happy or unhappy would you say you are
in your current job?
Total
Which ONE, if any, of the following biscuits would you
say is your favourite to eat whilst at work?
Unweighted base 2011
UK working adults aged 18+ 2011
Chocolate digestive 11%
Hob Nob 6%
Ginger nut 4%
Custard cream 4%
Plain digestive 4%
Bourbon biscuit 3%
Rich tea 2%
Jammie dodger 1%
Other 5%
Not applicable - I do not eat biscuits at work 51%
Not applicable - I do not eat biscuits at all 10%
In your current job and during a typical day at work, do
you take any breaks other than your lunch break?
Unweighted base 2011
UK working adults aged 18+ 2011
Yes, I take one or more breaks during a typical day at work 46%
No, I do not take breaks during a typical day at work 54%
EmployeeSelf
Employed
Full time
Employee
Full Time
self
employed
Part Time
Employee
Part Time
Self
Employed
1 year
or less
More than 1
year, up to 2
years
More than 2
years, up to 3
years
More than 3
years, up to 4
years
More than 4
years, up to 5
years
6 years or
more
Length of employmentWorking status
1743 268 1373 175 370 93 145 133 106 99 160 1100
1767 244 1620 210 147 34 149 137 120 108 160 1094
12% 8% 12% 7% 15% 12% 12% 11% 10% 20% 11% 12%
6% 4% 7% 3% 3% 8% 6% 7% 9% 4% 8% 6%
4% 4% 4% 4% 4% 2% 5% 2% 4% 5% 5% 3%
4% 3% 4% 3% 2% 3% 4% 9% 2% 3% 2% 3%
4% 3% 4% 3% 3% 3% 4% - 6% 4% 1% 4%
3% 1% 3% 1% 3% 4% 7% 2% 4% 1% 2% 2%
2% 1% 2% 0% 3% 7% 1% 2% 4% 4% 2% 2%
1% - 1% - 1% - 0% 4% - 2% 0% 1%
5% 5% 5% 5% 5% 6% 4% 4% 2% 4% 9% 5%
50% 56% 50% 58% 48% 41% 43% 48% 50% 40% 50% 52%
10% 14% 10% 15% 12% 13% 13% 11% 8% 13% 11% 9%
1743 268 1373 175 370 93 145 133 106 99 160 1100
1767 244 1620 210 147 34 149 137 120 108 160 1094
44% 57% 45% 56% 37% 64% 37% 45% 41% 45% 48% 45%
56% 43% 55% 44% 63% 36% 63% 55% 59% 55% 52% 55%
35 © 2013 YouGov plc. All Rights Reserved yougov.co.uk
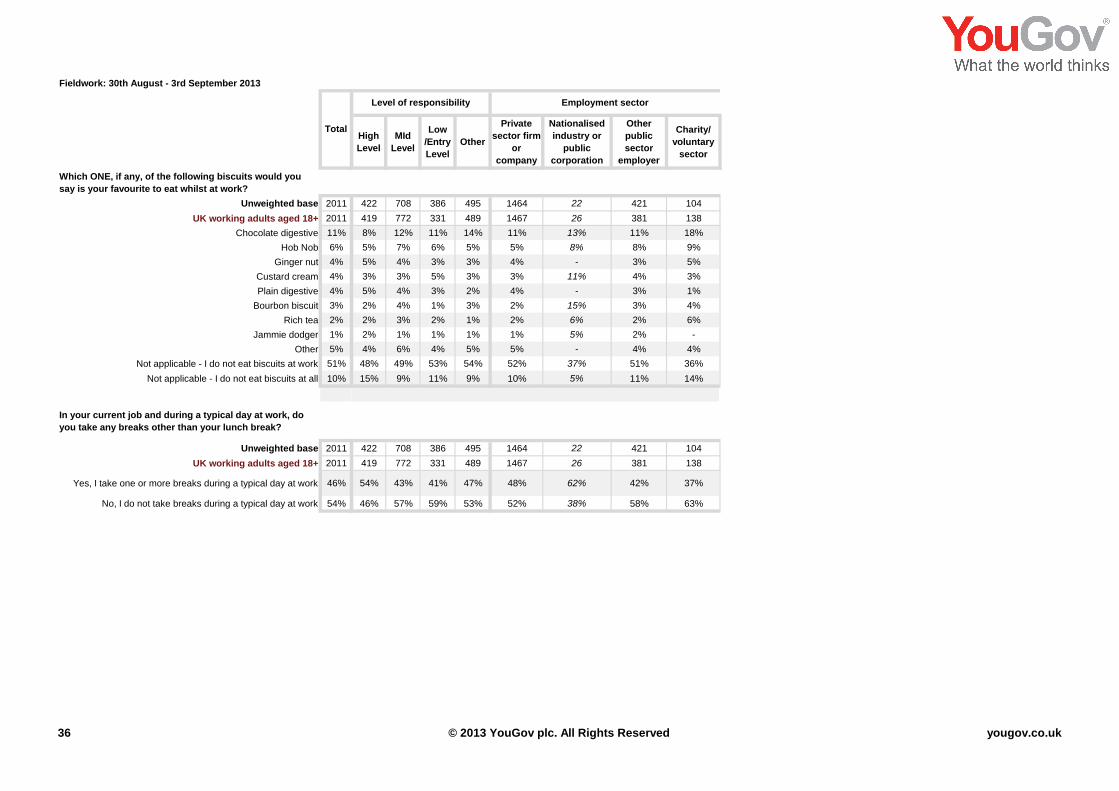
Fieldwork: 30th August - 3rd September 2013
In general, how happy or unhappy would you say you are
in your current job?
Total
Which ONE, if any, of the following biscuits would you
say is your favourite to eat whilst at work?
Unweighted base 2011
UK working adults aged 18+ 2011
Chocolate digestive 11%
Hob Nob 6%
Ginger nut 4%
Custard cream 4%
Plain digestive 4%
Bourbon biscuit 3%
Rich tea 2%
Jammie dodger 1%
Other 5%
Not applicable - I do not eat biscuits at work 51%
Not applicable - I do not eat biscuits at all 10%
In your current job and during a typical day at work, do
you take any breaks other than your lunch break?
Unweighted base 2011
UK working adults aged 18+ 2011
Yes, I take one or more breaks during a typical day at work 46%
No, I do not take breaks during a typical day at work 54%
High
Level
MId
Level
Low
/Entry
Level
Other
Private
sector firm
or
company
Nationalised
industry or
public
corporation
Other
public
sector
employer
Charity/
voluntary
sector
Level of responsibility Employment sector
422 708 386 495 1464 22 421 104
419 772 331 489 1467 26 381 138
8% 12% 11% 14% 11% 13% 11% 18%
5% 7% 6% 5% 5% 8% 8% 9%
5% 4% 3% 3% 4% - 3% 5%
3% 3% 5% 3% 3% 11% 4% 3%
5% 4% 3% 2% 4% - 3% 1%
2% 4% 1% 3% 2% 15% 3% 4%
2% 3% 2% 1% 2% 6% 2% 6%
2% 1% 1% 1% 1% 5% 2% -
4% 6% 4% 5% 5% - 4% 4%
48% 49% 53% 54% 52% 37% 51% 36%
15% 9% 11% 9% 10% 5% 11% 14%
422 708 386 495 1464 22 421 104
419 772 331 489 1467 26 381 138
54% 43% 41% 47% 48% 62% 42% 37%
46% 57% 59% 53% 52% 38% 58% 63%
36 © 2013 YouGov plc. All Rights Reserved yougov.co.uk
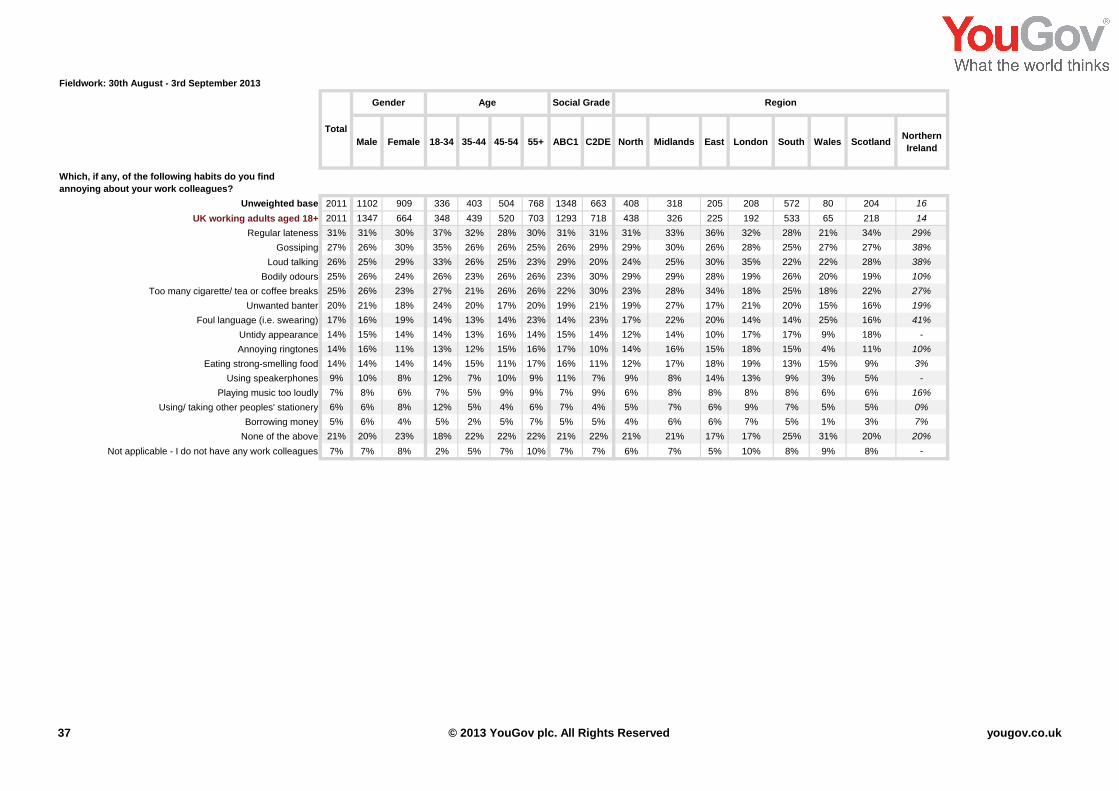
Fieldwork: 30th August - 3rd September 2013
Male Female 18-34 35-44 45-54 55+ ABC1 C2DE North Midlands East London South Wales ScotlandNorthern
Ireland
Age Region
Total
Gender Social Grade
Which, if any, of the following habits do you find
annoying about your work colleagues?
Unweighted base 2011 1102 909 336 403 504 768 1348 663 408 318 205 208 572 80 204 16
UK working adults aged 18+ 2011 1347 664 348 439 520 703 1293 718 438 326 225 192 533 65 218 14
Regular lateness 31% 31% 30% 37% 32% 28% 30% 31% 31% 31% 33% 36% 32% 28% 21% 34% 29%
Gossiping 27% 26% 30% 35% 26% 26% 25% 26% 29% 29% 30% 26% 28% 25% 27% 27% 38%
Loud talking 26% 25% 29% 33% 26% 25% 23% 29% 20% 24% 25% 30% 35% 22% 22% 28% 38%
Bodily odours 25% 26% 24% 26% 23% 26% 26% 23% 30% 29% 29% 28% 19% 26% 20% 19% 10%
Too many cigarette/ tea or coffee breaks 25% 26% 23% 27% 21% 26% 26% 22% 30% 23% 28% 34% 18% 25% 18% 22% 27%
Unwanted banter 20% 21% 18% 24% 20% 17% 20% 19% 21% 19% 27% 17% 21% 20% 15% 16% 19%
Foul language (i.e. swearing) 17% 16% 19% 14% 13% 14% 23% 14% 23% 17% 22% 20% 14% 14% 25% 16% 41%
Untidy appearance 14% 15% 14% 14% 13% 16% 14% 15% 14% 12% 14% 10% 17% 17% 9% 18% -
Annoying ringtones 14% 16% 11% 13% 12% 15% 16% 17% 10% 14% 16% 15% 18% 15% 4% 11% 10%
Eating strong-smelling food 14% 14% 14% 14% 15% 11% 17% 16% 11% 12% 17% 18% 19% 13% 15% 9% 3%
Using speakerphones 9% 10% 8% 12% 7% 10% 9% 11% 7% 9% 8% 14% 13% 9% 3% 5% -
Playing music too loudly 7% 8% 6% 7% 5% 9% 9% 7% 9% 6% 8% 8% 8% 8% 6% 6% 16%
Using/ taking other peoples' stationery 6% 6% 8% 12% 5% 4% 6% 7% 4% 5% 7% 6% 9% 7% 5% 5% 0%
Borrowing money 5% 6% 4% 5% 2% 5% 7% 5% 5% 4% 6% 6% 7% 5% 1% 3% 7%
None of the above 21% 20% 23% 18% 22% 22% 22% 21% 22% 21% 21% 17% 17% 25% 31% 20% 20%
Not applicable - I do not have any work colleagues 7% 7% 8% 2% 5% 7% 10% 7% 7% 6% 7% 5% 10% 8% 9% 8% -
37 © 2013 YouGov plc. All Rights Reserved yougov.co.uk
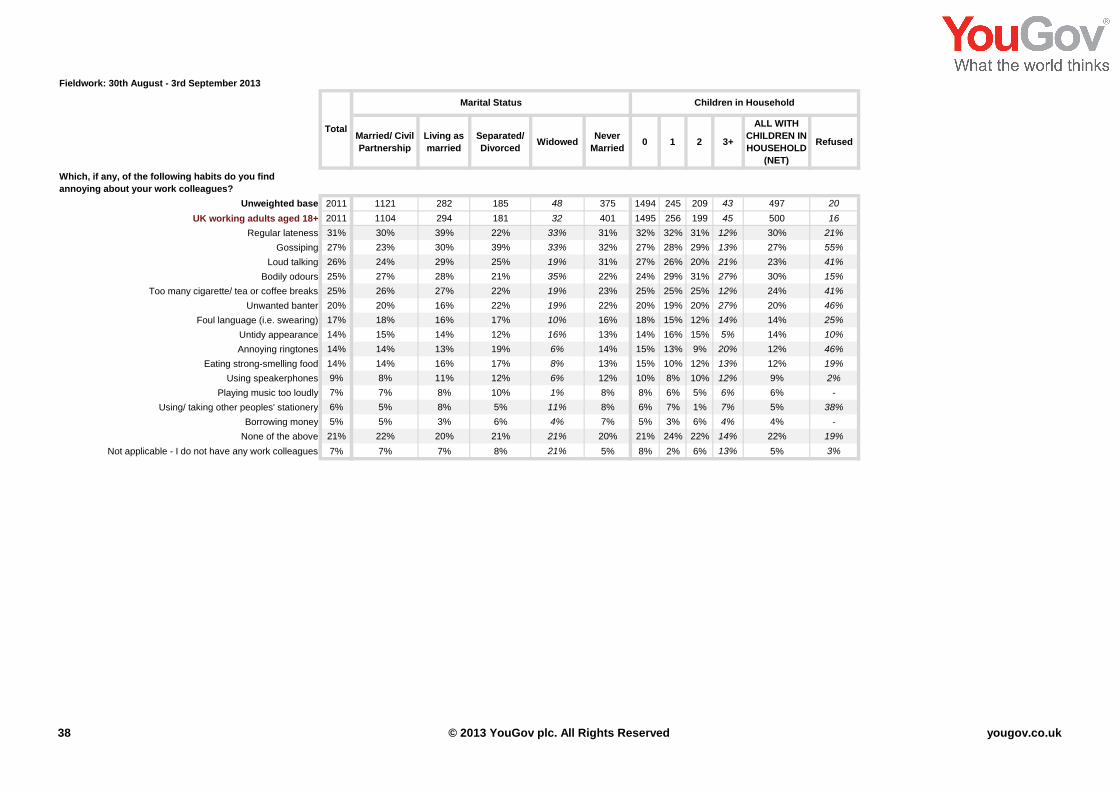
Fieldwork: 30th August - 3rd September 2013
In general, how happy or unhappy would you say you are
in your current job?
Total
Which, if any, of the following habits do you find
annoying about your work colleagues?
Unweighted base 2011
UK working adults aged 18+ 2011
Regular lateness 31%
Gossiping 27%
Loud talking 26%
Bodily odours 25%
Too many cigarette/ tea or coffee breaks 25%
Unwanted banter 20%
Foul language (i.e. swearing) 17%
Untidy appearance 14%
Annoying ringtones 14%
Eating strong-smelling food 14%
Using speakerphones 9%
Playing music too loudly 7%
Using/ taking other peoples' stationery 6%
Borrowing money 5%
None of the above 21%
Not applicable - I do not have any work colleagues 7%
Married/ Civil
Partnership
Living as
married
Separated/
DivorcedWidowed
Never
Married0 1 2 3+
ALL WITH
CHILDREN IN
HOUSEHOLD
(NET)
Refused
Marital Status Children in Household
1121 282 185 48 375 1494 245 209 43 497 20
1104 294 181 32 401 1495 256 199 45 500 16
30% 39% 22% 33% 31% 32% 32% 31% 12% 30% 21%
23% 30% 39% 33% 32% 27% 28% 29% 13% 27% 55%
24% 29% 25% 19% 31% 27% 26% 20% 21% 23% 41%
27% 28% 21% 35% 22% 24% 29% 31% 27% 30% 15%
26% 27% 22% 19% 23% 25% 25% 25% 12% 24% 41%
20% 16% 22% 19% 22% 20% 19% 20% 27% 20% 46%
18% 16% 17% 10% 16% 18% 15% 12% 14% 14% 25%
15% 14% 12% 16% 13% 14% 16% 15% 5% 14% 10%
14% 13% 19% 6% 14% 15% 13% 9% 20% 12% 46%
14% 16% 17% 8% 13% 15% 10% 12% 13% 12% 19%
8% 11% 12% 6% 12% 10% 8% 10% 12% 9% 2%
7% 8% 10% 1% 8% 8% 6% 5% 6% 6% -
5% 8% 5% 11% 8% 6% 7% 1% 7% 5% 38%
5% 3% 6% 4% 7% 5% 3% 6% 4% 4% -
22% 20% 21% 21% 20% 21% 24% 22% 14% 22% 19%
7% 7% 8% 21% 5% 8% 2% 6% 13% 5% 3%
38 © 2013 YouGov plc. All Rights Reserved yougov.co.uk
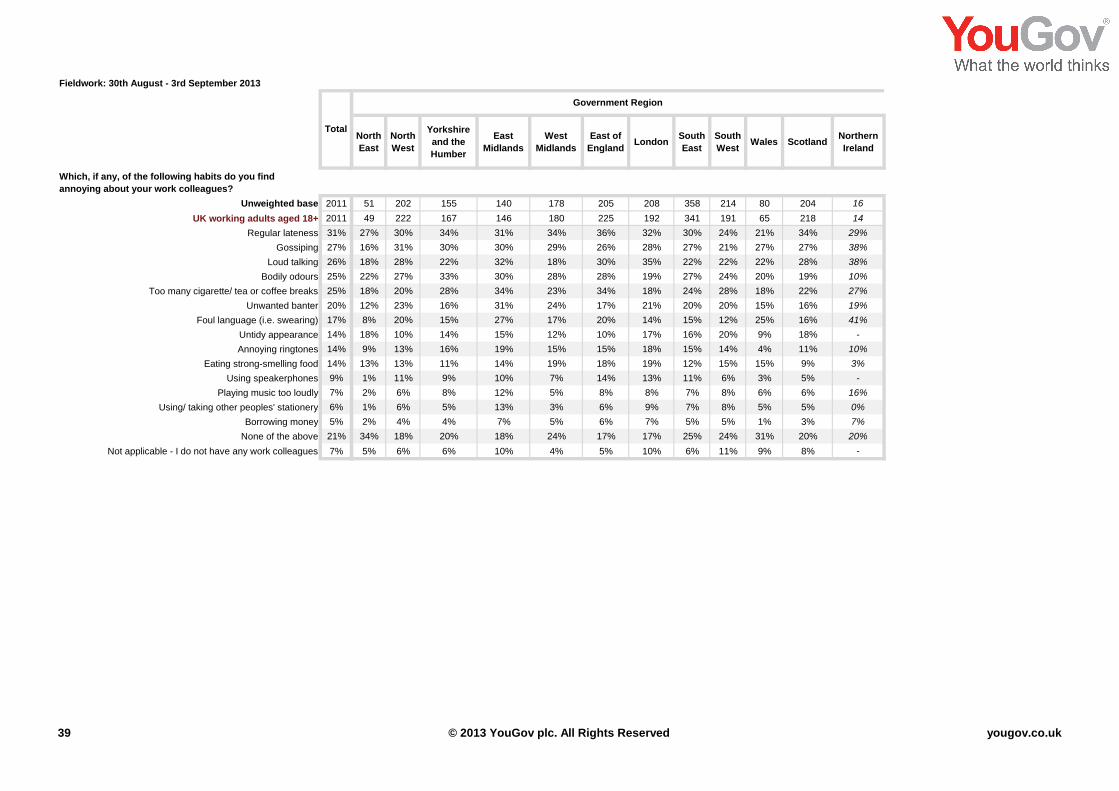
Fieldwork: 30th August - 3rd September 2013
In general, how happy or unhappy would you say you are
in your current job?
Total
Which, if any, of the following habits do you find
annoying about your work colleagues?
Unweighted base 2011
UK working adults aged 18+ 2011
Regular lateness 31%
Gossiping 27%
Loud talking 26%
Bodily odours 25%
Too many cigarette/ tea or coffee breaks 25%
Unwanted banter 20%
Foul language (i.e. swearing) 17%
Untidy appearance 14%
Annoying ringtones 14%
Eating strong-smelling food 14%
Using speakerphones 9%
Playing music too loudly 7%
Using/ taking other peoples' stationery 6%
Borrowing money 5%
None of the above 21%
Not applicable - I do not have any work colleagues 7%
North
East
North
West
Yorkshire
and the
Humber
East
Midlands
West
Midlands
East of
EnglandLondon
South
East
South
WestWales Scotland
Northern
Ireland
Government Region
51 202 155 140 178 205 208 358 214 80 204 16
49 222 167 146 180 225 192 341 191 65 218 14
27% 30% 34% 31% 34% 36% 32% 30% 24% 21% 34% 29%
16% 31% 30% 30% 29% 26% 28% 27% 21% 27% 27% 38%
18% 28% 22% 32% 18% 30% 35% 22% 22% 22% 28% 38%
22% 27% 33% 30% 28% 28% 19% 27% 24% 20% 19% 10%
18% 20% 28% 34% 23% 34% 18% 24% 28% 18% 22% 27%
12% 23% 16% 31% 24% 17% 21% 20% 20% 15% 16% 19%
8% 20% 15% 27% 17% 20% 14% 15% 12% 25% 16% 41%
18% 10% 14% 15% 12% 10% 17% 16% 20% 9% 18% -
9% 13% 16% 19% 15% 15% 18% 15% 14% 4% 11% 10%
13% 13% 11% 14% 19% 18% 19% 12% 15% 15% 9% 3%
1% 11% 9% 10% 7% 14% 13% 11% 6% 3% 5% -
2% 6% 8% 12% 5% 8% 8% 7% 8% 6% 6% 16%
1% 6% 5% 13% 3% 6% 9% 7% 8% 5% 5% 0%
2% 4% 4% 7% 5% 6% 7% 5% 5% 1% 3% 7%
34% 18% 20% 18% 24% 17% 17% 25% 24% 31% 20% 20%
5% 6% 6% 10% 4% 5% 10% 6% 11% 9% 8% -
39 © 2013 YouGov plc. All Rights Reserved yougov.co.uk
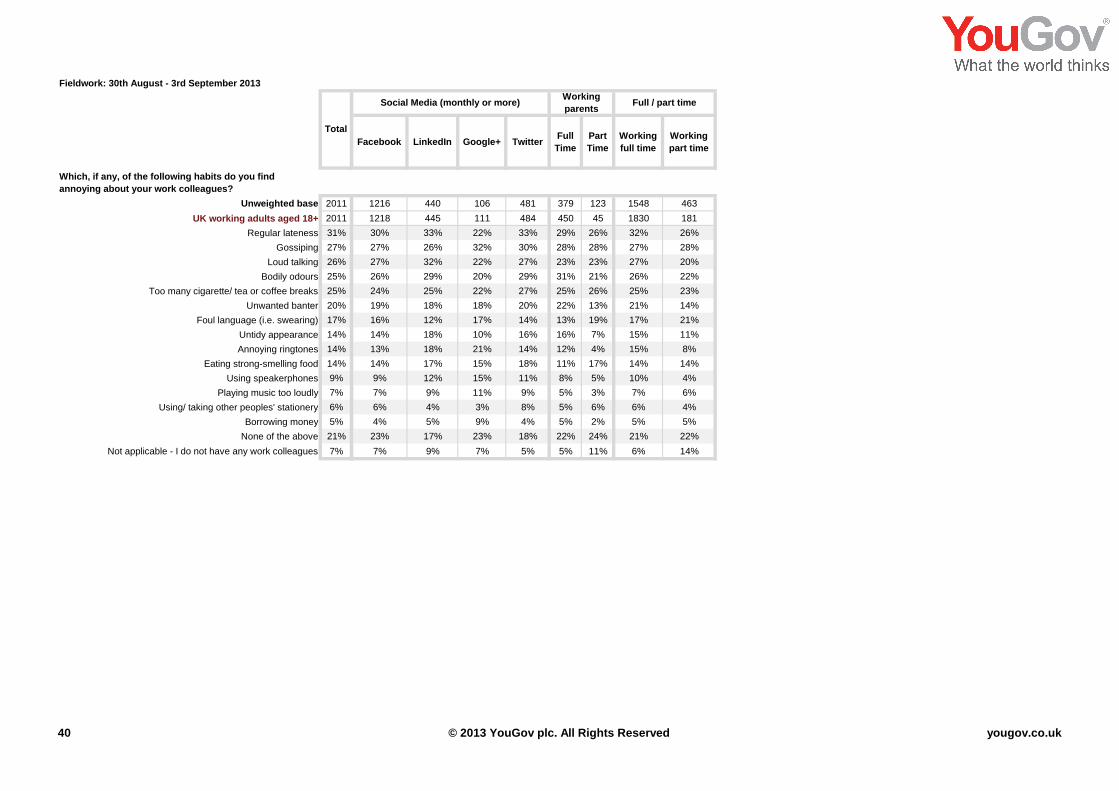
Fieldwork: 30th August - 3rd September 2013
In general, how happy or unhappy would you say you are
in your current job?
Total
Which, if any, of the following habits do you find
annoying about your work colleagues?
Unweighted base 2011
UK working adults aged 18+ 2011
Regular lateness 31%
Gossiping 27%
Loud talking 26%
Bodily odours 25%
Too many cigarette/ tea or coffee breaks 25%
Unwanted banter 20%
Foul language (i.e. swearing) 17%
Untidy appearance 14%
Annoying ringtones 14%
Eating strong-smelling food 14%
Using speakerphones 9%
Playing music too loudly 7%
Using/ taking other peoples' stationery 6%
Borrowing money 5%
None of the above 21%
Not applicable - I do not have any work colleagues 7%
Facebook LinkedIn Google+ TwitterFull
Time
Part
Time
Working
full time
Working
part time
Working
parentsSocial Media (monthly or more) Full / part time
1216 440 106 481 379 123 1548 463
1218 445 111 484 450 45 1830 181
30% 33% 22% 33% 29% 26% 32% 26%
27% 26% 32% 30% 28% 28% 27% 28%
27% 32% 22% 27% 23% 23% 27% 20%
26% 29% 20% 29% 31% 21% 26% 22%
24% 25% 22% 27% 25% 26% 25% 23%
19% 18% 18% 20% 22% 13% 21% 14%
16% 12% 17% 14% 13% 19% 17% 21%
14% 18% 10% 16% 16% 7% 15% 11%
13% 18% 21% 14% 12% 4% 15% 8%
14% 17% 15% 18% 11% 17% 14% 14%
9% 12% 15% 11% 8% 5% 10% 4%
7% 9% 11% 9% 5% 3% 7% 6%
6% 4% 3% 8% 5% 6% 6% 4%
4% 5% 9% 4% 5% 2% 5% 5%
23% 17% 23% 18% 22% 24% 21% 22%
7% 9% 7% 5% 5% 11% 6% 14%
40 © 2013 YouGov plc. All Rights Reserved yougov.co.uk

Fieldwork: 30th August - 3rd September 2013
In general, how happy or unhappy would you say you are
in your current job?
Total
Which, if any, of the following habits do you find
annoying about your work colleagues?
Unweighted base 2011
UK working adults aged 18+ 2011
Regular lateness 31%
Gossiping 27%
Loud talking 26%
Bodily odours 25%
Too many cigarette/ tea or coffee breaks 25%
Unwanted banter 20%
Foul language (i.e. swearing) 17%
Untidy appearance 14%
Annoying ringtones 14%
Eating strong-smelling food 14%
Using speakerphones 9%
Playing music too loudly 7%
Using/ taking other peoples' stationery 6%
Borrowing money 5%
None of the above 21%
Not applicable - I do not have any work colleagues 7%
EmployeeSelf
Employed
Full time
Employee
Full Time
self
employed
Part Time
Employee
Part Time
Self
Employed
1 year
or less
More than 1
year, up to 2
years
More than 2
years, up to 3
years
More than 3
years, up to 4
years
More than 4
years, up to 5
years
6 years or
more
Length of employmentWorking status
1743 268 1373 175 370 93 145 133 106 99 160 1100
1767 244 1620 210 147 34 149 137 120 108 160 1094
32% 22% 33% 22% 27% 21% 39% 29% 33% 26% 30% 33%
29% 18% 28% 18% 31% 18% 30% 35% 24% 37% 35% 27%
27% 18% 28% 19% 21% 14% 32% 22% 22% 18% 24% 29%
26% 24% 26% 24% 22% 25% 32% 20% 30% 27% 20% 26%
26% 14% 27% 13% 24% 19% 29% 28% 18% 28% 24% 27%
21% 15% 21% 17% 16% 6% 18% 18% 16% 30% 21% 21%
17% 16% 17% 15% 21% 22% 18% 11% 18% 15% 17% 18%
14% 15% 15% 16% 12% 9% 19% 8% 17% 15% 16% 14%
15% 12% 15% 12% 6% 14% 18% 11% 9% 13% 15% 15%
15% 10% 15% 9% 13% 16% 15% 16% 15% 15% 12% 15%
10% 8% 10% 9% 4% 2% 13% 4% 9% 9% 7% 10%
7% 10% 7% 10% 6% 9% 17% 4% 2% 5% 4% 7%
6% 7% 6% 7% 5% 2% 4% 11% 7% 4% 6% 6%
5% 8% 5% 8% 4% 8% 5% 4% 10% 3% 5% 4%
22% 14% 22% 15% 25% 8% 16% 26% 23% 20% 22% 23%
2% 39% 2% 38% 6% 48% 2% 2% 0% 1% 4% 3%
41 © 2013 YouGov plc. All Rights Reserved yougov.co.uk
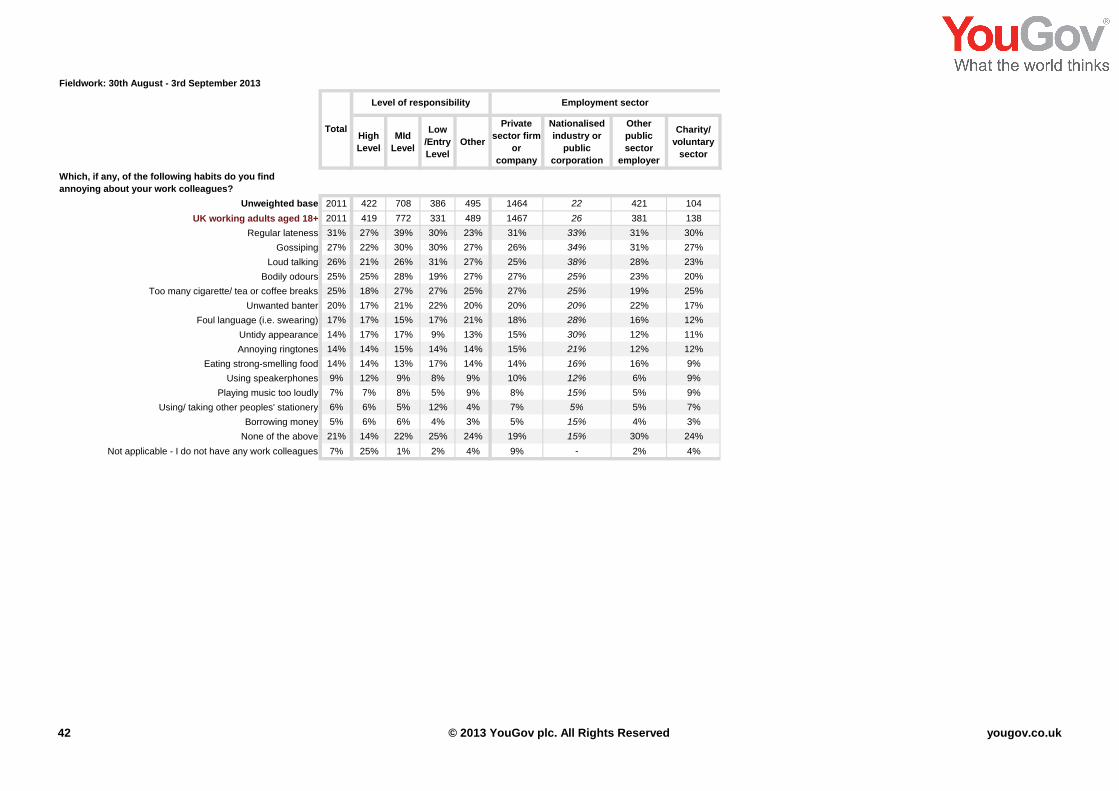
Fieldwork: 30th August - 3rd September 2013
In general, how happy or unhappy would you say you are
in your current job?
Total
Which, if any, of the following habits do you find
annoying about your work colleagues?
Unweighted base 2011
UK working adults aged 18+ 2011
Regular lateness 31%
Gossiping 27%
Loud talking 26%
Bodily odours 25%
Too many cigarette/ tea or coffee breaks 25%
Unwanted banter 20%
Foul language (i.e. swearing) 17%
Untidy appearance 14%
Annoying ringtones 14%
Eating strong-smelling food 14%
Using speakerphones 9%
Playing music too loudly 7%
Using/ taking other peoples' stationery 6%
Borrowing money 5%
None of the above 21%
Not applicable - I do not have any work colleagues 7%
High
Level
MId
Level
Low
/Entry
Level
Other
Private
sector firm
or
company
Nationalised
industry or
public
corporation
Other
public
sector
employer
Charity/
voluntary
sector
Level of responsibility Employment sector
422 708 386 495 1464 22 421 104
419 772 331 489 1467 26 381 138
27% 39% 30% 23% 31% 33% 31% 30%
22% 30% 30% 27% 26% 34% 31% 27%
21% 26% 31% 27% 25% 38% 28% 23%
25% 28% 19% 27% 27% 25% 23% 20%
18% 27% 27% 25% 27% 25% 19% 25%
17% 21% 22% 20% 20% 20% 22% 17%
17% 15% 17% 21% 18% 28% 16% 12%
17% 17% 9% 13% 15% 30% 12% 11%
14% 15% 14% 14% 15% 21% 12% 12%
14% 13% 17% 14% 14% 16% 16% 9%
12% 9% 8% 9% 10% 12% 6% 9%
7% 8% 5% 9% 8% 15% 5% 9%
6% 5% 12% 4% 7% 5% 5% 7%
6% 6% 4% 3% 5% 15% 4% 3%
14% 22% 25% 24% 19% 15% 30% 24%
25% 1% 2% 4% 9% - 2% 4%
42 © 2013 YouGov plc. All Rights Reserved yougov.co.uk