Embed Size (px)
Citation preview

YouChoose: A Performance Interface EnablingConvenient and Efficient QoS Support for
Consolidated Storage SystemsXuechen Zhang
The ECE DepartmentWayne State University
Detroit, MI, 48202Email: [email protected]
Yuhai XuThe ECE Department
Wayne State UniversityDetroit, MI, 48202
Email: [email protected]
Song JiangThe ECE Department
Wayne State UniversityDetroit, MI, 48202
Email: [email protected]
Abstract—Currently the QoS requirements for disk-basedstorage systems are usually presented in the form of service-levelagreement (SLA) to bound I/O measures such as latency andthroughput of I/O requests. However, SLA is not an effectiveperformance interface for users to specify their required I/Oservice quality for two major reasons. First, for users, it isdifficult to determine appropriate latency and throughput boundsto ensure their application performance without resource over-provisioning. Second, for storage system administrators, it is achallenge to estimate a user’s real resource demand becausethe specified SLA measures are not consistently correlated withthe user’s resource demand. This makes resource provisioningand scheduling less informative and could greatly reduce systemefficiency.
We propose the concept of reference storage system (RSS),which can be a storage system chosen by users and whoseperformance can be measured off-line and mimicked on-line,as a performance interface between applications and storageservers. By designating an RSS to represent I/O performancerequirement, a user can expect the performance received froma shared storage server servicing his I/O workload is not worsethan the performance received from the RSS servicing the sameworkload. The storage system is responsible for implementing theRSS interface. The key enabling techniques are a machine learn-ing model that derives request-specific performance requirementsand an RSS-centric scheduling that efficiently allocates resourceamong requests from different users. The proposed scheme,named as YouChoose, supports the user-chosen performanceinterface through efficiently implementing and migrating virtualstorage devices in a host storage system. Our evaluation basedon trace-driven simulations shows that YouChoose can preciselyimplement the RSS performance interface, achieve a strongperformance assurance and isolation, and improve the efficiencyof a consolidated storage system consisting of different types ofstorage devices.
I. INTRODUCTION
As storage consolidation provides a promising solution tothe rising cost in today’s data-centric computing, the IT in-dustry quickly responds by providing all types of architecturesof consolidated storages, from the file-level NAS [15] to theblock-level SAN [28], from local enterprise storage servers toAmazon’s S3 on-line storage service [1]. Today’s technology isready to create data centers comprising of tens of large arrays
of different types, multi-petabytes of capacities, and potentialtens of GB/s of aggregate bandwidth.
While the technology is ready on the architectural and oper-ational aspects, there is a critical barrier to keep performance-sensitive users from using the service, which is the lackof an effective performance interface through which userscan present their goals on quality of I/O service (QoS) andthe system can efficiently meet the goals. As an example,Amazon’s cloud computing service (Amazon EC2) [2] allowsusers to specify a virtual computing system (named as instancein EC2) and upload their applications to run in the virtualsystem. All major aspects of an instance affecting applications’performance can be clearly specified except I/O performance.For example, in a small instance there are 1.7GB memory,one processor equivalent to a 2007 Intel Xeon, and 160 GBstorage. Since storage system are shared among instances,the I/O performance can only be specified with an indicator,either moderate or high. This vague QoS specification woulddeter many QoS-sensitive users from using the service to runtheir I/O-intensive applications, since it leaves applications’performance highly unpredictable.
In shared storage systems like Stonehenge [16] and Fa-cade [20], users are allowed to present their QoS requirementsin terms of I/O latency and throughput bounds, as part ofservice-level agreement (SLA) originally designed for service-level requests to application servers (See Figure 1). However,the adaptation raises a serious issue in the QoS manage-ment for application-level I/O requests to storage servers.As service-level performance of applications running on theapplication servers, such as throughput of transactions or exe-cution time of a scientific program, can be easily determinedaccording to users’performance expectation, it is very hard, ifnot impossible, to determine corresponding response time orthroughput bounds for the I/O requests issued to the storageserver so that the service-level SLA goals are met. This isbecause many aspects of the I/O service are so dynamicthat any static bounds cannot capture the real performancedemands on individual requests.
First, I/O requests can be very bursty. Applications may be
c©978-1-4577-0428-4/11/$26.00 2011 IEEE

E-Commerce
SLA (e.g., response time<100ms,
throughput>100 trans./s)
RSS (e.g., Seagate
Barracuda 7200.10 hard drive)E Commerce
Server throughput 100 trans./s) hard drive)
RSS
Network TPC serverSLA
RSS
SLA
RSS
Consolidated storage server
Search engine
RSSSLA
(e.g., turnaround time < 10 minutes) server
Computing
Service subscribers
time < 10 minutes)
Computing Server
Fig. 1. There are three tiers in a typical system architecture involvingconsolidated storage service: service subscribers, application servers, andstorage server. While the SLA-like performance interface describing boundson response time and throughput is suitable between service subscribersand application servers, a different performance interface is needed betweenapplication servers and storage server, such as the reference storage system(RSS) proposed in this paper.
designed to aggregate its I/O operations into several dedicatedI/O phases, such as phases for data loading or data writingback, in anticipation that I/O system would be more efficientby serving requests in batch. The response time of a requestissued in a busy period tends to be much larger than thatin a quiet period. This is usually not a performance issuewith users, who would also have the experience with theirdedicated system. However, if a static response time boundis specified, all requests are treated indiscriminately on thesame performance target. It would be unrealistic, for the serverto keep response time from growing with the bursty requestsconsidering limited resource in a system. If the performancetarget is determined based on requests issued in the quietperiod, which actually imposes artificially strict latency boundon bursty requests, the resource has to be lavishly provisionedto meet the bound and the I/O service can be prohibitive tousers.
Second, requests size can be highly variable. Requestsof different sizes should come with different respond timebounds. As a request’s service time can be substantiallyinfluenced by its size [29], one fixed bound for all requests isfundamentally inaccurate. Moreover, determination of separatebounds for requests of sizes in different ranges is a tediouswork and not flexible. A bandwidth bound, which specifiesamount of data accessed in a unit time (MB/s) instead ofnumber of I/O operations in a unit time (IOPS), is notsubject to variation of request size. However, if a storagesystem guarantees the bandwidth bound, application designerswould not have the incentive to aggregate small requests intoone large request, making storage system’s efficiency beingcompromised.
Last but not least, the spatial locality of requests can vary.Spatial locality describes the sequentiality of continuouslyrequested data on the storage device. The hard-disk-based stor-age systems are most sensitive to this workload characteristic,
because significant seek time is usually involved in accessingnon-sequential data. For the flash-based solid-state disk (SSD),throughput of random write can be significantly lower than thatof sequential access. The spatial locality is a highly elusiveproperty that is hard for users to characterize.
If the bounds are determined by always assuming a randomaccess pattern, users have to be conservative in setting thebounds, and the server would also conservatively plan itscapability for the worst scenario. If the actual access patternturns out to be sequential access, the application is likely toonly receive performance as low as that with random accesswhen the server resource is tight with high I/O demand. Thisis against the users’ experience with their dedicated storagesystems, that is, I/O performance increases as workload’sspatial locality improves. One consequence of this experienceis that users are not motivated to take efforts in optimizing theirprograms by replacing small and random I/O access with largeand sequential access, which definitely causes grave impact onthe efficiency of the storage server.
In this paper we propose to use reference storage system(RSS) as performance interface for users to describe their QoSrequirements. When a user creates a virtual storage device(VSD) hosted in a shared system, its performance is associatedwith an RSS, which can be a user’s dedicated local system,instead of a set of (artificial) bounds on request latency orthroughput. A user is then guaranteed to receive I/O servicewhose quality is at least as good as that on the referencesystem regardless of instantaneous changes of data requestpattern. The proposed scheme is named as YouChoose, asit allows a user to choose his own RSS as performanceinterface. Meanwhile, the host storage system does need toknow the required latency for each of the requests fromdifferent users to schedule requests. To this end, YouChoosetrains a machine learning model off-line to mimic the chosenRSS and to on-line predict the latency that the RSS wouldproduce for an incoming request. Relying on the latency,YouChoose can efficiently maintain a VSD associated witha pre-chosen RSS to meet its user’s QoS requirement. Thearchitecture of YouChoose is illustrated in Figure 2.
In summary, we made four contributions in the work.• We propose a performance interface for users to conve-
niently specify their I/O QoS requirements so that theyare assured of QoS of their outsourced I/O service atleast as good as that on their dedicated reference system.We adopt the machine learning technique to automaticallyabstract performance characteristics of a reference systemfor effective implementation of the performance interface.
• While a consolidated storage system is shared by multipleusers, we propose a scheduling strategy to reduce per-formance degradation for a user’s virtual storage device(VSD) due to the interference among different VSDs, andto improve the entire system’s utilization.
• Modern storage systems are complex and hybrid, con-sisting of hard disks, solid-state disks, and other typesof devices. We design a migration policy to intelligentlymap a virtual device of specific QoS requirements to a
physical device of matching performance characteristicsfor high resource utilization.
• We built a storage system simulator, in which hard disksand solid-state disks are accurately simulated. Our eval-uation shows that YouChoose can precisely implementthe RSS performance interface, achieve a higher resourceutilization, and improve the efficiency of a consolidatedstorage system consisting of different types of storagedevices.
Application server 1
Application server 2
Application server n
…..
iSCSIiSCSI FibreChannel
Interconnection Fabric Request Streams
RSS RSS RSS RSSRSSPerformance
InterfaceInterface
VSD VSD VSD VSD VSDQoS-aware controller controller controllerScheduler
HDD disk array SSD disk array Hybrid disk arrayy y y y
Fig. 2. The consolidated storage system (in the dotted line box) is sharedamong multiple application servers. Performance interface is specified via ref-erence storage system (RSS) and quantified on-line using a machine-learningmodel. Each virtual storage device (VSD) has its performance interface, whichis implemented with an efficient QoS-aware scheduler. Decision on VSDmigration is made according to characteristics of I/O workloads, RSSs, andstorage devices.
The rest of this paper is organized as follows. Section IIdiscusses the related work; Sections III presents the designof YouChoose; Section IV describes and analyzes experimentresults; and Section V concludes the paper.
II. RELATED WORK
As consolidated storage service promises significant bene-fits, QoS assurance for its users is one of the most criticalissues to be addressed and much research work has beenfocusing on it, including QoS specification, characterizationof storage systems’ performance, and QoS-aware scheduling.
A. Research on Performance Interfaces
The commonly used metrics for users to present theirQoS requirements are throughput and response time of dataaccess [16], [11]. A serious issue with the use of the simplisticparameters is that service quality can be significantly affectedby the characteristics of I/O workloads. To mitigate the issue,researchers have developed I/O workload models to deriveperformance bounds [8], [30], [33], [35]. As a workload’scharacteristics can vary in a large range, constraints havebeen introduced to guarantee QoS under the constraints. Forexample, in the pClock scheduling [11], response time of arequest is bounded only if the request burstiness (the numberof pending requests) and request arrival rate are less than pre-set thresholds. However, the relationship between the imposed
constraints and the guaranteed performance may not reflectthe performance expectation from users. To provide flexibility,Cruz et al. introduced the notion of service curves to charac-terize service quality in the networking domain [9], [26], [31],[32]. With a service curve, QoS requirements can be expressedas a function of input traffic rates. Facade [20], a high-endstorage system prototype, adopts this performance interfaceto allow higher response times when I/O request arrival rateincreases. However, it is a challenge for users to determinea series of performance bounds, each associated with an I/Orate.
Spatial locality is a unique property for the storage systemand even harder than I/O rate to be included in the performanceinterface. Performance bounds are specified without regard tosequential and random access in most systems [7], [10], [16],[11], [18], [20], [41], [13], [14]. An exception is the Argonstorage server [37], in which a client requests a fixed fractionof a server’s capability, which is equivalent to setting perfor-mance bounds aware of spatial locality. However, by bindingthe QoS requirements proportionally to the host server’s ca-pability, a user cannot flexibly designate a performance modelof his choice. Furthermore, to use the method, users needto be aware of the server’s total capability. In contrast, ourYouChoose scheme allows a user to choose any storage systemmatching his performance needs as the reference system,which then serves as the performance interface.
B. Research on Characterizing Storage Systems’ Performance
To use a reference system as a performance interface, itsperformance behaviors must be well characterized to provideperformance goals. For this purpose there are three methods,namely, analytic device modeling, simulation, and black-boxmodeling, to leverage.
Because of its nonlinear, state-dependent behavior, buildingaccurate analytic models for the disk drive is a non-trivialtask. In [27], Ruemmler and Wilkes developed analytic diskmodels that take into account head positioning, platter rotation,and data caching and read-ahead. The model is further fine-tuned by Worthington et al. [38], resulting in the widelyused disk simulator, DiskSim [34], which represents the stateof the art in disk simulation. DiskSim models almost allperformance-relevant components of a disk, including devicedrivers, buses, controllers, adapters, caches. Compared withsimulations, analytic models are much faster. However, theyusually cannot capture as many details as simulators. Bothapproaches require human expertise on the target system. Thusthese methods are called white box approach. The internalarchitectures of today’s storage systems have become moreand more complex, and may include proprietary configurationsand use of algorithms and optimizations that are not disclosed.Therefore, building an accurate model or simulator using thewhite-box method cannot be a general solution for definingany given storage system as a reference system. In contrast,the so-called black box approach treats the system as ablack box without assuming the knowledge of its internalcomponents or algorithms. In the approach, the training data

set, containing the quantified description of characteristics ofinput requests and their corresponding responses from thesystem, are recorded in a table [4], [24], fed into a statisticalmodel [19], or a machine learning model [40], [22]. To predictresponse to an input, some form of interpolation is required.It is recognized that the accuracy of the method relies on theselection of training data set and design of feature vectors(the set of input characteristics) [19], [40]. In our proposedYouChoose, we use the machine-learning method to modelthe chosen reference storage system by selecting effectivetraining data sets. In addition, the effectiveness of YouChoosescheduling depends only on the model accuracy with aggregateperformance value for requests issued in a time slot, rather thanfor individual requests.
C. Research on QoS-Aware Scheduling
Many QoS-aware I/O scheduling policies guarantee I/O ser-vice quality by tagging requests from different request streamswith deadlines (or finish times) calculated from users-specifiedperformance bounds and estimated service times [16], [25].While the service time is heavily dependent on spatial localityin the disk-based storage systems, the locality is usually notincluded in the performance interface and random accessis usually assumed. However, this can cause resource over-provisioning. To fix this problem, Stonehenge [16] allowsadditional streams to keep joining the system until the systemis found to be overloaded. They have to use the trial-and-error method because the performance interface does notcontain information of spatial locality and planning of re-source provisioning is difficult. In contrast, VSD proposed inour paper comes with a well-defined performance interfacecontaining each VSD’s resource consumption to enable well-planned scheduling. The resource consumption is also includedin the Argon’s interface through setting explicit quanta ofdisk service time for each stream [37]. However, in a sharedenvironment it is a challenge to know to which stream a servicetime should be accounted [25].
Consolidated storage systems could achieve a higher ef-ficiency and become more cost effective with data migra-tion. HP AutoRAID [39] balances I/O performance withdata redundancy through hierarchical storage system design.It allows data to automatically migrate between a RAID-5disk array of low speed and a RAID-1 disk array of highspeed. Anderson et al. [5] discussed data migration due tooptimized storage device configurations, which are obtainedby customized analytic performance model. However, users’QoS requirements are not included in both of the designs.Lu et al. [21] demonstrated that QoS of I/O services canbe statistically guaranteed during data migration. However,the QoS requirement is simply presented with latency bound.Our YouChoose is designed to improve system efficiency byautomating VSD migration among storage devices exhibitingdifferent capabilities with different workloads, without com-promising their QoS requirements.
III. DESIGN OF YouChoose
In this section we will define a performance interface witha reference storage system (RSS) using a machine learningmodel. We then present the I/O scheduling strategy to ef-ficiently implement the interface. Finally, we will describea virtual-storage-device (VSD) migration policy to improvestorage system efficiency by considering characteristics of bothI/O workloads and a hybrid storage system.
A. Defining Reference Systems as Performance Interface
By defining a reference system, we mean the consolidatedstorage server knows how the system would behave if arequest, which is currently sent to the host server, was receivedby the reference system, or more specifically, the server knowswhat the request’s service time on the reference system was.As the machine learning model is general enough to predictservice time in all types of storage systems, we choose to usethe classification and regression tree (CART) machine-learningmodel [40] to obtain request service time on the referencesystem, or RSS, for its efficiency and simplicity.
Training Workload
Request Feature Vector (FV)
R
Workload
ST1FV1 Model
1
3R1
R2
R3
Reference System
ST2
ST3
FV2
FV3Service Time
Construction
3
.
.
.
.
....
(ST) Trained
Storage Model2
Rn
.STnFVn
(a) Train a CART model for a reference system
1 Generate feature vector (FV ) of request R1 Generate feature vector (FVi) of request Ri
23
Measure service time (STi) of request Ri
F d i (FV ST ) i t th CART d l3 Feed pairs (FVi, STi) into the CART model
Request Feature Vector
4ST1
ST2
ST
4
5R1
R ST3
.
.Trained
Storage Model
5R2
R3
STn
....
(b) Use the CART model for prediction of service time
Rn
4 Generate feature vector (FVi) of request Ri (to be predicted)
5 The CART model predicts service time (STi ) for Ri
Fig. 3. Basic steps involved in: (a) the training a CART model for a referencesystem, and (b) using the model to predict per-request service time.
A user may choose a dedicated storage system as hisRSS and the system administrator is responsible to profilethe system by running representative workloads to obtainthe I/O traces including requests and their service times.The I/O traces are used to train a machine-learning modelrepresenting the RSS. Figure 3 shows the basic steps involved

in training a model for a reference device and using the modelto predict system response time. In the process, a request’scharacteristics that affect its service time are abstracted intoa set of measures, called feature vector. The vector togetherwith measured service time of the request, as a member ofthe training data set, is then fed into the model. The measuresin the feature vector include request size, on-disk locationof requested data, and the gap between the locations of twoconsecutive requests. Note that number of outstanding requestsis not included in the vector, because the model is used topredict request service time, rather than request response time.A trained model will be deployed in the host storage systemto on-line predict the service time of a request on the RSS,instead of the time on the host system, by feeding the featurevector of the request into the model.
To allow the trained model to make accurate predictions,the training data set must provide a comprehensive coverage ofworkload characteristics. To this end, we developed a syntheticI/O request generator producing workloads covering a largespectrum of request size and spatial locality. In addition, wefound that using part of real workload presented to the hostsystem to train the model is helpful to improve the accuracydue to existence of self-similarity in a stabilized workload.This is possible if a user’s actual workload is known in advanceor if the reference system is still available for profiling tocollect training data set after the service is deployed. Becauseof complexity of storage devices, building a model of highaccuracy for each individual request is hard. Fortunately,request-level accuracy is not required for our scheduling, andonly accuracy for requests in a time window is needed. Thismakes it feasible to use the machine-learning method forimplementing the RSS interface.
B. Supporting Virtual Storage Devices
When an RSS is chosen and its corresponding CART modelis trained and deployed in the host system, a virtual storagedevice (VSD) is created for the RSS in a disk array andmanaged together with other VSDs. To allocate the resourceto the hosted VSDs according to their QoS requirements, thescheduler needs to keep track of how the requirements aremet for each VSD and schedule requests to these VSDs ac-cordingly. To this end, YouChoose uses a multi-clock schedul-ing framework, which sets up N + 1 clocks, including onereference clock (ref clock) for each of the N co-existingVSDs, and the wall clock (wall clock) (see Figure 4(a)). Areference clock of a VSD is advanced in this way: (1) Whena VSD’s request arrives at the host system, its service time(ref service time) on the VSD’s RSS is computed via theRSS’s trained CART model and the VSD’s clock is advancedby the service time (ref clock += ref service time); (2)When it is the turn for the VSD to be served but the VSDdoes not have any pending requests, its reference clock is setto be the wall clock time (ref clock = wall clock). Usingthe clocks, YouChoose can easily monitor whether or not aVSD meets its performance requirement by simply comparingref clock and wall clock. The next VSD selected by the
Stream 1 Stream 2 Stream 3Stream 1 Stream 2 Stream 3
QoS Scheduling
Reference Clock 1
Reference Clock 2
Reference Clock 3
W ll Cl kWall Clock
(a)( )
VSD 1 VSD 2 VSD 3
Slot K+2Slot K+2
Slot K+1
Requested data spread l i l di k
Slot Kover multiple disks
(b)
Fig. 4. (a) Illustration of the YouChoose scheduling policy that implementsthe RSS performance interface. Besides the wall clock, each VSD, servinga stream of requests from applications, has its reference clock. A request isrepresented by a rectangle, whose height indicates the service time of therequest on the chosen reference system. Thus, the reference clock tracksreceived service with respect to the reference system. Note that at a lowerlevel each disk also has its disk scheduler, such as C-SCAN (not depicted).(b) Batching is used to minimize interference among VSDs. Requests to thesame VSD are grouped into time slots of fixed size, and the sum of on-RSSservice times of requests in a slot is not greater than the slot size. Slots ofeach VSD are numbered consecutively.
scheduler for service is the one whose reference clock isslower than the wall clock, which indicates the VSD’s perfor-mance has not kept up with that of its RSS. The gaps betweenthe wall clock and each of reference clocks show quality ofservice for VSDs and tightness of resource provisioning. Thisframework enables YouChoose to automatically take all thedynamics of workload’s characteristics into account, includingspatial locality, I/O rate, and request size, in the assurance ofQoS. Furthermore, it does not need to quantify host-system’sphysical resources consumed by each VSD in making thescheduling decision, which is a very challenging task [25].
When multiple VSDs are hosted on the same physicalsystem, their interference can be a serious performance barrier.To mitigate the interference, YouChoose batches requests tothe same VSD into time slots and schedules requests fromthe same slot together (see Figure 4(b)). All slots are of thesame capacity in seconds, and the sum of the service times

VSD 1 VSD 2 VSD 3 VSD 4HDD Array A 53% 12% 33% 2%HDD Array B 10% 54% 30% 6%
SSD Array 8% 68% 16% 8%
TABLE IAN EXAMPLE RESOURCE-CONSUMPTION MATRIX. IN THE EXAMPLE,
THERE ARE FOUR VSDS HOSTED ON THREE ARRAYS, INCLUDING TWOHDD ARRAYS A AND B AND ONE SSD ARRAY C. EACH ROW OF THE
MATRIX LISTS THE PERCENTAGE OF SERVICE TIME FOR ANY VSD ON APARTICULAR DEVICE ARRAY OVER TOTAL SERVICE TIME ON THE ARRAY.
THEREFORE, THE SUM OF THE PERCENTAGES IN A ROW IS 100%. THECHANGE OF PERCENTAGES IN THE MATRIX HINTS ACCESS PATTERNS OF
THE VSDS. FOR EXAMPLE, VSD 1 CHANGES ITS PERCENTAGE FROM 53%TO 8% WHEN IT MOVES FROM HDD ARRAY A TO THE SSD ARRAY,
WHICH SHOWS IT’S PROBABLY A RANDOM WORKLOAD. VSD 2 CHANGESITS PERCENTAGE FROM 12% TO 68% WHEN IT MOVES FROM HDD ARRAYA TO THE SSD ARRAY C, WHICH SHOWS IT’S PROBABLY A SEQUENTIALWORKLOAD AND THE SYSTEM HAS OTHER SIGNIFICANT RANDOM VSDS.
IF CURRENTLY VSD 1 IS ON HDD ARRAY A AND VSD 2 IS ON SSDARRAY, BOTH ARRAYS CAN SIGNIFICANTLY REDUCE THEIR LOADS IF WE
SWITCH THE HOSTS OF THE TWO VSDS. IN CONTRAST, VSD 4 ISINSIGNIFICANT IN TERMS OF RESOURCE CONSUMPTION AND SHOULD BE
EXCLUDED FROM MIGRATION AS MIGRATION OF DATA CAN BEEXPENSIVE.
of requests held in a slot cannot exceed a slot’s capacity.Note that these are service times on the reference systemsand are obtained from the CART models. Therefore, the RSSperformance interface is maintained. In the case where thereare too few requests in a slot of a VSD, YouChoose may moverequests from neighboring slots into the slot to improve diskefficiency.
C. Migrating Virtual Storage Devices
The consolidated system usually consists of heterogeneousdevices, including arrays of hard drive disks (HDD) andsolid-state disks (SSD). Because VSD is created based ona reference system, its actual resource demand is boundedby the capability of the reference system. Thus, a capacityplanning is possible to determine the largest number of VSDsthat can be co-hosted in a disk array with its known capabilitywithout performance violation. However, this is not necessarilytranslated into efficient use of the storage system, as theefficiency relies on both device and workload characteristics.
The goal of VSD migration is to make the host systemmost efficiently used so as to accommodate as many VSDs aspossible. This is achieved through migrating those significantbut misplaced VSDs to the device arrays that can mostefficiently host the VSDs, if such device arrays are available. AVSD becomes significant when it consumes a relatively largeproportion of resources by being associated with a relativelypowerful RSS and having a high request-arrival rate. A VSDis misplaced if there exists a device array that can moreefficiently host the VSD and is able to make room to hostthe VSD. Therefore, a significant and misplaced VSD can beidentified only when a VSD is deployed and the characteristicsof other VSDs and all device arrays are known. To this end,we introduce the resource-consumption matrix.
As we know, all requests to a VSD are packed into theVSD’s slots, whose capacity is determined by the VSD’s RSS(see Figure 4(b)). For each VSD hosted on a shared storagesystem, we pick the same set of contiguous slots to form aslot group. The requests in a VSD’s slot group are used asa sample of the VSD’s characteristics including arrival rate,access pattern, and RSS requirements. Moreover, we trainthe CART models for each device array using the synthetictraining data set described in Section III.A, and use the modelsto represent the arrays. On each device array, we feed therequests in each VSD’s slot group into the array’s modelto obtain the service time for the VSD. We then calculatethe percentage of a VSD’s service time on an array overtotal service time of all VSDs on the array, and write thepercentage in the cell of the matrix for the VSD on the array(see an example in Table I). The percentage indicates therelative resource consumption for a VSD, or its significance,on an array. There can be two scenarios where the percentagefor a VSD becomes smaller when its host is changed fromarray A to array B. In the first scenario, the VSD’s servicetime is reduced. For example, when the VSD has mostlyrandom requests, array A is an HDD array, and array B isan SSD array. In the second scenario, other VSDs’ servicetimes are increased. For example, when the VSD has mostlysequential requests, and some of other VSDs have randomrequests, array A is an SSD array, and array B is an HDDarray. A significant reduction of the percentage indicates anopportunity to improve efficiency of the shared storage system.Migration manager of YouChoose runs in the controller of theshared storage system to periodically take samples of VSDslots and update the matrix by executing the CART models.The manager monitors the matrix to identify a VSD whoseresource consumption percentage can be reduced by more thana threshold value if it is migrated from its currently sourcedevice array to a destination array. If a VSD is consistentlyidentified, the manager will check whether the destinationarray has spare capacity to hold the VSD or has one ormultiple VSDs that can reduce their percentages by more thanthe threshold if they are migrated to the source array. If yes,these migration operations are carried out, which improves thesystem efficiency and allows more VSDs to be hosted withtheir QoS requirements met.
IV. PERFORMANCE EVALUATION
We built a trace-driven simulator to evaluate the perfor-mance of the YouChoose scheme. The simulator is designed tosimulate consolidated storage system consisting of heteroge-neous devices, including arrays of hard drive disks and arraysof solid state disks. Each array can be configured to havedifferent types of disks, number of disks, array organizations(RAID 1 vs RAID 5), and data striping patterns. The archi-tecture of the simulator is shown in Figure 2. The simulatedconsolidated storage system is shared by multiple applicationservers. I/O workloads from the applications are viewed asI/O request streams to different VSDs. Each VSD has its ownRSS interface, which is converted into latency requirements
or (%
)ive Erro
Relati
Time (Seconds)
(a)
or (%
)ive Erro
Relati
Time (Seconds)
(b)
or (%
)ive Erro
Relati
Time (Seconds)
(c)
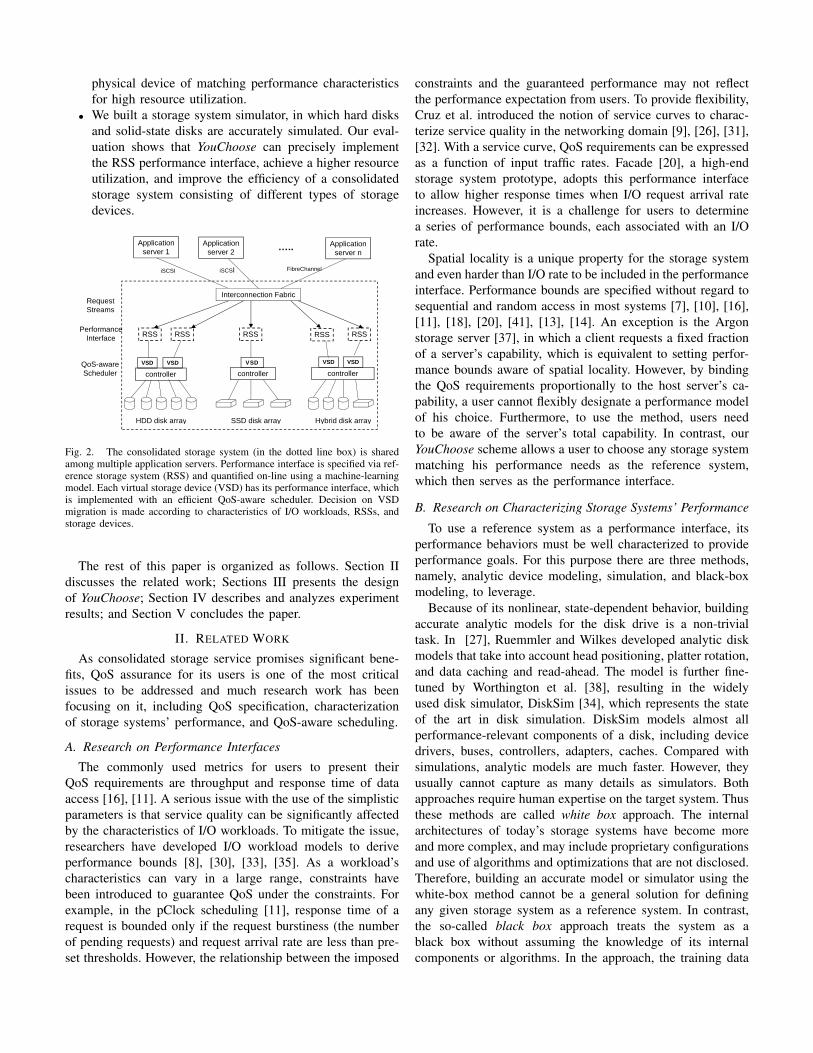
Fig. 5. Relative errors of request service times with different window sizes.
on I/O requests by the trained CART models. Our simulatorintegrates the widely used DiskSim [34] to simulate the harddisk. DiskSim faithfully captures many details of a hard driveand has demonstrated a very high accuracy with validatedhard disks. In the experiments, we simulated two validatedhard disk models: QUANTUM TORNADO with 10025RPMsand an average seek time of 1.245ms (hereafter referred to asthe fast disk) and SEAGATE ST32171W with 7200RPMs andan average seek time of 1.943ms(hereafter referred to as theslow disk). In addition, we patch the DiskSim software witha flash translation layer [3] implementing the DFTL page-level mapping scheme [12] to simulate the solid-state disk,which has a read speed of 32µs/page and a write speed of101µs/page. For a disk array, the striping unit size is 4KB.The simulator has components to receive and enqueue requestsfrom multiple streams and dispatch them to their respectiveVSDs. A centralized manager in the frontend controller makesdecisions on VSD migrations.
The simulator is driven by both synthetic and real-worldtraces. The ratio of numbers of read requests and write requestsis 2 : 1 in the synthetic traces. Size of each request is 4KB.To generate traces of various spatial locality, we adjust theprobability with which the data requested in any two consecu-tive requests are contiguous and use the probability to quantifythe spatial locality. Thus, a 0% spatial locality indicates fullyrandom requests, in which none of two consecutive requestsare for adjacent data, and 100% spatial locality indicatesthat the entire trace consists a sequence of requests for fullysequential data. In addition to the synthetic traces, we selectfour real-world traces. Three of them are widely used ones(OpenMail [17], WebSearch [23]), and Financial [23]). Thefourth one (VideoStreaming) was collected when we continu-ously played movies in a local workstation. Trace OpenMailwas collected on a production e-mail system running the HPOpenMail application. Both traces WebSearch and Financialare made available by the Storage Performance Council (SPC).Among them, WebSearch is collected from a popular searchengine, and Financial is collected when an OLTP applicationruns in a financial institute. Except VideoStreaming, all thereal-world traces contain mostly random requests. Amongthem, OpenMail and WebSearch are read dominant and Finan-
cial is write dominant. VideoStreaming contains almost fullysequential reads.
In the following, we will present a series of experimentsto evaluate the accuracy of implementing the RSS interfaceusing the CART model, and the effectiveness of YouChooseto meet its design goals.
A. Accuracy of the RSS Interface
To test how accurately a trained machine-learning CARTmodel can represent an RSS chosen by YouChoose’s usersas performance interface, we choose a RAID-0 disk arrayconsisting of three slow disks as RSS. To train a CART modelfor the disk array, we generate a synthetic trace covering a fullspectrum of spatial locality. Every synthetic trace consists of10,000 mixed I/O requests of reads and writes. In addition,we randomly choose a segment of trace (5,000 requests) fromthe actual workload on the RSS’s VSD (WebSearch in thisexperiment). These traces are replayed on the disk array andthe results are used to train the model. We then run the modelwith the WebSearch trace (excluding the segment that has beenused for the training purpose) and compare the service timeof each request predicted by the model and that given by theRSS. The request’s relative error, which is the ratio of theabsolute error between these two times and service time givenby the RSS, is shown in Figure 5 (a).
The average relative error for all the requests is 24%,which is substantial but is within the range we have expectedconsidering the generality of the model method. Fortunatelythe errors are roughly evenly distributed in the negative andpositive sides in the graph. It is noted that it is the accuracyof the sum of the predicted service times for all requestsplaced in a VSD’s time slot that determines the accuracy of theRSS interface, rather than the accuracy for individual requests.For this reason, we calculate the window-wide relative error,which is the ratio of sum of service times predicted by themodel and that given by the RSS, respectively, for all requestswithin a time window. Figure 5 (b) and (c) show the window-wide relative errors for window sizes of 0.04s and 0.08s,respectively. Apparently, as we increase the window size, therelative error is improved. When the window size is 0.08s,more than 85% of the relative errors are smaller than 15%.

0
100
200
300
400
500
0 20 40 60 80 100
Th
rou
gh
pu
t (I
OP
S)
Time (Seconds)
(a)
Spatial Locality (100%)Spatial Locality (75%)Spatial Locality (50%)Spatial Locality (25%)Spatial Locality (0%)
0
100
200
300
400
500
0 20 40 60 80 100
Thro
ughput (I
OP
S)
Time (Seconds)
(b)
Spatial Locality (100%)Spatial Locality (75%)Spatial Locality (50%)Spatial Locality (25%)Spatial Locality (0%)
0
100
200
300
400
500
0 20 40 60 80 100
Th
rou
gh
pu
t (I
OP
S)
Time (Seconds)
(c)
Spatial Locality (100%)Spatial Locality (75%)Spatial Locality (50%)Spatial Locality (25%)Spatial Locality (0%)
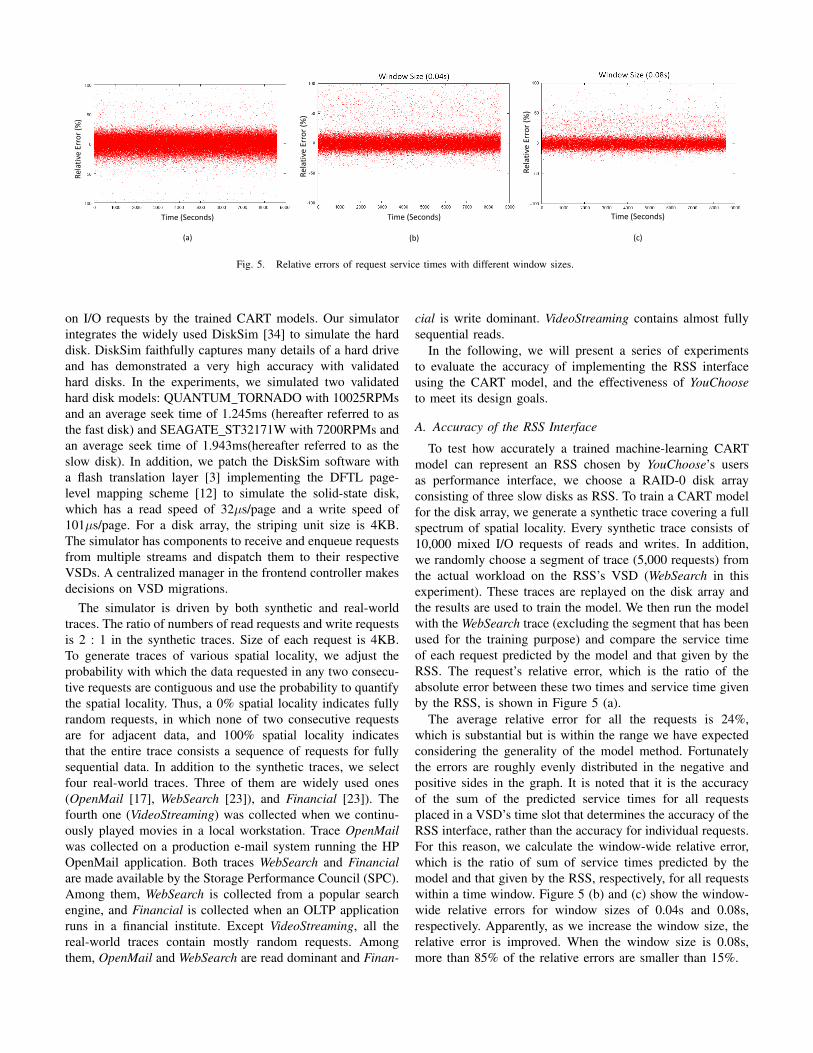
Fig. 6. Illustration of impacts of different spatial localities on the observed throughput in different scheduling policies. We use five synthetic workloadscovering a full spectrum of spatial locality from 0% (fully random) to 100% (fully sequential) with 25% increment. (a) Throughput of the five workloads,each of which runs exclusively on the reference system; (b) Throughput of five VSDs, each associated with the same RSS as performance interface andreceiving one of the workloads. The scheduling policy is YouChoose. (c) Throughput of the five workloads that use the same throughput bound (100 IOPS)as performance interface, The scheduling policy is VirtualClock.
In the aforementioned model training, we used a segment ofreal workload trace to allow the model to be more customizedto a particular type of workload for higher accuracy. Weexpect that in most cases a segment of sample workload isavailable when a user chooses his RSS. However, when thesample trace is not available, or the workload is too dynamicto select a representative segment of trace, the model accuracywould be reduced. To investigate the issue, we train a CARTmodel using only the synthetic traces and compare the CDFcurves of window-wide relative errors of the models withand without using the sample workload (time window sizeof 0.08s). As shown in Figure 7, a representative sampleof real workload does considerably improve the accuracy ofthe model. Meanwhile, even if the sample workload is notused for model training, the accuracy of the model is stillacceptable with 80% of the errors less than 30%. In thefollowing experiments, we use relatively small samples ofactual workloads for model training.
Fig. 7. CDF curves of window-wide relative errors. The models are trainedeither using only synthetic traces or using both synthetic traces and sampleof actual workloads.
B. Spatial-Locality-Aware Performance AssuranceAn important property of the YouChoose scheduling strategy
is its built-in awareness of workloads’ spatial locality. Thatis, its scheduling decision is not made simply according tonumber of requests. Instead, it also accounts for cost of servinga request, which is mainly determined by the workload’sspatial locality. To evaluate the effectiveness of the schedulingstrategy, we set up five VSDs on one host RAID-0 disk arrayconsisting of eight fast disks. All VSDs are associated with thesame RSS interface, a RAID-0 disk array consisting of twoslow disks. We then feed five synthetic traces into the fiveVSDs, respectively. The traces uses 4KB requests, coveringa full spectrum of spatial locality from 0% (fully random)to 100% (fully sequential) with 25% increment. All requestsarrive quickly enough to saturate the disks.
Figure 6 (a) shows the throughput of the five workloads,each on its own dedicated reference storage system. Appar-ently, the observed throughput is correlated to the workload’sspatial locality – a more sequential access pattern producesa higher throughput. When the five workloads are placedon the five VSDs, respectively, on one host system, theirthroughputs are still correlated to their spatial locality, andeach workload’s throughput is close to their counterpart in thededicated RSS system as the host system is sufficiently power-ful (See Figure 6(b)). This result indicates that the schedulingstrategy of YouChoose faithfully implements the performanceinterface specified with a chosen RSS, independent of spatiallocality. For comparison, we use VirtualClock [9], the schedul-ing algorithm from which many storage policies are derivedfrom [16], [11], to implement an SLA-like QoS interface. Eachof the five workloads requires the same 100-IOPS throughputbound. Figure 6(c) shows the throughput of the workloadswith the throughput bound. We can see that each of theworkloads receives almost the same throughput but noneof them consistently meets its QoS requirement. The samethroughput received by each workload does not indicate thatthe host’s resource is equally provisioned to the workloads.In fact, the random ones receive much more service than the
0
50
100
150
200
250
300
350
0 50 100 150 200
Thro
ughput (I
OP
S)
Time (Seconds)
(a)
Workload 1Workload 2
0
50
100
150
200
250
300
350
0 50 100 150 200
Thro
ughput (I
OP
S)
Time (Seconds)
(b)
Workload 1Workload 2
0
50
100
150
200
250
300
350
0 50 100 150 200
Thro
ughput (I
OP
S)
Time (Seconds)
(c)
Workload 1Workload 2
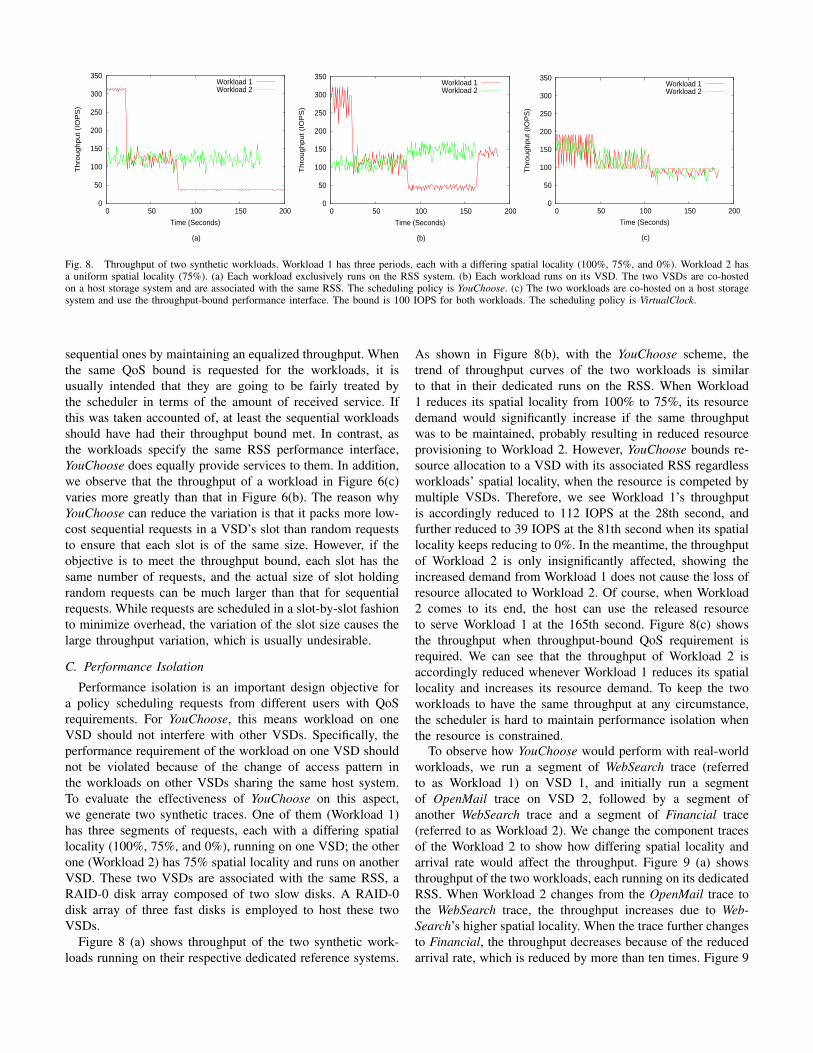
Fig. 8. Throughput of two synthetic workloads. Workload 1 has three periods, each with a differing spatial locality (100%, 75%, and 0%). Workload 2 hasa uniform spatial locality (75%). (a) Each workload exclusively runs on the RSS system. (b) Each workload runs on its VSD. The two VSDs are co-hostedon a host storage system and are associated with the same RSS. The scheduling policy is YouChoose. (c) The two workloads are co-hosted on a host storagesystem and use the throughput-bound performance interface. The bound is 100 IOPS for both workloads. The scheduling policy is VirtualClock.
sequential ones by maintaining an equalized throughput. Whenthe same QoS bound is requested for the workloads, it isusually intended that they are going to be fairly treated bythe scheduler in terms of the amount of received service. Ifthis was taken accounted of, at least the sequential workloadsshould have had their throughput bound met. In contrast, asthe workloads specify the same RSS performance interface,YouChoose does equally provide services to them. In addition,we observe that the throughput of a workload in Figure 6(c)varies more greatly than that in Figure 6(b). The reason whyYouChoose can reduce the variation is that it packs more low-cost sequential requests in a VSD’s slot than random requeststo ensure that each slot is of the same size. However, if theobjective is to meet the throughput bound, each slot has thesame number of requests, and the actual size of slot holdingrandom requests can be much larger than that for sequentialrequests. While requests are scheduled in a slot-by-slot fashionto minimize overhead, the variation of the slot size causes thelarge throughput variation, which is usually undesirable.
C. Performance Isolation
Performance isolation is an important design objective fora policy scheduling requests from different users with QoSrequirements. For YouChoose, this means workload on oneVSD should not interfere with other VSDs. Specifically, theperformance requirement of the workload on one VSD shouldnot be violated because of the change of access pattern inthe workloads on other VSDs sharing the same host system.To evaluate the effectiveness of YouChoose on this aspect,we generate two synthetic traces. One of them (Workload 1)has three segments of requests, each with a differing spatiallocality (100%, 75%, and 0%), running on one VSD; the otherone (Workload 2) has 75% spatial locality and runs on anotherVSD. These two VSDs are associated with the same RSS, aRAID-0 disk array composed of two slow disks. A RAID-0disk array of three fast disks is employed to host these twoVSDs.
Figure 8 (a) shows throughput of the two synthetic work-loads running on their respective dedicated reference systems.
As shown in Figure 8(b), with the YouChoose scheme, thetrend of throughput curves of the two workloads is similarto that in their dedicated runs on the RSS. When Workload1 reduces its spatial locality from 100% to 75%, its resourcedemand would significantly increase if the same throughputwas to be maintained, probably resulting in reduced resourceprovisioning to Workload 2. However, YouChoose bounds re-source allocation to a VSD with its associated RSS regardlessworkloads’ spatial locality, when the resource is competed bymultiple VSDs. Therefore, we see Workload 1’s throughputis accordingly reduced to 112 IOPS at the 28th second, andfurther reduced to 39 IOPS at the 81th second when its spatiallocality keeps reducing to 0%. In the meantime, the throughputof Workload 2 is only insignificantly affected, showing theincreased demand from Workload 1 does not cause the loss ofresource allocated to Workload 2. Of course, when Workload2 comes to its end, the host can use the released resourceto serve Workload 1 at the 165th second. Figure 8(c) showsthe throughput when throughput-bound QoS requirement isrequired. We can see that the throughput of Workload 2 isaccordingly reduced whenever Workload 1 reduces its spatiallocality and increases its resource demand. To keep the twoworkloads to have the same throughput at any circumstance,the scheduler is hard to maintain performance isolation whenthe resource is constrained.
To observe how YouChoose would perform with real-worldworkloads, we run a segment of WebSearch trace (referredto as Workload 1) on VSD 1, and initially run a segmentof OpenMail trace on VSD 2, followed by a segment ofanother WebSearch trace and a segment of Financial trace(referred to as Workload 2). We change the component tracesof the Workload 2 to show how differing spatial locality andarrival rate would affect the throughput. Figure 9 (a) showsthroughput of the two workloads, each running on its dedicatedRSS. When Workload 2 changes from the OpenMail trace tothe WebSearch trace, the throughput increases due to Web-Search’s higher spatial locality. When the trace further changesto Financial, the throughput decreases because of the reducedarrival rate, which is reduced by more than ten times. Figure 9

VSD1 VSD2 VSD3 VSD4 VSD5 VSD6 VSD7HDD Array A 7.6%* 7.6%* 7.6% 31.0% 7.6% 7.6% 31.0%*HDD Array B 8.4% 8.4% 8.4% 29.0% 8.4%* 8.4%* 8.4%
SSD Array 14.2% 14.2% 14.2%* 14.5%* 14.2% 14.2% 14.5%
TABLE IITHE RESOURCE-CONSUMPTION MATRIX FOR A HYBRID HOST STORAGE SYSTEM CONSISTING OF THREE DISK ARRAYS (TWO HDD ARRAYS A AND B
AND ONE SSD ARRAY C). SEVEN VSDS ARE HOSTED IN THE SYSTEM. AMONG THEM, VSD 4 AND VSD 7 HAVE WebSearch AS THEIR WORKLOADS, THEOTHER VSDS HAVE VideoStreaming AS THEIR WORKLOADS. THE ASTERISK INDICATES THE DISK ARRAY ON WHICH A VSD IS HOSTED.
0
200
400
600
800
1000
1200
1400
1600
1800
2000
0 50 100 150 200 250 300 350 400
Thr
ough
put (
KB
/s)
Time (Seconds)
(a)
Workload 1Workload 2
0
500
1000
1500
2000
2500
3000
0 50 100 150 200 250
Thr
ough
put (
KB
/s)
Time (Seconds)
(b)
Workload 1Workload 2
Fig. 9. Throughput of two real-world workloads on the dedicated RSSsystem (a) and on the host system (b). Workload 1 consistently uses theWebSearch trace. Workload 2 includes traces OpenMail, WebSearch, andFinancial, running in a one-after-one manner in this order.
(b) shows throughput of the two workloads co-hosted on thehost disk array. We can find that the trends of two VSDs’throughput curves are similar to their counterparts in Figure 9(a). One difference between them is that the throughput onthe host system is higher than that on the dedicated RSS,because the system has extra capability to provide the VSDswith more services than they require. For their throughputimprovements, we can see that the extra capability is allocatedto the two workloads in proportion to their RSS capability.In this example, both VSDs use the same RSS. However,Workload 1 has a higher spatial locality, and thus it receivesa larger throughput increase. Figure 9 (b) clearly shows thatthe throughput of Workload 1 is insignificantly affected by thechanges of spatial locality and arrival rate. In particular, when
Workload 2 runs into the Financial trace with a much reducedarrival rate, it cannot fully use the reserved RSS capability andthe released capability helps improve VSD-1’s throughput.
D. Efficiency of Multi-array Host System
A consolidated system may consist of hybrid storage deviceslike HDD and flash-based SSD. In this section, we evaluatethe impact of VSD migration on the efficiency of the hostsystems. We configure three disk arrays: an HDD array offour fast disks (HDD array A), another HDD array of six fastdisks (HDD array B), and an SSD array of six solid-statedisks (SSD array). To make the experiment manageable, welet all VSDs use the same RSS, an array of two slow disks,and only two traces, VideoStreaming and WebSearch, are usedto form workloads. These two traces represent sequential andrandom access patterns, respectively. For a number of VSDsto be hosted in the hybrid system, we set a sequentialityfactor to control the number of VSDs using VideoStreamingas their workload. The factor is defined as the ratio betweenthe number of VSDs receiving the VideoStreaming workloadand the total number of VSDs in the system. For example, ifwe have ten VSDs with a factor of 0.7, there are seven VSDsreceiving sequential requests from VideoStreaming, and therest receiving random requests from WebSearch. Furthermore,we assume that initially the VSDs on any disk array take theirworkloads from the two traces in a proportion consistent withthe factor. We stress the host system by keeping adding VSDsonto it until no spare capability in any array is available.VSDs are initially placed on the disk array with the largestspare capability. In the process, the pre-set sequentiality factoris maintained for all the VSDs in the system, and is alsomaintained for the VSDs on disk arrays when the YouChoosemigration policy is disabled.
When the YouChoose migration policy is in effect, aresource-consumption matrix is maintained to track how ef-ficiently a VSD’s hosted on a disk array. Table II shows thematrix when there are seven VSDs in the system and thefactor is 0.7. We use 10% as the threshold value for makingmigration decision. The table shows that VSD 7 is currentlyon HDD array A with a service-time percentage of 31.0%,and a migration to the SSD array can reduce the percentageto 14.5%. The migration will be carried out as the percentageis reduced by 16.5%, larger the 10% threshold. As the SSDarray still has spare capability, none of its currently hostedVSDs needs to be migrated out.
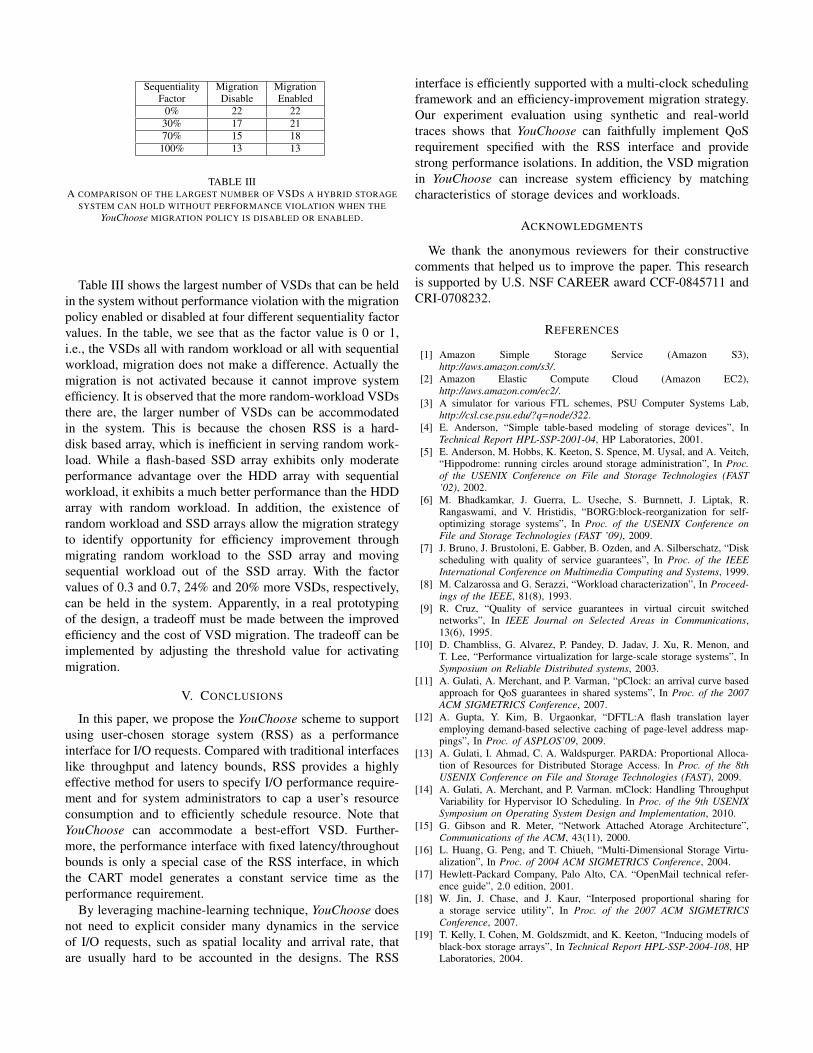
Sequentiality Migration MigrationFactor Disable Enabled
0% 22 2230% 17 2170% 15 18100% 13 13
TABLE IIIA COMPARISON OF THE LARGEST NUMBER OF VSDS A HYBRID STORAGE
SYSTEM CAN HOLD WITHOUT PERFORMANCE VIOLATION WHEN THEYouChoose MIGRATION POLICY IS DISABLED OR ENABLED.
Table III shows the largest number of VSDs that can be heldin the system without performance violation with the migrationpolicy enabled or disabled at four different sequentiality factorvalues. In the table, we see that as the factor value is 0 or 1,i.e., the VSDs all with random workload or all with sequentialworkload, migration does not make a difference. Actually themigration is not activated because it cannot improve systemefficiency. It is observed that the more random-workload VSDsthere are, the larger number of VSDs can be accommodatedin the system. This is because the chosen RSS is a hard-disk based array, which is inefficient in serving random work-load. While a flash-based SSD array exhibits only moderateperformance advantage over the HDD array with sequentialworkload, it exhibits a much better performance than the HDDarray with random workload. In addition, the existence ofrandom workload and SSD arrays allow the migration strategyto identify opportunity for efficiency improvement throughmigrating random workload to the SSD array and movingsequential workload out of the SSD array. With the factorvalues of 0.3 and 0.7, 24% and 20% more VSDs, respectively,can be held in the system. Apparently, in a real prototypingof the design, a tradeoff must be made between the improvedefficiency and the cost of VSD migration. The tradeoff can beimplemented by adjusting the threshold value for activatingmigration.
V. CONCLUSIONS
In this paper, we propose the YouChoose scheme to supportusing user-chosen storage system (RSS) as a performanceinterface for I/O requests. Compared with traditional interfaceslike throughput and latency bounds, RSS provides a highlyeffective method for users to specify I/O performance require-ment and for system administrators to cap a user’s resourceconsumption and to efficiently schedule resource. Note thatYouChoose can accommodate a best-effort VSD. Further-more, the performance interface with fixed latency/throughoutbounds is only a special case of the RSS interface, in whichthe CART model generates a constant service time as theperformance requirement.
By leveraging machine-learning technique, YouChoose doesnot need to explicit consider many dynamics in the serviceof I/O requests, such as spatial locality and arrival rate, thatare usually hard to be accounted in the designs. The RSS
interface is efficiently supported with a multi-clock schedulingframework and an efficiency-improvement migration strategy.Our experiment evaluation using synthetic and real-worldtraces shows that YouChoose can faithfully implement QoSrequirement specified with the RSS interface and providestrong performance isolations. In addition, the VSD migrationin YouChoose can increase system efficiency by matchingcharacteristics of storage devices and workloads.
ACKNOWLEDGMENTS
We thank the anonymous reviewers for their constructivecomments that helped us to improve the paper. This researchis supported by U.S. NSF CAREER award CCF-0845711 andCRI-0708232.
REFERENCES
[1] Amazon Simple Storage Service (Amazon S3),http://aws.amazon.com/s3/.
[2] Amazon Elastic Compute Cloud (Amazon EC2),http://aws.amazon.com/ec2/.
[3] A simulator for various FTL schemes, PSU Computer Systems Lab,http://csl.cse.psu.edu/?q=node/322.
[4] E. Anderson, “Simple table-based modeling of storage devices”, InTechnical Report HPL-SSP-2001-04, HP Laboratories, 2001.
[5] E. Anderson, M. Hobbs, K. Keeton, S. Spence, M. Uysal, and A. Veitch,“Hippodrome: running circles around storage administration”, In Proc.of the USENIX Conference on File and Storage Technologies (FAST’02), 2002.
[6] M. Bhadkamkar, J. Guerra, L. Useche, S. Burnnett, J. Liptak, R.Rangaswami, and V. Hristidis, “BORG:block-reorganization for self-optimizing storage systems”, In Proc. of the USENIX Conference onFile and Storage Technologies (FAST ’09), 2009.
[7] J. Bruno, J. Brustoloni, E. Gabber, B. Ozden, and A. Silberschatz, “Diskscheduling with quality of service guarantees”, In Proc. of the IEEEInternational Conference on Multimedia Computing and Systems, 1999.
[8] M. Calzarossa and G. Serazzi, “Workload characterization”, In Proceed-ings of the IEEE, 81(8), 1993.
[9] R. Cruz, “Quality of service guarantees in virtual circuit switchednetworks”, In IEEE Journal on Selected Areas in Communications,13(6), 1995.
[10] D. Chambliss, G. Alvarez, P. Pandey, D. Jadav, J. Xu, R. Menon, andT. Lee, “Performance virtualization for large-scale storage systems”, InSymposium on Reliable Distributed systems, 2003.
[11] A. Gulati, A. Merchant, and P. Varman, “pClock: an arrival curve basedapproach for QoS guarantees in shared systems”, In Proc. of the 2007ACM SIGMETRICS Conference, 2007.
[12] A. Gupta, Y. Kim, B. Urgaonkar, “DFTL:A flash translation layeremploying demand-based selective caching of page-level address map-pings”, In Proc. of ASPLOS’09, 2009.
[13] A. Gulati, I. Ahmad, C. A. Waldspurger. PARDA: Proportional Alloca-tion of Resources for Distributed Storage Access. In Proc. of the 8thUSENIX Conference on File and Storage Technologies (FAST), 2009.
[14] A. Gulati, A. Merchant, and P. Varman. mClock: Handling ThroughputVariability for Hypervisor IO Scheduling. In Proc. of the 9th USENIXSymposium on Operating System Design and Implementation, 2010.
[15] G. Gibson and R. Meter, “Network Attached Atorage Architecture”,Communications of the ACM, 43(11), 2000.
[16] L. Huang, G. Peng, and T. Chiueh, “Multi-Dimensional Storage Virtu-alization”, In Proc. of 2004 ACM SIGMETRICS Conference, 2004.
[17] Hewlett-Packard Company, Palo Alto, CA. “OpenMail technical refer-ence guide”, 2.0 edition, 2001.
[18] W. Jin, J. Chase, and J. Kaur, “Interposed proportional sharing fora storage service utility”, In Proc. of the 2007 ACM SIGMETRICSConference, 2007.
[19] T. Kelly, I. Cohen, M. Goldszmidt, and K. Keeton, “Inducing models ofblack-box storage arrays”, In Technical Report HPL-SSP-2004-108, HPLaboratories, 2004.
[20] C. Lumb, A. Merchant, and G. Alvarezg, “Facade: virtual storagedevices with performance guaratees”, In Proc. of the 2003 USENIXAnnual Technical Conference, 2003.
[21] C. Lu, G. Alvarez, and J. Wilkes, “Aqueduct: Online data migrationwith performance guarantees”, In Proc. of the Conference on File andStorage Technologies (FAST ’02), 2002.
[22] M. Mesnier, M. Wachs, R. Sambasivan, A. Zheng, and G. Ganger, “Mod-eling the relative fitness of storage”, In Proc. of the ACM SIGMETRICSConference, 2007.
[23] OLTP Application and Search Engine I/O, UMASS Trace Repository,http://traces.cs.umass.edu/index.php/Storage/Storage.
[24] F. Popovici, A. Arpaci-Dusseau, and R. Arpaci-Dusseau, “Robust,portable i/o scheduling with the disk mimic”, In Proc. of the 2003USENIX Annual Technical Conference, 2003.
[25] G. Peng and T. Chiueh, “Availability and fairness support for storageQoS guarantee”, In Proc. of 2008 IEEE ICDCS Conference, 2008.
[26] S. Recker, W. Geisselhardt, and I. Wolff, “Service curve based routingsubject to deterministic QoS constraints”, In Proc. of the 10th Interna-tional Conference on Telecommunications, 2003.
[27] C. Ruemmler and J. Wilkes, “An introduction to disk drive modeling”,In IEEE Computer, 27(3), 1994.
[28] Storage Area Network, http://en.wikipedia.org/wiki/ Stor-age area network.
[29] S. Schlosser, J. Schindler, S. Papadomanolakis, M. Shao, A. Ailamaki,C. Faloutsos, and G. Ganger, “On multidimensional data and moderndisks”, In Proc. of the 4th USENIX Conference on File and StorageTechnologies (Fast ’05), 2005.
[30] E. Smirni and D. Reed, “Workload characterization of input/output inten-sive parallel applications”, In Proc. of the 9th International Conferenceon Computer Performance Evaluation: Modeling and Techniques andTools, 1997.
[31] H. Sariowan, R. Cruz, and G. Polyzos, “Scheduling for quality ofservice guarantees via service curves”, In Proc. of the 4th InternationalConference on Computer Communications and Networks, 1995.
[32] I. Stoica, H. Zhang, and T. Ng, “A hierarchical fair service curvealgorithm for link-sharing, real-time and priority services”, In Proc. ofthe ACM SIGCOMM ’97, 1997.
[33] N. Tran and D. Reed, “Arima time series modeling and forecasting foradaptive I/O prefetching”, In Proc. of the 15th international conferenceon Supercomputing, 2001.
[34] The DiskSim simulation environment (version 3.0),http://www.pdl.cmu.edu/DiskSim/.
[35] S. Uttamchandani, L. Yin, G. Alvarez, J. Palmer, and G. Agha,“Chamelon: a self-evolving, fully-adaptive resource arbitrator for storagesystems.”, In Proc. of the annual conference on USENIX AnnualTechnical Conference, 2005.
[36] M. Wang, K. Au, A. Ailamaki, A. Brockwell, C. Faloutsos, and G.Ganger, “Storage device performance prediction with cart models”, InProc. of the 12th MASCOTS Conference, 2004.
[37] M. Wachs, M. Abd-El-Malek, E. Thereska, and G. Ganger, “Argon:performance insulation for shared storage servers”, In Proc. of the 6thUSENIX Conference on File and Storage Technologies (FAST ’07), 2007.
[38] B. Worthington, G. Ganger, and Y. Patt, “Scheduling algorithm formodern disk drives”, In Proc. of the ACM SIGMETRICS Conference,1994.
[39] J. Wilkes, R. Golding, C. Staelin, and T. Sullivan, “The HP AutoRAIDhierarchical storage system”, In ACM Transactions on Computer Sys-tems, 14(1), 1996.
[40] M. Wang, K. Au, A. Ailamaki, A. Brockwell, C. Faloutsos, andG.Ganger, “Storage device performance prediction with cart models”,In Proc. of the 12th MASCOTS Conference, 2004.
[41] J. Zhang, A. Sivasubramaniam, Q. Wang, A. Riska, and E. Riedel,“Storage performance virtualization via throughput and latency control”,In ACM Transanction on Storage, 2(3), 2006.