Embed Size (px)
Citation preview

NORC at the University of ChicagoThe University of Chicago
You Can't Take It with You? Immigrant Assimilation and the Portability of Human CapitalAuthor(s): Rachel M. FriedbergSource: Journal of Labor Economics, Vol. 18, No. 2 (April 2000), pp. 221-251Published by: The University of Chicago Press on behalf of the Society of Labor Economists andthe NORC at the University of ChicagoStable URL: http://www.jstor.org/stable/10.1086/209957 .
Accessed: 21/08/2014 08:00
Your use of the JSTOR archive indicates your acceptance of the Terms & Conditions of Use, available at .http://www.jstor.org/page/info/about/policies/terms.jsp
.JSTOR is a not-for-profit service that helps scholars, researchers, and students discover, use, and build upon a wide range ofcontent in a trusted digital archive. We use information technology and tools to increase productivity and facilitate new formsof scholarship. For more information about JSTOR, please contact [email protected].
.
The University of Chicago Press, Society of Labor Economists, NORC at the University of Chicago, TheUniversity of Chicago are collaborating with JSTOR to digitize, preserve and extend access to Journal ofLabor Economics.
http://www.jstor.org
This content downloaded from 94.226.81.210 on Thu, 21 Aug 2014 08:00:44 AMAll use subject to JSTOR Terms and Conditions

You Can’t Take It with You?Immigrant Assimilation and thePortability of Human Capital
Rachel M. Friedberg, Brown University and National
Bureau of Economic Research
The national origin of an individual’s human capital is a crucialdeterminant of its value. Education and labor market experienceacquired abroad are significantly less valued than human capitalobtained domestically. This difference can fully explain the earningsdisadvantage of immigrants relative to comparable natives in Israel.Variation in the return to foreign schooling across origin countriesmay reflect differences in its quality and compatibility with the hostlabor market. The return to foreign experience is generally insignif-icant. Acquiring additional education following immigration appearsto confer a compound benefit by raising the return to educationacquired abroad.
I. Introduction
In recent years, much attention has been devoted in the labor literatureto the issue of immigrant labor market assimilation. Upon arrival in theirhost country, immigrants usually command lower wages than native-born workers with comparable measured characteristics. The literature
I thank Joshua Angrist, David Cutler, Henry Farber, Stanley Fischer, LawrenceKatz, and David Weil for helpful discussions; Alexander Cavallo for able researchassistance; and Michal Peleg of the Social Sciences Data Archive at the HebrewUniversity of Jerusalem for providing access to the data. Financial support fromthe Falk Institute for Economic Research in Israel, the Program for the Study ofthe Israeli Economy at MIT, and the U.S. Department of Education is gratefullyacknowledged.
[ Journal of Labor Economics, 2000, vol. 18, no. 2]© 2000 by The University of Chicago. All rights reserved.0734-306X/2000/1802-0005$02.50
221
This content downloaded from 94.226.81.210 on Thu, 21 Aug 2014 08:00:44 AMAll use subject to JSTOR Terms and Conditions
has focused on quantifying the size of this initial earnings differential andthe rate at which it diminishes with time since migration (see Chiswick1978a; Borjas 1985, 1995; Friedberg 1992; LaLonde and Topel 1992;Baker and Benjamin 1994; Schoeni 1997). At issue is whether immigrantsever attain earnings parity with natives and, if so, how long this processtakes. A related question is how the earnings gap differs for immigrantsfrom different countries and different arrival cohorts (see Chiswick 1986;Jasso and Rosenzweig 1988, 1990; Borjas 1992; Funkhouser and Trejo1995; Butcher and DiNardo 1996; Duleep and Regets 1996).1
The innovation of this article is to introduce to this analysis a distinc-tion between human capital acquired abroad and human capital acquireddomestically. Foreign and domestic human capital may not be very closesubstitutes, and considering them as a homogeneous factor may be mis-leading. Many immigrants complete their schooling in their countries oforigin. Many, however, immigrate at young ages and obtain virtually alltheir human capital after immigration. A sizable number possess a com-bination of foreign and domestic human capital. Thus, although previouswork on immigrant and native earnings has allowed the return to humancapital to differ for immigrants and natives, doing so is not equivalent todistinguishing between domestic- and foreign-source human capital in theanalysis of earnings determination.2
This study demonstrates that the most important factor determiningthe gap in the standard human-capital-corrected earnings of immigrantsand natives is the source of their human capital. Foreign human capitaloften—although not always—earns a lower return than domestic humancapital, and this fact alone is sufficient to fully explain the residualearnings disadvantage of immigrants.3
The data most commonly used to study immigrants in the UnitedStates are the series of public-use microdata samples of the U.S. Census ofPopulation. These data do not contain adequate information to reliablydetermine the source of an immigrant’s education. There is no directmeasure of where schooling was obtained, and the information on animmigrant’s year of arrival, which could be used to impute it, is reportedin bracketed form. It is therefore not feasible to analyze the importance of
1 For a comprehensive study, see Smith and Edmonston (1997). For reviews ofthe literature, see LaLonde and Topel (1996) and Borjas (1999).
2 Chiswick (1978a) and Fishelson, Weiss, and Mark (1980) consider the differ-ence in the return to foreign and domestic schooling, but they do not bring thisdirectly to the question of immigrant assimilation.
3 Eckstein and Weiss (1998) study recent immigrants to Israel from the formerSoviet Union and find that the initial return to imported skills is negligible, butthat it rises with time in Israel.
222 Friedberg
This content downloaded from 94.226.81.210 on Thu, 21 Aug 2014 08:00:44 AMAll use subject to JSTOR Terms and Conditions
human capital source using the U.S. Census.4 The Census of Populationin Israel lends itself more readily to this kind of study. It is possible in thisdata to precisely date the timing of immigration. In addition, the lack ofa systematic change in the unobserved quality of successive immigrantcohorts to Israel makes it possible to use a single cross section of data toanalyze assimilation rates. The Israeli case provides a large, richly variedpool of immigrants to observe. These immigrants have come from a widerange of countries and have vastly different educational and occupationalbackgrounds.
This article first establishes that the national origin of an individual’shuman capital is a crucial determinant of its return. It shows that the gapin the residual earnings of immigrant and native workers is eliminated oreven reversed once this factor is taken into account. It then goes on toshow when the difference in returns is most marked and what factorsmitigate it. Section II of the article presents the econometric model andhighlights important restrictions implicit in the standard specificationused in the immigration literature. The third section provides basic factsabout immigration to Israel and describes the data used. Section IVpresents the empirical results in three steps. First, it examines the effectsof immigrant status and length of residence on earnings, comparing thereturns to human capital obtained in the country of origin and in Israel.Second, it analyzes whether human capital acquired subsequent to immi-gration may raise the return to human capital obtained abroad. This isfollowed by an analysis of the extent to which the portability of educationdepends on its level or configuration, in terms of type and source. Thefinal section of the article summarizes and discusses implications for theimmigration literature and for immigration policy.
II. Immigrants’ Earnings and the Returns to Human Capital
When immigrants first arrive in a new country, they are at a disadvan-tage in the labor market relative to natives with comparable demographiccharacteristics and measured skill levels. One reason is that natives havecountry-specific skills and information that immigrants lack. As immi-grants spend time in the host country and gradually acquire this country-specific knowledge, their labor market performance may improve relativeto that of their native counterparts. The rate at which the earnings gapbetween immigrants and natives narrows with years since migration isreferred to as the assimilation rate. The standard earnings function used inthe immigration literature (due to Chiswick 1978a) is
4 The 1976 Survey of Income and Education (SIE) is a U.S. data set containingdirect information on country of schooling, but the sample of immigrants is small.See Borjas (1982) and Friedberg (1993) for examples of papers that use the SIE.
Immigrant Assimilation 223
This content downloaded from 94.226.81.210 on Thu, 21 Aug 2014 08:00:44 AMAll use subject to JSTOR Terms and Conditions

y 5 a0 1 a1ED 1 a2EXP 1 a3EXP2 1 a4M
1 a5YSM 1 a6YSM2 1 ε, (1)
where y is log earnings, ED is years of schooling completed, EXP is yearsof potential labor market experience, M is a dummy variable for immi-grant status, and YSM is the number of years elapsed since an immigrant’sarrival in the host country. Since years since migration is held constant inthis regression, the coefficient on the immigrant status dummy measuresthe initial earnings disadvantage of a newly arrived immigrant relative toan otherwise comparable native. In the absence of systematic changes inthe unobserved earnings potential (ε) of successive immigrant arrivalcohorts, the coefficients on YSM capture the rate at which the immigrant-native earnings gap narrows as immigrants assimilate into the labormarket.
There are some important restrictions implicit in estimating equation(1). To see this, consider recasting the model purely in terms of educationand experience. Let EDi and EXPi denote years of schooling and poten-tial labor market experience obtained in country i, where i 5 1 for thecountry of origin and i 5 2 for the destination country.5 Thus,
ED 5 ED1 1 ED2 (2)
and
EXP 5 EXP1 1 EXP2. (3)
By definition, YSM 5 0 for natives, while for immigrants,
YSM 5 EXP2 1 ED2 1 k, (4)
where k 5 max(0, 6 2 age 1 YSM).6 Ignoring quadratic terms, equation(1) can, therefore, be rewritten as
y 5 a0 1 a1~ED1 1 ED2! 1 a2~EXP1 1 EXP2! 1 a4M
1 a5@~ED2 1 EXP2 1 k! 3 M# 1 ε, (5)
5 By construction, ED1 5 0 and EXP1 5 0 for natives. While some native-bornIsraelis may have attended school or worked abroad, there is no informationavailable on this in the census data. The return to ED1 and EXP1 will thereforemeasure the return to foreign schooling and experience for immigrants only.
6 In the data used here, k equals 0 for the 81% of immigrants who migrated toIsrael after the age of 6, and k equals between 1 and 6 for the others.
224 Friedberg
This content downloaded from 94.226.81.210 on Thu, 21 Aug 2014 08:00:44 AMAll use subject to JSTOR Terms and Conditions
or, collecting terms, as
y 5 a0 1 ~a4 1 a5 3 k! M 1 a1ED1 1 a1ED2 1 a5~ED2 3 M!
1 a2EXP1 1 a2EXP2 1 a5~EXP2 3 M! 1 ε. (6)
There are eight coefficients but only five underlying parameters in thismodel. Equation (1) is thus equivalent to a restricted version of a humancapital earnings function that allows the return to human capital to varyaccording to its source (i 5 1, 2) and the worker’s nativity (M 5 0, 1).Relabeling the coefficients, that is,
y 5 b0 1 b1M 1 b2ED1 1 b3ED2 1 b4~ED2 3 M!
1 b5EXP1 1 b6EXP2 1 b7~EXP2 3 M! 1 ε, (7)
we see that equation (1) imposes the following three restrictions: (1) b25 b3, (2) b5 5 b6, and (3) b4 5 b7. The first restriction imposes equalreturns to immigrants’ foreign schooling and natives’ domestic schooling.The second restriction imposes equal returns to immigrants’ foreign labormarket experience and natives’ domestic labor market experience. Be-cause of the first two restrictions, the third restriction has two interpre-tations. It constrains the relative return to immigrants’ foreign and do-mestic human capital to be the same for both education and experience. Italso constrains the immigrant-native differential in the return to domestichuman capital to be the same for both education and experience.
Although equation (1) is the standard specification used in the litera-ture, as will be seen in the empirical estimates below, the data stronglyreject these restrictions. This is not surprising, considering the manyreasons why the return to human capital might differ, depending onwhether the schooling or experience was acquired abroad or domesticallyand on whether the worker is an immigrant or a native.
The degree to which the human capital that immigrants acquired intheir countries of origin is transferable into earnings potential in theirdestination country—the “portability” of their human capital—is mea-sured by b2 and b5. Differences across origin groups in the value placedon foreign human capital may stem from two factors. First, school qualityvaries considerably across countries. Immigrants from developed coun-tries, for example, might receive a higher return to their foreign educationthan immigrants from developing countries because schooling is generallyof lower quality in the latter. A second important factor is the compati-bility of the human capital received abroad with the skill requirements ofthe host-country labor market. The more similar the origin and destina-tion countries are in terms of their levels of economic development,industrial and occupational structures, institutional settings, and so forth,
Immigrant Assimilation 225
This content downloaded from 94.226.81.210 on Thu, 21 Aug 2014 08:00:44 AMAll use subject to JSTOR Terms and Conditions
the more likely it is that education and work experience received in theorigin country will be highly valued in the destination labor market. Evenwithin country of origin, the type of education is likely to be importantfor its portability. For example, elementary school education might trans-fer well for many origin groups, while law and other professional school-ing might not.
The return to domestic human capital for immigrants may differ fromthe return received by natives, that is, b4 and b7 may not equal zero. Onthe one hand, natives have an advantage in language and other country-specific knowledge, which may enable them to gain more productivity-enhancing skills from a given year of formal instruction or work experi-ence. On the other hand, time spent at school or work in the host countryhas compound benefits for immigrants since in addition to acquiring thehuman capital usually associated with schooling and experience, immi-grants gain language skills, learn about domestic institutions and norms,and so forth. The marginal return to a year of investment in domestichuman capital could, therefore, be lower or higher for immigrants thanfor natives.
In addition to the direct effects of foreign and domestic human capitalon immigrants’ labor market success, there may well be important inter-actions between them. The earnings of more- and less-skilled immigrantsmay be compressed upon their arrival in the host country, with bothgroups constrained to work in low-skill jobs that require little languageproficiency or other country-specific human capital. Over time, as theygain exposure to the new labor market, immigrants become better able tomaximize the return to their origin-country skills through several types oflearning. These include learning by doing on the job, accumulating moreinformation about the host labor market, and engaging in search to findbetter earnings opportunities and job matches. As a result, immigrantsmay gradually sort themselves into more differentiated occupations, re-sulting in a rise in skill differentials (b2 and b5) among immigrants withlabor market experience in the host country.7 A rise with time sincemigration in the return to schooling obtained abroad is definitionallyequivalent to a faster assimilation rate for better-educated immigrants. Wealso might expect earnings growth to be greater for more educatedimmigrants because the gap between their initial and potential occupa-tional standing is greater.
An even more effective way for immigrants to gain the skills necessaryto adapt their previously acquired training to their new country may be
7 For empirical evidence documenting occupational downgrading upon arrivaland subsequent upgrading with duration of residence, see Chiswick (1978b) andJasso and Rosenzweig (1988) for the United States, and Sabatello (1979) and Flug,Kasir, and Ofer (1992) for Israel.
226 Friedberg
This content downloaded from 94.226.81.210 on Thu, 21 Aug 2014 08:00:44 AMAll use subject to JSTOR Terms and Conditions
by obtaining further formal education after arrival. Attending school inthe host country may aid in the transferability of an immigrant’s humancapital by giving him the language proficiency needed to literally translatehis skills. It may also provide him with other country-specific humancapital that will enable him better to apply his previously acquired skillsin the new labor market setting.8 Especially for immigrants who arrivewith education or training that is not very well matched to the hostcountry, attending school there may be invaluable in teaching them to usethat human capital in ways rewarded in the host labor market. Suchknowledge might be very difficult to obtain without further formalinstruction. A higher return to an immigrant’s foreign schooling when ithas been followed by schooling in the host country is consistent with thehypothesis that domestic schooling raises the return to schooling ob-tained abroad. It could, however, also reflect positive self-selection on thepart of individuals who choose to get further schooling after immigration.Immigrants differ in both their incentives and their capacity to acquiredomestic human capital. More educated immigrants might have a highernet benefit from acquiring domestic skills than less educated immigrants,and if prior education is correlated with unobserved ability, the estimatedreturn to domestic human capital will be higher for the more educated.Unfortunately, it is impossible to distinguish between treatment andselection effects using the available data.
To measure the importance of interaction effects, equation (7) is mod-ified by the addition of three variables interacting foreign and domestichuman capital:9
y 5 b0 1 b1M 1 b2ED1 1 b3ED2 1 b4~ED2 3 M! 1 b5EXP1
1 b6EXP2 1 b7~EXP2 3 M! 1 b8~ED1 3 ED2!
1 b9~ED1 3 EXP2! 1 b10~EXP1 3 EXP2! 1 ε.
(8)
III. Immigration to Israel and the Census of Population Data
Like the United States, Israel is a country of immigrants. Israel con-tinues to receive very large inflows, relative to its population. Most
8 One example is that in Israel, as in many countries, immigrant lawyers andphysicians must pass a series of licensing exams in order to practice. In the case oflaw, there is a “conversion” exam covering general legal principles, which isfollowed by the bar exam. For physicians, there is a licensing exam for generalcompetence, which is followed by specialization exams. For all of these exams,immigrants commonly attend 6-month-long preparatory courses (often offered intheir native languages). There are also required internship periods for both lawand medicine, which typically last over a year.
9 Note that if EXP1 . 0, then by construction ED2 5 0, so there is nointeraction term for EXP1 and ED2.
Immigrant Assimilation 227
This content downloaded from 94.226.81.210 on Thu, 21 Aug 2014 08:00:44 AMAll use subject to JSTOR Terms and Conditions
current immigrants are from the former Soviet Union. Earlier immigrantsoriginated in diverse parts of the world, with the largest concentrationscoming from Eastern Europe and North Africa.
The data used in this study are the public-use microdata samples of thetwo most recent available Israeli Censuses of Population and Housing,conducted in 1972 and 1983 (Israel Central Bureau of Statistics 1974,1985). As stated earlier, these data have the advantage that year ofmigration is recorded as a continuous variable, rather than in the brack-eted form available in the U.S. Census. Appendix B uses both Israelicensuses to show that, in the Israeli case, one cross section is sufficient toidentify the parameters of interest. This is because the coefficient on yearssince migration in the single 1983 cross section is found indeed to reflectassimilation rather than a decline in cohort quality over time. The analysiscan therefore be conducted on the 1983 data alone.10 This is anotherstrength, relative to the U.S. case, in which the issue of changing cohortquality necessitates the use of multiple cross sections. All Israeli citi-zens—Jews, Arabs, and others—are included in the census. This coversvirtually all residents of Israel proper, as well as citizens living in the WestBank and the Gaza Strip, who constitute 2% of the Israeli population.The census microdata are a one-in-five sample of the population.
In order to facilitate comparisons with results from the literature onimmigration to the United States, which focuses primarily on male im-migrants, the sample is restricted to men ages 25–65.11 In addition, so asnot to confound the present analysis with the issue of Arab-Jewishdifferences in the labor market, Arabs are not included in the sample.Kibbutz and collective members, students, and the self-employed are alsoexcluded. Finally, only full-time, salaried, nonagricultural workers re-porting earnings of between 5,000 and 500,000 Israeli shekels per monthare retained.12 After these adjustments, 54,103 individuals remain in the1983 sample.
Only one-third of these men are native-born Israelis. The foreign-born
10 Although most of the literature on immigrant assimilation uses cross-sec-tional data, this is primarily due to the unavailability of panel data. Panel datawould be superior since one could directly track individual developments overtime rather than infer them.
11 For military security reasons, men between the ages of 18 and 24 are codedas age 21 in the public-use files of the census microdata. Such censoring generatesdifficulties in calculating many key variables used in the analysis, such as yearssince migration. Men under the age of 25 are therefore excluded from the sample.Given Israel’s compulsory 3-year military service, many men in this age rangewould not be employed in the civilian labor market in any event.
12 This is equal to approximately $90–$9,000 in 1983 U.S. dollars. About 10%of the sample had zero income. Another 3% had income below 5,000 shekels, and0.1% had income over 500,000 shekels.
228 Friedberg
This content downloaded from 94.226.81.210 on Thu, 21 Aug 2014 08:00:44 AMAll use subject to JSTOR Terms and Conditions
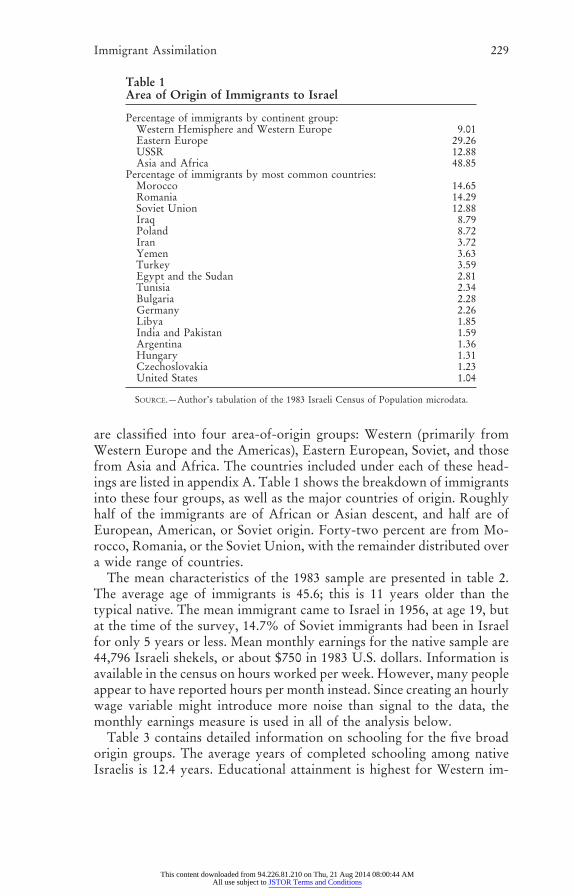
are classified into four area-of-origin groups: Western (primarily fromWestern Europe and the Americas), Eastern European, Soviet, and thosefrom Asia and Africa. The countries included under each of these head-ings are listed in appendix A. Table 1 shows the breakdown of immigrantsinto these four groups, as well as the major countries of origin. Roughlyhalf of the immigrants are of African or Asian descent, and half are ofEuropean, American, or Soviet origin. Forty-two percent are from Mo-rocco, Romania, or the Soviet Union, with the remainder distributed overa wide range of countries.
The mean characteristics of the 1983 sample are presented in table 2.The average age of immigrants is 45.6; this is 11 years older than thetypical native. The mean immigrant came to Israel in 1956, at age 19, butat the time of the survey, 14.7% of Soviet immigrants had been in Israelfor only 5 years or less. Mean monthly earnings for the native sample are44,796 Israeli shekels, or about $750 in 1983 U.S. dollars. Information isavailable in the census on hours worked per week. However, many peopleappear to have reported hours per month instead. Since creating an hourlywage variable might introduce more noise than signal to the data, themonthly earnings measure is used in all of the analysis below.
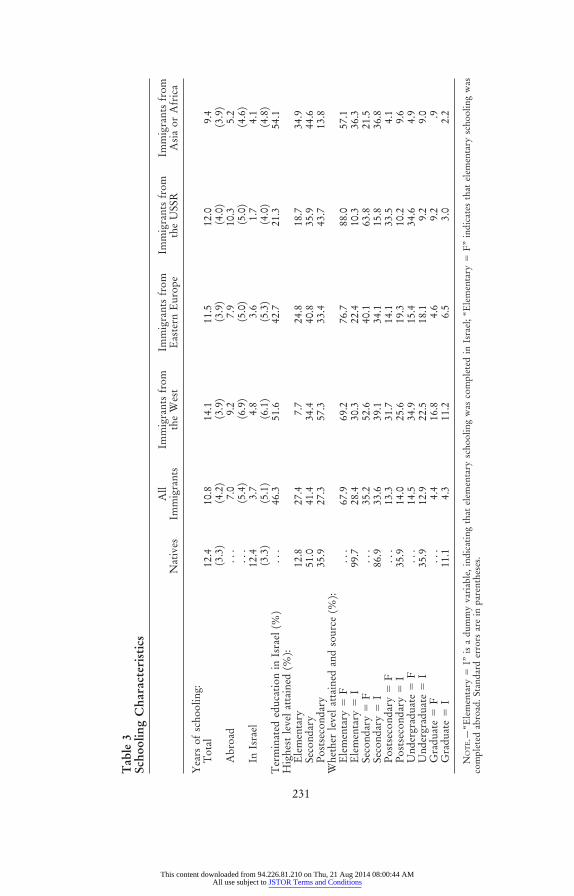
Table 3 contains detailed information on schooling for the five broadorigin groups. The average years of completed schooling among nativeIsraelis is 12.4 years. Educational attainment is highest for Western im-
Table 1Area of Origin of Immigrants to Israel
Percentage of immigrants by continent group:Western Hemisphere and Western Europe 9.01Eastern Europe 29.26USSR 12.88Asia and Africa 48.85
Percentage of immigrants by most common countries:Morocco 14.65Romania 14.29Soviet Union 12.88Iraq 8.79Poland 8.72Iran 3.72Yemen 3.63Turkey 3.59Egypt and the Sudan 2.81Tunisia 2.34Bulgaria 2.28Germany 2.26Libya 1.85India and Pakistan 1.59Argentina 1.36Hungary 1.31Czechoslovakia 1.23United States 1.04
SOURCE.—Author’s tabulation of the 1983 Israeli Census of Population microdata.
Immigrant Assimilation 229
This content downloaded from 94.226.81.210 on Thu, 21 Aug 2014 08:00:44 AMAll use subject to JSTOR Terms and Conditions

Tab
le2
Sum
mar
ySt
atis
tics
Nat
ives
All
Imm
igra
nts
Imm
igra
nts
from
the
Wes
tIm
mig
rant
sfr
omE
aste
rnE
urop
eIm
mig
rant
sfr
omth
eU
SSR
Imm
igra
nts
from
Asi
aor
Afr
ica
Gro
ssm
onth
lyin
com
e(1
983
Isra
eli
shek
els)
44,7
9641
,505
55,5
9348
,270
41,2
9434
,910
(32,
056)
(29,
754)
(37,
737)
(33,
000)
(29,
014)
(23,
833)
Hou
rsw
orke
dpe
rw
eek
48.9
47.9
48.4
48.1
47.5
47.8
(6.5
)(5
.8)
(6.5
)(6
.0)
(5.5
)(5
.6)
Wee
ksw
orke
dpe
rye
ar50
.551
.050
.251
.351
.250
.9(8
.1)
(7.3
)(7
.3)
(6.3
)(7
.0)
(7.8
)Y
ear
ofm
igra
tion
...
1956
1958
1953
1968
1955
...
(11.
0)(1
4.6)
(9.9
)(1
2.2)
(8.0
)P
erce
ntag
ew
ith
5or
few
erye
ars
sinc
em
igra
tion
...
3.7
9.1
1.1
14.7
1.2
Age
atm
igra
tion
...
18.7
18.9
19.8
29.1
15.2
...
(12.
6)(1
3.6)
(11.
7)(1
4.0)
(10.
7)A
ge34
.845
.644
.249
.844
.343
.7(8
.6)
(10.
9)(1
0.8)
(10.
6)(1
1.5)
(10.
1)Y
ears
ofex
peri
ence
(tot
al)
16.4
28.7
24.1
32.3
26.2
28.2
(8.9
)(1
2.4)
(12.
1)(1
2.3)
(12.
7)(1
1.8)
Yea
rsof
expe
rien
ceab
road
...
6.2
4.7
6.4
13.0
4.7
...
(9.2
)(7
.9)
(8.6
)(1
2.5)
(7.9
)Y
ears
ofex
peri
ence
inIs
rael
16.4
22.5
19.3
25.9
13.2
23.5
(8.9
)(1
0.5)
(12.
1)(1
0.3)
(9.8
)(8
.7)
N18
,488
35,6
153,
209
10,4
224,
587
17,3
97
NO
TE.—
Fig
ures
are
mea
nsfo
rth
esa
mpl
eof
full-
tim
e,sa
lari
ed,n
onag
ricu
ltur
alm
ale
wor
kers
ages
25–
65in
the
1983
Isra
eliC
ensu
sof
Pop
ulat
ion.
Stan
dard
devi
atio
nsar
ein
pare
nthe
ses.
230
This content downloaded from 94.226.81.210 on Thu, 21 Aug 2014 08:00:44 AMAll use subject to JSTOR Terms and Conditions
Tab
le3
Scho
olin
gC
hara
cter
isti
cs
Nat
ives
All
Imm
igra
nts
Imm
igra
nts
from
the
Wes
tIm
mig
rant
sfr
omE
aste
rnE
urop
eIm
mig
rant
sfr
omth
eU
SSR
Imm
igra
nts
from
Asi
aor
Afr
ica
Yea
rsof
scho
olin
g:T
otal
12.4
10.8
14.1
11.5
12.0
9.4
(3.3
)(4
.2)
(3.9
)(3
.9)
(4.0
)(3
.9)
Abr
oad
...
7.0
9.2
7.9
10.3
5.2
...
(5.4
)(6
.9)
(5.0
)(5
.0)
(4.6
)In
Isra
el12
.43.
74.
83.
61.
74.
1(3
.3)
(5.1
)(6
.1)
(5.3
)(4
.0)
(4.8
)T
erm
inat
eded
ucat
ion
inIs
rael
(%)
...
46.3
51.6
42.7
21.3
54.1
Hig
hest
leve
lat
tain
ed(%
):E
lem
enta
ry12
.827
.47.
724
.818
.734
.9Se
cond
ary
51.0
41.4
34.4
40.8
35.9
44.6
Pos
tsec
onda
ry35
.927
.357
.333
.443
.713
.8W
heth
erle
vel
atta
ined
and
sour
ce(%
):E
lem
enta
ry5
F..
.67
.969
.276
.788
.057
.1E
lem
enta
ry5
I99
.728
.430
.322
.410
.336
.3Se
cond
ary
5F
...
35.2
52.6
40.1
63.8
21.5
Seco
ndar
y5
I86
.933
.639
.134
.115
.836
.8P
osts
econ
dary
5F
...
13.3
31.7
14.1
33.5
4.1
Pos
tsec
onda
ry5
I35
.914
.025
.619
.310
.29.
6U
nder
grad
uate
5F
...
14.5
34.9
15.4
34.6
4.9
Und
ergr
adua
te5
I35
.912
.922
.518
.19.
29.
0G
radu
ate
5F
...
4.4
16.8
4.6
9.2
.9G
radu
ate
5I
11.1
4.3
11.2
6.5
3.0
2.2
NO
TE.—
“Ele
men
tary
5I”
isa
dum
my
vari
able
,ind
icat
ing
that
elem
enta
rysc
hool
ing
was
com
plet
edin
Isra
el;“
Ele
men
tary
5F
”in
dica
tes
that
elem
enta
rysc
hool
ing
was
com
plet
edab
road
.Sta
ndar
der
rors
are
inpa
rent
hese
s.
231
This content downloaded from 94.226.81.210 on Thu, 21 Aug 2014 08:00:44 AMAll use subject to JSTOR Terms and Conditions
migrants (14.1 years) and lowest for Asian/African immigrants (9.4years). More than one-third of Asian/African immigrants have onlyattended elementary school, while over one-third of native Israelis and57.3% of Western immigrants have had some postsecondary education.
The measure of education used here is the number of completed yearsof schooling.13 To construct measures of the years of schooling completedin the country of origin and in Israel, it is assumed that children startschool at the age of seven and attend continuously until completing theirtotal years of schooling. Since the age at which an immigrant arrived inIsrael is known, one can calculate the years of schooling that would havebeen completed before and after his move to Israel.14 The resulting meanyears of schooling in Israel and abroad are shown in the second and thirdrows of table 3. Just under half of all immigrants have attended school inIsrael, with 19% of them having received all their schooling domesticallyand 27.5% having attended school both before and after immigrating. Theaverage fraction of schooling acquired abroad is 65%. This fraction islowest for Asian/African immigrants (55%) and highest for Soviet immi-grants (86%), only one-fifth of whom have attended school in Israel at all.
IV. Empirical Results
A. The Return to Foreign versus Domestic Human Capital forImmigrants and Natives
The first column of table 4 presents estimates of equation (5), thestandard specification that constrains the returns to schooling and expe-rience to be invariant to the worker’s nativity and to where the human
13 Observations for which the last type of schooling was postsecondary yeshiva(religious academy) are excluded from the sample. This is because religious Jewsoften continue to study at such institutions throughout their lives. Attending apostsecondary yeshiva is better classified as a religious activity than as a programof human capital accumulation applicable in the labor market. Thus, including inthe sample individuals who count years spent at a yeshiva in their total years ofschooling would bias the coefficient on schooling downward. Also excluded arethe small number of other people in the sample who report over 27 years ofschooling.
14 For an individual with a discontinuous schooling history who temporarilysuspended his education while still in his country of origin, this method willoverstate the number of years acquired abroad. The bias will be greater the longeran individual was out of school between schooling spells abroad or—if he did notreturn to school abroad at all following the interruption—the longer he was outof school before migrating. This will lead to an underestimate of b2 and anoverestimate of b3. To test the accuracy of this imputation technique, I applied itto data from the U.S. Survey of Income and Education, a dataset which alsocontains direct information on years of schooling completed abroad. The corre-lation between the true and imputed measures of origin-country schooling was0.78.
232 Friedberg
This content downloaded from 94.226.81.210 on Thu, 21 Aug 2014 08:00:44 AMAll use subject to JSTOR Terms and Conditions
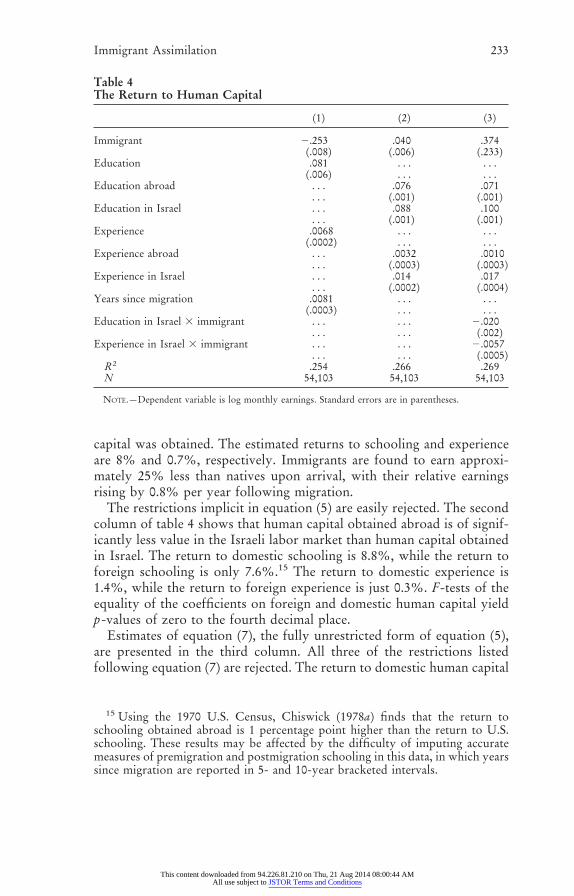
capital was obtained. The estimated returns to schooling and experienceare 8% and 0.7%, respectively. Immigrants are found to earn approxi-mately 25% less than natives upon arrival, with their relative earningsrising by 0.8% per year following migration.
The restrictions implicit in equation (5) are easily rejected. The secondcolumn of table 4 shows that human capital obtained abroad is of signif-icantly less value in the Israeli labor market than human capital obtainedin Israel. The return to domestic schooling is 8.8%, while the return toforeign schooling is only 7.6%.15 The return to domestic experience is1.4%, while the return to foreign experience is just 0.3%. F-tests of theequality of the coefficients on foreign and domestic human capital yieldp-values of zero to the fourth decimal place.
Estimates of equation (7), the fully unrestricted form of equation (5),are presented in the third column. All three of the restrictions listedfollowing equation (7) are rejected. The return to domestic human capital
15 Using the 1970 U.S. Census, Chiswick (1978a) finds that the return toschooling obtained abroad is 1 percentage point higher than the return to U.S.schooling. These results may be affected by the difficulty of imputing accuratemeasures of premigration and postmigration schooling in this data, in which yearssince migration are reported in 5- and 10-year bracketed intervals.
Table 4The Return to Human Capital
(1) (2) (3)
Immigrant 2.253 .040 .374(.008) (.006) (.233)
Education .081 . . . . . .(.006) . . . . . .
Education abroad . . . .076 .071. . . (.001) (.001)
Education in Israel . . . .088 .100. . . (.001) (.001)
Experience .0068 . . . . . .(.0002) . . . . . .
Experience abroad . . . .0032 .0010. . . (.0003) (.0003)
Experience in Israel . . . .014 .017. . . (.0002) (.0004)
Years since migration .0081 . . . . . .(.0003) . . . . . .
Education in Israel 3 immigrant . . . . . . 2.020. . . . . . (.002)
Experience in Israel 3 immigrant . . . . . . 2.0057. . . . . . (.0005)
R2 .254 .266 .269N 54,103 54,103 54,103
NOTE.—Dependent variable is log monthly earnings. Standard errors are in parentheses.
Immigrant Assimilation 233
This content downloaded from 94.226.81.210 on Thu, 21 Aug 2014 08:00:44 AMAll use subject to JSTOR Terms and Conditions
is higher than the return to foreign human capital, and it is higher fornatives than for immigrants. The native-immigrant gap is 2 percentagepoints for schooling and 0.6 percentage points for experience. The factthat natives receive a higher return lends support to the argument thattheir country-specific skills, including their superior Hebrew fluency,enable them to extract more productive potential from a year of schoolingor experience than can immigrants. There is a 10.0% return to domesticschooling for natives, an 8.0% return to domestic schooling for immi-grants, and a 7.1% return to foreign schooling for immigrants. The resultsfor experience show a similar pattern: native earnings rise by 1.7% foreach year of domestic experience, while immigrants gain 1.1% for eachyear of domestic experience and just 0.1% for years of foreign experience.F-tests of the equality of the native and immigrant coefficients yieldp-values of zero to the fourth decimal place.
At first glance, the results of equations (5) and (7) might seem tocontradict each other. By definition in equation (4), ED2 3 M and EXP23 M roughly sum to years since migration. The negative estimatedcoefficients b4 and b7 on the former variables in equation (7) mighttherefore seem inconsistent with the positive coefficient on the latterfound in equation (5), a5. The key to reconciling these results lies inunderstanding the difference in the implicit benchmark in the two spec-ifications. The coefficients b4 and b7 measure the return to immigrants’domestic human capital relative to the return to natives’ domestic humancapital. The coefficient a5 measures the return to immigrants’ domestichuman capital relative to a weighted average of the returns to natives’domestic and immigrants’ foreign human capital, which are constrained inequation (5) to be equal. The estimates from the two specifications are,therefore, not inconsistent: the return to immigrants’ domestic humancapital is lower than the return to natives’ domestic human capital, but itis higher than the return to immigrants’ foreign human capital.16
The earnings gap between immigrants and natives can be fully ex-plained by the lower value placed on the immigrants’ human capital. Inequation (5), immigrants were found to earn about one-quarter less thannatives upon arrival. In equation (7), once the return to human capital isallowed to differ for immigrants and natives and for foreign and domestichuman capital, newly arrived immigrants no longer earn less than natives.
16 These two specifications highlight a problem with the standard interpretationof a5 as a measure of the assimilation rate. Recall that the assimilation rate is therate at which immigrants’ earnings grow more quickly than natives’ over time asboth groups accumulate domestic labor market experience. In fact, the coefficienta5 actually measures the rise in immigrants’ earnings, holding total education andexperience constant, as the source mix of their human capital shifts from foreignto domestic.
234 Friedberg
This content downloaded from 94.226.81.210 on Thu, 21 Aug 2014 08:00:44 AMAll use subject to JSTOR Terms and Conditions
In fact, taking into consideration that their human capital is all foreignand that foreign human capital is less valued than natives’ human capital,immigrants earn roughly 37.4% more than natives. This is seen in thechange in the value of the estimated coefficient on the immigrant dummyvariable across the two specifications.
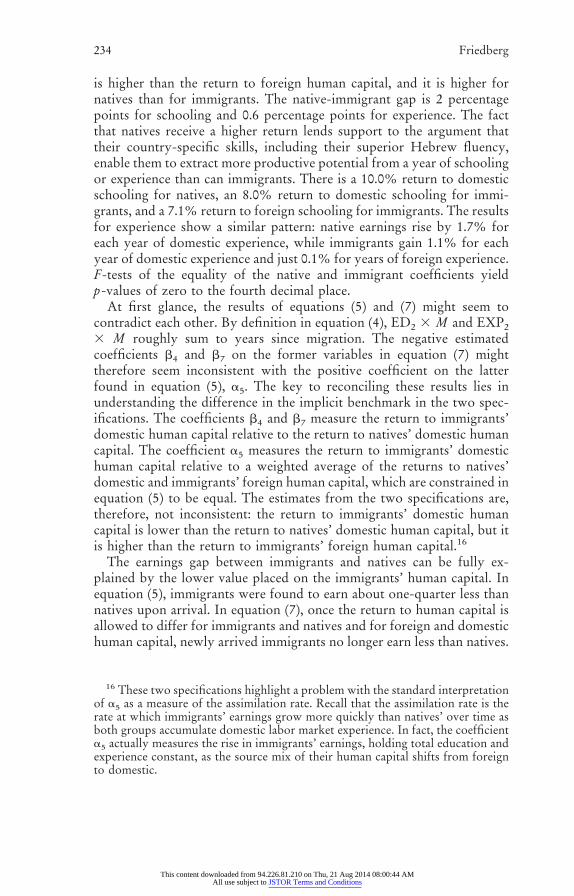
The results when immigrants are split into four area-of-origin groupsare shown in table 5. Foreign human capital always earns a lower returnthan domestic human capital. The highest return to schooling obtainedabroad is found among immigrants from the West (7.1%), while immi-grants from Asia and Africa earn the lowest return (5.7%). While thispattern supports the idea that Western school quality is higher and bettermatched to the Israeli labor market than Asian/African schooling, theseresults could also reflect less discrimination between Western and Asian/African immigrant workers at lower levels of education than at higherlevels. With respect to experience accumulated abroad, the return isactually negative for Eastern Europeans (20.5%) and is insignificantlydifferent from zero for Westerners, Soviets, and Asians/Africans.17
Comparing the return to Israeli schooling across groups, Westernersagain receive the highest return (8.1%) and Asian/African immigrants thelowest (6.5%). With respect to Israeli labor market experience, Soviet and
17 A negative coefficient on EXP1 could reflect the negative effect on earningsof immigrating at an older age (see Friedberg 1992).
Table 5The Return to Human Capital (by Area of Origin)
NativesAll
Immigrants
Immigrantsfrom the
West
Immigrantsfrom
EasternEurope
Immigrantsfrom the
USSR
Immigrantsfrom Asiaor Africa
Educationabroad .071 .071 .067 .064 .057
(.001) (.003) (.002) (.002) (.001)Education in
Israel .100 .079 .081 .072 .077 .065(.001) (.001) (.003) (.002) (.003) (.001)
Experienceabroad .001 .001 2.005 2.0002 2.0002
(.0004) (.002) (.001) (.0007) (.0006)Experience in
Israel .017 .012 .014 .008 .014 .009(.0004) (.0003) (.001) (.001) (.001) (.001)
Constant 9.01 9.39 9.40 9.65 9.49 9.52(.018) (.015) (.055) (.034) (.035) (.022)
R2 .297 .250 .205 .223 .292 .176N 18,488 35,615 3,209 10,422 4,587 17,397
NOTE.—Dependent variable is log monthly earnings. Standard errors are in parentheses.
Immigrant Assimilation 235
This content downloaded from 94.226.81.210 on Thu, 21 Aug 2014 08:00:44 AMAll use subject to JSTOR Terms and Conditions
Western immigrants earn the highest return (1.4%, as compared to 1.7%for natives), with the other immigrant groups earning substantially less.
B. Raising the Return to Foreign Human Capital
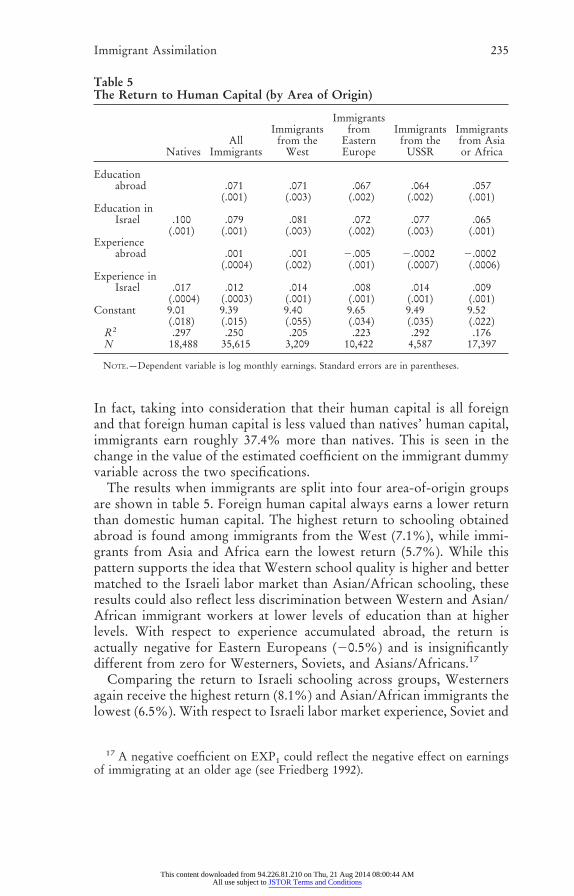
Having established that the lower value placed on immigrants’ humancapital fully explains their earnings disadvantage relative to natives withthe same observable characteristics, a natural question is whether thisdifference is fixed or whether there exist factors that can reduce oreliminate it. This section studies whether acquiring domestic labor marketexperience or education might raise the return to foreign human capital.Estimates of equation (8) are reported in table 6.18
One way immigrants may learn to adapt their previously acquiredtraining to Israel could be by obtaining further formal education afterarrival. The interaction of foreign and Israeli schooling enters positivelyand significantly in the regression for immigrants taken as a whole,meaning that immigrants who attend school in Israel earn a higher returnon their country-of-origin human capital than immigrants who com-pleted their education abroad. For the average immigrant, who has com-pleted 3.7 years of schooling in Israel, this interaction raises the averagereturn to origin-source education to 7.6%, eliminating half of the gapbetween the returns to foreign and Israeli schooling. For Asian/Africanimmigrants, there is a large rise in the return to foreign schooling resultingfrom acquiring further education in Israel. Just 3 years of schooling inIsrael completely eliminate the difference in the return to foreign school-ing and the return to Israeli schooling. It is not surprising that the indirecteffect of domestic schooling would be largest for immigrants from Asiaand Africa since, among immigrant groups, their country-of-origin edu-cation is initially least valued in the Israeli economy. East Europeanimmigrants also experience an increase in the return to their source-country education following schooling in Israel, but the effect for thisgroup is smaller. For Western immigrants, there is a puzzling negativeeffect of having attended school in Israel on the return to educationacquired abroad. It is unclear what lies behind this anomaly, though itcould be negative selection: the results overall are consistent with a modelin which acquiring further education raises the return to schooling ob-tained abroad. But as pointed out above, they could also reflect self-
18 In results not reported here (see Friedberg 1996), immigrants who do notspeak Hebrew are found to earn 14% less than other immigrants. This effect islarger for more educated immigrants. The rise in the return to foreign schoolingassociated with some knowledge of Hebrew is 2.2 percentage points per year ofschooling. Hebrew language ability thus considerably raises the return to school-ing obtained abroad, but it cannot eliminate the gap between the returns to foreignand domestic education.
236 Friedberg
This content downloaded from 94.226.81.210 on Thu, 21 Aug 2014 08:00:44 AMAll use subject to JSTOR Terms and Conditions

Tab
le6
Post
imm
igra
tion
Hum
anC
apit
alA
ccum
ulat
ion
All
Imm
igra
nts
Imm
igra
nts
from
the
Wes
tIm
mig
rant
sfr
omE
aste
rnE
urop
eIm
mig
rant
sfr
omth
eU
SSR
Imm
igra
nts
from
Asi
aor
Afr
ica
Edu
cati
onab
road
.072
.068
.071
.057
.057
(.001
)(.0
04)
(.003
)(.0
03)
(.003
)E
duca
tion
inIs
rael
.078
.085
.070
.081
.063
(.001
)(.0
03)
(.002
)(.0
03)
(.002
)E
xper
ienc
eab
road
.000
92
.000
92
.005
2.0
022
.001
(.001
)(.0
02)
(.002
)(.0
01)
(.001
)E
xper
ienc
ein
Isra
el.0
12.0
12.0
10.0
08.0
10(.0
01)
(.002
)(.0
01)
(.002
)(.0
01)
Edu
cati
onab
road
3ed
ucat
ion
inIs
rael
.001
02
.001
8.0
008
.000
1.0
023
(.000
2)(.0
005)
(.000
3)(.0
006)
(.000
3)E
duca
tion
abro
ad3
expe
rien
cein
Isra
el2
.000
03.0
004
2.0
002
.000
62
.000
1(.0
001)
(.000
2)(.0
001)
(.000
2)(.0
001)
Exp
erie
nce
abro
ad3
expe
rien
cein
Isra
el.0
0003
.000
12
.000
04.0
002
.000
1(.0
0003
)(.0
002)
(.000
1)(.0
001)
(.000
1)C
onst
ant
9.38
9.43
9.61
9.56
9.51
(.017
)(.0
61)
(.039
)(.0
38)
(.028
)R
2.2
51.2
10.2
24.2
96.1
80N
35,6
153,
209
10,4
224,
587
17,3
97
NO
TE.—
Dep
ende
ntva
riab
leis
log
mon
thly
earn
ings
.Sta
ndar
der
rors
are
inpa
rent
hese
s.
This content downloaded from 94.226.81.210 on Thu, 21 Aug 2014 08:00:44 AMAll use subject to JSTOR Terms and Conditions
selection on the part of individuals who choose to get further schoolingafter immigration.
As argued earlier, accumulating labor market experience in Israel mayalso enable an immigrant to translate the human capital he brought withhim into terms valued in the Israeli labor market. For immigrants taken asa whole, the interaction between foreign education and domestic experi-ence is insignificant. This is because the effect exists only for certainarea-of-origin groups. The return to foreign schooling rises with experi-ence in Israel for Western and Soviet immigrants, but it is unaffected bydomestic experience or even reduced for others. Even for the formergroups, the effect is small, resulting only in a roughly 0.5 percentage pointrise for every 10 years of experience. Finally, the interaction betweenforeign and domestic labor market experience is largely insignificantlydifferent from zero, with marginally significant positive effects for Sovietand Asian/African immigrants.
C. Simulated Earnings Profiles
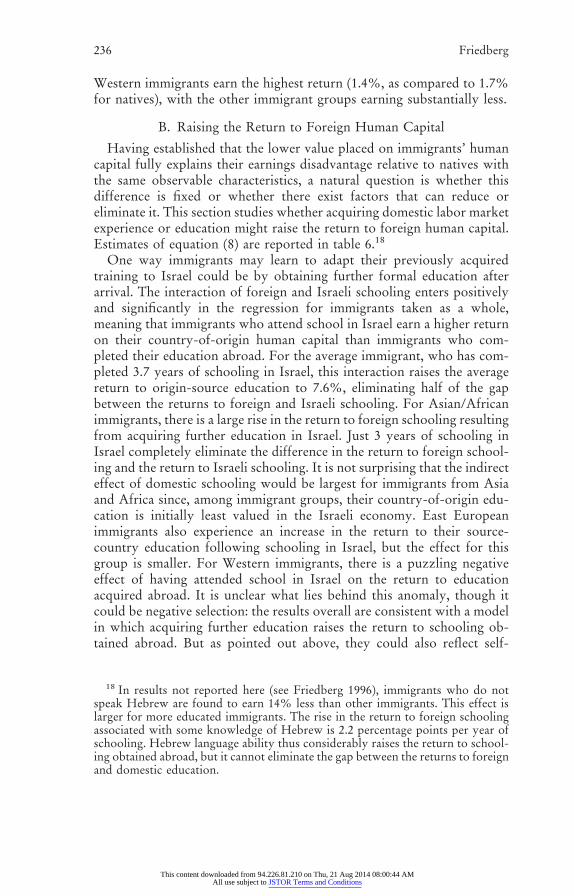
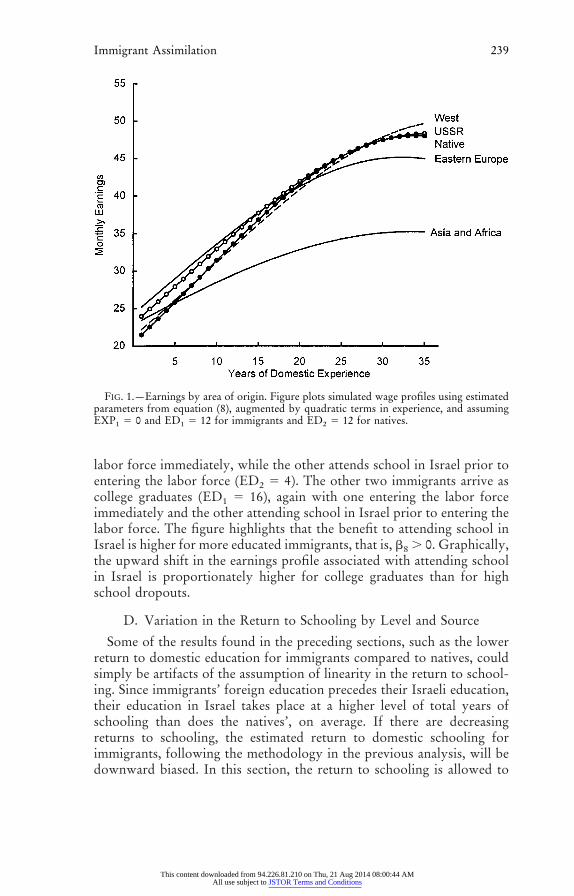
The empirical results thus far can usefully be summarized using sim-ulated earnings profiles. Figures 1–3 use parameter estimates from equa-tion (8), augmented by quadratic terms in experience, to trace out earn-ings profiles for hypothetical native and immigrant workers. Since thereturn to foreign work experience was found to be generally insignifi-cantly different from zero in table 6, the simulations focus on new labormarket entrants (i.e., immigrants with EXP1 5 0).
Figure 1 charts the earnings paths of five high school graduates. One isa native, and the others are new immigrants from the four major origingroups. The figure shows how monthly earnings rise with domestic labormarket experience, or, equivalently for the immigrants, with years sincemigration. Earnings are at similar levels and increase at roughly the samerate for natives and Ashkenazi immigrants (those from the West, EasternEurope, and the Soviet Union), with immigrants from Asia and Africalagging far behind. The earnings of immigrants from Asia and Africawould be even lower if their lower average years of schooling were takeninto account.
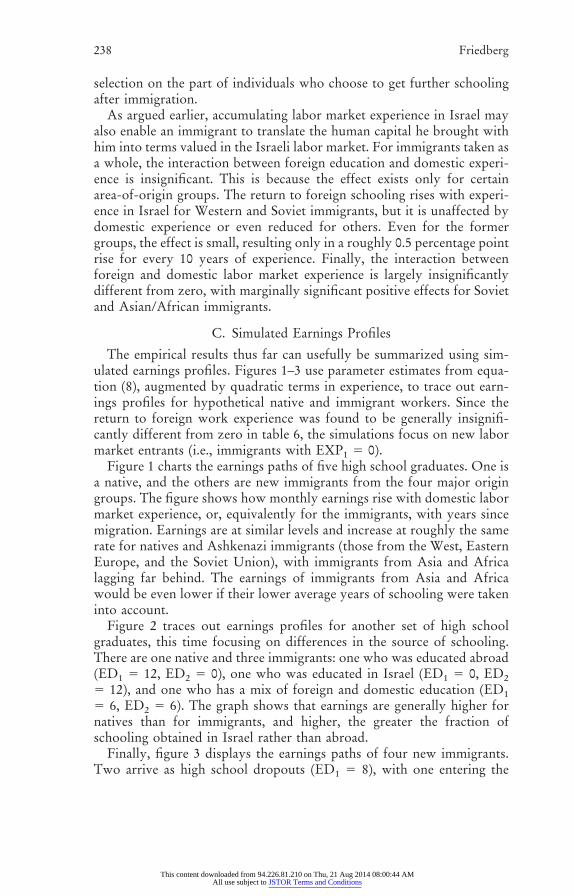
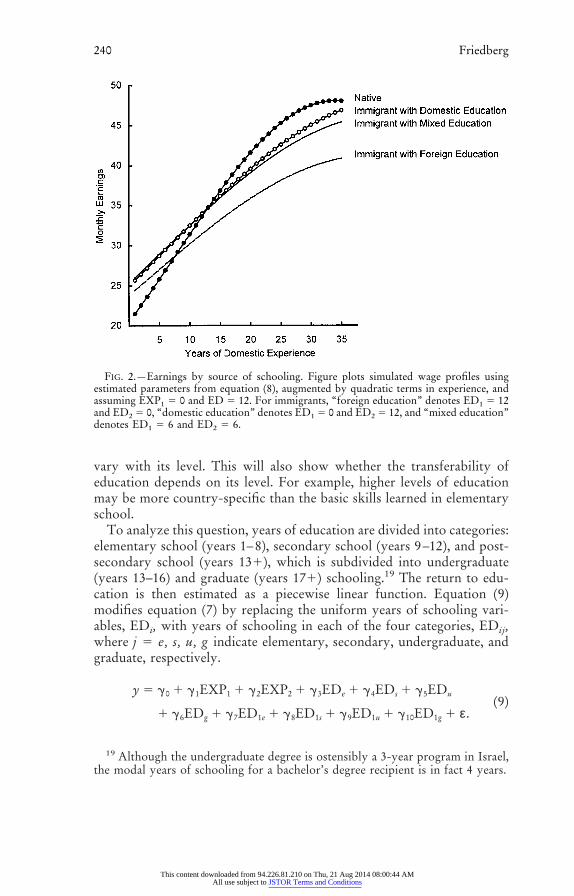
Figure 2 traces out earnings profiles for another set of high schoolgraduates, this time focusing on differences in the source of schooling.There are one native and three immigrants: one who was educated abroad(ED1 5 12, ED2 5 0), one who was educated in Israel (ED1 5 0, ED25 12), and one who has a mix of foreign and domestic education (ED15 6, ED2 5 6). The graph shows that earnings are generally higher fornatives than for immigrants, and higher, the greater the fraction ofschooling obtained in Israel rather than abroad.
Finally, figure 3 displays the earnings paths of four new immigrants.Two arrive as high school dropouts (ED1 5 8), with one entering the
238 Friedberg
This content downloaded from 94.226.81.210 on Thu, 21 Aug 2014 08:00:44 AMAll use subject to JSTOR Terms and Conditions
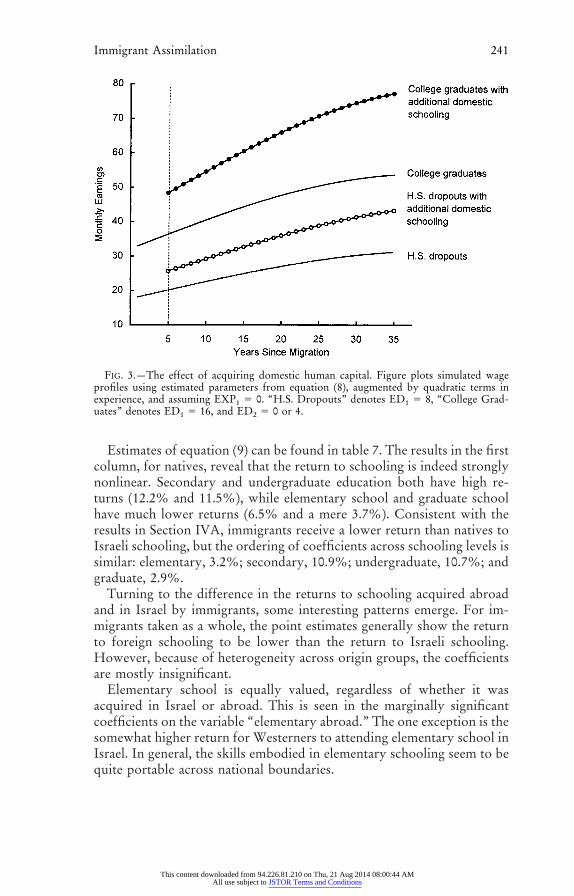
labor force immediately, while the other attends school in Israel prior toentering the labor force (ED2 5 4). The other two immigrants arrive ascollege graduates (ED1 5 16), again with one entering the labor forceimmediately and the other attending school in Israel prior to entering thelabor force. The figure highlights that the benefit to attending school inIsrael is higher for more educated immigrants, that is, b8 . 0. Graphically,the upward shift in the earnings profile associated with attending schoolin Israel is proportionately higher for college graduates than for highschool dropouts.
D. Variation in the Return to Schooling by Level and Source
Some of the results found in the preceding sections, such as the lowerreturn to domestic education for immigrants compared to natives, couldsimply be artifacts of the assumption of linearity in the return to school-ing. Since immigrants’ foreign education precedes their Israeli education,their education in Israel takes place at a higher level of total years ofschooling than does the natives’, on average. If there are decreasingreturns to schooling, the estimated return to domestic schooling forimmigrants, following the methodology in the previous analysis, will bedownward biased. In this section, the return to schooling is allowed to
FIG. 1.—Earnings by area of origin. Figure plots simulated wage profiles using estimatedparameters from equation (8), augmented by quadratic terms in experience, and assumingEXP1 5 0 and ED1 5 12 for immigrants and ED2 5 12 for natives.
Immigrant Assimilation 239
This content downloaded from 94.226.81.210 on Thu, 21 Aug 2014 08:00:44 AMAll use subject to JSTOR Terms and Conditions
vary with its level. This will also show whether the transferability ofeducation depends on its level. For example, higher levels of educationmay be more country-specific than the basic skills learned in elementaryschool.
To analyze this question, years of education are divided into categories:elementary school (years 1–8), secondary school (years 9–12), and post-secondary school (years 131), which is subdivided into undergraduate(years 13–16) and graduate (years 171) schooling.19 The return to edu-cation is then estimated as a piecewise linear function. Equation (9)modifies equation (7) by replacing the uniform years of schooling vari-ables, EDi, with years of schooling in each of the four categories, EDij,where j 5 e, s, u, g indicate elementary, secondary, undergraduate, andgraduate, respectively.
y 5 g0 1 g1EXP1 1 g2EXP2 1 g3EDe 1 g4EDs 1 g5EDu
1 g6EDg 1 g7ED1e 1 g8ED1s 1 g9ED1u 1 g10ED1g 1 ε.(9)
19 Although the undergraduate degree is ostensibly a 3-year program in Israel,the modal years of schooling for a bachelor’s degree recipient is in fact 4 years.
FIG. 2.—Earnings by source of schooling. Figure plots simulated wage profiles usingestimated parameters from equation (8), augmented by quadratic terms in experience, andassuming EXP1 5 0 and ED 5 12. For immigrants, “foreign education” denotes ED1 5 12and ED2 5 0, “domestic education” denotes ED1 5 0 and ED2 5 12, and “mixed education”denotes ED1 5 6 and ED2 5 6.
240 Friedberg
This content downloaded from 94.226.81.210 on Thu, 21 Aug 2014 08:00:44 AMAll use subject to JSTOR Terms and Conditions
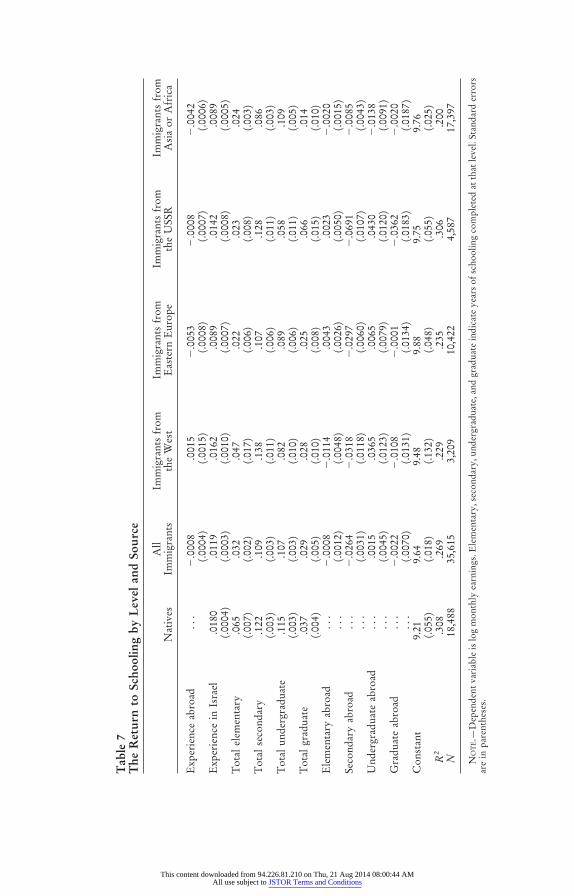
Estimates of equation (9) can be found in table 7. The results in the firstcolumn, for natives, reveal that the return to schooling is indeed stronglynonlinear. Secondary and undergraduate education both have high re-turns (12.2% and 11.5%), while elementary school and graduate schoolhave much lower returns (6.5% and a mere 3.7%). Consistent with theresults in Section IVA, immigrants receive a lower return than natives toIsraeli schooling, but the ordering of coefficients across schooling levels issimilar: elementary, 3.2%; secondary, 10.9%; undergraduate, 10.7%; andgraduate, 2.9%.
Turning to the difference in the returns to schooling acquired abroadand in Israel by immigrants, some interesting patterns emerge. For im-migrants taken as a whole, the point estimates generally show the returnto foreign schooling to be lower than the return to Israeli schooling.However, because of heterogeneity across origin groups, the coefficientsare mostly insignificant.
Elementary school is equally valued, regardless of whether it wasacquired in Israel or abroad. This is seen in the marginally significantcoefficients on the variable “elementary abroad.” The one exception is thesomewhat higher return for Westerners to attending elementary school inIsrael. In general, the skills embodied in elementary schooling seem to bequite portable across national boundaries.
FIG. 3.—The effect of acquiring domestic human capital. Figure plots simulated wageprofiles using estimated parameters from equation (8), augmented by quadratic terms inexperience, and assuming EXP1 5 0. “H.S. Dropouts” denotes ED1 5 8, “College Grad-uates” denotes ED1 5 16, and ED2 5 0 or 4.
Immigrant Assimilation 241
This content downloaded from 94.226.81.210 on Thu, 21 Aug 2014 08:00:44 AMAll use subject to JSTOR Terms and Conditions
Tab
le7
The
Ret
urn
toSc
hool
ing
byL
evel
and
Sour
ce
Nat
ives
All
Imm
igra
nts
Imm
igra
nts
from
the
Wes
tIm
mig
rant
sfr
omE
aste
rnE
urop
eIm
mig
rant
sfr
omth
eU
SSR
Imm
igra
nts
from
Asi
aor
Afr
ica
Exp
erie
nce
abro
ad..
.2
.000
8.0
015
2.0
053
2.0
008
2.0
042
(.000
4)(.0
015)
(.000
8)(.0
007)
(.000
6)E
xper
ienc
ein
Isra
el.0
180
.011
9.0
162
.008
9.0
142
.008
9(.0
004)
(.000
3)(.0
010)
(.000
7)(.0
008)
(.000
5)T
otal
elem
enta
ry.0
65.0
32.0
47.0
22.0
23.0
24(.0
07)
(.002
)(.0
17)
(.006
)(.0
08)
(.003
)T
otal
seco
ndar
y.1
22.1
09.1
38.1
07.1
28.0
86(.0
03)
(.003
)(.0
11)
(.006
)(.0
11)
(.003
)T
otal
unde
rgra
duat
e.1
15.1
07.0
82.0
89.0
58.1
09(.0
03)
(.003
)(.0
10)
(.006
)(.0
11)
(.005
)T
otal
grad
uate
.037
.029
.028
.025
.066
.014
(.004
)(.0
05)
(.010
)(.0
08)
(.015
)(.0
10)
Ele
men
tary
abro
ad..
.2
.000
82
.011
4.0
043
.002
32
.002
0..
.(.0
012)
(.004
8)(.0
026)
(.005
0)(.0
015)
Seco
ndar
yab
road
...
2.0
264
2.0
318
2.0
297
2.0
691
2.0
085
...
(.003
1)(.0
118)
(.006
0)(.0
107)
(.004
3)U
nder
grad
uate
abro
ad..
..0
015
.036
5.0
065
.043
02
.013
8..
.(.0
045)
(.012
3)(.0
079)
(.012
0)(.0
091)
Gra
duat
eab
road
...
2.0
022
2.0
108
2.0
001
2.0
362
2.0
020
...
(.007
0)(.0
131)
(.013
4)(.0
183)
(.018
7)C
onst
ant
9.21
9.64
9.48
9.88
9.75
9.76
(.055
)(.0
18)
(.132
)(.0
48)
(.055
)(.0
25)
R2
.308
.269
.229
.235
.306
.200
N18
,488
35,6
153,
209
10,4
224,
587
17,3
97
NO
TE.—
Dep
ende
ntva
riab
leis
log
mon
thly
earn
ings
.Ele
men
tary
,sec
onda
ry,u
nder
grad
uate
,and
grad
uate
indi
cate
year
sof
scho
olin
gco
mpl
eted
atth
atle
vel.
Stan
dard
erro
rsar
ein
pare
nthe
ses.
This content downloaded from 94.226.81.210 on Thu, 21 Aug 2014 08:00:44 AMAll use subject to JSTOR Terms and Conditions
The results at the secondary school level are quite different. The Israelilabor market places a large premium on acquiring high school training inIsrael rather than abroad. This is true for all areas of origin, with anaverage difference of 2.6 percentage points in the rates of return per year.
Finally, the differential associated with attending postsecondary schoolabroad rather than in Israel is smaller than that differential at the highschool level. This is somewhat surprising given that postsecondary edu-cation is generally considered to be more specialized than secondaryeducation, suggesting that it would be less internationally portable. For-eign graduate study receives a lower return than Israeli training, butWestern and Soviet undergraduate training actually receive higher re-turns.
A final issue concerns the possibility that the return to schoolingdepends on the particular configuration of schooling obtained. For ex-ample, a year of university study in Israel may yield a different returndepending on whether the high school education that preceded it wasacquired in Israel or abroad. A set of indicator variables is constructed fordifferent combinations of schooling levels and sources. For each individ-ual, it is determined whether he attended elementary school, secondaryschool, and postsecondary school, and if so, whether the given schoollevel was acquired abroad or in Israel.20 This yields six dummy variables:(1) attended elementary school abroad, (2) attended elementary school inIsrael, (3) attended secondary school abroad, (4) attended secondaryschool in Israel, (5) attended postsecondary school abroad, and (6) at-tended postsecondary school in Israel. The sample means for these at-tainment variables are presented in the second to bottom panel of table 3.These variables then enter into the calculation of the nine indicatorvariables used in the regressions below. The three letters in the variablename denote elementary school, high school, and postsecondary school,respectively. An “I” signifies that this schooling took place in Israel, an“F” signifies that it took place abroad, and “O” means that this level wasnot attained. The nine dummy variables are
III 5 elementary, secondary, and postsecondary all acquired in Israel;IIO 5 elementary and secondary in Israel, no postsecondary;IOO 5 elementary in Israel, no secondary or postsecondary;FFF 5 elementary, secondary, and postsecondary all obtained abroad;
20 For people who completed part of a schooling level in each country, threealternative methods of assigning that schooling to a country were used: accordingto where the majority of schooling at that level took place, as foreign if any of ittook place abroad, or as Israeli if any of it took place in Israel. The results usingthese different measures being quite similar, results are presented only for the firstmethod.
Immigrant Assimilation 243
This content downloaded from 94.226.81.210 on Thu, 21 Aug 2014 08:00:44 AMAll use subject to JSTOR Terms and Conditions

FFO 5 elementary and secondary abroad, no postsecondary;FOO 5 elementary abroad, no secondary or postsecondary;FFI 5 elementary and secondary abroad, postsecondary in Israel;FII 5 elementary abroad, secondary and postsecondary in Israel; andFIO 5 elementary abroad, secondary in Israel, no postsecondary.
Replacing the continuous years of schooling measures used in equation(9) with these nine schooling configuration dummies, we have
y 5 g0 1 g1EXP1 1 g2EXP2 1 g3III 1 g4IIO 1 g5IOO 1 g6FFF
1 g7FFO 1 g8FOO 1 g9FFI 1 g10FII 1 g11FIO 1 ε.(10)
Since the constant term and the returns to experience vary somewhatacross groups, direct comparisons cannot be made between the returns toa given configuration for two area-of-origin groups merely by comparingtheir corresponding coefficients. Direct comparisons can be made, how-ever, for the difference between two groups in the difference between twoschooling configurations (i.e., comparing the difference between III andFFF for Western immigrants vs. that difference for Soviets).
These differences in differences are presented in table 8. It is instructiveto focus on three comparisons: (1) the return to attending school in Israelfor natives versus immigrants when both groups acquired their previouseducation in Israel; (2) the return to attending school in Israel for nativesversus immigrants when the immigrants acquired their previous educa-tion abroad; and (3) the return to Israeli versus foreign schooling forimmigrants.
The return to attending school in Israel for natives versus immigrantswhen both groups obtained their previous education in Israel can be seenin first two lines of table 8. The college–high school differential (III–IIO)is slightly smaller for the four immigrant groups than it is for natives. Thehigh school–elementary school differential (IIO–IOO) varies consider-ably by group, with Western and Soviet immigrants gaining much morethan natives and Asian/African immigrants gaining much less. Amongimmigrants who received no schooling abroad (i.e., those who immi-grated too young), the return to college is only slightly lower than thereturn for natives, while for high school, some immigrant groups actuallyearn a higher return.
The second set of comparisons is of the return to attending school inIsrael for immigrants versus natives when the immigrants obtained theirprevious education abroad. One case is the difference in the return topostsecondary school in Israel for a high school educated native (III–IIO)and the return for an immigrant who attended high school abroad (FFI–
244 Friedberg
This content downloaded from 94.226.81.210 on Thu, 21 Aug 2014 08:00:44 AMAll use subject to JSTOR Terms and Conditions

FFO). The difference for natives is 0.5140, or 67.2%.21 As shown in thebottom line of the table, this increment is much lower for immigrants(0.4676 or 59.6%). The same comparison at the high school level (IIO–IOO vs. FIO–FOO) yields a similar result (44.7% and 39.5%). In bothcases, immigrants receive a much lower return than do natives. Contrast-ing this with the previous set of comparisons suggests that one of the mainreasons immigrants earn a lower return to Israeli schooling than donatives is that they are building on a base of foreign schooling, rather than
21 ln(III) 2 ln(IIO) 5 0.5140, so III/IIO 5 e0.5140 5 1.672.
Table 8Differences in the Returns to Different Configurations of Schooling
NativesAll
Immigrants
Immigrantsfrom the
West
Immigrantsfrom
EasternEurope
Immigrantsfrom the
USSR
Immigrantsfrom Asiaor Africa
III-IIO .5140 .4944 .4453 .4486 .3946 .4102(.0080) (.0120) (.0367) (.0229) (.0470) (.0176)
IIO-IOO .3696 .3446 .4482 .3459 .5243 .2753(.0117) (.0126) (.0701) (.0378) (.0728) (.0139)
FFF-FFO . . . .4305 .4661 .3487 .3746 .3692. . . (.0098) (.0318) (.0181) (.0184) (.0199)
FFO-FOO . . . .2725 .7423 .2293 .1880 .2414. . . (.0079) (.0480) (.0157) (.0231) (.0119)
III-FFF . . . .1286 .0514 .1597 .2002 .0943. . . (.0129) (.0324) (.0241) (.0373) (.0247)
III-FFI . . . .0916 .1207 .1318 .1864 2.0240. . . (.0193) (.0482) (.0332) (.0560) (.0325)
III-FII . . . .0501 .1351 .0685 .0424 2.0061. . . (.0166) (.0498) (.0264) (.0518) (.0271)
FFI-FFF . . . .0370 2.0692 .0279 .0138 .1183. . . (.0183) (.0462) (.0320) (.0475) (.0337)
FII-FFF . . . .0785 2.0836 .0912 .1579 .1004. . . (.0157) (.0480) (.2259) (.0427) (.0288)
IIO-FFO . . . .0647 .0723 .0598 .1802 .0533. . . (.0119) (.0397) (.0218) (.0374) (.0142)
IOO-FOO . . . 2.0074 2.0998 2.0568 2.1561 .0194. . . (.0130) (.0790) (.0014) (.0702) (.0147)
FIO-FFO . . . .0606 .1047 .0640 .0972 .0388. . . (.0118) (.0486) (.0221) (.0417) (.0159)
FIO-FOO . . . .3331 .3808 .2929 .3264 .2798. . . (.0123) (.0607) (.0242) (.0450) (.0156)
IIO-FIO . . . .0041 2.0324 2.0042 .0831 .0146. . . (.0120) (.0487) (.0243) (.0503) (.0147)
FFI-FFO . . . .4676 .3969 .3766 .3884 .4874. . . (.0182) (.0509) (.0312) (.0480) (.0303)
NOTE.—Measures are the difference in log monthly earnings for people with the specified configura-tions of schooling. The three-letter combinations (FIO, etc.) are dummy variables that are interpreted asfollows: the first letter indicates the location of elementary school, the second the location of secondaryschool, and the third the location of postsecondary school. F indicates foreign, I indicates Israel, and Oindicates none. OOO is the omitted category. Standard errors on the differences are in parentheses.
Immigrant Assimilation 245
This content downloaded from 94.226.81.210 on Thu, 21 Aug 2014 08:00:44 AMAll use subject to JSTOR Terms and Conditions
one of Israeli schooling. It is, however, not the only reason, as immigrantsearn a lower return to domestic schooling than do natives, even whenthey have no prior foreign schooling.
The third set of comparisons is of the return to Israeli versus origincountry schooling for immigrants. The difference in earnings for someonewho attended school through the postsecondary level in Israel versusabroad is (III–FFF). This difference is positive for all immigrant groups(approximately 12.9% on average). The difference for individuals whoterminated their education at the high school level (IIO–FFO) is alsopositive in all cases (6.5% on average). Examining immigrants with for-eign schooling who completed their education in Israel versus those whocompleted it abroad yields a similar pattern. For example, the value ofattending postsecondary school in Israel versus abroad (FFI–FFF) ispositive for almost all immigrant groups (3.7% on average). The excep-tion is Westerners, whose postsecondary schooling is more highly valued.Looking at this comparison at the high school level (FIO–FFO) alsoshows positive values for all groups, ranging from 3.9% for African andAsian immigrants to 10.5% for Westerners, whose origin-source educa-tion is always highly valued.
V. Conclusion
This article studies the labor market assimilation of immigrants, focus-ing on the source of the immigrants’ human capital. The national origin ofan individual’s education and labor market experience is found to be acrucial determinant of their value in the labor market. Human capital isimperfectly portable across countries. Estimation of standard earningsdetermination and immigrant assimilation equations yields patterns sim-ilar to those found in the literature on the United States, suggesting thatthe evidence from Israel may be used to shed light on this set of questionsmore generally.
Upon arrival, immigrants to Israel earn approximately one-quarter lessthan their native counterparts of comparable measured skill levels. Thisgap can be fully attributed to the significantly lower value placed on theimmigrants’ human capital. With few exceptions, human capital acquiredabroad receives a lower return in the host labor market than humancapital acquired domestically. The return to education obtained abroad ishigher for immigrants from Europe and the Western Hemisphere than forimmigrants from Asia and Africa. These patterns may reflect differencesin school quality across continents of origin, as well as the compatibilityof the education obtained abroad with the requirements of the host labormarket. They may also reflect a lesser degree of discrimination againstimmigrant workers from Asia or Africa at low levels of education than athigh levels. The return to labor market experience acquired abroad isgenerally insignificant.
246 Friedberg
This content downloaded from 94.226.81.210 on Thu, 21 Aug 2014 08:00:44 AMAll use subject to JSTOR Terms and Conditions
The direct return to a year of schooling or experience obtained in thehost country is also found to be higher for natives than for immigrants.One explanation for this result is that natives’ superior language profi-ciency and other country-specific knowledge enable them to learn andtrain more productively than immigrants. The portability of education isfound to vary significantly with its level. Elementary school education isequally valued, almost regardless of where it was acquired. The source ofa high school education, however, is an important determinant of itsvalue, with domestic high school earning the highest return. The return topostsecondary schooling obtained abroad varies greatly with area oforigin.
Finally, acquiring further human capital following immigration is as-sociated with a rise in the return to education obtained abroad. Educationobtained in the destination country appears to significantly raise thereturn to schooling acquired abroad for Asian and African immigrants,with weaker effects for European and American immigrants. For Westernand Soviet immigrants, the return to origin-country schooling also riseswith the accumulation of host-country work experience. Equivalently,the more highly educated immigrants in these groups experience moreearnings growth over time than do their less educated counterparts. Thefaster assimilation rate of the more educated immigrants somewhat offsetstheir larger initial earnings deficit relative to comparably educated natives.These findings are consistent with a model in which destination-countryhuman capital enables immigrants to translate the skills they accumulatedin their countries of origin into terms rewarded in the host labor market.This suggests a compound benefit to immigrants of receiving furthertraining following immigration.
Appendix A
Area of Origin GroupsI. West
Argentina, Australia, Austria, Belgium, Bolivia, Brazil, Canada, Chile,Colombia, Cuba, Denmark, Ecuador, Finland, France, Germany, Hol-land, Ireland, Italy, Luxembourg, Mexico, New Zealand, Norway, Pan-ama, Peru, Portugal, South Africa, Spain, Sweden, Switzerland, UnitedKingdom, United States, Uruguay, Venezuela, Zimbabwe (Rhodesia),unspecified Central America, unspecified South America, unspecifiedEurope, and unspecified Oceania.
II. Eastern EuropeAlbania, Bulgaria, Czechoslovakia, Greece, Hungary, Poland, Roma-
nia, and Yugoslavia.
Immigrant Assimilation 247
This content downloaded from 94.226.81.210 on Thu, 21 Aug 2014 08:00:44 AMAll use subject to JSTOR Terms and Conditions
III. Soviet UnionSoviet Union.
IV. Asia and AfricaAfghanistan, Algeria, Burma, China, Cyprus, Egypt, Ethiopia, Eritrea,
India, Indonesia, Iran, Iraq, Japan, Jordan, Korea, Lebanon, Libya, Mon-golia, Morocco, Pakistan, Philippines, Saudi Arabia, Somalia, SouthYemen, Sudan, Syria, Tangier, Tunisia, Turkey, Yemen, unspecified Af-rica, and unspecified Asia.
Appendix B
Assimilation versus Cohort QualityThe issue of potential “cohort quality” effects has received much
attention in the literature on immigration.22 In a single cross section ofdata, it is not possible to separately identify aging and cohort effects. Apositive estimated effect of years since migration (YSM) on earnings inequation (1) could therefore be due either to a rise in immigrants’ relativeearnings with time since arrival or to earlier immigrant arrival cohortshaving permanently higher earnings potential than more recent ones. Inorder to test the extent to which the cross-sectional return to YSM reflectsassimilation versus cohort effects, two cross sections of data are needed.Equation (1) can then be estimated on the pooled data, with arrival-cohort dummies added to the equation. If the return to YSM is invariantto the addition of the cohort dummies, then it is legitimate to interpretthat coefficient as a measure of assimilation in cross-sectional analysis.
Table B1 pools data from the 1972 and 1983 Israeli Censuses ofPopulation.23 The first column of the table presents estimates of equation(1), allowing the coefficients a0, a1, a2, and a3 to be different in the twoyears.24 Note that even with two cross sections of data, in order to test forthe presence of cohort effects, it is necessary to constrain the returns toimmigrant status, years since migration, and arrival cohort to be the samein both years.
In the second column of table B1, a set of arrival-cohort dummyvariables is added to the regression. There are 14 dummies, covering theyears 1917–83 in 5-year intervals. The coefficients on YSM and its squareare quite close in columns (1) and (2). If the same equations are run with
22 The issue was first raised by Borjas (1985), who concludes that most of thereturn to years since arrival in the United States is due to a systematic decline inthe quality of successive immigrant cohorts, rather than to assimilation. SeeFriedberg (1992) and LaLonde and Topel (1992), among others, for reexamina-tions of this finding.
23 The rules used in constructing the 1972 sample are the same as those used forthe 1983 sample.
24 An F-test of the equality of these coefficients across the two years rejects atthe 1% level that they are the same.
248 Friedberg
This content downloaded from 94.226.81.210 on Thu, 21 Aug 2014 08:00:44 AMAll use subject to JSTOR Terms and Conditions
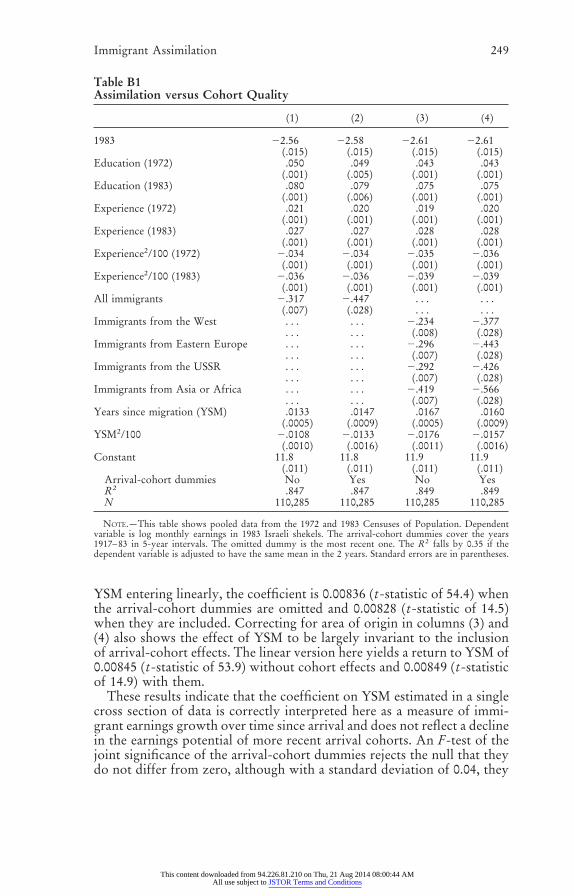
YSM entering linearly, the coefficient is 0.00836 (t-statistic of 54.4) whenthe arrival-cohort dummies are omitted and 0.00828 (t-statistic of 14.5)when they are included. Correcting for area of origin in columns (3) and(4) also shows the effect of YSM to be largely invariant to the inclusionof arrival-cohort effects. The linear version here yields a return to YSM of0.00845 (t-statistic of 53.9) without cohort effects and 0.00849 (t-statisticof 14.9) with them.
These results indicate that the coefficient on YSM estimated in a singlecross section of data is correctly interpreted here as a measure of immi-grant earnings growth over time since arrival and does not reflect a declinein the earnings potential of more recent arrival cohorts. An F-test of thejoint significance of the arrival-cohort dummies rejects the null that theydo not differ from zero, although with a standard deviation of 0.04, they
Table B1Assimilation versus Cohort Quality
(1) (2) (3) (4)
1983 22.56 22.58 22.61 22.61(.015) (.015) (.015) (.015)
Education (1972) .050 .049 .043 .043(.001) (.005) (.001) (.001)
Education (1983) .080 .079 .075 .075(.001) (.006) (.001) (.001)
Experience (1972) .021 .020 .019 .020(.001) (.001) (.001) (.001)
Experience (1983) .027 .027 .028 .028(.001) (.001) (.001) (.001)
Experience2/100 (1972) 2.034 2.034 2.035 2.036(.001) (.001) (.001) (.001)
Experience2/100 (1983) 2.036 2.036 2.039 2.039(.001) (.001) (.001) (.001)
All immigrants 2.317 2.447 . . . . . .(.007) (.028) . . . . . .
Immigrants from the West . . . . . . 2.234 2.377. . . . . . (.008) (.028)
Immigrants from Eastern Europe . . . . . . 2.296 2.443. . . . . . (.007) (.028)
Immigrants from the USSR . . . . . . 2.292 2.426. . . . . . (.007) (.028)
Immigrants from Asia or Africa . . . . . . 2.419 2.566. . . . . . (.007) (.028)
Years since migration (YSM) .0133 .0147 .0167 .0160(.0005) (.0009) (.0005) (.0009)
YSM2/100 2.0108 2.0133 2.0176 2.0157(.0010) (.0016) (.0011) (.0016)
Constant 11.8 11.8 11.9 11.9(.011) (.011) (.011) (.011)
Arrival-cohort dummies No Yes No YesR2 .847 .847 .849 .849N 110,285 110,285 110,285 110,285
NOTE.—This table shows pooled data from the 1972 and 1983 Censuses of Population. Dependentvariable is log monthly earnings in 1983 Israeli shekels. The arrival-cohort dummies cover the years1917–83 in 5-year intervals. The omitted dummy is the most recent one. The R2 falls by 0.35 if thedependent variable is adjusted to have the same mean in the 2 years. Standard errors are in parentheses.
Immigrant Assimilation 249
This content downloaded from 94.226.81.210 on Thu, 21 Aug 2014 08:00:44 AMAll use subject to JSTOR Terms and Conditions
are rather small in size. In any case, the magnitude of the cohort effects isunimportant for the purpose of obtaining unbiased estimates of assimi-lation rates. All that matters is that they do not follow a systematicpattern over time. As these cohort effects do not, their omission does notbias the return to YSM. This is not surprising since, in contrast to theUnited States, there was no change in Israeli immigration policy analo-gous to the 1965 amendments to the U.S. Immigration and NationalityAct that would lead us to expect a systematic change in unobservedcohort quality over time. The analysis can therefore proceed, using thedata from the 1983 Census alone to estimate the parameters of interest.
ReferencesBaker, Michael, and Benjamin, Dwayne. “The Performance of Immi-
grants in the Canadian Labor Market.” Journal of Labor Economics 12( July 1994): 369–405.
Borjas, George. “The Earnings of Male Hispanic Immigrants in the UnitedStates.” Industrial and Labor Relations Review 35 (April 1982): 343–53.
. “Assimilation, Changes in Cohort Quality, and the Earnings ofImmigrants.” Journal of Labor Economics 3 (October 1985): 463–89.
. “National Origin and the Skills of Immigrants in the PostwarPeriod.” In Immigration and the Workforce, edited by George Borjasand Richard Freeman, pp. 17–47. Chicago: University of ChicagoPress, 1992.
. “Assimilation and Changes in Cohort Quality Revisited: WhatHappened to Immigrant Earnings in the 1980s?” Journal of LaborEconomics 13 (April 1995): 201–45.
. “The Economic Analysis of Immigration.” In Handbook ofLabor Economics, vol. 3, edited by Orley Ashenfelter and David Card.Amsterdam: Elsevier Science Publishing, 1999.
Butcher, Kristin, and DiNardo, John. “The Immigrant and Native-BornWage Distributions: Evidence from United States Censuses.” Unpub-lished manuscript. Boston: Boston College, 1996.
Chiswick, Barry. “The Effect of Americanization on the Earnings of Foreign-Born Men.” Journal of Political Economy 86 (October 1978): 897–922. (a)
. “A Longitudinal Analysis of the Occupational Mobility of Im-migrants.” In Proceedings of the Thirtieth Annual Winter Meeting,edited by Barbara Dennis, pp. 20–27. Madison, WI: Industrial Rela-tions Research Association, 1978. (b)
. “Is the New Immigration Less Skilled than the Old?” Journal ofLabor Economics 4 (April 1986): 168–92.
Duleep, Harriet Orcutt, and Regets, Mark. “The Elusive Concept ofImmigrant Quality: Evidence from 1970–1990.” Discussion Paper no.PRIP-UI-41. Washington, DC: Urban Institute, 1996.
Eckstein, Zvi, and Weiss, Yoram. “The Absorption of Highly SkilledImmigrants: Israel, 1990–95.” Unpublished manuscript. Tel Aviv: TelAviv University, 1998.
Fishelson, Gideon; Weiss, Yoram; and Mark, Nili. “Ethnic Origin and
250 Friedberg
This content downloaded from 94.226.81.210 on Thu, 21 Aug 2014 08:00:44 AMAll use subject to JSTOR Terms and Conditions
Income Differentials among Israeli Males, 1969–1976.” In Israel: ADeveloping Society, edited by Asher Arian, pp. 253–76. Assen: VanGorcum, 1980.
Flug, Karnit; Kasir, Nitsa (Kaliner); and Ofer, Gur. “The Absorption ofSoviet Immigrants into the Labor Market from 1990 Onwards: Aspectsof Occupational Substitution and Retention.” Discussion Paper no.92.13. Jerusalem: Bank of Israel, 1992.
Friedberg, Rachel. “The Labor Market Assimilation of Immigrants in theUnited States: The Role of Age at Arrival.” Unpublished manuscript.Providence, RI: Brown University, 1992.
. “The Success of Young Immigrants in the U.S. Labor Market: AnEvaluation of Competing Explanations.” Unpublished manuscript.Providence, RI: Brown University, 1993.
. “You Can’t Take It with You? Immigrant Assimilation and thePortability of Human Capital.” Working Paper no. 5837. Cambridge,MA: National Bureau of Economic Research, 1996.
Funkhouser, Edward, and Trejo, Stephen. “The Labor Market Skills ofRecent Male Immigrants: Evidence from the Current Population Sur-vey.” Industrial and Labor Relations Review 48 (July 1995): 792–811.
Israel Central Bureau of Statistics. Census of Population and Housing1972. Jerusalem: Central Bureau of Statistics, 1974.
. Census of Population and Housing, 1983. Jerusalem: CentralBureau of Statistics, 1985.
Jasso, Guillermina, and Rosenzweig, Mark. “How Well Do U.S. Immi-grants Do? Vintage Effects, Emigration Selectivity, and OccupationalMobility.” In Research in Population Economics, vol. 6, edited byT. Paul Schultz, pp. 229–53. Greenwich, CT: JAI Press, 1988.
. The New Chosen People. Census Monograph Series. New York:Russell Sage Foundation, 1990.
LaLonde, Robert, and Topel, Robert. “The Assimilation of Immigrants inthe U.S. Labor Market.” In Immigration and the Workforce, edited byGeorge Borjas and Richard Freeman, pp. 67–92. Chicago: University ofChicago Press, 1992.
. “Economic Impact of International Migration and the EconomicPerformance of Immigrants.” In Handbook of Population and FamilyEconomics, edited by Mark Rosenzweig and Oded Stark. Amsterdam:Elsevier Science Publishing, 1996.
Sabatello, Eitan. “Patterns of Occupational Mobility among New Immi-grants to Israel.” International Migration 17 (1979): 267–79.
Schoeni, Robert. “New Evidence on the Economic Progress of Foreign-Born Men in the 1970s and 1980s.” Journal of Human Resources 32(Fall 1997): 683–740.
Smith, James, and Edmonston, Barry. The New Americans: Economic,Demographic, and Fiscal Effects of Immigration: Report of the NationalResearch Council. Washington, DC: National Academy Press, 1997.
Immigrant Assimilation 251
This content downloaded from 94.226.81.210 on Thu, 21 Aug 2014 08:00:44 AMAll use subject to JSTOR Terms and Conditions