Embed Size (px)
Citation preview

Advances and Applications of Single Cell Sequencing Technologies
Yong Wang1 and Nicholas E. Navin1,2,*
1Department of Genetics, University of Texas, MD Anderson Cancer Center
2Department of Bioinformatics and Computational Biology, University of Texas, MD Anderson Cancer Center
Abstract
Single cell sequencing (SCS) has emerged as a powerful new set of technologies for studying rare
cells and delineating complex populations. Over the past 5 years, SCS methods for DNA and RNA
have had a broad impact on many diverse fields of biology, including microbiology, neurobiology,
development, tissue mosaicism, immunology and cancer research. In this review, we will discuss
SCS technologies and applications, as well as translational applications in the clinic.
Introduction
The fundamental unit of an organism is a single cell. Homo sapiens are composed of
approximately 3.72 × 10¹³ single cells that live harmoniously in tissues among their
neighbors (Bianconi et al., 2013). However in diseases such as cancer, the greed and avarice
of a single cell can lead to the downfall of the entire organism. Despite the complexity of
tissues, most genomic studies to date have focused on analyzing bulk tissue samples, which
are composed of millions of cells. In these averaged datasets, it is difficult to resolve cell-to-
cell variations and identify rare cells that may play an important role in disease progression.
The recent development of single-cell sequencing (SCS) methods has led to a paradigm shift
in the field of genomics, away from bulk tissue analysis, and towards detailed and
comprehensive studies of individual cells.
Our fascination with single cells dates back to the invention of the first microscopes in the
1660’s, which allowed early microscopists to observed single prokaryotic cells moving
around in droplets of water. Subsequent work by early pathologists, such as Rudolf
Virchow, in the late 1850’s established the link between abnormalities in single cells and
human diseases. In the late 1900’s the development of cell staining techniques and
cytological methods galvanized the field, enabling scientists to directly visualize genetic
differences on chromosomes in single cells. However, many cytogenetic and
© 2015 Published by Elsevier Inc.*Corresponding Author: Nicholas E. Navin, Ph.D. [email protected].
Publisher's Disclaimer: This is a PDF file of an unedited manuscript that has been accepted for publication. As a service to our customers we are providing this early version of the manuscript. The manuscript will undergo copyediting, typesetting, and review of the resulting proof before it is published in its final citable form. Please note that during the production process errors may be discovered which could affect the content, and all legal disclaimers that apply to the journal pertain.
HHS Public AccessAuthor manuscriptMol Cell. Author manuscript; available in PMC 2016 May 21.
Published in final edited form as:Mol Cell. 2015 May 21; 58(4): 598–609. doi:10.1016/j.molcel.2015.05.005.
Author M
anuscriptA
uthor Manuscript
Author M
anuscriptA
uthor Manuscript

immunostaining methods were limited to measuring targeted genes and proteins. In the
1990’s quantitative microarray technologies were developed for measuring genome-wide
DNA and RNA information, but required too much input material for single cell analysis.
Although PCR methods had been developed, they were only capable of amplifying small
targeted regions of the genome. To overcome this limitation whole-transcriptome-
amplification (WTA) (Van Gelder et al., 1990) and whole-genome-amplification (WGA)
(Dean et al., 2002; Telenius et al., 1992) methods were developed to amplify genome-wide
DNA and RNA. Another important milestone occurred in 2005 with the development of the
first next-generation sequencing (NGS) technologies, which enabled genome-wide
sequencing of DNA and RNA (Mardis, 2011).
The culmination of these technologies led to the invention of the first genomewide single-
cell DNA (Navin et al., 2011) and RNA (Tang et al., 2009) sequencing methods for
mammalian cells. These initial studies (and work by other groups) led to the establishment
of a new field of biology: single cell sequencing (SCS). The field has shown tremendous
growth over the last 5 years (Figure 1A) and impacted many diverse areas of biological
research (Figure 1B–C, Supplementary Table 1). In this review, we will discuss the
advances and limitations of SCS technologies, and the myriad of applications that they have
had in biological research and medicine.
Single Cell Isolation Methods
In order to sequence a single cell, it must first be captured. While the methods for isolating
single cells from abundant populations have been well-established, the isolation of rare
single cells (<1%) remains a formidable technical challenge. To isolate a single cell
randomly from an abundant population, several approaches can be employed: mouth
pipetting, serial dilution, robotic micromanipulation, flow-assisted cell sorting (FACS) and
microfluidic platforms (Table 1). Many of these approaches require cells or nuclei in
suspension, and therefore cannot preserve their spatial context in tissues. This limitation can
be overcome using Laser-capture-microdissection (LCM), which can also be used to isolate
rare cells. In contrast, the isolation of rare single cells (< 1%) is far more challenging. Many
commercial platforms have been developed for isolating circulating tumor cells (CTCs),
which occur at very low frequencies (1 in 1 million) in the blood of cancer patients
(Cristofanilli et al., 2004). The CellSearch system is an FDA approved clinical system that
uses magnets with ferrofluid nanoparticles conjugated to antibodies for EpCAM and CD45
to isolate CTCs (Yu et al., 2011). Nagrath et al. developed another method that uses a
nanopost microchip technology with EpCAM antibodies (Nagrath et al., 2007). The
Magsweeper (Illumina Inc.) is a technology that involves dipping a rotating magnet with
EpCAM antibodies to isolate CTCs (Powell et al., 2012). Other methods are more generally
applicable to rare cell populations. The DEP-Array system (Silicon Biosciences) uses a
microchip with dielectropheretic cages to navigate individual cells by charge (Altomare et
al., 2003). The CellCelector (Automated Lab Solutions) uses robotic micromanipulation
capillary system to identify single cells for isolation (Choi et al., 2010). An alternative
approach uses nanofilters to isolate rare cells by size exclusion rather than surface markers
(Adams et al., 2014). The advantages and limitations of these methods are summarized in
Wang and Navin Page 2
Mol Cell. Author manuscript; available in PMC 2016 May 21.
Author M
anuscriptA
uthor Manuscript
Author M
anuscriptA
uthor Manuscript

Table 1 and have been reviewed in detail in other review articles (Navin and Hicks, 2011;
Navin, 2014; Shapiro et al., 2013).
Single Cell DNA Sequencing Methods
The development of DNA SCS methods has proven to be more challenging than RNA. This
is due to the fact that a single cell contains only 2 copies of each DNA molecule, but
thousands of copies of most RNA molecules. The limited amount of input material for WGA
results in a number of technical errors, including: coverage non-uniformity, allelic dropout
(ADO) events, false-positive (FP) errors and false-negative (FN) errors (Table 2). The most
salient technical errors occur during the initial rounds of amplification and are subsequently
propagated by all daughter molecules. FP errors accumulate at random sites due to the
infidelity of the WGA polymerase and lead to single nucleotide errors (Dean et al., 2002;
Lasken, 2007). However, by far the greatest source of WGA error comes from allelic
dropout events at 10–50% of the mutation sites (Fiegler et al., 2007; Hou et al., 2012;
Lasken, 2007; Talseth-Palmer et al., 2008; Zong et al., 2012).
Importantly, WGA is not a single technique, but encompasses a wide variety of
experimental methods. The most common WGA methods are degenerative-oligonucleotide-
PCR (DOP-PCR) and multiple-displacement-amplification (MDA) (Figure 2A–B). DOP-
PCR generates low physical coverage (~10%) of a single cell genome, but accurately retains
copy number levels during WGA. In the first SCS method developed for genomic DNA,
DOP-PCR was combined with flow-sorting of nuclei and NGS to generate high-resolution
copy number profiles from single mammalian cells (Baslan et al., 2012; Navin et al., 2011).
However, the low physical coverage of DOP-PCR makes it a poor approach for measuring
mutations at base-pair resolution. MDA using either the Phi29 or Bst polymerases has been
widely reported to achieve high physical coverage (>90%) from a single cell genome or
exome (Hou et al., 2012; Xu et al., 2012; Yong Wang, 2014; Zong et al., 2012) (Figure 2B).
However, MDA generates non-uniform coverage and causes distortions in read depth
making it a poor method to measure DNA copy number (Navin, 2014). Phi29 is the ideal
polymerase for MDA reactions, since it has a very low FP error rate (1e-7) compared to Bst
(1e-5), which does not have proofreading activity (Dean et al., 2002; Lasken, 2013).
Another DNA SCS method is multipleannealing- and-looping-based-amplification-cycles
(MALBAC), which uses the Bst polymerase to form circular DNA fragments followed by
adapter ligation PCR (Zong et al., 2012). This method can obtain both copy number
information and single nucleotide variants (SNVs), but generates extremely high FP error
rates, making it more suitable for copy number profiling. Another method, called NUC-SEQ
or single nucleus exome sequencing (SNES) takes advantage of G2/M nuclei which have
duplicated the amount of genomic DNA in a single cell (12 picograms) prior to MDA,
which reduces many technical error rates during single cell sequencing of exomes and
genomes (Yong Wang, 2014)(Leung et al. 2015).
After WGA the amplified DNA is used to construct libraries for NGS. While several
sequencing platforms are available, Illumina has emerged as the primary tools in most
studies due to low cost per base, high-throughput and low error rates. To further save costs
and increase throughput, single cell libraries are often barcoded and pooled together for
Wang and Navin Page 3
Mol Cell. Author manuscript; available in PMC 2016 May 21.
Author M
anuscriptA
uthor Manuscript
Author M
anuscriptA
uthor Manuscript

multiplexed sequencing. In many studies, the barcoded libraries are used for targeted capture
(exome or gene panels) to sequence only regions of interest and obtain higher coverage
depth in these areas. For a more comprehensive review of single cell DNA sequencing
methods please refer to the following articles (Blainey and Quake, 2014; de Bourcy et al.,
2014; Navin and Hicks, 2011; Navin, 2014; Van Loo and Voet, 2014).
Single Cell RNA Sequencing Methods
The development of single cell RNA sequencing methods has shown considerable progress
over the past 5 years. To sequence a single cell transcriptome, the RNA must first be
amplified by whole-transcriptome-amplification (WTA). This step is necessary because a
typical mammalian cell contains only 10 picograms of total RNA and 0.1 picograms of
mRNA. Initial WTA methods utilized the T7 RNA polymerase to perform linear
amplification of cDNA by in vitro transcription (IVT) (Van Gelder et al., 1990). These
methods were further developed using oligo d(T) primers conjugated to adapter sequences
for reverse transcription and selective amplification of polyadenylated mRNA by PCR
(Tang et al., 2009) (Figure 2C). However, these WTA methods were plagued by strong 3’
mRNA bias. To mitigate this bias, a WTA method called SMART-Seq was developed that
amplifies only full-length mRNA transcripts using an Moloney Murine Leukemia Virus
(MMLV) reverse transcriptase (Ramskold et al., 2012). MMLV has both template-switching
and terminal transferase activity, which results in the addition of nontemplated cytosine
residues to the 5’ end of the cDNA. By adding a poly-G template with an adapter sequence,
MMLV can switch templates and transcribe the other strand, leading to full-length cDNA
transcripts that are amplified by PCR (Figure 2D). Another technical artifact of single-cell
RNA sequencing is amplification bias, in which mRNAs levels are distorted during WTA.
To reduce these errors, a recent method developed unique molecular indexes (UMIs) to label
the original pool of RNA molecules prior to WTA (Islam et al., 2014). After WTA, the
resulting cDNA libraries are barcoded and pooled for multiplexed NGS. For a more detailed
discussion of RNA SCS methods please refer to the following review articles (Macaulay and
Voet, 2014; Saliba et al., 2014; Sandberg, 2014).
Single Cell Epigenomic Sequencing Methods
Epigenomic profiling of single cells remains to be one of the greatest technical challenges in
the field. The problem is that standard epigenomic sequencing methods require a pool of
DNA that is split into two separate fractions for treatment with bisulfide or methylation
restriction enzymes prior to sequencing. The other technical barrier is that epigenetic DNA
modifications cannot be amplified with DNA polymerases. Despite these technical hurdles,
two recent studies have made initial progress. The Hi-C approach was recently adapted for
single cell profiling at megabase resolution to identify physical chromatin interactions in
single cells (Nagano et al., 2013). In another study, reduced single cell representation
bisulfite sequencing (scRRBS) was developed to measure cytosine methylation
modifications at 1.5 million CpG sites in a single cell, which is equivalent to about 10% of
the genome (Guo et al., 2013). While these studies are clearly pioneering, they were also
challenged by limited coverage (2.5% and 10%), low resolution and many technical errors.
Wang and Navin Page 4
Mol Cell. Author manuscript; available in PMC 2016 May 21.
Author M
anuscriptA
uthor Manuscript
Author M
anuscriptA
uthor Manuscript
However, future refinement of these technologies are likely to lead to accurate whole-
genome epigenomic profiling of single cells.
Distinguishing Technical Errors from Biological Variations
At the current state of technology, most SCS methods introduce extensive technical errors
and variability into datasets. Unfortunately, naïve users often interpret these technical errors
as extensive biological heterogeneity. To eliminate these errors and confirm that a mutation
or transcript is truly heterogeneous in a population of cells, orthogonal validation using a
targeted approach is critical. To validate heterogeneous DNA variants or mutations, targeted
validation can be performed using deep-sequencing with molecular barcodes (Kennedy et
al., 2014; Schmitt et al., 2012; Wang et al., 2014) or digital droplet PCR (Bio-Rad,
Raindance Inc.). To validate heterogeneous RNA expression changes, targeted validation
can be performed with single cell RT-qPCR or with digital droplet PCR. Unfortunately,
many published studies to date have incorrectly reported extensive biological heterogeneity
without orthogonal validation, which is more likely to be explained by technical errors.
In summary, there has been tremendous progress in the development of single cell DNA and
RNA sequencing methods. However, all SCS methods generate technical errors during
WGA and WTA and thus orthogonal validation using a targeted approach is critical at the
current state of technology. We now turn to a detailed discussion of the many broad fields of
biology that have been impacted by SCS methods over the last 5 years (Figure 3).
Microbiology
A formidable challenge in microbiology has been that over 99% of microbial species on
planet earth cannot be cultured and expanded in the lab (Ishoey et al., 2008; Lasken and
McLean, 2014). Single-cell DNA and RNA sequencing methods provide a powerful new
approach to resolve microbial genomes and delineate cell-to-cell diversity within diverse
populations. However, bacteria and other microorganisms often have only femtograms of
DNA and RNA, making it even more challenging to amplify than mammalian cells (Lasken,
2007). In an early study, MDA was used to amplify DNA from the marine cyanobacterium
Prochlorococcus for pyrosequencing and de novo assembly (Rodrigue et al., 2009). In
another study Woyke et al. used FACS and MDA to perform NGS and assemble two marine
flavobacteria genomes to 90% coverage (Woyke et al., 2009). Blainey et al. also used MDA
to sequence and assemble the genomes of 5 single cells from an Ammonia-oxidizing archaea
(Blainey et al., 2011). Another study performed SCS of five segmented filamentous bacterial
cells to gain insight into their life cycles (Pamp et al., 2012). While initial studies were often
limited to sequencing just a few microbial cells, a subsequent large-scale study was
conducted on 201 uncultivated archaeal and bacterial cells from nine diverse habitats. In this
study SCS revealed 29 uncharted branches of the tree of life, revealing ‘microbial dark
matter’ and challenging the canonical three domains of life (Rinke et al., 2013). These
studies show that SCS is complimentary to metagenomic deep-sequencing methods, and can
open up new avenues of investigation into microbial genomes that cannot be cultured in the
lab.
Wang and Navin Page 5
Mol Cell. Author manuscript; available in PMC 2016 May 21.
Author M
anuscriptA
uthor Manuscript
Author M
anuscriptA
uthor Manuscript
Neurobiology
Neurons represent one of the most morphologically diverse populations of cells. Traditional
classification has relied mainly on morphological features (De Carlos and Borrell, 2007),
however single-cell RNA sequencing provides a powerful unbiased approach to classify
neurons based on their transcriptional profiles. In a study by Qiu et al. single neuron RNA-
sequencing was combined with electrophysiology to obtain transcriptional profiles from
embryonic mouse hippocampus and neocortical neurons (Qiu et al., 2012). In another study,
single cell RNA-seq was performed in situ in spatially defined neuronal regions, which
identified cell-to-cell transcriptional variation in hippocampal neurons (Lovatt et al., 2014).
Pollen et al. used low-coverage single cell RNA sequencing and microfluidics to analyze
single cells from 11 brain populations, and identified Notch signaling as an important
regulator of brain development (Pollen et al., 2014). In another study, Usoskin et al. used
single-cell RNA sequencing to profile 622 sensory neurons in mice, which revealed 11
novel expression classes of sensory neuron cell types (Usoskin et al., 2014).
Several studies have also begun to investigate DNA heterogeneity in neurons. SCS was
recently used to study LINE-1 retrotransposition in the cerebral cortex (Evrony et al., 2012)
and found that each cortex neuron had an average of 0.6 somatic insertions events. In
another study, SNS (Baslan et al., 2012; Navin et al., 2011) was used to identify copy
number variants (CNVs) in neurons from three normal and two pathological brain samples
(Cai et al., 2014). The authors reported that large (>1mb) clonal CNVs arose in about 5% of
neurons during normal development. In contrast, another study used SNS to profile neuronal
copy number diversity in the prefrontal cortex of postmortem brains, which identified many
de novo CNVs in neurons that were not clonal between different single cells (McConnell et
al., 2013). In another study, SCS using microwells identified copy number changes in a
normal postmortem brain and a patient with Down syndrome (Gole et al., 2013). These
initial studies show that SCS provides a novel approach to classify neuronal cell types and
identify an unexpected amount of DNA diversity in neuronal populations.
Tissue Mosaicism
The traditional view of somatic tissues is that single normal cells have identical genomes,
however this dogma is beginning to be challenged by increasing evidence of genetic
mosaicism in normal tissues that arises during normal development (Biesecker and Spinner,
2013). To date most studies have analyzed bulk tissue samples, and therefore much
controversy exists over the prevalence of mosaic mutations and whether they can simply be
explained by technical error. SCS methods provide a novel approach to resolve cell-to-cell
variations in normal tissues at an unprecedented genomic resolution. SNS was recently used
to identify de novo CNVs in 13–41% of the neurons in the frontal cortex of postmortem
brains, suggesting that CNV mosaic events are common in cortical neurons (McConnell et
al., 2013). This unexpected amount of copy number diversity has previously not been
appreciated in the brain. However, a recent study using the same SCS methods (SNS)
challenged these data, by suggesting that somatic CNVs are extremely rare in neurons and
other normal tissues (Knouse et al., 2014). In this study 96 single neurons were sequenced
from mice and only a single somatic CNV was identified in one neuron. The authors also
Wang and Navin Page 6
Mol Cell. Author manuscript; available in PMC 2016 May 21.
Author M
anuscriptA
uthor Manuscript
Author M
anuscriptA
uthor Manuscript

examined 89 single cells from 4 human patients frontal lobes, and found only 2 cells with
aneuploid rearrangements (2.2%). In skin, the authors detected aneuploidy in only 2.7% of
mouse keratinocytes and none in human cells. In liver cells they profiled 100 hepatocytes
and found only 4% aneuploid cells. Thus, while both studies showed that copy number
mosaicism is likely to exist in normal tissues, there is much debate regarding the prevalence
of these rearrangements, and whether they might play an important role in human diseases.
Germline Transmission
Sperm cells and oocytes are single cells that fuse to form a zygote and transmit genomic
material and evolution has engineered this process to generate genetic variation. Single-cell
DNA sequencing provides a novel approach to study the mechanisms that generate germline
variation. In one of the first studies on this topic, single sperm cells were sequenced, which
revealed an average of 22.8 recombination events, 5–15 gene conversion events and 25–36
de novo mutations in each sperm cell (Wang et al., 2012). The authors also calculated copy
number profiles, which showed that 7% of the single sperm cells had aneuploid genomes.
Consistent with this study, another group used low-coverage whole-genome sequencing to
delineate haplotypes in single sperm cells from one individual, which revealed an average of
25.3 recombination events per cell (Kirkness et al., 2013). In another study, Lu et al. applied
MALBAC to sequence single sperm cells from an Asian individual, in which they reported
aneuploidy in 4% of the cells and 26 recombination events per single sperm cell (Lu et al.,
2012). While most germline studies have focused on sperm, a recent study used MALBAC
to analyze fertilized oocytes (Hou et al., 2013). In this study oocytes from 8 individual
females were analyzed, which identified 43 cross-over events per oocyte, a recombination
rate that is 1.63X higher than sperm. Interestingly, this study also reported a much higher
rate of aneuploidy in oocytes (17.6%) compared to sperm (4–7%). Taken together, these
studies have confirmed previous recombination rates and revealed a striking amount of
genomic diversity that arises in germ cells during the transmission of genetic material to
offspring.
Embryogenesis
Extensive transcriptional regulation and epigenetic reprogramming occurs during the earliest
stages of embryonic development, as the zygote forms the three major cell lineages
(endoderm, ectoderm and mesoderm). The genomic regulation of these early events and
maintenance of pluripotency has been challenging to study due to the limited amount of
input material. To address this problem, RNA SCS was used to analyze transcriptional
reprograming in vitro during the transition from the inner cell mass of blastocysts to
pluripotent embryonic stem cells (Tang et al., 2010). In another study, RNA SCS was used
to profile single cells from human pre-implantation embryos and embryonic stem cells
which detected over 1000 heterogeneous transcripts within the same blastomere (Yan et al.,
2013). In another study, RNA SCS was used to study transcriptome dynamics from oocyte
to morula development in human and mouse embryos, which delineated a step-wise
progression of pathways that regulate cell cycle, gene regulation, translation and metabolism
(Xue et al., 2013). Another study used single cell bisulfite sequencing to measure cytosine
DNA modifications in mouse embryonic stem cells, which showed massive global
Wang and Navin Page 7
Mol Cell. Author manuscript; available in PMC 2016 May 21.
Author M
anuscriptA
uthor Manuscript
Author M
anuscriptA
uthor Manuscript
demethylation during embryonic development (Guo et al., 2013). Collectively, these studies
have begun to dissect the complex transcriptional regulation and epigenomic reprogramming
that occurs during the earliest stages of embryogenesis.
Organogenesis
In most tissues, traditional classification of cell types has previously been limited to a few
dozen markers that have been used for decades. RNA SCS methods provide a powerful new
unbiased approach to perform transcriptional profiling and identify groups of cells that share
common expression programs, representing distinct cell types. In the first study to apply this
approach RNA SCS was used to analyze lung epithelium development (Treutlein et al.,
2014). From these data, the development of lung progenitor cells were traced as they formed
alveolar air sacs that regulate gas exchange. In this study the authors identified hundreds of
novel markers for distinguishing the four major cell types and used them to reconstruct cell
lineages during alveolar sac differentiation. In another study, RNA SCS was used to analyze
gene expression patterns of single cells during kidney development in mice at E11.5, E12.5
and P4 (Brunskill et al., 2014). These data revealed a multi-lineage priming model in which
many genes and pathways were repressed during nephrogenesis, rather than being activated
from a ‘blank slate’. These initial studies demonstrate the utility of applying unbiased RNA
SCS methods to classify cell types and identify novel markers of cell lineages during organ
development.
Immunology
The immune system is broadly classified into the adaptive and innate components, which
comprise a large variety of cell types that work together in a concerted fashion to recognize
and clear antigens. Although the major immune cell types have been known for decades,
there is little known about the transcriptional heterogeneity within cell types in responses to
antigens. In one study, RNA SCS was used to analyze mouse bone-marrow derived dendritic
cells that were stimulated under different conditions in vitro and found that individual cells
show variable responses that are mediated by interferon paracrine signaling (Shalek et al.,
2014). In another study, RNA SCS was used to identify bimodal gene expression patterns in
bone-marrow-derived dendritic cells stimulated by lipopolysaccharide that was modulated
through an interferon feedback circuit (Shalek et al., 2013). Another study performed
unbiased RNA SCS to profile 4000 single cells from mouse spleen in response to antigen
activation with LPS which revealed seven classes of immune cells and identified 1575
variable gene responses after antigen activation (Jaitin et al., 2014). These studies show that
unbiased RNA SCS methods can be used to investigate heterogeneous transcriptional
responses in immune cells after antigen activation.
Cancer Research
Tumors evolve from single normal cells. During this process the cancer cells accumulate
mutations and diversify to form distinct lineages and subpopulations. This intratumor
heterogeneity confounds the clinical diagnosis and therapeutic treatment of patients. Clonal
diversity is likely to play a key role in tumor progression during processes such as invasion,
clonal evolution and metastasis by providing fuel for evolution to select upon. Genomic
Wang and Navin Page 8
Mol Cell. Author manuscript; available in PMC 2016 May 21.
Author M
anuscriptA
uthor Manuscript
Author M
anuscriptA
uthor Manuscript

diversity also enables tumor cell populations to survive selective pressures in the tumor
microenvironment, including hypoxia, chemotherapy, immune surveillance and geographic
barriers. However, to date studying clonal diversity has been difficult in bulk populations of
tumor cells using standard sequencing methods. DNA and RNA SCS methods provide
powerful new tools for delineating clonal diversity and understanding the role of rare cells
during cancer progression.
To date, most SCS studies of cancer have focused on intratumor heterogeneity and clonal
evolution in primary tumors. The first study used SNS to investigate aneuploidy evolution in
single cells from patients with triple-negative (ER-/PR-/HER2-) breast cancers (Navin et al.,
2011). These data revealed that copy number aberrations evolved in punctuated bursts of
evolution, followed by stable clonal expansions to form the tumor mass. In another study,
single-cell exome sequencing (NUC-SEQ) showed that point mutations evolved gradually
over time generating extensive clonal diversity and many rare (<1%) mutations in the tumor
mass (Wang et al., 2014). Single-cell exome sequencing has also been applied to study
clonal diversity in renal carcinoma (Xu et al., 2012) and a JAK2-positive myeloproliferative
neoplasm (Hou et al., 2012), which identified a monoclonal population of cells that shared a
common genetic lineage. Similarly, single cell exome sequencing was applied to study a
muscle-invasive bladder cancer (Li et al., 2012), and a colon cancer patient (Yu et al., 2014),
which identified two distinct subpopulations of cells in each of which tumor diverged, but
also shared a common set of founder mutations. Another study used DNA SCS to delineate
clonal diversity in glioblastoma, which revealed convergent evolution of EGFR mutations in
different subclones from the same primary tumors (Francis et al., 2014).
DNA SCS has also been used to study clonal evolution in hematopoietic cancers. In one
study, single cancer cells were sequenced from three patients diagnosed with MDS-derived
secondary AML to reconstruct mutational chronology (Hughes et al., 2014). In another
study 1,479 single cells were sequenced from six acute lymphoblastic leukemia (ALL)
patients using targeted panels, which identified the presence of multiple clonal
subpopulations in many AML patients. Clonal dynamics have also been investigated in
xenografts, which showed extensive selection in the first transplantation passages, followed
by clonal dominance (Eirew et al., 2014). Collectively, these studies provide strong evidence
for clonal evolution in many human tumors (Campbell and Polyak, 2007; Greaves and
Maley, 2012; Navin and Hicks, 2010) by showing that single cells can continue to acquire
new mutations and evolve to form the primary tumor mass.
Recent work has begun to use SCS to investigate metastatic dissemination and circulating
tumor cells (CTCs) in the blood. In one study, RNA SCS was used to profile CTCs in the
blood of melanoma patients (Ramskold et al., 2012). In another study, DNA SCS was used
to analyze CTCs from six patients with metastatic colon cancer, showing that many of the
driver mutations in the primary tumor could be detected in the CTCs (Heitzer et al., 2013).
In another study, MALBAC was used to perform exome sequencing and copy number
profiling of single CTCs from 7 metastatic lung adenocarcinoma cancer patients (Ni et al.,
2013). In another study, single-cell exome sequencing was applied to a patient with
metastatic prostate cancer, which identified 51% of the mutations in the primary and
metastatic tumors in the CTC populations (Lohr et al., 2014). RNA SCS was also recently
Wang and Navin Page 9
Mol Cell. Author manuscript; available in PMC 2016 May 21.
Author M
anuscriptA
uthor Manuscript
Author M
anuscriptA
uthor Manuscript

used to investigate CTC clusters in metastatic seeding in breast cancer (Aceto et al., 2014).
Another study applied SNS and morphometric imaging to investigate copy number
evolution in response to Abiraterone therapy in metastatic prostate cancer (Dago et al.,
2014). Collectively, these studies have improved our understanding of CTCs and metastasis
in human cancers.
RNA SCS has also been used to study cell plasticity and cancer stem cells in human tumors.
An unbiased study of hundreds of single cell transcriptomes in five glioblastoma patients
showed that cancer cells displayed a large range of intermediate phenotypes, that do not fall
into distinct classes of epithelial or mesenchymal cell types. In summary, SCS methods have
already had a large impact on improving our fundamental understanding of intratumor
heterogeneity, clonal evolution and metastatic dissemination in human cancers. For a more
detailed review on SCS applications in cancer research, please refer to the following review
articles (Navin, 2014; Van Loo and Voet, 2014).
CLINICAL APPLICATIONS
SCS methods have direct translational applications in cancer treatment and pre-natal genetic
diagnosis (PGD). In cancer research, intratumor heterogeneity presents a major challenge for
clinical diagnostics, because single samples may not represent the tumor as a whole. While
regional sequencing and deep-sequencing can resolve some clonal substructure, they cannot
fully delineate the clonal substructure of a tumor and are inherently unable to determine
which combination of mutations occur in each clone. SCS provides a powerful tool for
resolving intratumor heterogeneity, and guiding targeted therapy towards the most malignant
clones. SCS can also be used to calculate a diversity index for each cancer patient, which
may have prognostic utility for predicting poor survival and poor response to chemotherapy.
SCS technologies will also have direct applications for non-invasive monitoring, by
sequencing single CTCs in the blood to track mutations in the primary and metastatic
tumors. Several studies have already shown that over 50% of the mutations in the primary
and metastatic tumors can be detected in CTCs of lung cancer (Ni et al., 2013), prostate
cancer (Lohr et al., 2014) and colon cancer patients (Heitzer et al., 2013). By sequencing
CTCs at multiple time-points over the course of therapy, oncologists can track mutational
evolution and make rapid changes to their therapeutic strategies before resistance emerges.
SCS methods will also have clinical applications in the early detection of tumor cells in
bodily fluids (urine, sputum, blood) and fine-needle-aspirates samples.
Another major area of clinical utility is pre-implantation genetic diagnosis (PGD) and in
vitro fertilization (IVF). During this procedure a biopsy of a single cell is collected from a
set of blastomeres for DNA SCS to screen for genetic disorders prior to implantation into the
uterus. In the past, these methods have traditionally been limited to cytogenetic analysis and
single-cell PCR. SCS provides the advantage of being able to profile thousands of mutations
and copy number changes associated with diseases that can be screened from one cell using
a single assay. In a proof-of-concept study, SCS was used to profile genomic copy number
and structural variants in single cells from blastomeres derived from a human zygote after
IVF (Voet et al., 2013). In another study, MALBAC was used to sequence polar bodies to
identify copy number changes and point mutations prior to implantation (Hou et al., 2013).
Wang and Navin Page 10
Mol Cell. Author manuscript; available in PMC 2016 May 21.
Author M
anuscriptA
uthor Manuscript
Author M
anuscriptA
uthor Manuscript
These preliminary PGD studies demonstrate the technical feasibility of screening oocytes
and blastomeres to avoid the genetic transmission of diseases, paving the way for future
clinical trials. For a comprehensive review on this topic please refer to the following article
(Van der Aa et al., 2013).
COMPUTATIONAL METHODS
While SCS methods are generating torrents of large-scale genomic datasets, the
computational methods for analyzing these data are severely lacking. SCS data is distinct
from standard NGS data and their analysis tools, due to inherent technical errors and noise,
including coverage non-uniformity, sparse data, false-positive errors, amplification biases
and allelic dropout events. Some of the first SCS analysis methods focused on quantifying
single cell copy number profiles from read count data. To calculate SCS copy number
profiles, a variable-binning algorithm was developed that normalizes errors in mappability
in the human genome, by adjusting genomic intervals based on the expected number of
reads (Baslan et al., 2012; Navin et al., 2011). This processing pipeline was developed into a
user-friendly web server platform with impressive visualization tools called Ginkgo (http://
gb.cshl.edu/ginkgo). Another copy number method uses SCS read count data generated from
DOP-PCR that corrects for GC bias and performs binary segmentation followed by dynamic
thresholding (Zhang et al., 2013).
Several computational methods have also been developed for analyzing RNA SCS datasets
to mitigate technical error. In one method RNA spike-in controls were used to quantify
technical noise during WTA (Katayama et al., 2013). In another method unique molecular
identifiers (UMI) were used to label RNA before WTA and sequencing, to eliminate
amplification bias (Islam et al., 2014). Computational methods have also been developed to
model noise in RNA SCS data using a low-magnitude Poisson processes (Brennecke et al.,
2013). Another RNA SCS method called Monocle represents each cell as a point in a high-
dimension space, and uses dimensionality reduction to extract essential features over time
(Trapnell et al., 2014). Another study developed a latent variable model for single cell RNA
data to reduce technical noise from over amplification and cell cycle genes (Buettner et al.,
2015). Several algorithms have also been developed for assembly of microbial genomes
from single cells. One method called E+V-SC uses lower initial coverage cutoff and then
progressively increases the cutoff to incorporate more bases (Chitsaz et al., 2011). Another
method called IDBA-UD uses similar filtering with progressive coverage thresholds strategy
and error correction (Peng et al., 2012). A third method, SPAdes, tackled the uneven
coverage problem by constructing paired assembly graphs utilizing read-pairs (Bankevich et
al., 2012). In summary, while some initial tools have been developed, new quantitative
methods are still urgently needed for analyzing DNA and RNA SCS datasets.
Alternatives to Single Cell Sequencing
SCS is not the appropriate technology to address every question in biology. In many studies
alternative approaches will provide more powerful tools for investigating population
diversity and identifying rare mutations. Methods such as deep-sequencing (Shah et al.,
2012) or multi-region sequencing(Gerlinger et al., 2012) provide a more economical
Wang and Navin Page 11
Mol Cell. Author manuscript; available in PMC 2016 May 21.
Author M
anuscriptA
uthor Manuscript
Author M
anuscriptA
uthor Manuscript

approach for resolving complex population substructure and have the advantage of
providing genotyping information on thousands of cells. In cases where living tissue or cells
are available, single cells can be subcloned to generate isogenic cell lines or organoids that
act as proxies for single cells (Boj et al., 2015; Sachs and Clevers, 2014). These systems
have the advantage of providing an unlimited amount of genetic material for analysis and
can be used for functional assays. However, a notable limitation is that most cells are not
capable of expanding in culture, which can introduce a strong bias in the representation of
the final cells that are derived from a population. Furthermore as cells adapt to the cell
culture environment they may alter transcriptional or epigenetic programs. In conclusion,
alternative methods to SCS may be a better choice when functional studies are required, or
when very rare cells must be detected in a population (without prior isolation or
enrichment).
CONCLUSIONS & FUTURE DIRECTIONS
SCS methods have provided great insight into our understanding of biological diversity and
rare cells that have previously been difficult to resolve in genomic data from bulk tissue
samples. These tools have had a broad impact on many diverse fields of biology over the
past 5 years, and several common applications have emerged: 1) delineating population
diversity, 2) tracing cell lineages, 3) classifying cell types, and 4) genomic profiling of rare
cells. While many initial studies have been published, there are still many applications that
remain unexplored. In microbiology, SCS methods have yet to be applied to study viruses in
single host cells, to understand how they infect and replicate differently in certain cell types.
In neurobiology, SCS methods can provide important information on transcriptional
programs in response to stimuli, including auditory, sensory and visual stimulation. In
development, single-cell RNA sequencing can be used to study cell lineages in many organ
systems to identify new markers and cell types. In tissue mosaicism, future studies should be
directed at investigating the diversity of point mutations and indels in different tissue types
which are likely to show even more diversity than copy number variations. Cancer
immunotherapy is another exciting application, where SCS tools have great potential for
illuminating phenomenon such as immunoediting and antigenicity in the context of
intratumor heterogeneity. In cancer research, SCS can also help to understand the role of
clonal diversity in complex biological processes, such as transformation, invasion and the
evolution of chemoresistance (Navin, 2014; Van Loo and Voet, 2014).
Future efforts in technology development should focus on in situ SCS methods that can
measure genomic data on single cells while preserving their spatial context in tissues
(Crosetto et al., 2014). Future technologies should also be directed at linking phenotypes and
genotypes in single cells, by combining methods such as live-cell imaging with SCS
methods. Forthcoming technologies should also focus on collecting combinations of
genomic information from the same single cell in parallel (ex. DNA and RNA, or RNA and
epigenomic modifications). Some progress was recently made in this area, by demonstrating
the feasibility of measuring both copy number states and RNA expression profiles in the
same single cells (Dey et al., 2015). Another important area of technology development is
highly-multiplexed single cell DNA and RNA sequencing, to enable the profiling of
thousands of single cells in parallel, at a substantially lower cost. A recent technique using
Wang and Navin Page 12
Mol Cell. Author manuscript; available in PMC 2016 May 21.
Author M
anuscriptA
uthor Manuscript
Author M
anuscriptA
uthor Manuscript

microwells and DNA beads with barcodes shows promise for enabling the profiling 10,000
– 100,000 single cells in parallel (Fan et al., 2015). Several companies (Fluidigm, Wafergen,
Cellular Research) are also focusing their efforts on developing higher-throughput single
cell RNA and DNA sequencing methods, which are expected to come to market soon. While
most SCS studies are still cost-prohibitive, we expect that this barrier will largely be
dissolved over the next few years, as the costs of NGS technologies (Illumina, Life
Technologies) continues to plummet through new technical innovations and fierce industrial
competition.
In closing, while the SCS field is still relatively new, it has already made a large impact on
many diverse fields of biology and has led to great improvements to our fundamental
understanding of human diseases. We expect that the demand and application of SCS tools
will continue to grow tremendously in the coming years, as these methods become more
refined, high-throughput, inexpensive and easier to use in standard research and clinical
laboratories.
Supplementary Material
Refer to Web version on PubMed Central for supplementary material.
Acknowledgements
N.N. is a Nadia’s Gift Foundation Damon Runyon-Rachleff Innovator (DRR-25-13). This work is supported by grants to N.N. from NCI (1RO1CA169244-01). N.N. is a T.C. Hsu Endowed Scholar. Y.W. was supported by an Agilent University relations grant. This work was also supported by the Moonshot Knowledge Gap Award, the Center for Genetics & Genomics and the Center for Epigenetics at the MD Anderson Cancer Center. This work was also supported by a grant to N.N. from the Eric & Liz Lefkofsky Family Foundation.
References
Aceto N, Bardia A, Miyamoto DT, Donaldson MC, Wittner BS, Spencer JA, Yu M, Pely A, Engstrom A, Zhu H, et al. Circulating tumor cell clusters are oligoclonal precursors of breast cancer metastasis. Cell. 2014; 158:1110–1122. [PubMed: 25171411]
Adams DL, Martin SS, Alpaugh RK, Charpentier M, Tsai S, Bergan RC, Ogden IM, Catalona W, Chumsri S, Tang CM, et al. Circulating giant macrophages as a potential biomarker of solid tumors. Proc Natl Acad Sci U S A. 2014; 111:3514–3519. [PubMed: 24550495]
Altomare L, Borgatti M, Medoro G, Manaresi N, Tartagni M, Guerrieri R, Gambari R. Levitation and movement of human tumor cells using a printed circuit board device based on software-controlled dielectrophoresis. Biotechnology and bioengineering. 2003; 82:474–479. [PubMed: 12632404]
Bankevich A, Nurk S, Antipov D, Gurevich AA, Dvorkin M, Kulikov AS, Lesin VM, Nikolenko SI, Pham S, Prjibelski AD, et al. SPAdes: a new genome assembly algorithm and its applications to single-cell sequencing. Journal of computational biology : a journal of computational molecular cell biology. 2012; 19:455–477. [PubMed: 22506599]
Baslan T, Kendall J, Rodgers L, Cox H, Riggs M, Stepansky A, Troge J, Ravi K, Esposito D, Lakshmi B, et al. Genome-wide copy number analysis of single cells. Nat Protoc. 2012; 7:1024–1041. [PubMed: 22555242]
Bianconi E, Piovesan A, Facchin F, Beraudi A, Casadei R, Frabetti F, Vitale L, Pelleri MC, Tassani S, Piva F, et al. An estimation of the number of cells in the human body. Annals of human biology. 2013; 40:463–471. [PubMed: 23829164]
Biesecker LG, Spinner NB. A genomic view of mosaicism and human disease. Nat Rev Genet. 2013; 14:307–320. [PubMed: 23594909]
Wang and Navin Page 13
Mol Cell. Author manuscript; available in PMC 2016 May 21.
Author M
anuscriptA
uthor Manuscript
Author M
anuscriptA
uthor Manuscript

Blainey PC, Mosier AC, Potanina A, Francis CA, Quake SR. Genome of a low-salinity ammonia-oxidizing archaeon determined by single-cell and metagenomic analysis. PLoS One. 2011; 6:e16626. [PubMed: 21364937]
Blainey PC, Quake SR. Dissecting genomic diversity, one cell at a time. Nat Methods. 2014; 11:19–21. [PubMed: 24524132]
Boj SF, Hwang CI, Baker LA, Chio II, Engle DD, Corbo V, Jager M, Ponz-Sarvise M, Tiriac H, Spector MS, et al. Organoid models of human and mouse ductal pancreatic cancer. Cell. 2015; 160:324–338. [PubMed: 25557080]
Brennecke P, Anders S, Kim JK, Kolodziejczyk AA, Zhang X, Proserpio V, Baying B, Benes V, Teichmann SA, Marioni JC, et al. Accounting for technical noise in single-cell RNA-seq experiments. Nat Methods. 2013; 10:1093–1095. [PubMed: 24056876]
Brunskill EW, Park JS, Chung E, Chen F, Magella B, Potter SS. Single cell dissection of early kidney development: multilineage priming. Development. 2014; 141:3093–3101. [PubMed: 25053437]
Buettner F, Natarajan KN, Casale FP, Proserpio V, Scialdone A, Theis FJ, Teichmann SA, Marioni JC, Stegle O. Computational analysis of cell-to-cell heterogeneity in single-cell RNA-sequencing data reveals hidden subpopulations of cells. Nat Biotechnol. 2015; 33:155–160. [PubMed: 25599176]
Cai X, Evrony GD, Lehmann HS, Elhosary PC, Mehta BK, Poduri A, Walsh CA. Single-cell, genome-wide sequencing identifies clonal somatic copy-number variation in the human brain. Cell reports. 2014; 8:1280–1289. [PubMed: 25159146]
Campbell LL, Polyak K. Breast tumor heterogeneity: cancer stem cells or clonal evolution? Cell cycle. 2007; 6:2332–2338. [PubMed: 17786053]
Chitsaz H, Yee-Greenbaum JL, Tesler G, Lombardo MJ, Dupont CL, Badger JH, Novotny M, Rusch DB, Fraser LJ, Gormley NA, et al. Efficient de novo assembly of single-cell bacterial genomes from short-read data sets. Nat Biotechnol. 2011; 29:915–921. [PubMed: 21926975]
Choi JH, Ogunniyi AO, Du M, Du M, Kretschmann M, Eberhardt J, Love JC. Development and optimization of a process for automated recovery of single cells identified by microengraving. Biotechnology progress. 2010; 26:888–895. [PubMed: 20063389]
Cristofanilli M, Budd GT, Ellis MJ, Stopeck A, Matera J, Miller MC, Reuben JM, Doyle GV, Allard WJ, Terstappen LW, et al. Circulating tumor cells, disease progression, and survival in metastatic breast cancer. N Engl J Med. 2004; 351:781–791. [PubMed: 15317891]
Crosetto N, Bienko M, van Oudenaarden A. Spatially resolved transcriptomics and beyond. Nat Rev Genet. 2014
Dago AE, Stepansky A, Carlsson A, Luttgen M, Kendall J, Baslan T, Kolatkar A, Wigler M, Bethel K, Gross ME, et al. Rapid phenotypic and genomic change in response to therapeutic pressure in prostate cancer inferred by high content analysis of single circulating tumor cells. PLoS One. 2014; 9:e101777. [PubMed: 25084170]
de Bourcy CF, De Vlaminck I, Kanbar JN, Wang J, Gawad C, Quake SR. A quantitative comparison of single-cell whole genome amplification methods. PLoS One. 2014; 9:e105585. [PubMed: 25136831]
De Carlos JA, Borrell J. A historical reflection of the contributions of Cajal and Golgi to the foundations of neuroscience. Brain research reviews. 2007; 55:8–16. [PubMed: 17490748]
Dean FB, Hosono S, Fang L, Wu X, Faruqi AF, Bray-Ward P, Sun Z, Zong Q, Du Y, Du J, et al. Comprehensive human genome amplification using multiple displacement amplification. Proc Natl Acad Sci U S A. 2002; 99:5261–5266. [PubMed: 11959976]
Dey SS, Kester L, Spanjaard B, Bienko M, van Oudenaarden A. Integrated genome and transcriptome sequencing of the same cell. Nat Biotechnol. 2015; 33:285–289. [PubMed: 25599178]
Eirew P, Steif A, Khattra J, Ha G, Yap D, Farahani H, Gelmon K, Chia S, Mar C, Wan A, et al. Dynamics of genomic clones in breast cancer patient xenografts at single-cell resolution. Nature. 2014
Evrony GD, Cai X, Lee E, Hills LB, Elhosary PC, Lehmann HS, Parker JJ, Atabay KD, Gilmore EC, Poduri A, et al. Single-neuron sequencing analysis of L1 retrotransposition and somatic mutation in the human brain. Cell. 2012; 151:483–496. [PubMed: 23101622]
Fan HC, Fu GK, Fodor SP. Expression profiling. Combinatorial labeling of single cells for gene expression cytometry. Science. 2015; 347:1258367. [PubMed: 25657253]
Wang and Navin Page 14
Mol Cell. Author manuscript; available in PMC 2016 May 21.
Author M
anuscriptA
uthor Manuscript
Author M
anuscriptA
uthor Manuscript

Fiegler H, Geigl JB, Langer S, Rigler D, Porter K, Unger K, Carter NP, Speicher MR. High resolution array-CGH analysis of single cells. Nucleic Acids Res. 2007; 35:e15. [PubMed: 17178751]
Francis JM, Zhang CZ, Maire CL, Jung J, Manzo VE, Adalsteinsson VA, Homer H, Haidar S, Blumenstiel B, Pedamallu CS, et al. EGFR variant heterogeneity in glioblastoma resolved through single-nucleus sequencing. Cancer discovery. 2014; 4:956–971. [PubMed: 24893890]
Gerlinger M, Rowan AJ, Horswell S, Larkin J, Endesfelder D, Gronroos E, Martinez P, Matthews N, Stewart A, Tarpey P, et al. Intratumor heterogeneity and branched evolution revealed by multiregion sequencing. N Engl J Med. 2012; 366:883–892. [PubMed: 22397650]
Gole J, Gore A, Richards A, Chiu YJ, Fung HL, Bushman D, Chiang HI, Chun J, Lo YH, Zhang K. Massively parallel polymerase cloning and genome sequencing of single cells using nanoliter microwells. Nat Biotechnol. 2013; 31:1126–1132. [PubMed: 24213699]
Greaves M, Maley CC. Clonal evolution in cancer. Nature. 2012; 481:306–313. [PubMed: 22258609]
Guo H, Zhu P, Wu X, Li X, Wen L, Tang F. Single-cell methylome landscapes of mouse embryonic stem cells and early embryos analyzed using reduced representation bisulfite sequencing. Genome Res. 2013; 23:2126–2135. [PubMed: 24179143]
Heitzer E, Auer M, Gasch C, Pichler M, Ulz P, Hoffmann EM, Lax S, Waldispuehl-Geigl J, Mauermann O, Lackner C, et al. Complex tumor genomes inferred from single circulating tumor cells by array-CGH and next-generation sequencing. Cancer Res. 2013; 73:2965–2975. [PubMed: 23471846]
Hou Y, Fan W, Yan L, Li R, Lian Y, Huang J, Li J, Xu L, Tang F, Xie XS, et al. Genome analyses of single human oocytes. Cell. 2013; 155:1492–1506. [PubMed: 24360273]
Hou Y, Song L, Zhu P, Zhang B, Tao Y, Xu X, Li F, Wu K, Liang J, Shao D, et al. Single-cell exome sequencing and monoclonal evolution of a JAK2-negative myeloproliferative neoplasm. Cell. 2012; 148:873–885. [PubMed: 22385957]
Hughes AE, Magrini V, Demeter R, Miller CA, Fulton R, Fulton LL, Eades WC, Elliott K, Heath S, Westervelt P, et al. Clonal architecture of secondary acute myeloid leukemia defined by single-cell sequencing. PLoS genetics. 2014; 10:e1004462. [PubMed: 25010716]
Ishoey T, Woyke T, Stepanauskas R, Novotny M, Lasken RS. Genomic sequencing of single microbial cells from environmental samples. Current opinion in microbiology. 2008; 11:198–204. [PubMed: 18550420]
Islam S, Zeisel A, Joost S, La Manno G, Zajac P, Kasper M, Lonnerberg P, Linnarsson S. Quantitative single-cell RNA-seq with unique molecular identifiers. Nat Methods. 2014; 11:163–166. [PubMed: 24363023]
Jaitin DA, Kenigsberg E, Keren-Shaul H, Elefant N, Paul F, Zaretsky I, Mildner A, Cohen N, Jung S, Tanay A, et al. Massively parallel single-cell RNA-seq for markerfree decomposition of tissues into cell types. Science. 2014; 343:776–779. [PubMed: 24531970]
Katayama S, Tohonen V, Linnarsson S, Kere J. SAMstrt: statistical test for differential expression in single-cell transcriptome with spike-in normalization. Bioinformatics. 2013; 29:2943–2945. [PubMed: 23995393]
Kirkness EF, Grindberg RV, Yee-Greenbaum J, Marshall CR, Scherer SW, Lasken RS, Venter JC. Sequencing of isolated sperm cells for direct haplotyping of a human genome. Genome Res. 2013; 23:826–832. [PubMed: 23282328]
Knouse KA, Wu J, Whittaker CA, Amon A. Single cell sequencing reveals low levels of aneuploidy across mammalian tissues. Proc Natl Acad Sci U S A. 2014; 111:13409–13414. [PubMed: 25197050]
Lasken RS. Single-cell genomic sequencing using Multiple Displacement Amplification. Current opinion in microbiology. 2007; 10:510–516. [PubMed: 17923430]
Lasken RS. Single-cell sequencing in its prime. Nat Biotechnol. 2013; 31:211–212. [PubMed: 23471069]
Lasken RS, McLean JS. Recent advances in genomic DNA sequencing of microbial species from single cells. Nat Rev Genet. 2014; 15:577–584. [PubMed: 25091868]
Li Y, Xu X, Song L, Hou Y, Li Z, Tsang S, Li F, Im KM, Wu K, Wu H, et al. Single-cell sequencing analysis characterizes common and cell-lineage-specific mutations in a muscle-invasive bladder cancer. GigaScience. 2012; 1:12. [PubMed: 23587365]
Wang and Navin Page 15
Mol Cell. Author manuscript; available in PMC 2016 May 21.
Author M
anuscriptA
uthor Manuscript
Author M
anuscriptA
uthor Manuscript
Lohr JG, Adalsteinsson VA, Cibulskis K, Choudhury AD, Rosenberg M, Cruz-Gordillo P, Francis JM, Zhang CZ, Shalek AK, Satija R, et al. Whole-exome sequencing of circulating tumor cells provides a window into metastatic prostate cancer. Nat Biotechnol. 2014; 32:479–484. [PubMed: 24752078]
Lovatt D, Ruble BK, Lee J, Dueck H, Kim TK, Fisher S, Francis C, Spaethling JM, Wolf JA, Grady MS, et al. Transcriptome in vivo analysis (TIVA) of spatially defined single cells in live tissue. Nat Methods. 2014; 11:190–196. [PubMed: 24412976]
Lu S, Zong C, Fan W, Yang M, Li J, Chapman AR, Zhu P, Hu X, Xu L, Yan L, et al. Probing meiotic recombination and aneuploidy of single sperm cells by whole-genome sequencing. Science. 2012; 338:1627–1630. [PubMed: 23258895]
Macaulay IC, Voet T. Single cell genomics: advances and future perspectives. PLoS genetics. 2014; 10:e1004126. [PubMed: 24497842]
Mardis ER. A decade's perspective on DNA sequencing technology. Nature. 2011; 470:198–203. [PubMed: 21307932]
McConnell MJ, Lindberg MR, Brennand KJ, Piper JC, Voet T, Cowing-Zitron C, Shumilina S, Lasken RS, Vermeesch JR, Hall IM, et al. Mosaic copy number variation in human neurons. Science. 2013; 342:632–637. [PubMed: 24179226]
Nagano T, Lubling Y, Stevens TJ, Schoenfelder S, Yaffe E, Dean W, Laue ED, Tanay A, Fraser P. Single-cell Hi-C reveals cell-to-cell variability in chromosome structure. Nature. 2013; 502:59–64. [PubMed: 24067610]
Nagrath S, Sequist LV, Maheswaran S, Bell DW, Irimia D, Ulkus L, Smith MR, Kwak EL, Digumarthy S, Muzikansky A, et al. Isolation of rare circulating tumour cells in cancer patients by microchip technology. Nature. 2007; 450:1235–1239. [PubMed: 18097410]
Navin N, Hicks J. Future medical applications of single-cell sequencing in cancer. Genome Med. 2011; 3:31. [PubMed: 21631906]
Navin N, Kendall J, Troge J, Andrews P, Rodgers L, McIndoo J, Cook K, Stepansky A, Levy D, Esposito D, et al. Tumour evolution inferred by single-cell sequencing. Nature. 2011; 472:90–94. [PubMed: 21399628]
Navin NE. Cancer genomics: one cell at a time. Genome Biol. 2014; 15:452. [PubMed: 25222669]
Navin NE, Hicks J. Tracing the tumor lineage. Mol Oncol. 2010; 4:267–283. [PubMed: 20537601]
Ni X, Zhuo M, Su Z, Duan J, Gao Y, Wang Z, Zong C, Bai H, Chapman AR, Zhao J, et al. Reproducible copy number variation patterns among single circulating tumor cells of lung cancer patients. Proc Natl Acad Sci U S A. 2013; 110:21083–21088. [PubMed: 24324171]
Pamp SJ, Harrington ED, Quake SR, Relman DA, Blainey PC. Single-cell sequencing provides clues about the host interactions of segmented filamentous bacteria (SFB). Genome Res. 2012; 22:1107–1119. [PubMed: 22434425]
Peng Y, Leung HC, Yiu SM, Chin FY. IDBA-UD: a de novo assembler for single-cell and metagenomic sequencing data with highly uneven depth. Bioinformatics. 2012; 28:1420–1428. [PubMed: 22495754]
Pollen AA, Nowakowski TJ, Shuga J, Wang X, Leyrat AA, Lui JH, Li N, Szpankowski L, Fowler B, Chen P, et al. Low-coverage single-cell mRNA sequencing reveals cellular heterogeneity and activated signaling pathways in developing cerebral cortex. Nat Biotechnol. 2014; 32:1053–1058. [PubMed: 25086649]
Powell AA, Talasaz AH, Zhang H, Coram MA, Reddy A, Deng G, Telli ML, Advani RH, Carlson RW, Mollick JA, et al. Single cell profiling of circulating tumor cells: transcriptional heterogeneity and diversity from breast cancer cell lines. PLoS One. 2012; 7:e33788. [PubMed: 22586443]
Qiu S, Luo S, Evgrafov O, Li R, Schroth GP, Levitt P, Knowles JA, Wang K. Single-neuron RNA-Seq: technical feasibility and reproducibility. Frontiers in genetics. 2012; 3:124. [PubMed: 22934102]
Ramskold D, Luo S, Wang YC, Li R, Deng Q, Faridani OR, Daniels GA, Khrebtukova I, Loring JF, Laurent LC, et al. Full-length mRNA-Seq from single-cell levels of RNA and individual circulating tumor cells. Nat Biotechnol. 2012; 30:777–782. [PubMed: 22820318]
Wang and Navin Page 16
Mol Cell. Author manuscript; available in PMC 2016 May 21.
Author M
anuscriptA
uthor Manuscript
Author M
anuscriptA
uthor Manuscript

Rinke C, Schwientek P, Sczyrba A, Ivanova NN, Anderson IJ, Cheng JF, Darling A, Malfatti S, Swan BK, Gies EA, et al. Insights into the phylogeny and coding potential of microbial dark matter. Nature. 2013; 499:431–437. [PubMed: 23851394]
Rodrigue S, Malmstrom RR, Berlin AM, Birren BW, Henn MR, Chisholm SW. Whole genome amplification and de novo assembly of single bacterial cells. PLoS One. 2009; 4:e6864. [PubMed: 19724646]
Sachs N, Clevers H. Organoid cultures for the analysis of cancer phenotypes. Curr Opin Genet Dev. 2014; 24:68–73. [PubMed: 24657539]
Saliba AE, Westermann AJ, Gorski SA, Vogel J. Single-cell RNA-seq: advances and future challenges. Nucleic Acids Res. 2014; 42:8845–8860. [PubMed: 25053837]
Sandberg R. Entering the era of single-cell transcriptomics in biology and medicine. Nat Methods. 2014; 11:22–24. [PubMed: 24524133]
Shah SP, Roth A, Goya R, Oloumi A, Ha G, Zhao Y, Turashvili G, Ding J, Tse K, Haffari G, et al. The clonal and mutational evolution spectrum of primary triple-negative breast cancers. Nature. 2012; 486:395–399. [PubMed: 22495314]
Shalek AK, Satija R, Adiconis X, Gertner RS, Gaublomme JT, Raychowdhury R, Schwartz S, Yosef N, Malboeuf C, Lu D, et al. Single-cell transcriptomics reveals bimodality in expression and splicing in immune cells. Nature. 2013; 498:236–240. [PubMed: 23685454]
Shalek AK, Satija R, Shuga J, Trombetta JJ, Gennert D, Lu D, Chen P, Gertner RS, Gaublomme JT, Yosef N, et al. Single-cell RNA-seq reveals dynamic paracrine control of cellular variation. Nature. 2014; 510:363–369. [PubMed: 24919153]
Shapiro E, Biezuner T, Linnarsson S. Single-cell sequencing-based technologies will revolutionize whole-organism science. Nat Rev Genet. 2013; 14:618–630. [PubMed: 23897237]
Talseth-Palmer BA, Bowden NA, Hill A, Meldrum C, Scott RJ. Whole genome amplification and its impact on CGH array profiles. BMC Res Notes. 2008; 1:56. [PubMed: 18710509]
Tang F, Barbacioru C, Bao S, Lee C, Nordman E, Wang X, Lao K, Surani MA. Tracing the derivation of embryonic stem cells from the inner cell mass by single-cell RNA-Seq analysis. Cell Stem Cell. 2010; 6:468–478. [PubMed: 20452321]
Tang F, Barbacioru C, Wang Y, Nordman E, Lee C, Xu N, Wang X, Bodeau J, Tuch BB, Siddiqui A, et al. mRNA-Seq whole-transcriptome analysis of a single cell. Nat Methods. 2009; 6:377–382. [PubMed: 19349980]
Telenius H, Carter NP, Bebb CE, Nordenskjold M, Ponder BA, Tunnacliffe A. Degenerate oligonucleotide-primed PCR: general amplification of target DNA by a single degenerate primer. Genomics. 1992; 13:718–725. [PubMed: 1639399]
Trapnell C, Cacchiarelli D, Grimsby J, Pokharel P, Li S, Morse M, Lennon NJ, Livak KJ, Mikkelsen TS, Rinn JL. The dynamics and regulators of cell fate decisions are revealed by pseudotemporal ordering of single cells. Nat Biotechnol. 2014; 32:381–386. [PubMed: 24658644]
Treutlein B, Brownfield DG, Wu AR, Neff NF, Mantalas GL, Espinoza FH, Desai TJ, Krasnow MA, Quake SR. Reconstructing lineage hierarchies of the distal lung epithelium using single-cell RNA-seq. Nature. 2014; 509:371–375. [PubMed: 24739965]
Usoskin D, Furlan A, Islam S, Abdo H, Lonnerberg P, Lou D, Hjerling-Leffler J, Haeggstrom J, Kharchenko O, Kharchenko PV, et al. Unbiased classification of sensory neuron types by large-scale single-cell RNA sequencing. Nature neuroscience. 2014
Van der Aa N, Zamani Esteki M, Vermeesch JR, Voet T. Preimplantation genetic diagnosis guided by single-cell genomics. Genome Med. 2013; 5:71. [PubMed: 23998893]
Van Gelder RN, von Zastrow ME, Yool A, Dement WC, Barchas JD, Eberwine JH. Amplified RNA synthesized from limited quantities of heterogeneous cDNA. Proc Natl Acad Sci U S A. 1990; 87:1663–1667. [PubMed: 1689846]
Van Loo P, Voet T. Single cell analysis of cancer genomes. Curr Opin Genet Dev. 2014; 24:82–91. [PubMed: 24531336]
Voet T, Kumar P, Van Loo P, Cooke SL, Marshall J, Lin ML, Zamani Esteki M, Van der Aa N, Mateiu L, McBride DJ, et al. Single-cell paired-end genome sequencing reveals structural variation per cell cycle. Nucleic Acids Res. 2013; 41:6119–6138. [PubMed: 23630320]
Wang and Navin Page 17
Mol Cell. Author manuscript; available in PMC 2016 May 21.
Author M
anuscriptA
uthor Manuscript
Author M
anuscriptA
uthor Manuscript

Wang J, Fan HC, Behr B, Quake SR. Genome-wide single-cell analysis of recombination activity and de novo mutation rates in human sperm. Cell. 2012; 150:402–412. [PubMed: 22817899]
Wang Y, Waters J, Leung ML, Unruh A, Roh W, Shi X, Chen K, Scheet P, Vattathil S, Liang H, et al. Clonal evolution in breast cancer revealed by single nucleus genome sequencing. Nature. 2014; 512:155–160. [PubMed: 25079324]
Woyke T, Xie G, Copeland A, Gonzalez JM, Han C, Kiss H, Saw JH, Senin P, Yang C, Chatterji S, et al. Assembling the marine metagenome, one cell at a time. PLoS One. 2009; 4:e5299. [PubMed: 19390573]
Xu X, Hou Y, Yin X, Bao L, Tang A, Song L, Li F, Tsang S, Wu K, Wu H, et al. Single-cell exome sequencing reveals single-nucleotide mutation characteristics of a kidney tumor. Cell. 2012; 148:886–895. [PubMed: 22385958]
Xue Z, Huang K, Cai C, Cai L, Jiang CY, Feng Y, Liu Z, Zeng Q, Cheng L, Sun YE, et al. Genetic programs in human and mouse early embryos revealed by single-cell RNA sequencing. Nature. 2013; 500:593–597. [PubMed: 23892778]
Yan L, Yang M, Guo H, Yang L, Wu J, Li R, Liu P, Lian Y, Zheng X, Yan J, et al. Single-cell RNA-Seq profiling of human preimplantation embryos and embryonic stem cells. Nature structural & molecular biology. 2013; 20:1131–1139.
Yong Wang JW, Leung Marco L, Unruh Anna, Roh Whijae, Shi Xiuqing, Chen Ken, Scheet Paul, Vattathil Selina, Liang Han, Multani Asha, Zhang Hong, Zhao Rui, Michor Franziska, Meric-Bernstam Funda, Navin Nicholas E. Clonal Evolution in Breast Cancer Revealed by Single Nucleus Genome Sequencing. Nature. 2014
Yu C, Yu J, Yao X, Wu WK, Lu Y, Tang S, Li X, Bao L, Li X, Hou Y, et al. Discovery of biclonal origin and a novel oncogene SLC12A5 in colon cancer by single-cell sequencing. Cell research. 2014; 24:701–712. [PubMed: 24699064]
Yu M, Stott S, Toner M, Maheswaran S, Haber DA. Circulating tumor cells: approaches to isolation and characterization. The Journal of cell biology. 2011; 192:373–382. [PubMed: 21300848]
Zhang C, Zhang C, Chen S, Yin X, Pan X, Lin G, Tan Y, Tan K, Xu Z, Hu P, et al. A single cell level based method for copy number variation analysis by low coverage massively parallel sequencing. PLoS One. 2013; 8:e54236. [PubMed: 23372689]
Zong C, Lu S, Chapman AR, Xie XS. Genome-wide detection of singlenucleotide and copy-number variations of a single human cell. Science. 2012; 338:1622–1626. [PubMed: 23258894]
Wang and Navin Page 18
Mol Cell. Author manuscript; available in PMC 2016 May 21.
Author M
anuscriptA
uthor Manuscript
Author M
anuscriptA
uthor Manuscript
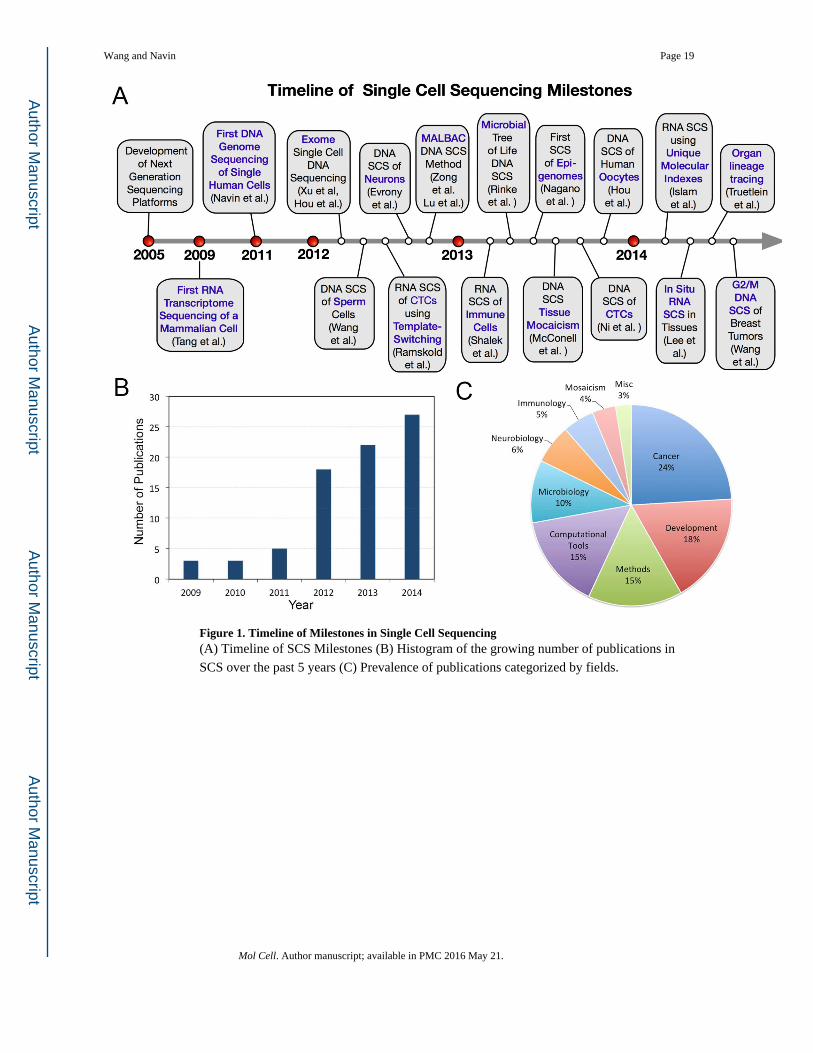
Figure 1. Timeline of Milestones in Single Cell Sequencing(A) Timeline of SCS Milestones (B) Histogram of the growing number of publications in
SCS over the past 5 years (C) Prevalence of publications categorized by fields.
Wang and Navin Page 19
Mol Cell. Author manuscript; available in PMC 2016 May 21.
Author M
anuscriptA
uthor Manuscript
Author M
anuscriptA
uthor Manuscript

Figure 2. WGA and WTA Methods for Single Cell Sequencing(A–B) Whole-genome-amplification methods. (C-D) Whole-transcriptome-amplification
methods. (A) Degenerative-Oligonucleotide-Primer PCR (B) Multiple-
displacementamplification. (C) oligo dT-Anchor Approach (D) Template switching
Wang and Navin Page 20
Mol Cell. Author manuscript; available in PMC 2016 May 21.
Author M
anuscriptA
uthor Manuscript
Author M
anuscriptA
uthor Manuscript

Figure 3. Broad Applications of SCS in Biological and Biomedical ResearchPanels illustrating the diverse fields of biology that have been impacted by SCS technologies
over the past 5 years. Image credits: neurobiology, Zeynep Saygin (Cell Picture Show);
germline transmission, Wang and Navin; organogenesis, Mikael Häggström (Wikimedia
Commons); cancer biology, NIH; clinical diagnostics, Wang and Navin; immunology,
Olivier Schwartz and the Electron Microscopy Core Facility, Institut Pasteur (Cell Picture
Show); microbiology, NIAID; tissue mosaicism, Wang and Navin; embryology, Seth
Ruffins, Russell Jacobs, and the Caltech MRI Atlas of Mouse Development (Cell Picture
Show); prenatal genetic diagnosis, Shutterstock. All images used with permission.
Wang and Navin Page 21
Mol Cell. Author manuscript; available in PMC 2016 May 21.
Author M
anuscriptA
uthor Manuscript
Author M
anuscriptA
uthor Manuscript

Author M
anuscriptA
uthor Manuscript
Author M
anuscriptA
uthor Manuscript
Wang and Navin Page 22
Table 1
Single-Cell Isolation Methods for Abundant and Rare Populations
Isolation Methods for Abundant Cells
Isolation Methods Description Advantages Disadvantages Cost
Serial dilution serial dilution to about one cell per microliter
simple approach; low cost
high probability of isolating multiple cells
$
Mouth pipetting isolate single cells with glass pipettes simple approach; low cost
technically challenging $
Flow sorting microdroplets with single cells are isolated by electric charge at high pressure
high-throughput; fluorescent markers can be used to isolate subpopulations
expensive equipment; requires operator
$$
Robotic micromanipulation robotic-controlled micropipettes isolate single cells
high accuracy; fluorescence can be used
low throughput $$$
Microfluid platforms microfluidic chips isolate single cells in flow channels
high-throughput; reactions can be performed on-chip; reduced reagent costs
cell size must be uniform; expensive consumables
$$$
Isolation Methods for Rare Cells
Isolation Methods Description Advantages Disadvantages Cost
Nanofilters size discrimination on nanofabricated filters
cells are selected by size exclusion
cells can adhere to filters during backwash
$
MagSweeper rotating magnet with EpCAM antibodies high enrichment of rare cells
biased toward markers used for isolation
$$
Laser-capture microdissection cells are cut from a tissue section slide with lasers under a microscope
spatial context is preserved
cell slicing; UV damage to DNA/RNA
$$$
CellSearch magnets with nanoparticles conjugated to antibodies enrich surface markers
high throughput biased toward markers used for isolation
$$$
CellCelector robotic capillary micromanipulator high-throughput expensive system and large footprint
$$$
DEP-Array microchip with dielectropheretic cages high sensitivity for isolating rare cells
time-consuming; low-throughput; cells are deposited into large final volumes
$$$$
This table summarizes the advantages and disadvantages of single-cell isolation methods from abundant populations and rare populations.
Mol Cell. Author manuscript; available in PMC 2016 May 21.

Author M
anuscriptA
uthor Manuscript
Author M
anuscriptA
uthor Manuscript
Wang and Navin Page 23
Table 2
Technical Errors Associated with Single-Cell Sequencing
Technical Artifact Amplification Method Error Type Description
WGA chimeric molecules MDA false-positive inversions 3′ and 5′ ends of newly synthesized molecules hybridize together during MDA leading to inversions
coverage nonuniformity MDA, DOP-PCR, MALBAC copy number aberrations, false-negative SNVs
Under and over amplifications of the genome can lead to erroneous copy number abberations and false-negative SNVs
FP amplification error MDA, DOP-PCR, MALBAC SNV, indel DNA polymerase introduces random FP errors
allelic dropout MDA, DOP-PCR, MALBAC False-negative errors Heterozygous (AB) variants undergo dropout during WGA leading to homozygous (AA or BB) genotypes
pileup regions DOP-PCR copy number amplifications Massive over-amplifications of focal genomic regions occur during DOP-PCR
WTA amplification distortion dt-anchor, Template-Switching erroneous expression values over/under amplification during WTA leads to erroneous expression values
transcript dropout dt-anchor, Template-Switching, UMI false-negative unexpressed genes failure to amplify a transcript during WTA
3′ bias dt-anchors failure of RT polymerase to fully synthesize the first cDNA strand
strong bias toward amplification of 3″ end of RNA transcripts
This table lists the common technical errors that arise during WGA and WTA in single-cell sequencing experiments.
Mol Cell. Author manuscript; available in PMC 2016 May 21.


![Haemophilus [NavIn]](https://img.dokumen.tips/doc/110x75/577d27191a28ab4e1ea30e7f/haemophilus-navin.jpg)