Embed Size (px)
Citation preview
YOIKK Secretariat, 2008YOIKK Secretariat, 2008
Undersecretariat of Treasury
October 19, 2009İSTANBUL
FDI in TURKEY
Özge DUMLUPINARTreasury Expert

YOIKK Secretariat 2008YOIKK Secretariat 2008 22
► Outline
Global Trends in FDI Inflows
Basic FDI Statistics of Turkey
FDI Policy of Turkey
FDI in TURKEY
YOIKK Secretariat 2008YOIKK Secretariat 2008 33
I. Global Trends in FDI Inflows
FDI in TURKEY

YOIKK Secretariat 2008YOIKK Secretariat 2008 44
Fall from a historic high of $1,979 billion in 2007 to $1,697 billion in 2008 (a decline of %14)
Slide continuation into 2009 : Fall in inflows by %44 compared with their level in the same period in 2008.
Global Trends in FDI Inflows
►FDI inflows: severely affected worldwide by the economic and financial crisis in 2008.
►Expectation to fall from $1.7 trillion to below $1.2 trillion in 2009.►Slow recovery in 2010 (to a level up to $1.4 trillion) and 2011 (approaching $1.8 trillion)

YOIKK Secretariat 2008YOIKK Secretariat 2008 55
Global Trends in FDI Inflows
►Change in the investment landscape:
►Decline in the numbers and values of cross border M&As in 2008, also decline in greenfield investments in the last quarter.
►Intentions of the majority (%58) of large TNCs to reduce their FDI expenditures in 2009 from their 2008 levels.
Decline in FDI inflows of developed countries by %29
Surge to %43 in global FDI inflows in the share of developing and transition economes in 2008.

YOIKK Secretariat 2008YOIKK Secretariat 2008 66
Global Trends in FDI Inflows
►Despite concerns about a possible rise in investment protectionism, greater openness in FDI policies worldwide:
►Trend of scrutinizing foreign investments for national security reasons.
►Expansion in the network of IIAs: signature of 59 new bilateral investment treaties and increase in the number of DTT and international agreements with investment provisons.
During 2008, 110 new FDI –related measures were introduced, of which 85 were more favourable to FDI.
Compared to 2007, the percentage of less favourable measures for FDI remained unchanged.
YOIKK Secretariat 2008YOIKK Secretariat 2008 77
II. Basic FDI Statistics of Turkey
FDI in TURKEY

YOIKK Secretariat 2008YOIKK Secretariat 2008 88
Basic FDI Statistics of Turkey
8.469
1.0821.702
2.785
10.031
20.185
22.046
18.187
0
2.000
4.000
6.000
8.000
10.000
12.000
14.000
16.000
18.000
20.000
22.000
24.000
1995-2001 2002 2003 2004 2005 2006 2007 2008
USD Million
Chart 3: FDI I nflows in Turkey Between 1995 and 2008
Source: CBRT

YOIKK Secretariat 2008YOIKK Secretariat 2008 99
Basic FDI Statistics of Turkey
1995-2001 (Cumulative)
2002 2003 2004 2005 2006 2007 2008
Cumulative FDI (net) 8.469 1.082 1.702 2.785 10.031 20.185 22.046 18.187 FDI 8.469 1.082 704 1.442 8.190 17.263 19.120 15.250
Capital (Net) 8.469
566 556 888 8.053 16.876 18.099 14.672 Inflow 9.547 571 564 986 8.454 17.533 18.842 14.707 Outflow -1.078 -5 -8 -98 -401 -657 -743 -35
Reinvested Earnings a - - 132 204 81 106 294 204 Other Capitalb - 516 16 350 56 281 727 374 Real Estate Purchases (Net) - - 998 1.343 1.841 2.922 2.926 2.937
FDI Inflows and Their Distribution by Components Between 1995-2008 (USD million)
Source: CBRT
YOIKK Secretariat 2008YOIKK Secretariat 2008 1010
Basic FDI Statistics of Turkey
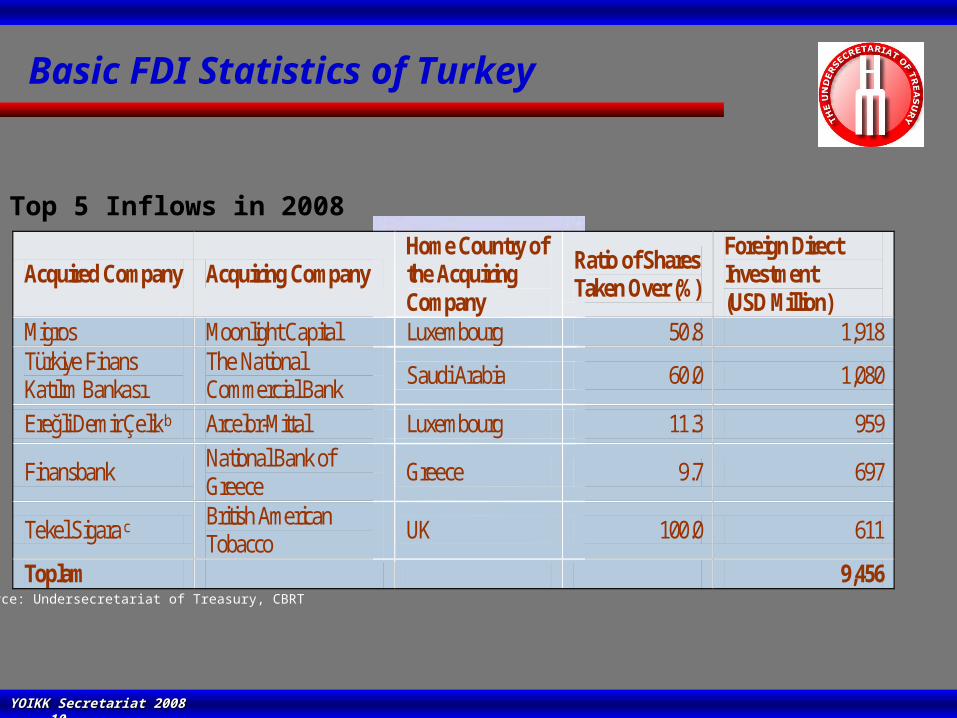
Acquired Company Acquiring Company Home Country of the Acquiring Company
Ratio of Shares Taken Over (%)
Foreign Direct Investment (USD Million)
Migros Moonlight Capital Luxembourg 50.8 1,918 Türkiye Finans Katılım Bankası
The National Commercial Bank Saudi Arabia 60.0 1,080
Ereğli Demir Çelik b Arcelor-Mittal Luxembourg 11.3 959
Finansbank National Bank of Greece Greece 9.7 697
Tekel Sigara c British American Tobacco UK 100.0 611
Toplam 9,456 Source: Undersecretariat of Treasury, CBRT
Top 5 Inflows in 2008

YOIKK Secretariat 2008YOIKK Secretariat 2008 1111
Basic FDI Statistics of Turkey
Rank Sector Capital (%)
1 Financial Intermediation 5,925 39.7
2 Manufacturing 3,828 25.7
3 Wholesale and Retail Trade 2,073 13.9
4 Electricity,Gas and Water Supply 1,053 7.1
5 Construction 736 4.9
6 Real Estate, Renting and Business Activities 673 4.5
7 Mining and Quarrying 173 1.2
8 Transport, Storage and Communication 169 1.1
9 Health and Social Work 150 1.0
10 Other Community, Social and Personal Service Activities
59 0.4
Other 72 0.5
Total 14,911 100.0
FDI Inflows by Sector, 2008 (USD Million)
Source: CBRT
YOIKK Secretariat 2008YOIKK Secretariat 2008 1212
Basic FDI Statistics of Turkey
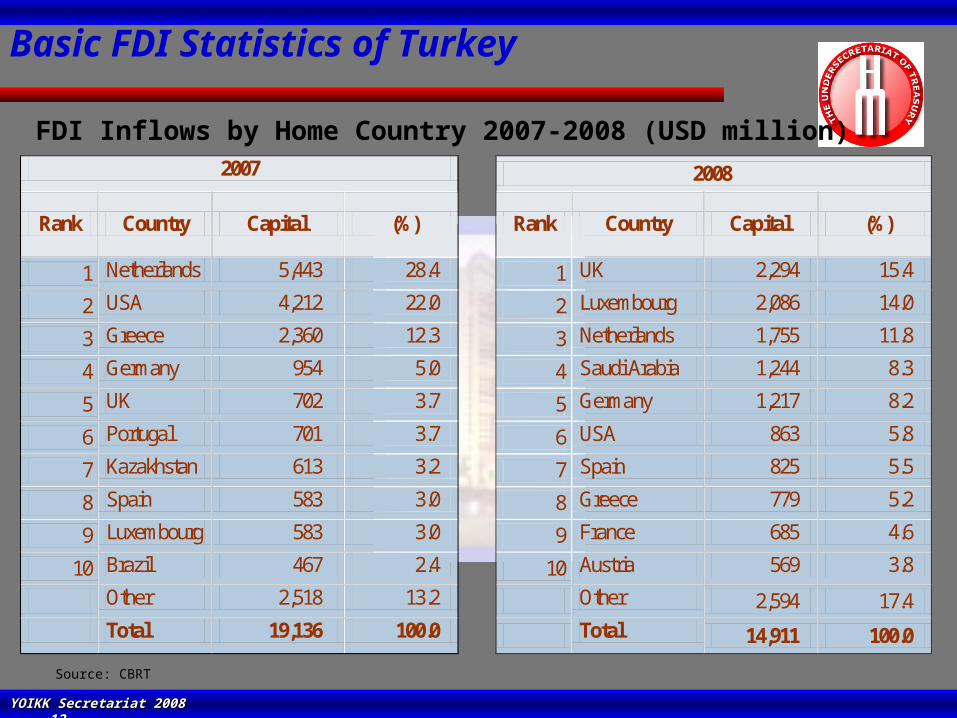
2007 2008
Rank Country Capital (%)
Rank Country Capital (%)
1 Netherlands 5,443 28.4 1 UK 2,294 15.4
2 USA 4,212 22.0 2 Luxembourg 2,086 14.0
3 Greece 2,360 12.3 3 Netherlands 1,755 11.8
4 Germany 954 5.0 4 Saudi Arabia 1,244 8.3
5 UK 702 3.7 5 Germany 1,217 8.2
6 Portugal 701 3.7 6 USA 863 5.8
7 Kazakhstan 613 3.2 7 Spain 825 5.5
8 Spain 583 3.0 8 Greece 779 5.2
9 Luxembourg 583 3.0 9 France 685 4.6
10 Brazil 467 2.4 10 Austria 569 3.8
Other 2,518 13.2 Other 2,594 17.4 Total 19,136 100.0 Total 14,911 100.0
FDI Inflows by Home Country 2007-2008 (USD million)
Source: CBRT

YOIKK Secretariat 2008YOIKK Secretariat 2008 1313
Basic FDI Statistics of Turkey
1954-2002 1954-2008 Countries
(Cumulative) 2003 2004 2005 2006 2007 2008
Total
European Union 2.787 436 1.006 1.545 1.979 2.084 1.789 11.626 Germany 925 137 355 469 556 563 595 3.600 The Netherlands 467 65 138 192 270 255 286 1.673 United Kingdom 351 67 130 308 461 456 248 2.021 Other European Countries 1.044 167 383 576 692 810 660 4.332
Other European Countries (Excluding EU) 585 134 265 320 372 492 548 2.716
African Countries 83 30 37 55 43 47 52 347 North America 349 53 98 111 136 165 149 1.061
U.S.A. 326 44 87 97 113 132 130 929 Canada 23 9 11 14 23 33 19 132
Central-South America And Caribbean 39 5 12 16 10 21 12 115
Near And Middle Eastern Countries 1.060 255 349 380 410 506 567 3.527 Azerbaijan 91 37 51 55 81 120 136 571 Iraq 161 38 46 57 73 112 88 575 Iran 319 102 123 121 109 106 139 1.019 Other 489 78 129 147 147 168 204 1.362
Other Asian Countries 328 102 151 163 165 278 233 1.420 China 98 41 56 32 22 42 46 337 South Korea 47 12 16 18 12 24 13 142 Other 183 49 79 113 131 212 174 941
Other Countries 63 14 30 23 54 36 47 267 Total 5.294 1.029 1.948 2.613 3.169 3.629 3.397 21.079
Breakdown of Companies with International Capital According to their Country of Origin
Source:Undersecretariat of Turkey, Porvisional Data

YOIKK Secretariat 2008YOIKK Secretariat 2008 1414
Basic FDI Statistics of Turkey
FDI Inflows by economy (USD million)
Rank Country 2008
1 United States 316.112
2 France 117.510
3 China 108.312
4 United Kingdom 96.939
5 Russian Federation 70.320
6 Spain 65.539
7 Hong Kong, China 63.003
8 Belgium 59.680
9 Australia 46.774
10 Brazil 45.058
20 Turkey 18.198
Source: WIR 2009

YOIKK Secretariat 2008YOIKK Secretariat 2008 1515
Basic FDI Statistics of Turkey
FDI Inflows by West Asia region (USD million)
Rank Country 2008
1 Saudi Arabia 38.223
2 Turkey 18.198
3 United Arab Emirates 13.700
4 Qatar 6.700
5 Oman 2.928
Source: WIR 2009

YOIKK Secretariat 2008YOIKK Secretariat 2008 1616
Basic FDI Statistics of Turkey
FDI Stock by economy (USD million)
Rank Country 2008
1 United States 2.278.892
2 France 991.377
3 United Kingdom 982.877
4 Hong Kong, China 835.764
5 Germany 700.471
6 Netherlands 644.598
7 Spain 634.788
8 Belgium 518.940
9 Canada 412.268
10 China 378.083
40 Turkey 69.871
Source: WIR 2009

YOIKK Secretariat 2008YOIKK Secretariat 2008 1717
Basic FDI Statistics of Turkey
FDI Stock by West Asia region (USD million)
Rank Country 2008
1 Saudi Arabia 114.277
2 Turkey 69.871
3 United Arab Emirates 69.420
4 Lebanon 24.170
5 Qatar 22.055
Source: WIR 2009

YOIKK Secretariat 2008YOIKK Secretariat 2008 1818
III. FDI Policy of Turkey
FDI in TURKEY

YOIKK Secretariat 2008YOIKK Secretariat 2008 1919
►Three basic components:
Increasing predictability in the economyEconomic stabilityPolitical stability
Maintaining a functioning free market economy
Creating an investor friendly environment
FDI Policy of Turkey

YOIKK Secretariat 2008YOIKK Secretariat 2008 2020
►Creating an Investor Friendly Environment: Investment Environment Reform Programme
FDI Policy of Turkey
Diagnosis on Problem Areas of Investment Environment in Turkey
Determination of Priorities with All Relevant Parties
Design of an Appropriate Structure Involving the Stakeholders

YOIKK Secretariat 2008YOIKK Secretariat 2008 2121
►Creating an Investor Friendly Environment: Two basic platforms based on public-private sector dialogue and cooperation
Coordination Council for the Improvement of Investment Environment (YOİKK)
Investment Advisory Council (IAC)
FDI Policy of Turkey

YOIKK Secretariat 2008YOIKK Secretariat 2008 2222
FDI Policy of TurkeyYOIKK STRUCTURE
Coordination Council for the Improvement of Investment Environment (YOIKK)
Investment Advisory Council
Steering Committee
Location of Investment
Company Establishment
Research & Development
Foreign Trade& Customs
Employment
Corporate Governance
Licensing
Intellectual Property
Rights
Investment Promotion
Taxes and Incentives
Foreign Direct Investment Legislation
SMEs

YOIKK Secretariat 2008YOIKK Secretariat 2008 2323
FDI Policy of Turkey
YOIKK WORKING PRINCIPLES
AGENDA SETTINGAGENDA SETTING WORKING WORKING OUTCOMES OUTCOMES
• Recommendations of public institutions
• Recommendations of private sector
• Assessments in international indices and publications
• IAC recommendations
• Technical Committee Action Plans
• Basic policy guides
• Twinning Project
YOIKK
STEERING COMMITTEE
TECHNICAL COMMITTEES
• Draft regulations
• Institutional capacity building
• Recommendations related to enforcement
Council of Ministers is regularly informed about YOIKK studies.

YOIKK Secretariat 2008YOIKK Secretariat 2008 2424
FDI Policy of Turkey
IAC STRUCTURE
Executives of leading multinational firms,
Heads of international institutions (IMF, World Bank, European Investment Bank),
TOBB, TUSİAD, YASED, TİM
Investment Advisory Council of Turkey had 5 meetings so far.
V. Meeting June 18, 2008
IV. Meeting June 11, 2007
III. Meeting June 29, 2006
II. Meeting April 29, 2005
I. Meeting March 15, 2004

YOIKK Secretariat 2008YOIKK Secretariat 2008 2525
►The main achievements in the investment environment of Turkey: FDI law Simplification of Business Start-Up Investment Support and Promotion Agency of Turkey Trade Registry Automation ProjectEmployment PackageSocial Security Reform Regulations on mining and fuel sectors Minimum living allowance systemCommunique on Principles to be Followed by Joint Stock
Corporations Subject To Capital Market Law Increased flexibility in the labor market Improved infrastructure in strategic sectors Improved protection for intellectual property rightsNew investment incentive system
FDI Policy of Turkey

YOIKK Secretariat 2008YOIKK Secretariat 2008 2626
Fraser Institute/Economic Freedom Index
2006 2007 2008
No of countries 141 141 141
Ranking of Turkey
80 94 90
Transparency International /Corruption Percepitons Index
2006 2007 2008
No of countries
163 180 180
Ranking of Turkey
60 64 58
IMD/World Competitiveness Yearbook
2007 2008 2009
No of countries
55 55 57
Ranking of Turkey
48 48 47
The performance of Turkey in the international investment indices
FDI Policy of Turkey
WEF/Global Competitiveness Report
2007 2008 2009
No of countries
131 134 133
Ranking of Turkey
53 63 61

YOIKK Secretariat 2008YOIKK Secretariat 2008 2727
►Useful Links
www.hazine.gov.trwww.yoikk.gov.tr
FDI Policy of Turkey

YOIKK Secretariat, 2008YOIKK Secretariat, 2008
Undersecretariat of Treasury
October 19, 2009İSTANBUL
FDI in TURKEY
Özge DUMLUPINARTreasury Expert