Embed Size (px)
Citation preview
Structure of the Yegua-Jackson Aquifer of the Texas Gulf Coastal Plain Report ## by Paul R. Knox, P.G. Van A. Kelley, P.G. Astrid Vreugdenhil Neil Deeds, P.E. Steven Seni, Ph.D., P.G. Texas Water Development Board P.O. Box 13231, Capitol Station Austin, Texas 7871-3231 September 2007
LegendState LineShelf EdgeYegua-Jackson outcropCounty BoundariesWell Locations
FaciesDeltaic/Delta Front/StrandplainWave-Dominated DeltaDelta Margin < 100'FluvialFloodplainSlopeShelf-Edge DeltaShelf/Slope Sand > 100'
0 20 40 6010Miles
Sediment Input Axis(Size Relative to Sed. Vol.)

TWDB Report ##: Structure of the Yegua-Jackson Aquifer of the Texas Gulf Coastal Plain
Texas Water Development Board
Report ##
Structure of the Yegua-Jackson Aquifer of the Texas Gulf Coastal Plain
by Van A. Kelley, P.G. Astrid Vreugdenhil Neil Deeds, P.E. INTERA Incorporated
Paul R. Knox, P.G. Baer Engineering and Environmental Consulting, Incorporated
Steven Seni, Ph.D., P.G. Consulting Geologist
September 2007

ii
This page is intentionally blank.


iv
This page is intentionally blank.
TWDB Report ##: Structure of the Yegua-Jackson Aquifer of the Texas Gulf Coastal Plain
v
Table of Contents
Executive Summary ......................................................................................................................E-i
1. Introduction......................................................................................................................... 1-1
2. Study Area and Geologic Setting........................................................................................ 2-1 2.1 Description of the Study Area .................................................................................. 2-1 2.2 Geologic Setting ....................................................................................................... 2-2
2.2.1 Lithology of Geologic Units......................................................................... 2-5 2.2.1.1 Upper Claiborne Group................................................................... 2-6 2.2.1.2 Jackson Group................................................................................. 2-7
3. Previous Work .................................................................................................................... 3-1 3.1 Geology .................................................................................................................... 3-1 3.2 Hydrogeology........................................................................................................... 3-2
4. Analysis Methodology and Approach ................................................................................ 4-1 4.1 Data Selection........................................................................................................... 4-1
4.1.1 Stakeholder Data Sources............................................................................. 4-1 4.1.2 Geophysical Log Sources............................................................................. 4-3 4.1.3 Structural Geology Sources.......................................................................... 4-4 4.1.4 Lithology and Depositional Systems Sources .............................................. 4-4
4.2 Stratigraphic Interpretation Approach...................................................................... 4-5 4.2.1 Incorporation of Existing Data and Knowledge........................................... 4-5 4.2.2 Chronostratigraphic Concepts and Interpretation Methodology .................. 4-6
4.2.2.1 Concepts.......................................................................................... 4-6 4.2.3 Methodology ................................................................................................ 4-8
4.3 Structure Mapping Approach ................................................................................. 4-10 4.3.1 Potential Mismatch of Previously Mapped Outcrop Boundaries and
Layer Outcrop Boundaries ......................................................................... 4-11 4.4 Lithologic Interpretation Approach........................................................................ 4-12
4.4.1 Algorithmic Lithologic Analyses ............................................................... 4-12 4.4.1.1 Electric Logs ................................................................................. 4-12 4.4.1.2 The Code....................................................................................... 4-13 4.4.1.3 The Algorithm............................................................................... 4-13 4.4.1.4 Quality Control ............................................................................. 4-15
4.4.2 Sand Thickness Mapping ........................................................................... 4-16 4.5 Depositional Systems Mapping Approach ............................................................. 4-17
5. Yegua-Jackson Aquifer Structure, Lithology, and Depositional Systems.......................... 5-1 5.1 Stratigraphy .............................................................................................................. 5-1
5.1.1 Major Subdivisions....................................................................................... 5-1 5.1.2 Minor Subdivisions ...................................................................................... 5-5
5.2 Structure ................................................................................................................... 5-6

TWDB Report ##: Structure of the Yegua-Jackson Aquifer of the Texas Gulf Coastal Plain
vi
5.2.1 Comparison of Layer Boundary Outcrops and Formational Outcrops ....................................................................................................... 5-9
5.3 Lithology ................................................................................................................ 5-12 5.3.1 Upper Jackson Layer .................................................................................. 5-13
5.3.1.1 Outcrop Region............................................................................. 5-13 5.3.1.2 General Study Area....................................................................... 5-14
5.3.2 Lower Jackson Layer.................................................................................. 5-15 5.3.2.1 Outcrop Region............................................................................. 5-15 5.3.2.2 General Study Area....................................................................... 5-16
5.3.3 Upper Yegua Layer .................................................................................... 5-17 5.3.3.1 Outcrop Region............................................................................. 5-17 5.3.3.2 General Study Area....................................................................... 5-17
5.3.4 Lower Yegua Layer.................................................................................... 5-18 5.3.4.1 Outcrop Region............................................................................. 5-18 5.3.4.2 General Study Area....................................................................... 5-19
5.4 Depositional Systems ............................................................................................. 5-20 5.4.1 Lower Yegua Layer.................................................................................... 5-21 5.4.2 Upper Yegua Layer .................................................................................... 5-22 5.4.3 Lower Jackson Layer.................................................................................. 5-23 5.4.4 Upper Jackson Layer .................................................................................. 5-23
6. Conclusions and Recommendations ................................................................................... 6-1
7. Acknowledgements............................................................................................................. 7-1
8. References........................................................................................................................... 8-1
List of Figures
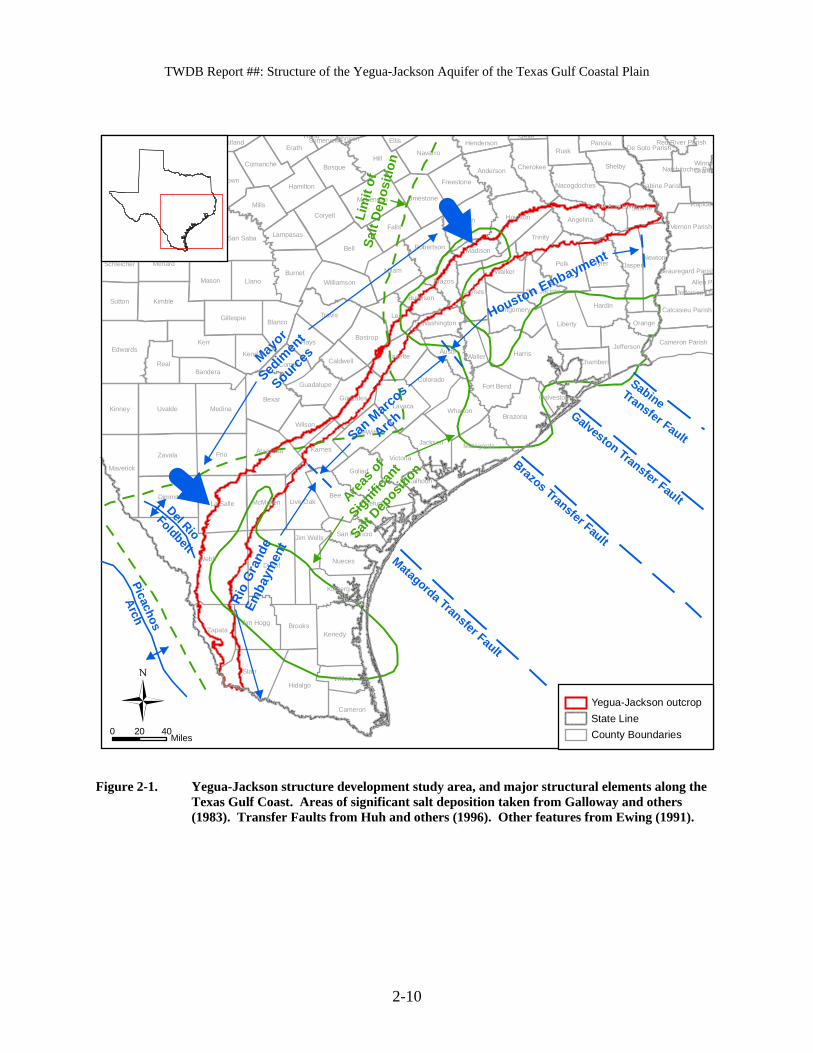
Figure 2-1. Yegua-Jackson structure development study area, and major structural elements along the Texas Gulf Coast. Areas of significant salt deposition taken from Galloway and others (1983). Transfer Faults from Huh and others (1996). Other features from Ewing (1991). .................... 2-10
Figure 2-2. Stratigraphic correlation basemap with cross section lines. .............................. 2-11 Figure 2-3. Generalized stratigraphic column for the Yegua-Jackson Aquifer (after
Preston, 2006). ................................................................................................... 2-12 Figure 2-4. Chronostratigraphy, lithostratigraphy, depositional episodes and
depocenters, tectonic events, oceanographic and climatic events, and global sea level for the Oligocene and part of the Eocene for the Gulf Coast. ................................................................................................................. 2-13
Figure 2-5. Paleontologic markers and approximate ages for the Yegua-Jackson interval and adjacent formations. Markers and ages from Fang (2000), Harland and others (1990), and Galloway and others (1991)............................ 2-14
Figure 4-1. Faults for the Jackson Group, Southern Study Area. From Quick and others (1977) and Dodge and Posey (1981)....................................................... 4-19
TWDB Report ##: Structure of the Yegua-Jackson Aquifer of the Texas Gulf Coastal Plain
vii
Figure 4-2. Faults for the Jackson Group, Central Study Area. From Quick and others (1977) and Dodge and Posey (1981)....................................................... 4-20
Figure 4-3. Faults for the Jackson Group, Northern Study Area. From Quick and others (1977) and Dodge and Posey (1981)....................................................... 4-21
Figure 4-4. Faults for the Yegua Formation, Southern Study Area. From Quick and others (1977) and Dodge and Posey (1981)................................................ 4-22
Figure 4-5. Faults for the Yegua Formation, Central Study Area. From Quick and others (1977) and Dodge and Posey (1981)....................................................... 4-23
Figure 4-6. Faults for the Yegua Formation, Northern Study Area. From Quick and others (1977) and Dodge and Posey (1981)................................................ 4-24
Figure 4-7. Depositional cycles (modified from Galloway, 1989a)..................................... 4-25 Figure 4-8. Hierarchical cycle nomenclature and dominant factors at each scale.
Modified from Fisher (1964), Hays and others (1976), Meckel and Galloway (1996), and Mitchum and Van Wagoner (1991). (Ky = 1,000 years)........................................................................................................ 4-25
Figure 4-9. Construction of an aquifer. ................................................................................ 4-26 Figure 4-10. Genealogical correlation work flow................................................................... 4-27 Figure 4-11. Process chart for automated portion of lithologic log interpretation. ................ 4-28 Figure 5-1. Lower Yegua isopach map................................................................................. 5-25 Figure 5-2. Upper Yegua isopach map. ................................................................................ 5-26 Figure 5-3. Lower Jackson isopach map. ............................................................................. 5-27 Figure 5-4. Upper Jackson isopach map............................................................................... 5-28 Figure 5-5. Quartz-Feldspar-Lithic diagram showing sand grain composition for
samples in the Yegua-Jackson Aquifer (after Meckel), 1993. Original data from Bockoven (1985) and Loucks and others (1986). ............................. 5-29
Figure 5-6. Upper Jackson sand percent map....................................................................... 5-30 Figure 5-7. Lower Jackson sand percent map. ..................................................................... 5-31 Figure 5-8. Upper Yegua sand percent map. ........................................................................ 5-32 Figure 5-9. Lower Yegua sand percent map......................................................................... 5-33 Figure 5-10. Lower Yegua depositional facies map............................................................... 5-34 Figure 5-11. Upper Yegua depositional facies map. .............................................................. 5-35 Figure 5-12. Lower Jackson depositional facies map............................................................. 5-36 Figure 5-13. Upper Jackson depositional facies map. ............................................................ 5-37
List of Tables
Table 4-1. Summary of Groundwater Conservation Districts contacted for the study with a summary of data supplied................................................................ 4-2

TWDB Report ##: Structure of the Yegua-Jackson Aquifer of the Texas Gulf Coastal Plain
viii
Plates
Plate 1 Study Base Map Plate 2 Location of Geologic Formations Within and Adjacent to the Yegua-Jackson Outcrop
Area Plate 3 Dip Cross Section 3 Plate 4 Dip Cross Section 4 Plate 5 Dip Cross Section 6 Plate 6 Dip Cross Section 9 Plate 7 Dip Cross Section 14 Plate 8 Dip Cross Section 17 Plate 9 Dip Cross Section 20 Plate 10 Dip Cross Section 24 Plate 11 Dip Cross Section 29 Plate 12 Structure Map of the Top Jackson Plate 13 Structure Map of the Top of the Lower Jackson Plate 14 Structure Map of the Top Yegua Plate 15 Structure Map of the Top of the Lower Yegua Plate 16 Structure Map of the Base Yegua-Jackson Aquifer Plate 17 Net Sand Isopach Map of the Upper Jackson Layer Plate 18 Net Sand Isopach Map of the Lower Jackson Layer Plate 19 Net Sand Isopach Map of the Upper Yegua Layer Plate 20 Net Sand Isopach Map of the Lower Yegua Layer
Appendices
Appendix A Study Wells, Locations, Cross Section Occurrences, and Key Log Parameters
Appendix B Operator, Well Name and Number, and Tobin Grid Location for Study Wells
Appendix C Measured Depth to Layer Boundaries by Well, Annotated with Correlation
Quality Ranking
Appendix D Net Sand Values by Well and by Layer
Appendix E Structure Draft Final Report Technical / Administrative Comments

TWDB Report ##: Structure of the Yegua-Jackson Aquifer of the Texas Gulf Coastal Plain
E-i
Executive Summary
This report documents the development of the structure, lithology, and depositional framework
for the Yegua-Jackson Aquifer in Texas. The Texas Water Development Board (TWDB)
designated the Eocene-age Yegua-Jackson interval as a minor aquifer in the 2002 State Water
Plan. This elevation in status from “other aquifer” resulted from the recognition of the large
number of wells in the TWDB database completed in the Yegua-Jackson and the relatively large
use of water from this interval. The Yegua-Jackson structure presented in this report has been
developed specifically to support the TWDB Groundwater Availability Section in their future
development of a Yegua-Jackson Aquifer Groundwater Availability Model.
Since 1999, the Texas Legislature has funded the Groundwater Availability Modeling program
aimed at providing standardized tools for the assessment of the State’s groundwater resources.
Due to the early success of the Groundwater Availability Modeling program, Senate Bill 2 (77th
Legislature in 2001) mandated that the TWDB shall obtain or develop Groundwater Availability
Models for all major and minor aquifers in Texas in coordination with groundwater conservation
districts and regional water planning groups (Texas Water Code Section 16.012). The results of
this research provide direct support for the future development of the Yegua-Jackson aquifer
Groundwater Availability Model and the advancement of the understanding of the hydrogeology,
and controls on availability and sustainability, of the aquifer.
The Yegua-Jackson Aquifer exists predominantly in the outcrop or near-outcrop areas of the
Yegua Formation and Jackson group. In Texas, this outcrop area stretches in a relatively thin
band approximately parallel to the coastline, from Starr County in the Rio Grande Valley to
Sabine County in East Texas, and is thus bracketed by the Rio Grande River to the south, and the
Toledo Bend Reservoir (along the Sabine River) to the east. The width of this outcrop varies
from less than 10 miles in Gonzales County to near 40 miles in La Salle County, with an area of
approximately 11,000 square miles.
The Yegua Formation overlies the Cook Mountain Formation and is uppermost in the Middle
Eocene Upper Claiborne group. This group is overlain by the Upper Eocene to Oligocene
Jackson Group. In Texas, the Jackson Group consists of the Whitsett, Manning, Wellborn, and
Caddell formations (or their analogues). The Yegua-Jackson interval continues across the
Sabine River into Louisiana, where the Yegua Formation is called the Cockfield Formation, and

TWDB Report ##: Structure of the Yegua-Jackson Aquifer of the Texas Gulf Coastal Plain
E-ii
the Jackson Group is undifferentiated. Thickness of the total interval ranges from less than
1,800 feet over the San Marcos Arch to more than 3,000 feet in the Houston and Rio Grande
depositional basins. Structural dips vary from about 20 to 360 feet per mile, with the greater dips
occurring in the downdip regions and across the San Marcos Arch, a persistent structural feature
that was mildly active during the time of Yegua and Jackson deposition. The Yegua-Jackson
interval is comprised of interbedded sands, silts, and clays deposited in settings ranging from
fluvial to marginal marine (deltaic and barrier/strandplain) to shallow marine shelf. Deltas in the
Rio Grande Embayment of South Texas are considered by many workers to have greater wave
influence and, consequently, a greater tendency toward shore-parallel alignment and internal
fabric. In contrast, deltas from the middle of the Texas coast northeastward have greater fluvial
influence and, thus, large sand bodies are more often aligned perpendicular to the coast.
Our analysis was initiated with a complete review of previous published information regarding
the stratigraphy and hydrogeology of the aquifer. An abundant body of previous work exists for
the Yegua-Jackson interval because of its extensive resources of oil, gas, coal, and uranium.
Geologic investigations extend from initial and broad stratigraphic investigations in the
19th century to modern-day detailed subsurface structural, chronostratigraphic,
micropaleontologic, and depositional analyses. The hydrogeologic literature is more limited in
quantity and scope than the stratigraphic literature and includes county water resource studies by
both the United States Geologic Survey and the TWDB.
The structure analysis was comprised of the following activities: collection of available geologic
and geophysical data; chronostratigraphic analysis of the sequence stratigraphic units within the
Yegua-Jackson; lithologic analysis of resulting aquifer layers; and mapping of aquifer layer
structure, net sand distributions, and depositional systems. Data used to support structure
development is comprised of three types: (1) stakeholder data; (2) borehole geophysical logs;
(3) literature data on Yegua-Jackson structure and on Yegua-Jackson lithology and depositional
systems. Contact was attempted with all thirteen Groundwater Conservation Districts in the
Yegua-Jackson Aquifer boundaries in an attempt to collect relevant source data. Our solicitation
for additional data from stakeholders resulted in no electric log data which could directly be used
in the project.

TWDB Report ##: Structure of the Yegua-Jackson Aquifer of the Texas Gulf Coastal Plain
E-iii
A grid of well logs and cross sections established by Dodge and Posey (1981) were used as a
basis to develop a collection of geophysical logs. Where original logs were missing or
inadequate for the study (did not cover the stratigraphic interval) and where wells were needed to
create a more uniform grid, additional well logs were obtained from Bureau of Economic
Geology files. Additionally, geophysical logs from two Yegua-Jackson wells in the TWDB
library were gathered, and about 30 logs were obtained from the files of the Texas Commission
on Environmental Quality Surface Casing Division. A total of 250 geophysical logs were
selected, gathered, and scanned at 300 to 400 dots per inch resolution. Well locations were
confirmed from Tobin basemaps, and latitudes and longitudes were transferred to a geographic
information system database with a resulting accuracy of approximately 1 mile. The
spontaneous potential and resistivity curves from 150 logs were digitized for consistent,
repeatable percent-sand calculations.
For this study, maximum flooding surfaces within fine-grained highstand deposits were
correlated in geophysical well logs arranged in dip-oriented cross sections, connecting low-
resistivity markers in downdip shale sections with shales or abrupt-based sands in updip sandy
and silty intervals. Initial correlations of very low frequency maximum flooding surfaces
defined the chronostratigraphic base of the Yegua and an interval suspected of containing the top
of the Jackson. Early attempts to correlate high-frequency maximum flooding surface-bounded
units within the Yegua and Jackson intervals produced inconsistent results. A strike-oriented
section was created to assist in the recognition of major depositional packages that contain
multiple maximum flooding surface-bounded units. The resulting four major layers were then
correlated in dip sections and loop-tied along parallel strike sections.
The Yegua interval includes at least eight stratigraphically distinct higher frequency genetic units
that have been grouped into two main aquifer layers in this study. The Jackson interval consists
of at least seven genetic intervals that have also been grouped into two aquifer layers for this
study. The project has successfully developed a chronostratigraphic framework for the Yegua-
Jackson Aquifer that spans its entire extent in Texas. The four major layers (third-order genetic
units) include, from the bottom upward, the Lower Yegua, Upper Yegua, Lower Jackson, and
Upper Jackson layers, which each span one to two million years of deposition (third-order
genetic units) and are of appropriate scale for regional groundwater availability modeling
(generally 400 to 800 feet thick, thickening in the downdip direction). As previously mentioned,

TWDB Report ##: Structure of the Yegua-Jackson Aquifer of the Texas Gulf Coastal Plain
E-iv
these four aquifer layers are comprised of 15 or more finer units which are of fourth-order scale,
each spanning a period of 100,000 to 400,000 years.
The chronostratigraphic Lower Yegua Unit is underlain, by definition, by a maximum flooding
surface. This surface outcrops outside of the current Yegua-Jackson Aquifer boundary, and was
thus not suitable as an aquifer layer boundary. To resolve this, we added a lithostratigraphic
surface to serve as the bottom of the lowermost aquifer layer. This surface is referred to as the
Base Yegua-Jackson Aquifer. The Base Yegua-Jackson Aquifer was picked to coincide with the
first significant Yegua sands above the shales of the Cook Mountain Formation. Because the
Base Yegua-Jackson Aquifer surface is lithostratigraphic in nature, it correlates well with the
updip limit of the Yegua-Jackson Aquifer as determined through lithostratigraphic surface
mapping.
A semi-automated approach was used for estimating aquifer lithology, defined as either being
sand or shale. The automated approach was based on a simple set of rules that an analyst might
use in interpreting a well log manually. The set of rules were applied in a consistent manner to
the digitized electric log data for each well and yielded picks of sand or shale every 0.5 feet (the
vertical resolution of the log data). Values were summed over each layer to yield total sand
thickness by layer. In the Lower Yegua Layer, sand deposition occurs nearly equally in the
Houston and Rio Grande embayments, decreasing over the San Marcos Arch. However, in the
Upper Yegua and Lower and Upper Jackson Layers, the Rio Grande embayment appears to
receive more sandy sediment than the Houston embayment.
For the four Yegua-Jackson Aquifer layers, sand thickness trends from this study and other
published studies were incorporated with interpretations of depositional setting based upon log
curve shape and previous work. Within each aquifer layer, the dominant regional depositional
facies distributions were interpreted, then those boundaries were hand-drawn, then digitized, for
incorporation as a geographic information system layer. In many cases, sand thickness values
were used as proxies for determining position within a larger depositional system. The resulting
facies-based regions of a layer will be of help in the conceptualization and implantation of
hydraulic properties into future groundwater availability models of the aquifer.
The work documented in this report will provide basic data required to develop a Groundwater
Availability Model capable of supporting the management of groundwater resources in the

TWDB Report ##: Structure of the Yegua-Jackson Aquifer of the Texas Gulf Coastal Plain
E-v
Yegua-Jackson Aquifer. The chronostratigraphic approach used in this study is more reliable
than previous lithostratigraphic approaches at identifying and correctly connecting aquifer layers
and intervening aquitards. The result is a more reliable three-dimensional description of the
aquifer that, if implemented in a numerical groundwater model, should provide a more accurate
description of aquifer dynamics. This is important because several regions have developed water
management strategies in the 2007 State Water plan that include the drilling of new wells and
water desalinization in the Yegua-Jackson Aquifer. With the implementation of those proposed
water management strategies, production from the aquifer is expected to exceed 15,000 acre-feet
per year by 2040.

TWDB Report ##: Structure of the Yegua-Jackson Aquifer of the Texas Gulf Coastal Plain
E-vi
This page is intentionally blank.

TWDB Report ##: Structure of the Yegua-Jackson Aquifer of the Texas Gulf Coastal Plain
1-1
1. Introduction
The Texas Water Development Board (TWDB) designated the Eocene-age Yegua-Jackson
interval as a minor aquifer in the 2002 (TWDB, 2002) water plan. This increase in status from
“other aquifer” was a consequence of the recognition of the large number of wells in the TWDB
database completed in the Yegua-Jackson and the relatively large use of water from this interval
(Preston, 2006). In the 2007 State Water Plan (TWDB, 2007), it is reported that the existing
groundwater and supplies in the aquifer is 7,285 acre-feet per year (assuming existing wells and
infrastructure) with a total availability estimated at 25,000 acre-feet per year. Several regions
have developed water management strategies in the 2007 State Water plan which include the
drilling of new wells and desalinization. With the implementation of the proposed water
management strategies, production from the aquifer is expected to exceed 15,000 acre-feet per
year by 2040.
Because the Yegua-Jackson has been designated a minor aquifer and because it has significant
water use and projected use, the TWDB will seek to develop a groundwater availability model of
the aquifer. From a hydrogeologic perspective, there has been very little work done in the
Yegua-Jackson Aquifer, especially at a scale larger than an individual county (Preston, 2006).
As a result, the TWDB sponsored this study to develop the Yegua-Jackson Aquifer structure for
the complete Texas section. The Yegua-Jackson Aquifer exists predominantly in the outcrop or
near-outcrop areas of the Yegua Formation and Jackson Group. In Texas, this outcrop area
stretches in a relatively thin band approximately parallel to the coastline, from Starr County in
the Rio Grande Valley to Sabine County in East Texas, and is thus bracketed by the Rio Grande
River to the south, and the Toledo Bend Reservoir (along the Sabine River) to the east. The
width of this outcrop varies from less than 10 miles in Gonzales County to near 40 miles in La
Salle County, with an area of approximately 11,000 square miles (Preston, 2006).
The study began with a review of the abundant body of previous work existing for the Yegua-
Jackson interval. The literature review was followed by a gathering of geophysical well logs,
chronostratigraphic analysis, digital lithologic analysis, and mapping of structure, sand
distribution, and depositional systems. The analysis incorporates stratigraphic interpretations
from 250 well logs within the outcrop and along the downdip boundaries of the aquifer. This log
data has been used to subdivide the Yegua and Jackson intervals into four major genetic units on

TWDB Report ##: Structure of the Yegua-Jackson Aquifer of the Texas Gulf Coastal Plain
1-2
the basis of maximum flooding surfaces, which are presumed to be time-synchronous. These
four genetic units correspond to four layers into which the Yegua-Jackson Aquifer was
subdivided, with one exception. The maximum flooding surface at the base of the lower Yegua
genetic unit occurs within the underlying shale-dominated Cook Mountain Formation and
outcrops outside of the Yegua-Jackson Aquifer boundary. In this case, a lithostratigraphic
surface, referred to as the Base Yegua-Jackson Aquifer, was created and used to bound the
lowest aquifer layer.
The spontaneous potential and resistivity curves from 150 logs were digitized for consistent,
repeatable percent-sand calculations. The accumulated new structural and lithologic data were
then incorporated with trends from previous studies to produce updated maps spanning the
aquifer trend from Mexico to Louisiana.
The Yegua interval includes at least eight stratigraphically distinct units that have been grouped
into two main layers in this study. The Jackson interval consists of at least seven genetic
intervals that have also been grouped into two layers for this study. The four layers of the
combined Yegua-Jackson interval are each third-order units whose deposition spans one to two
million years. The 15 or more finer units which comprise these four layers are of fourth-order
scale, each spanning a period of 100,000 to 400,000 years. In the Lower Yegua Layer, sand
deposition occurs nearly equally in the Houston and Rio Grande embayments, decreasing over
the San Marcos Arch. However, in the Upper Yegua and Lower and Upper Jackson Layers, the
Rio Grande embayment appears to receive more sandy sediment than the Houston embayment.
The Yegua-Jackson section was described through the development of 30 dip sections and
3 strike sections. Initial correlations defined the base of the Yegua and an interval suspected of
containing the top of the Jackson. Early attempts to correlate finer-scale maximum flooding
surface-bounded units within the Yegua and Jackson intervals produced inconsistent results. A
strike-oriented section was created to assist in the recognition of major depositional packages
that contain multiple maximum flooding surface-bounded units. Major layers were then
correlated in dip sections and loop-tied along parallel strike sections.
Cumulative sand thickness in aquifer studies has been determined in the past using many
different approaches, yielding results that are sometimes difficult for subsequent workers to
reproduce. To overcome this issue, 150 well logs were selected, and spontaneous potential and

TWDB Report ##: Structure of the Yegua-Jackson Aquifer of the Texas Gulf Coastal Plain
1-3
resistivity curves digitized. Baseline values for shale and/or sand were established and a cutoff
value was used that produced results similar to geologist estimates. Because the study interval
included freshwater, transitional, and saline water-saturated sediments, different algorithms and
cutoffs were used for each interval. In freshwater zones, the resistivity curve was used to
delineate lithology. In saline zones, spontaneous potential was used. In transitional zones, either
curve or a combination of curves was used, depending on mud resistivity and resulting
spontaneous potential behavior.
The project has successfully developed a chronostratigraphic framework for the Yegua-Jackson
Aquifer that spans its entire extent in Texas. The four major layers (third-order genetic units)
include, from the bottom upward, the Lower Yegua, Upper Yegua, Lower Jackson, and Upper
Jackson. These layers are of appropriate scale for regional groundwater availability modeling
(generally 400 to 800 feet thick, thickening in the downdip direction). Sand content in these
layers is typically greatest in the Houston and Rio Grande embayments of southeast Texas and
South Texas, respectively.

TWDB Report ##: Structure of the Yegua-Jackson Aquifer of the Texas Gulf Coastal Plain
1-4
This page is intentionally blank.
TWDB Report ##: Structure of the Yegua-Jackson Aquifer of the Texas Gulf Coastal Plain
2-1
2. Study Area and Geologic Setting
This section of the report will describe the general study area in terms of location, physiography
and climate and will also describe the geologic setting for the Yegua-Jackson Aquifer of Texas.
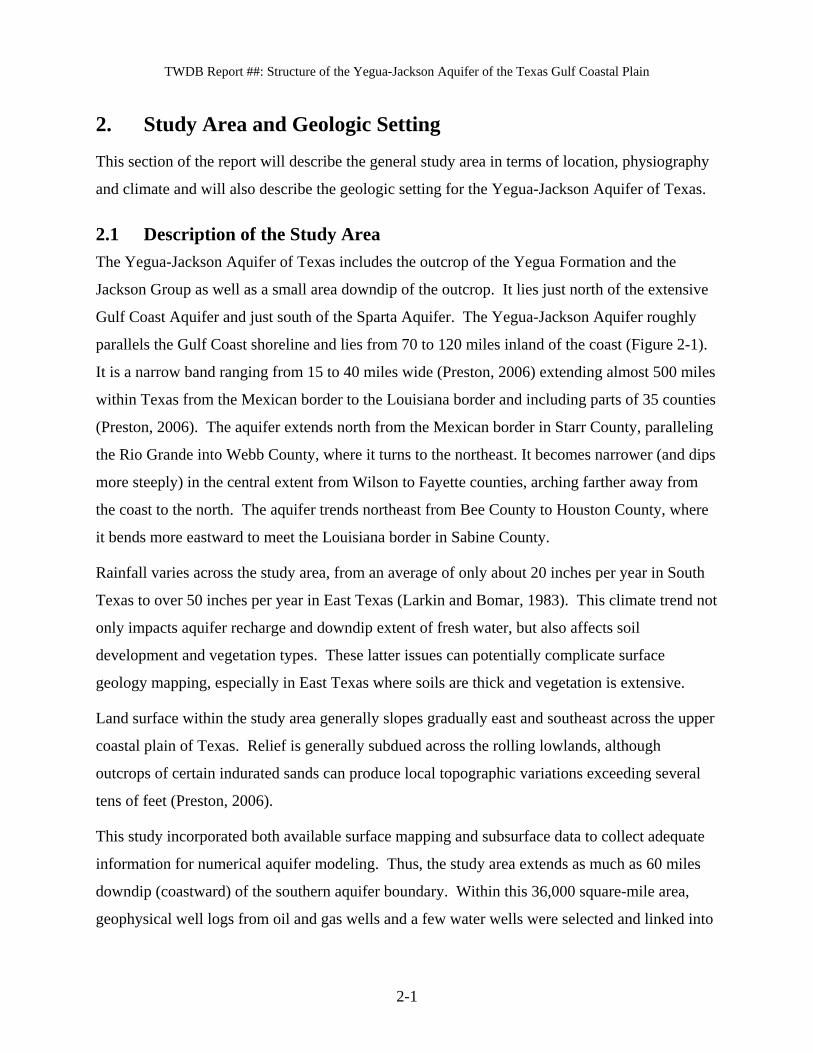
2.1 Description of the Study Area The Yegua-Jackson Aquifer of Texas includes the outcrop of the Yegua Formation and the
Jackson Group as well as a small area downdip of the outcrop. It lies just north of the extensive
Gulf Coast Aquifer and just south of the Sparta Aquifer. The Yegua-Jackson Aquifer roughly
parallels the Gulf Coast shoreline and lies from 70 to 120 miles inland of the coast (Figure 2-1).
It is a narrow band ranging from 15 to 40 miles wide (Preston, 2006) extending almost 500 miles
within Texas from the Mexican border to the Louisiana border and including parts of 35 counties
(Preston, 2006). The aquifer extends north from the Mexican border in Starr County, paralleling
the Rio Grande into Webb County, where it turns to the northeast. It becomes narrower (and dips
more steeply) in the central extent from Wilson to Fayette counties, arching farther away from
the coast to the north. The aquifer trends northeast from Bee County to Houston County, where
it bends more eastward to meet the Louisiana border in Sabine County.
Rainfall varies across the study area, from an average of only about 20 inches per year in South
Texas to over 50 inches per year in East Texas (Larkin and Bomar, 1983). This climate trend not
only impacts aquifer recharge and downdip extent of fresh water, but also affects soil
development and vegetation types. These latter issues can potentially complicate surface
geology mapping, especially in East Texas where soils are thick and vegetation is extensive.
Land surface within the study area generally slopes gradually east and southeast across the upper
coastal plain of Texas. Relief is generally subdued across the rolling lowlands, although
outcrops of certain indurated sands can produce local topographic variations exceeding several
tens of feet (Preston, 2006).
This study incorporated both available surface mapping and subsurface data to collect adequate
information for numerical aquifer modeling. Thus, the study area extends as much as 60 miles
downdip (coastward) of the southern aquifer boundary. Within this 36,000 square-mile area,
geophysical well logs from oil and gas wells and a few water wells were selected and linked into

TWDB Report ##: Structure of the Yegua-Jackson Aquifer of the Texas Gulf Coastal Plain
2-2
a system of dip- and strike-oriented cross sections to evaluate the three-dimensional structure,
stratigraphy, and lithology of the aquifer (Fig. 2-2, Plate 1).
2.2 Geologic Setting The alternating sand- and clay-rich Yegua-Jackson interval includes the Middle Eocene Upper
Claiborne Group (Yegua and Cook Mountain formations) and the overlying Upper Eocene to
Oligocene Jackson Group (Caddell, Wellborn, Manning, and Whitsett formations), as shown in
Figure 2-3. These units dip toward the modern coastline and are part of the progressive filling of
the Gulf of Mexico basin by sand, silt, and clay carried from the mountains of northern Mexico
and the Rocky Mountains, as well as from other areas of Texas and the western part of the North
American continental interior. These sediments, deposited in rivers and deltas, and even farther
offshore, create a gradual down-warping (subsidence) of the Earth’s crust along the edges of the
basin. Thus, sediments of the Yegua-Jackson interval dip more steeply toward the gulf than the
current land surface. Additionally, because sediment deposition has outpaced the slow
subsidence, the current shoreline has built farther toward the center of the Gulf of Mexico than
the shoreline that existed during Yegua-Jackson deposition.
Yegua-Jackson deposition was focused in the Houston and Rio Grande Embayments
(Figure 2-1), where downwarping of the crust by tectonic forces was greatest. The northwest-
southeast trending San Marcos Arch (Figure 2-1) represents a long-standing tectonically uplifted
area in Central Texas and acts to separate the Houston and Rio Grande Embayments. To the
west and south of the Yegua-Jackson outcrop lay the Del Rio and Picachos foldbelts
(Figure 2.1), which are associated with tectonic compression in northeastern Mexico, possibly
before, during, and after Yegua-Jackson deposition. During the early phases of the development
of the Gulf of Mexico Basin, salt was deposited in layers because the basin was small and did not
have good circulation with the open ocean. As a result, evaporation exceeded water influx over
many millions of years. Salt was generally deposited south and east of the Balcones escarpment
trend, and areas of especially thick salt accumulation occurred in the Rio Grande and Houston
Embayments (Figure 2-1). Basinward sliding of this salt layer may have had localized affects on
Yegua-Jackson deposition and post-deposition structure. A less obvious tectonic feature which
might slightly impact Yegua-Jackson structure is a series of northwest-trending transfer faults
that are known from offshore Texas that were initiated during the opening of the Gulf of Mexico

TWDB Report ##: Structure of the Yegua-Jackson Aquifer of the Texas Gulf Coastal Plain
2-3
(Figure 2-1). These transfer faults appear to have influenced salt tectonics in the Gulf of Mexico
(Huh and others, 1996) and may have had minor lateral movement throughout the Tertiary.
Transfer faults may also bound areas of differential salt movement under the study area.
The Yegua-Jackson interval is overlain in outcrop by an interval variously mapped as Catahoula
Formation and Frio Formation (Plate 2; Barnes 1968a, 1968b, 1974a, 1974b, 1974c, 1975,
1976a, 1976b, 1976c, and 1992). This interval varies laterally from clay-rich to locally sand-rich
and, in South Texas, contains tuff and volcaniclastic conglomerates. Over much of the aquifer
area and in the subsurface, this interval overlying the Yegua-Jackson interval includes the
Oligocene-age Vicksburg and overlying Frio Formations, which reflect later pulses of sandy
sediment influx into the Gulf of Mexico basin. In East Texas, Anders (1967) states that it is not
possible to separate the overlying Vicksburg sediments from Jackson sediments. Thus, in
eastern counties the Vicksburg has probably been mapped by Barnes (1968a, 1968b, 1992) as
part of the Jackson Group.
Below the Yegua-Jackson interval in outcrop is a generally shaly interval mapped as the Cook
Mountain Formation of the upper Claiborne Group or, in South Texas, as the Laredo Formation
(Plate 2; Barnes, 1968a, 1968b, 1974a, 1974b, 1974c, 1975, 1976a, 1976b, 1976c, 1992). In the
subsurface, the study interval is underlain by shale-rich Cook Mountain Formation and, beneath
that, the sand-rich Sparta Formation of the Lower Claiborne Group. The Cook Mountain
Formation thins in the updip direction, almost pinching out before reaching outcrop in some
locations. The Cook Mountain Formation separates the Sparta Aquifer below from the Yegua-
Jackson Aquifer above.
Thickness of the total Yegua-Jackson interval ranges from less than 1,800 feet over the San
Marcos Arch in Central Texas to more than 3,000 feet in the Houston and Rio Grande
depositional basins of East and South Texas, respectively. Structural dips vary from about 20 to
360 feet/mile (Preston, 2006), with the greater dips occurring in the downdip regions and across
the San Marcos Arch. The interval is comprised of interbedded sands, silts, and clays deposited
in settings ranging from fluvial to marginal marine (deltaic and barrier/strandplain) to shallow
marine shelf (Galloway and others, 1979). Deltas in the Rio Grande Embayment of South Texas
are considered by many workers to have greater wave influence and, consequently, a greater
tendency toward shore-parallel alignment and internal fabric. In contrast, deltas from the middle

TWDB Report ##: Structure of the Yegua-Jackson Aquifer of the Texas Gulf Coastal Plain
2-4
of the Texas coast northeastward have greater fluvial influence and, thus, large sand bodies are
more often aligned perpendicular to the coast.
The generalized chronostratigraphy and lithostratigraphy for the Yegua-Jackson interval are
shown in Figure 2-4 in relation to underlying and overlying units. Figure 2-4 also shows the
tectonic, oceanographic/climatic, and eustatic changes occurring during interval deposition. The
Yegua Formation was deposited during a strong influx of sediment, primarily in the Houston
Embayment. The Jackson Group was deposited in a much smaller sediment influx, and was
deposited primarily on the shelf built by Yegua deposits. The Vicksburg Formation, above the
Jackson Group, was deposited during a phase of sediment influx predominantly in the Rio
Grande Basin. Throughout this time, rhyolitic volcanism was active in the Big Bend area of
Texas and Mexico, contributing ash, bentonite, and tuff to the Yegua and Jackson interval.
Ages and paleontologic markers for the Yegua-Jackson interval are shown in Figure 2-5. Age
dating by Harland and others (1990) indicates that major Yegua sand deposition began
approximately 40 million years ago and is marked in the sedimentary record by the extinction of
the benthic foraminifera Ceratobulimina eximia (Fang, 2000). A shaly interval below this,
which marks the maximum high sea level between the Yegua depositional cycle and underlying
Sparta depositional cycle, is indicated updip by the extinction of Clavulinoides guaybalensis, and
downdip by the extinction of the planktonic foraminifera Globorotalia spinulosa and
Truncorotaloides topilensis (Fang, 2000). The extinction of Operculinoides sabinensis occurs
within the Cook Mountain Formation but may lie above the maximum flooding event. Benthic
foraminifera Anomalina umbonata and Nodosaria mexicana occur in the lower part of the
Yegua, and the extinction of Eponides yeguaensis occurs near the middle of the Yegua at an age
of 38.6 million years (age from Harland and others, 1990). Discorbis yeguaensis occurs in the
upper part of the Yegua and Nonionella cockfieldensis roughly corresponds to the top of the
Yegua at an age of 38 million years (age from Harland and others, 1990).
The benthic foraminifera Camerina moodysbranchensis extinction occurs near the base of the
Jackson Group. According to Galloway and others (1991), Textularia dibollensis is the
diagnostic species of the Caddell Formation, while Textularia hockleyensis occurs in the upper
part of the Jackson Group. The Whitsett Formation contains the extinction of Massalina pratti
and, in deeper-water settings, the extinction of Marginulina cocoaensis. These are generally

TWDB Report ##: Structure of the Yegua-Jackson Aquifer of the Texas Gulf Coastal Plain
2-5
considered to mark the top of the Jackson Group, and correspond with an age of approximately
36 million years (Galloway and others, 1991). The extinction point of Textularia warreni occurs
within, and near the top of, the Vicksburg Formation. The age of the top of the Vicksburg
Formation is approximately 33 million years (Galloway and others, 1991). Other markers for the
Vicksburg include Loxostoma delicata and the planktonic foraminifera Globigerina
ampliapertura.
2.2.1 Lithology of Geologic Units Although the lithology of geologic units comprising the Yegua-Jackson Aquifer can be
generalized as interbedded sand, silt, and clay, a slightly more detailed description is provided to
clarify outcrop-to-subsurface relationships as well as to highlight minor mineralogic constituents
that might impact hydrologic properties. Outcrop descriptions of geologic units are inherently
different from subsurface descriptions. Weathering of geologic units at outcrop creates
differential erosion, leaving sands and more cemented lithologies standing in relief as low hills
above the more easily eroded clays that commonly form lowlands and river valleys. This
concept is especially applicable in areas of low rainfall, but can be negated in wetter areas such
as East Texas, where sands and muds are equally eroded and dissected (Jackson and Garner,
1982). Weathering also oxidizes the sediments, creating distinctive colors, textures, and
features. Conversely, subsurface observation is limited to well borings, lithologic logs, and
geophysical logs of resistivity and natural gamma-ray values. This information may be less
indicative of trace mineralogic content but is more sensitive to slight changes in lithology that
reflect changes in depositional setting. Some of these changes are indicative of regional or
subregional time-stratigraphic, or chronostratigraphic, relationships and can be widely correlated
in the subsurface using well log data. In other words, subsurface data may more accurately relate
laterally equivalent sediments deposited during a specific time interval, regardless of their gross
lithology. In this way, sands that are hydrologically linked can be grouped together to constitute
a ‘flow layer’ within the aquifer. The following lithologic descriptions of geologic units of
interest were synthesized from the Geologic Atlas of Texas, published by the Bureau of
Economic Geology (BEG) (Barnes, 1968a, 1968b, 1974a, 1974b, 1974c, 1975, 1976a, 1976b,
and 1976c) and from county resource reports by the USGS and TWDB (in order from eastern
counties to southern counties: Anders, 1967; Guyton and Associates, 1970; Tarver, 1966; Baker

TWDB Report ##: Structure of the Yegua-Jackson Aquifer of the Texas Gulf Coastal Plain
2-6
and Others, 1974; Follett, 1974; Thompson, 1966; Rogers, 1967; Anders, 1957; Anders and
Baker, 1961; and Harris, 1965).
2.2.1.1 Upper Claiborne Group Sediments of the Upper Claiborne Group (Figure 2-3) include the Cook Mountain and Yegua
Formations. The Cook Mountain Formation is a shale-dominated interval between the often
sand-dominated Sparta and Yegua Formations. Outcrop descriptions of the Cook Mountain
Formation indicate a black, chocolate brown, gray-green or gray fossiliferous shale that weathers
to a brownish gray, yellowish brown, and rarely, yellow and bright orange-red. The Cook
Mountain also contains minor marl, lignite, and sandstone beds. Calcareous cement, glauconite,
carbonaceous debris including large wood fragments, gypsum/selenite, bentonite, and
ferruginous and calcareous concretions are widely reported. In parts of East Texas the Cook
Mountain contains the Spiller Sand (see Tarver, 1966; Follet, 1974; and Thompson, 1966),
which is a fine- to medium-grain-sized lignitic crossbedded argillaceous sandstone up to 100 feet
thick containing interbeds of chocolate-brown clay. In South Texas, time-equivalent sediments
are mapped as the Laredo Formation (Barnes, 1976b and 1976c). Sandstone is abundant in the
Laredo, with thick, glauconitic, micaceous, ferruginous, crossbedded very-fine- to fine-grained
sandstone beds predominating. Interbedded brown shales contain marine megafossils and
limestone concretions. The Laredo weathers brown to orange-yellow to red. Thickness at
outcrop varies widely from less than 300 feet 600 feet (Barnes, 1968a, 1968b, 1974a, 1974b,
1974c, 1975, 1976a, 1976b, and 1976c).
The Yegua Formation, as described in BEG and TWDB references cited above, is a gray to
brown sandstone and dark brown to gray shale with minor interbedded lignites. The sandstones
are fine- to medium-grained and variously contain bentonite, carbonaceous debris, fossil wood,
glauconite, gypsum/selenite, and calcareous cement. Sandstone beds may form low hills which,
in some areas, are discontinuous (Anders, 1967; Follet, 1974; and Thompson, 1966), and in some
areas can be traced for many miles (Anders, 1967). Although sandstones weather yellowish
brown in East Texas (Barnes, 1968a, 1968b), descriptions in South Texas indicate weathering
colors of reddish brown, yellow-orange, and light red to tan (Anders, 1957; Barnes, 1976b
and 1976c). Shales are often bentonitic, glauconitic, or gypsiferous and variably calcareous. In
outcrop, the base of the Yegua Formation is identified as the first significant sand above the
Cook Mountain Formation (Tarver, 1966) or as the stratigraphically lowest location where

TWDB Report ##: Structure of the Yegua-Jackson Aquifer of the Texas Gulf Coastal Plain
2-7
sandstone predominates over shale (Thompson, 1966). The Yegua varies from 400 feet to over
1,000 feet in thickness at the outcrop, being thinnest in East Texas (Barnes, 1968a, 1968b,
1974a, 1974b, 1974c, 1975, 1976a, 1976b, and 1976c).
2.2.1.2 Jackson Group Sediments of the Jackson Group include, from oldest to youngest, the Caddell, Wellborn,
Manning, and Whitsett Formations (Figure 2-3). These units are mapped separately in East and
Central Texas but grouped as one unit in South Texas (Barnes, 1968a. 1968b, 1974a, 1974b,
1974c, 1975, 1976a, 1976b, 1976c, and 1992). Additionally, formation names vary locally and
some units are further divided. In East Texas, the Caddell Formation laterally transitions
eastward to the Moody’s Branch Formation, the eastward equivalent of a combined Wellborn
and Manning Formations is the Yazoo Formation, and the Whitsett transitions to the Nash Creek
Formation to the east (Barnes, 1968b). In southern Central Texas, from southern Wilson County
to central Duval County (Barnes 1974c, 1975, and 1976a), the Whitsett Formation is divided into
an upper unit, containing the Dubose Member above and the Deweesville Sandstone Member
below, and a lower unit containing the Conquista Clay Member above and the Dilworth
Sandstone Member below.
In general terms, the Jackson Group is described as a variously sand- or clay-dominated
succession, with sand content being greatest in South Texas. It contains some lignites, marine
fossils, glauconite, and marl beds. It is often bentonitic, with ash and tuff content appearing to
increase from East Texas to South Texas. The Jackson Group is light colored when
unweathered, but weathers to a dark gray, with tuffaceous sandstones forming low rugged hills.
In Grimes County, Baker and others (1974) describe the weathered Jackson sands as tan to red,
with white limy streaks. Interbedded shales are chocolate brown, and ridges of sandstone extend
laterally for several miles. Anders and Baker (1961) state that the top of the Jackson is the top of
the first persistent sand above the Textularia hockleyensis foraminifera extinction. Total Jackson
thickness varies from a low of 310 feet in East Texas to a maximum of 875 feet in south Central
Texas, thinning again to 360 feet in South Texas (Barnes, 1968a, 1968b, 1974a, 1974b, 1974c,
1975, 1976a, 1976b, and 1976c).
Where individual formations within the Jackson Group are described, the Caddell Formation is a
clay or siltstone with sandstone (Barnes, 1968a, 1968b, 1974a, 1974b, and 1974c). The clay is
TWDB Report ##: Structure of the Yegua-Jackson Aquifer of the Texas Gulf Coastal Plain
2-8
lignitic, bentonitic, glauconitic, locally fossiliferous, and generally brown to olive green,
weathering to a dark gray. Sandstones are fine- to medium-grained, lignitic, calcareous,
glauconitic, rarely fossiliferous, and generally light gray to yellow-brown. The laterally
equivalent Moody’s Branch of East Texas is a glauconitic marl, with abundant marine fossils,
that is olive gray in color and weathers to a light olive gray. The Caddell Formation is generally
less than 50 to more than 150 feet thick.
The Wellborn Formation is a very fine- to coarse-grained sandstone and minor clay, with sand
grain size being greatest in South Texas. It is lignitic, containing fossil leaf and wood pieces, can
be glauconitic, and contains marine megafossils. It can be massive to crossbedded and variably
bentonitic or tuffaceous, locally being silica-cemented and forming resistive ridges. In color it is
light gray to light brown, weathering to a dark gray. The Wellborn Formation is generally
150 feet thick, but thins to less than 50 feet in East Texas.
The Manning Formation is generally described as a chocolate brown lignitic clay with lesser
sandstone, bentonite, and tuff. However, in East Texas, sandstone predominates (Barnes, 1968a,
1968b). Clays are bentonitic to lignitic, with some thin beds of marine megafossils. Sandstones
are laminated to massive to crossbedded, lignitic, and bentonitic to tuffaceous. Sandstones are
light yellow-gray, forming resistant ridges. Fossil wood is common throughout the Manning
Formation. In East Texas, the Yazoo Formation is laterally equivalent to both the Wellborn and
Manning and is a sandy clay with interbeds of silt and glauconitic sand containing marine
megafossils. It is light brownish gray. The Manning Formation is 250 to 350 feet thick, but
thins to about 200 feet in East Texas.
The Whitsett Formation is generally described as a fine- to medium-grained sandstone that is
tuffaceous, lignitic, argillaceous and locally silica-cemented. It can be massive or crossbedded,
contains abundant fossil wood, and is light to dark gray, weathering to dark gray. The lateral
equivalent of the Whitsett Formation in East Texas, the Nash Creek Formation, is a bentonitic
brownish to pale greenish gray clay with interbeds of fine-grained light gray sand. Clays in the
Nash Creek Formation weather to a light gray and sands weather to a medium gray (Barnes,
1968a, 1968b). In south Central Texas, the Whitsett Formation is divided into four members
(Barnes 1974a, 1974b, 1974c, and 1975). From oldest to youngest, these are the Dilworth
Sandstone Member, Conguista Clay Member, Deweesville Sandstone Member, and the Dubose

TWDB Report ##: Structure of the Yegua-Jackson Aquifer of the Texas Gulf Coastal Plain
2-9
Clay Member. Sandstone members are generally fine- to medium-grained light gray to yellow-
brown sandstone that can be massive to crossbedded, tuffaceous, and heavily bored by
Ophiomorpha. Interbedded clays and clay members are chocolate brown to yellowish brown,
lignitic, bentonitic, and locally contain marine megafossils. The Whitsett Formation and
included members are approximately 200 feet thick in south Central Texas but thin eastward,
becoming 60 feet or less thick in far East Texas.
In East Texas, the Oligocene-age Vicksburg Formation overlies the Jackson Group and both are
mapped as a single unit (Anders, 1967). The Vicksburg Formation includes a lower unit of fine-
to medium-grained sandstone and interbedded silt and clay and an upper unit of clay with
interbedded silt and sand. This unit as likely mapped in East Texas as part of the Whitsett
Formation. Vicksburg thickness is unknown because it cannot be distinguished from the
Whitsett Formation.
TWDB Report ##: Structure of the Yegua-Jackson Aquifer of the Texas Gulf Coastal Plain
2-10
WebbDuval
Hill
Harris
Bell
Frio
Kerr
Polk
Starr
Uvalde
Bee
Leon
Bexar
Hidalgo
Edwards
Zavala
Tyler
Dimmit
Kenedy
Kimble
La Salle
Medina
Llano
Liberty
Milam
Brazoria
Travis Lee
Mills
Falls
Burnet
Real
Brown
Coryell
Zapata
Kinney
Houston
Coleman
Jasper
Mason
Maverick
Hardin
Brooks
DeWitt
Lavaca
Atascosa
Goliad
Hays
Bosque
Wharton
Runnels
Fayette
Concho
Newton
Gillespie
Navarro
Shelby
Live Oak
Jim Hogg
McMullen
Wilson
Sutton
Victoria
Trinity
Menard
Kleberg
San Saba
Walker
Bastrop
Gonzales
Anderson
Grimes
Erath
Nueces
Matagorda
Cherokee
Jefferson
Colorado
Karnes
Rusk
Jackson
Austin
Refugio
Williamson
Coke
McCulloch
Blanco
McLennan
Cameron
AngelinaTom Green
Bandera
Hamilton
Jim Wells
Limestone
Fort Bend
ComalKendall
Freestone
Montgomery
Comanche
Brazos
Robertson
Sabine
Willacy
Waller
Vernon Parish
Burleson
Nacogdoches
Schleicher
Lampasas
Calhoun
Guadalupe
Caldwell
Taylor
Calcasieu Parish
Cameron Parish
San Patricio
Madison
San Jacinto
Washington
Nolan Panola
Orange
Callahan Ellis HendersonEastland
Sabine Parish
Beauregard Parish
Chambers
Natchitoches Pari
San Augustine
De Soto Parish
Aransas
Galveston
SmithSomervell Red River ParishJohnson
Allen Pa
Winn P
Jefferson Dav
Grant P
Hood
Rapides
Yegua-Jackson outcropState LineCounty Boundaries0 4020
Miles
Del Rio
Foldbelt
Picachos
Arch
SabineTransfer Fault
Galveston Transfer Fault
Brazos Transfer FaultMatagorda Transfer Fault
San M
arcos
Arch
Rio
Gran
deEm
baym
ent
Houston Embayment
Mayor
Sedim
ent
Sources
Areas o
f
Significan
t
Salt D
eposit
ion
Lim
it of
Salt
Dep
ositi
on
Figure 2-1. Yegua-Jackson structure development study area, and major structural elements along the Texas Gulf Coast. Areas of significant salt deposition taken from Galloway and others (1983). Transfer Faults from Huh and others (1996). Other features from Ewing (1991).

TWDB Report ##: Structure of the Yegua-Jackson Aquifer of the Texas Gulf Coastal Plain
2-11
LegendYegua-Jackson outcropState LineCounty BoundariesWell LocationsCross-Sections (DIP)Cross-Sections (STRIKES A and B)Cross Section (STRIKE C)
0 40 8020Miles
124
3
5
6
7
89
10
1112
13
14
1516
17
18
19
20
21
22
23
24
25
2627
28
29
30A B C
B'
A', C'
Figure 2-2. Stratigraphic correlation basemap with cross section lines.

TWDB Report ##: Structure of the Yegua-Jackson Aquifer of the Texas Gulf Coastal Plain
2-12
Series Group Formation Oligocene Catahoula Eocene-
Oligocine Whitsett
Manning Wellborn Upper
Jackson
Caddell
Yegua
Tertiary
Eocene
Middle Upper Claiborne
Cook Mountain
Figure 2-3. Generalized stratigraphic column for the Yegua-Jackson Aquifer (after Preston, 2006).

TWDB Report ##: Structure of the Yegua-Jackson Aquifer of the Texas Gulf Coastal Plain
2-13
Figure 2-4. Chronostratigraphy, lithostratigraphy, depositional episodes and depocenters, tectonic events, oceanographic and climatic events, and global sea level for the Oligocene and part of the Eocene for the Gulf Coast.
Note: The Eocene-age Yegua and Jackson intervals represent pulses of sediment input after Sparta deposition and before Vicksburg deposition. Modified from Galloway (1989b). Original references for tectonic and oceanographic/climatic events and eustasy include Chapin (1979), McDowell and Clabaugh (1979), Davis (1980), Chapin and Cather (1981), Dickinson (1981), Loutit and Kennett (1981), Gries (1983), Witschko and Dorr (1983), Price and Henry (1984), Eaton (1986), and Haq and others (1987).

TWDB Report ##: Structure of the Yegua-Jackson Aquifer of the Texas Gulf Coastal Plain
2-14
Peri
od
Epo
ch
Stratigraphic Units
Age
(in
106 y
ears
)
Paleontologic Markers
Olig
ocen
e
Low
er
Vicksburg Formation
Textularia warreni Globigerina ampliapertura Loxostoma delicata
Upp
er
Jack
son
Gro
up
Whitsett Formation Manning Formation Wellborn Formation Caddell Formation
Yegua Formation
Eoce
ne
Mid
dle
Cook Mountain Formation
Marginulina cocoaensis, Massalina pratti Textularia hockleyensis Textularia dibollensis Camerina moodysbranchensis Nonionella cockfieldensis Discorbis yeguaensis Eponides yeguaensis Anomalina umbonata, Nodosaria Mexicana Ceratobulimina eximia Operculinoides sabinensis Clavulinoides guaybalensis, Globorotalia spinulosa, Truncorotaloides topilensis
Figure 2-5. Paleontologic markers and approximate ages for the Yegua-Jackson interval and adjacent formations. Markers and ages from Fang (2000), Harland and others (1990), and Galloway and others (1991).
40.0
38.0
38.6
36.0
33.0
TWDB Report ##: Structure of the Yegua-Jackson Aquifer of the Texas Gulf Coastal Plain
3-1
3. Previous Work
An abundant body of previous work exists for the Yegua-Jackson interval because of its
extensive resources of oil, gas, coal, and uranium. Geologic investigations extend from initial
and broad stratigraphic investigations in the 19th century to modern-day detailed subsurface
structural, chronostratigraphic, micropaleontologic, and depositional analyses. Hydrogeologic
work has been more recent, and includes county water resource studies by both the United States
Geologic Survey and the TWDB, as well as compilations of hydrologic parameters.
3.1 Geology Early outcrop stratigraphy was established by Renick (1926, 1936) and by Sellards and others
(1932). The economic importance of oil, gas, coal, and finally uranium resources spurred
investigations from the early 1960’s through about 1990 (for example, Fisher, 1963; Fisher and
others, 1970; Eargle, 1972; Quick and others, 1977; Galloway and others, 1979; Kaiser and
others, 1980; Jackson and Garner, 1982; Ewing, 1986; and Galloway and others, 1991). This
work established, on the basis of outcrop and subsurface detailed investigations, the general
structure, stratigraphy, depositional systems, and lithologic distribution of the Yegua-Jackson
interval.
Also during this period, the United States Geological Survey and the TWDB carried out joint
studies of the water resources of the Yegua-Jackson in many counties, especially those in
Southeast Texas part of the aquifer (for example, Winslow, 1950; Dale, 1952; Anders and Baker,
1961; Thompson, 1966; Rogers, 1967; Wesselman, 1967; Tarver, 1968; Guyton and Associates,
1970; and Baker and others, 1974). These subsurface studies added knowledge regarding
localized geology, as well as the distribution of fresh and slightly saline water in the aquifer and
aquifer geochemistry.
Yegua-Jackson outcrop distribution was identified and compiled by the Bureau of Economic
Geology, The University of Texas, at a 1:250,000 scale during the 1970’s, 1980’s, and 1990’s
under the direction of Virgil Barnes (Barnes, 1968a, 1968b, 1974a, 1974b, 1974c, 1975,
1976a,1976b, 1976c, and 1992). The Yegua and Cook Mountain/Laredo formations were
mapped across the state. Over a large area of outcrop belt, the main formations of the Jackson

TWDB Report ##: Structure of the Yegua-Jackson Aquifer of the Texas Gulf Coastal Plain
3-2
Group (Caddell, Wellborn, Manning, and Whitsett) were mapped individually, including some
local unit names such as the Yazoo shale and the Nash Draw sand.
Studies from the early 1990’s to present have been prompted by the discovery of the downdip
Yegua oil and gas trend and have employed the technologies of sequence stratigraphy, three
dimensional seismic, and organic geochemistry (for example, Sneider, 1992; Goings and
Smosna, 1994; Ewing, 1994; Yuliantoro, 1995; Meckel and Galloway, 1996; Swenson, 1997;
Ewing and Vincent, 1997; Thomas, 1999; Routh and others, 1999; Galloway and others, 2000;
and Fang, 2000). This work has produced a refined chronostratigraphic understanding of the
Yegua-Jackson interval that stands in some contrast to the lithostratigraphic-dominated
understanding evident in outcrop mapping and in studies from the 1960’s, 1970’s, and 1980’s.
3.2 Hydrogeology From a hydrogeologic perspective, there has been very little work done in the Yegua-Jackson
Aquifer, especially studies at a scale larger than an individual county (Preston, 2006). However,
there are over 1,600 wells completed in the aquifer as defined by aquifer code in the TWDB and
United States Geological Survey databases (Preston, 2006). Production in 1997 was estimated to
have been greater than 11,000 acre-feet per year (TWDB, 2002). As part of the 2002 State
Water Plan, the TWDB designated the Yegua-Jackson as a minor aquifer because of the large
number of wells completed in the aquifer and because of the relatively large groundwater use.
The Yegua-Jackson Aquifer exists predominantly in the outcrop or near-outcrop areas of the
Yegua Formation and Jackson group. In Texas, this outcrop area stretches in a relatively thin
band approximately parallel to the coastline, from Starr County in the Rio Grande Valley to
Sabine County in East Texas, and is thus bracketed by the Rio Grande to the south, and the
Toledo Bend Reservoir (along the Sabine River) to the east. The width of this outcrop varies
from less than 10 miles in Gonzales County to near 40 miles in La Salle County, with an area of
approximately 11,000 square miles.
The aquifer is comprised of interbedded sands, silts, and clays deposited in settings ranging from
fluvial to marginal marine (deltaic and barrier/strandplain) to shallow marine shelf (Galloway
and others, 1979). The fluvial and deltaic sands typically provide moderate amounts of fresh to
slightly saline water in some areas of the outcrop, or slightly downdip (Preston, 2006). Wells
completed in the Yegua-Jackson Aquifer yield anywhere from a few gallons per minute to over
TWDB Report ##: Structure of the Yegua-Jackson Aquifer of the Texas Gulf Coastal Plain
3-3
300 gallons per minute with potential for producing up to 600 gallons per minute in the most
transmissive portions of the aquifer (Preston, 2006). In a preliminary review of hydrograph data
for the Yegua-Jackson, there is evidence of recovering heads from the 1980s until present
(Preston, 2006) suggesting reduced pumping, at least locally in the aquifer.
Water quality in the aquifer is highly variable with most groundwater samples in the aquifer-
delineated portion of the Yegua-Jackson being fresh to slightly saline with total dissolved solids
less than or equal to 3,000 gpm. Freshwater regions of the aquifer are generally found in the
thicker, more transmissive, fluivio-deltaic sands in the outcrop and sometimes extending
downdip into the confined portions of the Yegua-Jackson Aquifer. Because of lignite within the
aquifer, Preston (2006) reports that shallow portions of the aquifer can have very high chloride
and sulfate concentrations. Because of uranium in the Jackson Group, some groundwater can
also possess high nuclide activities.
In the 2007 State Water Plan (TWDB, 2007) it is reported that the existing groundwater supply
in the aquifer is 7,285 acre-feet per year (assuming existing wells and infrastructure) with a total
availability estimated at 25,000 acre-feet per year. Several regions have developed water
management strategies in the 2007 State Water plan which includes the drilling of new wells and
desalinization. With the implementation of the proposed water management strategies,
production from the aquifer is expected to exceed 15,000 acre-feet per year by 2040.

TWDB Report ##: Structure of the Yegua-Jackson Aquifer of the Texas Gulf Coastal Plain
3-4
This page is intentionally blank.

TWDB Report ##: Structure of the Yegua-Jackson Aquifer of the Texas Gulf Coastal Plain
4-1
4. Analysis Methodology and Approach
With a literature review of the Yegua-Jackson interval performed, the next steps in the structure
development work flow were to:
• gather available geophysical well logs for correlation;
• perform a chronostratigraphic analysis to subdivide geologic units into aquifer layers;
• perform lithologic analysis (net sand); and
• map structure, net sand distribution, and depositional systems.
Details of the approach for each of these steps are provided in following sections.
4.1 Data Selection Reviews of existing literature and publicly available geophysical well log collections were
undertaken at the initiation of this investigation and during the planning for later stages. This
section of the report will describe the process used to solicit stakeholder data, the sources for
geophysical logs, the sources for information on structural features, and the sources for
information on Yegua-Jackson depositional facies.
4.1.1 Stakeholder Data Sources At the beginning of the project a list of potential stakeholders comprised of the Groundwater
Conservation Districts (GCDs) which fall within the boundaries of the Yegua-Jackson Aquifer
were compiled. This list was compiled to seek additional data sources for Yegua-Jackson
Aquifer structure, sand thickness, or water quality data. At the time, there were 13 Groundwater
Conservation Districts located within the boundaries of the aquifer.
Contact was attempted with each of these Groundwater Conservation Districts. The initial
contact method was telephone. If that proved unsuccessful, or if follow-up to the telephone call
was warranted, emails were also used as a means of communication. For each Groundwater
Conservation District contacted, the following talking points were discussed:
• The INTERA Team was introduced along with the mission of the project. It was further
stated that we had been contracted by the TWDB to collect, interpret, develop, and
document geological and hydrological information that could be used to develop the
TWDB Report ##: Structure of the Yegua-Jackson Aquifer of the Texas Gulf Coastal Plain
4-2
structure for the Yegua-Jackson Aquifer or could be of benefit to the future development
of a groundwater availability model for the Yegua-Jackson Aquifer.
• Any available water-well drillers’ reports, geophysical logs, and water quality
information within the Yegua-Jackson Aquifer was requested.
• The Groundwater Conservation District representative was made aware that all data
gathered will be compiled in a final contract report which would be publicly released.
• Where possible, the phone call was followed-up with an email re-capping the phone
conversation and indicating that we needed all data by November 13, 2006.
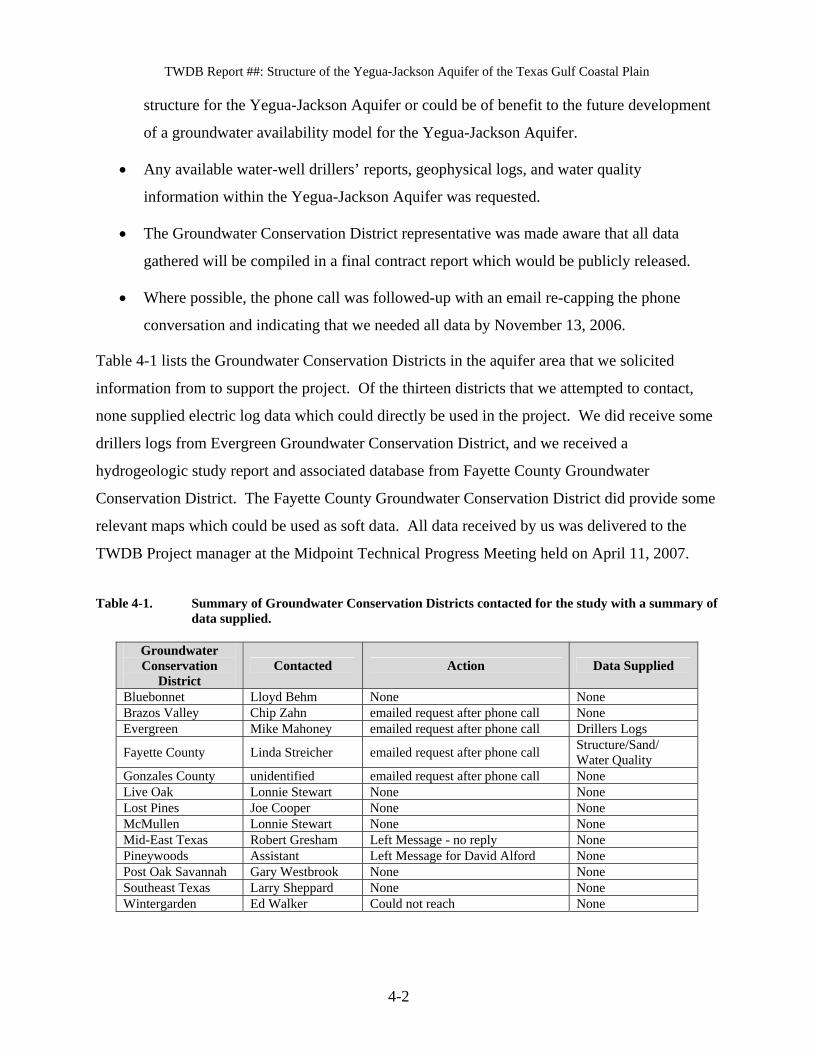
Table 4-1 lists the Groundwater Conservation Districts in the aquifer area that we solicited
information from to support the project. Of the thirteen districts that we attempted to contact,
none supplied electric log data which could directly be used in the project. We did receive some
drillers logs from Evergreen Groundwater Conservation District, and we received a
hydrogeologic study report and associated database from Fayette County Groundwater
Conservation District. The Fayette County Groundwater Conservation District did provide some
relevant maps which could be used as soft data. All data received by us was delivered to the
TWDB Project manager at the Midpoint Technical Progress Meeting held on April 11, 2007.
Table 4-1. Summary of Groundwater Conservation Districts contacted for the study with a summary of data supplied.
Groundwater Conservation
District Contacted Action Data Supplied
Bluebonnet Lloyd Behm None None Brazos Valley Chip Zahn emailed request after phone call None Evergreen Mike Mahoney emailed request after phone call Drillers Logs
Fayette County Linda Streicher emailed request after phone call Structure/Sand/ Water Quality
Gonzales County unidentified emailed request after phone call None Live Oak Lonnie Stewart None None Lost Pines Joe Cooper None None McMullen Lonnie Stewart None None Mid-East Texas Robert Gresham Left Message - no reply None Pineywoods Assistant Left Message for David Alford None Post Oak Savannah Gary Westbrook None None Southeast Texas Larry Sheppard None None Wintergarden Ed Walker Could not reach None
TWDB Report ##: Structure of the Yegua-Jackson Aquifer of the Texas Gulf Coastal Plain
4-3
4.1.2 Geophysical Log Sources A grid of well logs and cross sections established by Dodge and Posey (1981) were mined for
both logs and existing stratigraphic interpretations. Many of the original logs for these sections
are available at the Bureau of Economic Geology. Where original logs were missing or
inadequate for the study (did not cover the stratigraphic interval) and where more wells were
needed to create a more uniform grid, additional well logs were obtained from Bureau of
Economic Geology files. Also, geophysical logs from two Yegua-Jackson wells in the TWDB
library were gathered, and about 30 logs were obtained from the files of the Texas Commission
on Environmental Quality Surface Casing Division.
A total of 250 geophysical logs were selected, gathered, and scanned at 300 to 400 dots per inch
resolution. A list of wells, their locations, and other information is provided in Appendix A.
Well locations were confirmed from Tobin basemaps (see Appendix B for full well names on
Tobin Township-Range locations), and latitudes and longitudes were transferred to a geographic
information system database with a resulting accuracy of approximately 1 mile. Tobin Maps are
the standard for base maps used in the oil exploration industry in Texas and in the Gulf Coast.
Tobin started in 1928 developing the first standardized ownership maps in the region. Tobin
Maps in Texas utilize the “Tobin Grid” as the reference coordinate system. This system
originates from Latitude 30 degrees north, Longitude 100 degrees west and is based on a
7.5 minutes grid.
Where available from log headers, well surface elevations were compared with elevations from
the United States Geological Survey digital elevation model. Discrepancies resulted in a review
of well locations and this process served as a quality check for both well locations and well
datums. In the small percentage of wells where the datum was not known from the log header,
digital elevation model elevations were assumed as ground surface and an average of 14 feet was
added to approximate a datum consistent with the Kelly Bushing datum of other logs. The Kelly
Bushing is an adapter that connects the drilling rig rotary table to the drill string. The Kelly
Bushing exists approximately at the level (elevation) of the drill rig floor and is the datum from
which depth measurements on geophysical logs are commonly referenced.
A subset of more than 150 logs was digitized by Reservoir Visualization Incorporated and was
used to quantify lithology within aquifer units. Spontaneous Potential, resistivity, and rarely

TWDB Report ##: Structure of the Yegua-Jackson Aquifer of the Texas Gulf Coastal Plain
4-4
gamma-ray or sonic curves were digitized from depth-registered scans of 1in = 100-foot or 1 in =
200-foot logs. Key points defining log shape were digitized. The resulting nonuniform data
spacing was normalized to 0.5-foot spacing by Reservoir Visualization Incorporated (see
Section 4.4.1.1 for further details).
4.1.3 Structural Geology Sources Fault locations for the top of the Jackson Group and the top of the Yegua Formation were taken
from Quick and others (1977), and fault throws at both the Top Jackson and Top Yegua horizons
were estimated at a few points along key faults from structure contour maps in the same
publication. Because the Quick and others (1977) study only covered the southern half of the
aquifer extent, fault cuts in cross sections from Dodge and Posey (1981) were also incorporated.
This was done by digitizing the location on a cross section where a fault displaced either the top
Jackson or top Yegua. Fault throws at the base of the Frio Formation (near the top of the
Jackson Formation) and the top of the Yegua Formation were estimated. Fault traces from Quick
and others (1977) and throws from both sources were posted as line and point information,
respectively, on the geographic information system basemap. Because of the large areal extent
of the aquifer and the large amount of fault traces within the aquifer, each fault trace map (for the
Yegua and the Jackson) was created using three maps representing the southern, central, and
northern portions of the aquifer. Figures 4-1 through 4-3 depict the fault traces and throw for the
Jackson Group and Figures 4-4 through 4-6 depict the fault traces and throws for the Yegua
Formation. Other structural elements, such as salt features and cretaceous shelf edge locations,
were taken from Salazar and others (1997), who had converted the Tectonic Map of Texas
(Ewing, 1986) into digital GIS layers.
4.1.4 Lithology and Depositional Systems Sources Contours of total sand thickness for the Upper and Lower Yegua Formation were digitized from
maps in Van Dalen (1981) that cover the southern and central parts of the aquifer. Total Yegua
Formation sand thickness contours for the complete area of the aquifer were digitized from
Fisher (1969). Sand thickness maps covering the full extent of the Yegua Formation from
Meckel (1993) were also reviewed. Meckel divided the Yegua into six high-frequency
depositional sequences that were grouped into two larger depositional cycles. His intervals
1 through 3 equate to the Upper Yegua Layer of this study and his intervals 4 through 6 equate to
our lower Yegua layer. For the Jackson Group, total sand thickness across the full area of the

TWDB Report ##: Structure of the Yegua-Jackson Aquifer of the Texas Gulf Coastal Plain
4-5
aquifer was digitized from Fisher and others (1970). Information from Van Dalen (1981),
Fisher (1969), and Fisher and others (1970) were used as a guide to sand thickness trends and
depositional systems in both the Yegua and Jackson units. Because Fisher and others (1970)
studied the Jackson Group as a single interval, sand thickness contours were used as general
trends in mapping the two (aquifer) layers of the Jackson that this study recognizes.
4.2 Stratigraphic Interpretation Approach This study sought to improve the understanding and accuracy of the Yegua-Jackson Aquifer
framework by incorporating existing data and existing lithostratigraphic interpretations with the
concepts of chronostratigraphy. A chronostratigraphic approach provides greater reassurance
that the depositional layering that forms the fabric of the aquifer, and thus governs its hydrologic
behavior, can be properly identified (see Section 4.2.2 for further explanation).
4.2.1 Incorporation of Existing Data and Knowledge From the distribution of the 250 wells used, a grid of 30 dip-oriented cross sections and 3 strike-
oriented cross sections was created (Figure 2-2, Plate 1). Dip sections extend from the Yegua-
Jackson outcrop area downdip (southeast) more than 50 mile and to depths exceeding 6,000 feet
subsea to allow a more complete stratigraphic analysis. Strike sections extend from the Mexico
to Louisiana borders. Two sections roughly parallel the outcrop and, depending on their
location, show either mostly the Jackson interval (A-A’) or mostly the Yegua interval (B-B’). A
third strike section, C-C’, was created from selected wells such that coverage of both intervals
was optimized.
Previous interpretations of bounding surfaces for the base Yegua, top Yegua, top Jackson, base
Vicksburg, and top Jackson/Vicksburg were taken directly from, or correlated into the well grid,
from Dodge and Posey (1981), Coleman (1990), and various United States Geological
Survey/TWDB county studies. Micropaleontologic markers on Dodge and Posey (1981)
sections were correlated into the well grid and also taken directly from annotations on original
copies of logs used in the grid. Because of the uncertainty of the source of the latter information,
that data was used more as a rough check on correlations.
Outcrop boundaries of the Jackson and Yegua intervals and subunits (e.g., the Wellborn
Formation of the Jackson Group or the Cook Mountain Formation of the Upper Claiborne
Group) were taken from the geographic information system-based Geologic Atlas of Texas

TWDB Report ##: Structure of the Yegua-Jackson Aquifer of the Texas Gulf Coastal Plain
4-6
(Texas Natural Resource Information System, 2006). These boundaries were projected onto
cross sections, and surface elevations along section lines were taken from the United States
Geological Survey digital elevation model to place outcrop boundaries precisely on cross
sections.
4.2.2 Chronostratigraphic Concepts and Interpretation Methodology 4.2.2.1 Concepts The internal fabric of a sedimentary interval that comprises an aquifer is the result of:
(1) processes active during deposition; (2) any mechanical (compaction) or chemical changes
that occurred after deposition (diagenesis); and (3) structural modification (folding or faulting).
Diagenetic impacts on shallowly buried sedimentary aquifers are usually minor. Structural
features must be of significant scale to have dramatic impacts on shallow sandy aquifers, and
these can often be assessed from surface mapping. The distribution of sedimentary processes
geographically and through geologic time are more difficult to evaluate in the subsurface extent
of an aquifer, yet these key features are often the dominant controls on the aquifer framework in
terms of fluid flow characteristics. Estimating aquifer framework and heterogeneity on the basis
of outcrop and limited subsurface data requires a predictive approach founded on an
understanding of the activities that built the aquifer. The concepts of chronostratigraphy and
depositional systems provide that predictive capability.
Extensive geologic observations of modern depositional systems, such as deltas, and ancient
deposits on scales as large as the fill of an entire sedimentary basin indicate that sedimentary
deposition is cyclic, and that this cyclicity is hierarchical. In other words, there are long-lived
cycles composed of shorter-term cycles, which, in turn, are composed of even shorter-term
cycles. Cycle time spans critical to aquifer framework development can vary from tens of
thousands to millions of years.
The observed cyclicity is a result of variations in sediment supply, global sea level (eustasy), and
subsidence or uplift. The balance between these factors results in a relative rise or fall of sea
level. This may occur by uplift or subsidence, increase or decrease of sediment input, or rise or
fall of global sea level. Commonly, a depositional cycle consists of falling relative sea level and
basinward shoreline progradation, followed by a stabilization and gradual rise of relative sea
level and, consequently of shoreline, in what is referred to as aggradation. Figure 4-7 shows

TWDB Report ##: Structure of the Yegua-Jackson Aquifer of the Texas Gulf Coastal Plain
4-7
these steps from bottom to top. The cycle is completed by an increased rate of rise of sea level
that forces the shoreline landward in ‘retrogradation’ (Figure 4-7). Finer-grained deposits
associated with the highest relative sea level position are widespread, thin landward, and include
a theoretical surface representing the time of maximum sea level known as a ‘maximum flooding
surface.’
The dominant controls on cycle scales of millions of years is not well understood, but is believed
to be associated with continental- and global-scale tectonics (Figure 4-8). Controls on cycle
scales of tens of thousands to hundreds of thousands of years are widely held to be associated
with repetitive changes in: (1) the elliptical path of the Earth around the Sun; (2) the tilt of the
Earth’s axis; (3) and in the precession of the Earth’s axis. All of these affect the amount of
incoming solar radiation to the Earth, and thus, the climate (Figure 4-8). Climate, in turn,
produces changes in global sea level through storage or release of water in glaciers, and climate
also impacts sediment supply by affecting the amount of rainfall available to carry sediments to
the basin. The end points of cycles (maximum highstand or lowstand of relative sea level) are
also times at which tectonic changes inland or at the coast often result in major changes in the
courses of rivers, changing the location of major deposition on the coastal plain and shoreline.
An example of why this cyclicity is important to aquifer framework and management can be
visualized in offshore Texas. At the peak of the last glacial period, about 20,000 years ago,
global sea level was approximately 450 feet lower than today, and large rivers crossed the Texas
continental shelf to create deltas more than 60 miles south and east of the current shoreline
(Figure 4-9). These sand-rich deposits are representative of parts of aquifers such as the Yegua-
Jackson. After deposition, those sandy deposits were then covered by water as the sea rose to its
current level and the shoreline retreated to the one we know today. That sand-rich interval is
today being covered by a blanket of mud delivered by the rivers of the Gulf Coast, including the
Mississippi River, creating a future maximum flooding surface. This mud blanket thins from
many feet to tens of feet thick far offshore to just a few inches just beyond the breaking waves of
the current shoreline. As sea level falls again in the coming tens to one hundred thousand years,
a new layer of sandy material will be deposited above this mud blanket, creating a potentially
separate hydrologic unit in the subsurface. The result is two sand-rich aquifer-like layers
separated by a wedge-shaped clay-rich layer that would serve, potentially, as an aquitard to limit
water flow between the two aquifer layers.

TWDB Report ##: Structure of the Yegua-Jackson Aquifer of the Texas Gulf Coastal Plain
4-8
The chronostratigraphic approach used in this study is more reliable than previous
lithostratigraphic approaches at identifying and correctly connecting aquifer layers and
intervening aquitards. The result is a more reliable three-dimensional description of the aquifer
that will yield a more accurate numerical groundwater model.
Unlike lithostratigraphic correlation, which relies on lithologic changes to subdivide sedimentary
intervals, chronostratigraphic correlation relies on recognition of depositional surfaces formed at
critical times in a depositional cycle. At these relatively brief periods of time, broad areas of the
coast are undergoing similar depositional processes. At sea-level highstand times, deposition of
fine-grained deposits (potential aquitards) cover a large portion of the sand-rich sediments
deposited during the last lowstand (potential aquifers). These highstand times are represented by
theoretical maximum flooding surfaces, and their associated fine-grained deposits are especially
useful in defining aquifer framework because they often have a characteristic signature on
geophysical logs from wellbores. Thus these deposits can be traced across a regional extent in
the subsurface. The intervals above and below these fine-grained deposits are sand-rich
packages deposited under a common set of conditions, including positions of major sediment
input. Predictive methods for evaluating the geographic distribution of sand-rich areas within the
package can then be applied. These predictive methods are based on observations of modern
depositional processes and systems such as rivers and deltas, which are all being deposited
during just one depositional cycle. These methods rely on the commonality of depositional
conditions within the time frame of the package, and the location and style of sand-rich
deposition will vary from package to package. Differences between packages deposited over
short timespans (high-frequency units) are typically less significant than differences in packages
deposited over longer timespans (low-frequency units). When assessing aquifer framework, the
combining of many high-frequency units or multiple low-frequency units can decrease the
reliability of the predicative methods. This is because many different depositional features such
as individual deltas are being combined vertically, blurring the crisp picture of each feature by
stacking other features together with it.
4.2.3 Methodology For this study, maximum flooding surfaces within fine-grained highstand deposits were
correlated in geophysical well logs arranged in dip-oriented cross sections, connecting low-

TWDB Report ##: Structure of the Yegua-Jackson Aquifer of the Texas Gulf Coastal Plain
4-9
resistivity markers in downdip shale sections with shales or abrupt-based sands in updip sandy
and silty intervals.
Initial correlations of very low frequency maximum flooding surfaces defined the base of the
Yegua and an interval suspected of containing the top of the Jackson. Early attempts to correlate
high-frequency maximum flooding surface-bounded units within the Yegua and Jackson
intervals produced inconsistent results. A strike-oriented section (C-C’, see Plate 1 for location
of section line) was created to assist in the recognition of major depositional packages that
contain multiple high-frequency maximum-flooding-surface-bounded units. The resulting four
major depositional packages are bounded by the five most significant maximum-flooding
surfaces in the study interval. This is indicated not only by the thickness of associated fine-
grained deposits but also by abrupt regional-scale lateral changes in the location and amount of
sandy deposition across these five surfaces. Major packages and subunits were then correlated in
dip sections and loop-tied along parallel strike sections. These four major packages or units
generally correspond to the four operational ‘layers’ into which the Yegua-Jackson Aquifer was
divided (Upper and Lower Jackson Layers and Upper and Lower Yegua Layers). An exception
involving one of the layer boundaries is further discussed in Section 4.3.
To document the correlation process, each boundary surface in each well was given a grade of A,
B, C, or D, depending on qualitative reliability of the interpreted correlation. Grade A
correlations were considered to have an approximate 90 percent likelihood of being within
50 feet of the exact bounding surface. Uncertainty in correlations arises from lateral changes in
the appearance of a bounding surface within a shaly interval and the possibility of unrecognized
depositional or structural complications that may result in a correlation that is inaccurate by more
than 50 feet. A grade of B was assigned when significant anomalies in unit thickness or
maximum flooding surface character decreased interpreter confidence, resulting in a 20 percent
chance that the correlation is in error by hundreds of feet. Grade C correlations are those where
the surface did not occur in a well but where the intercept point was probably within 200 feet of
the end (either above or below) of the log data. A grade of D was assigned when a surface was
interpreted to intercept a well more than 200 feet above or below log data; this was generally
reserved for cases where an approximation of a minimum or maximum value was required to
constrain structural mapping.

TWDB Report ##: Structure of the Yegua-Jackson Aquifer of the Texas Gulf Coastal Plain
4-10
Additionally, a map depicting the sequence of correlations was prepared (Figure 4-10). This
‘genealogical map’ shows which wells were key in establishing the stratigraphic framework
(‘parent’ correlations), and the path along which this framework was propagated throughout the
study area (‘daughter’ correlations). As discussed previously, strike cross section C was used to
confirm a chronostratigraphic subdivision. Correlations were then carried updip and downdip
along dip sections. The order in which correlations were then carried in the strike direction to
allow loop tying is shown in Figure 4-10. Such a map is critical in the situation where errors of
correlation are later identified. Such ‘busts’ must be followed back to a well in which
correlations are confident, and any correlations dependent on wells that were changed must then
also be evaluated for errors. This map was useful during the interpretation process and, although
it is hoped otherwise, may be critical to future workers who refine the present interpretation.
4.3 Structure Mapping Approach The structural elevation, relative to sea level, was mapped across the study area for five key
surfaces:
• Top of the Jackson Group (top of Upper Jackson Layer)
• Top of Lower Jackson Layer
• Top of Yegua Formation (top of Upper Yegua Layer)
• Top of Lower Yegua Layer
• Base of Yegua-Jackson Aquifer
The first four of these surfaces are chronostratigraphic, meaning that they correspond to
maximum flooding surfaces. The fifth surface, the base of the Yegua-Jackson Aquifer, is a
lithostratigraphic surface. It does not follow a maximum flooding surface, but instead generally
corresponds to the base of significant sand bodies in the Yegua depositional cycle. A sixth
surface, the chronostratigraphic base of the Yegua depositional cycle, was not included in this
report. It corresponds to the maximum flooding surface between the Sparta and Yegua
depositional cycles.
Elevations of the mapped surfaces in wellbores and at elevations every mile along the outcrop
boundary were combined to create structure grids using an interpolation function in ArcGIS 9.2
called “topo to raster”. This function’s algorithm essentially uses a spline technique that has

TWDB Report ##: Structure of the Yegua-Jackson Aquifer of the Texas Gulf Coastal Plain
4-11
been modified to allow for abrupt changes in the fitted surface. The grids were given a northern
orientation and the grid size was defined at one mile.
Preliminary gridding and contouring was reviewed for anomalies that might indicate correlation
errors or data entry errors. Following resolution of any anomalies, adjacent surfaces (for
example the Base Yegua-Jackson Aquifer and top of the Lower Yegua Layer) were contoured
and the contours overlain to check for negative thicknesses in the intervening interval. A few
such situations occurred in areas of rapidly changing dip and poor data spacing. These issues
were resolved by adding estimated depths for a surface to increase control for the contouring
algorithm. These estimated tops, mentioned previously, are marked with the grade ‘D’ in the
geodatabase and in Appendix C.
A number of faults that offset the Yegua and Jackson are known to exist within the study area
(Quick and others, 1977; Dodge and Posey, 1981). These are predominantly downdip of the
outcrop area, but throws on some faults reportedly exceed several hundred feet. Additionally,
salt-related structures occur as localized features in the Rio Grande Embayment and downdip in
the Houston Embayment (Ewing, 1986). Although these features may become important for
fine-scale aquifer modeling, data spacing in this study was insufficient to yield well-supported
detailed structure contour maps. Instead, fault and fault cut locations and throws and salt feature
locations have been posted on structure maps to alert future workers to their presence.
4.3.1 Potential Mismatch of Previously Mapped Outcrop Boundaries and Layer Outcrop Boundaries
Stratigraphic correlations in the outcrop often have the benefit of being physically traceable
boundaries along their length, but lack the benefit of subtle lithologic variation provided by
geophysical logs from the subsurface. Outcrop correlations are also lithostratigraphic, meaning
that they follow lithologic boundaries as opposed to time surfaces. Additionally, soil formation,
vegetative cover (especially in East Texas), and broad areas of alluvial cover can decrease the
certainty of outcrop correlations. And in some cases there isn’t enough lithologic distinction
between one unit and the next to be able to separate them in outcrop. This is the case for the
Vicksburg Formation of East Texas. It is recognized in the subsurface throughout Texas and
Louisiana (Coleman, 1990) and in outcrop in Louisiana, as previously discussed. Because the
Vicksburg is not mapped as a separate unit in Texas, it is uncertain when this interval is mapped
TWDB Report ##: Structure of the Yegua-Jackson Aquifer of the Texas Gulf Coastal Plain
4-12
with the Jackson and when it is mapped with the overlying Catahoula or Frio Formations (see
further discussion in Section 5.2.1).
The Jackson Group has been subdivided into members that have been separately mapped in East
and Central Texas. This subdivision is, again, lithologically based, and may not be consistent
with time-based layers mapped in the subsurface. As a consequence, layer outcrop boundaries
used in this study for structural control may not match outcrop boundaries of formations within
the Jackson Group.
4.4 Lithologic Interpretation Approach Cumulative sand thickness in aquifer studies has been determined in the past using many
different approaches, yielding results that are sometimes difficult for subsequent workers to
reproduce. To overcome this issue, 150 well logs were selected, and spontaneous potential and
resistivity curves digitized. Baseline values for shale and/or sand were established and a cutoff
value was used that produced results similar to geologist estimates. Because the study interval
included freshwater, transitional, and saline water-bearing sediments, different algorithms and
cutoffs were used for each interval. In freshwater zones, the resistivity curve was used to
delineate lithology. In saline zones, spontaneous potential was used. And in transitional zones,
either curve or a combination of curves was used, depending on mud resistivity and resulting
spontaneous potential behavior.
4.4.1 Algorithmic Lithologic Analyses A semi-automated approach was used to estimate the basic lithology, or the relative locations of
sands and shales, from appropriate well logs. The automated approach was based on a simple set
of rules that an analyst might use in interpreting a well log manually. The set of rules, which we
will heretofore refer to as the “algorithm”, was applied consistently to digitized electric log data
for approximately 150 wells. The algorithm produced decisions and yielded picks of sand or
shale every 0.5 feet (the vertical resolution of the log data). Values were summed over each
layer to yield total sand thickness by layer.
4.4.1.1 Electric Logs A typical electric log will contain a record of the response from one or more tools that were
passed down the wellbore after drilling. Each tool will measure a particular characteristic of the
formation relative to the tool (or the drilling mud). The three types of responses that were used
TWDB Report ##: Structure of the Yegua-Jackson Aquifer of the Texas Gulf Coastal Plain
4-13
in the current study are called “spontaneous potential”, “induction log deep”, and “short normal”.
The two latter tools are measurements of formation resistivity; in this particular analysis, they
were used interchangeably because in most situations the values are very similar, but records
from one tool or the other were not available.
The response from any tool that is present during logging was historically recorded on a running
strip of paper commonly referred to as a ‘log.’ More recently, the responses are recorded
digitally during the actual logging. To apply a machine algorithm to an electric log requires
digital log data. If the log is available only on paper, they must be digitized, and there are
various companies that specialize in this service. For the current study, the log curves from
paper logs were digitized by Reservoir Vizualization Inc. at irregular depth intervals, but spacing
was sufficient to capture curve shape. The curve was then reproduced from the points and
sampled at half-foot intervals. A digital log may be saved in one of several industry formats.
For the current study, the logs were saved in the Log American Standard Code for Information
Interchange (ASCII) Standard (version 2) format, which is a straightforward American Standard
Code for Information Interchange format.
4.4.1.2 The Code The algorithm was implemented as a computer program in the Perl language. It can be executed
on any computer or operating system that has a Perl interpreter installed. It was tested on
Windows 2000 under Cygwin. The code performs some “housekeeping” outside of the actual
algorithm implementation, mainly pre- and post-processing data. It contains subroutines for
reading the Log American Standard Code for Information Interchange (ASCII) Standard file
format and, after processing, writing the Log American Standard Code for Information
Interchange (ASCII) Standard format with the additional “tool” or curve of sand/shale lithology.
By adding the lithologic picks to the actual digital log, the original electric log curves can be
viewed side-by-side or overlain on the resulting picks. This allows for convenient checking of
the performance of the algorithm by an analyst.
4.4.1.3 The Algorithm As indicated previously, the algorithm was based on a simple set of rules that an analyst might
use in interpreting a well log manually. The data input to the algorithm for a particular well
consisted of the electric log data, the depths of the five layer surfaces (tops of the Upper and

TWDB Report ##: Structure of the Yegua-Jackson Aquifer of the Texas Gulf Coastal Plain
4-14
Lower Jackson Layers, the top of the Upper and Lower Yegua Layers, and Base Yegua-Jackson
Aquifer), and the depths to the water quality divisions. The three water quality intervals
considered in the analysis were “fresh”, “transition”, and “brine”. The reason that these water
quality intervals were defined was that the electric log responses were somewhat different,
depending on the water quality at a particular location. Each formation interval (and any water
quality subinterval) was analyzed independently.
The following provides the fundamentals of the approach. The spontaneous potential response
was used predominantly in the brine interval. A negative deflection of the spontaneous potential
of some relative magnitude in the brine interval indicates sand. A lack of that deflection
indicates shale. In the fresh interval, the spontaneous potential response is often suppressed (i.e.,
it becomes insensitive), rendering the curve less useful. In the fresh interval, the positive
deflection of the resistivity curve of a certain magnitude was indicative of sand, while the lack of
this deflection was indicative of shale. In the transition area, the spontaneous potential response
may or may not be suppressed, so some check must be made to determine if it is an appropriate
metric in that interval. Lacking a sufficient spontaneous potential sensitivity, the resistivity
response was used, similar to the fresh interval. Because the resistivity response in the transition
interval is less sensitive than in the fresh interval, the magnitude of the deflection indicating sand
is less in the transitional interval than in the fresh interval.
Figure 4-11 is a flow chart that provides more detail about the algorithm. The inset box provides
the values of the various parameters. Note that several values for each of the fitting parameters,
resCutFresh, resCutTrans, resCutBrine, spMinSpanTrans, and spMinSpanBrine were tested
during the course of the analysis. The values shown in Figure 4-11 were the final values used for
all logs, and provided the best results to date.
The flow process starts by defining the current working interval, which consists of an aquifer
layer, subdivided by any water quality divisions. For example, if we started with the Upper
Jackson Layer, and the water quality division between fresh and transition occurred inside the
layer, we would consider the log values between the top of the Upper Jackson Layer and the
fresh/transition division point. In the remainder of this discussion we will call this span the
“working interval”. Depending on the water quality type in the working interval, we proceed in
one of three different ways.

TWDB Report ##: Structure of the Yegua-Jackson Aquifer of the Texas Gulf Coastal Plain
4-15
If the type is fresh, we simply consider the values of the induction log deep resistivity response
(if the induction log deep response is not present, we use the short normal response for
resistivity). If the response is equal to or exceeds resCutFresh (currently 4 ohms), then the half-
foot interval is marked as sand, otherwise it is marked as shale.
If the type is transition, then we check the sensitivity of the spontaneous potential response by
taking the difference between spMin and spMax, which we calculated as the 5th and 95th
percentiles of the spontaneous potential response in the current interval. We use the 5th and 95th
percentiles in order to help eliminate anomalous maximum or minimum values in the working
interval dataset. If the sensitivity, or spSpan, is greater than or equal to the defined minimum,
spMinSpanTrans (currently 20 mV), then the spontaneous potential response is used. The
spontaneous potential response is then compared at each half-foot interval to the spCut, which is
halfway between spMin and spMax. If the spontaneous potential response is less than spCut
(remembering that the deflection is typically negative for sands) then the half-foot interval is
marked as sand, otherwise it was marked as shale. If spSpan is less than spMinSpanTrans, then
the resistivity was used to determine lithology. If the response is equal to or exceeds
resCutTrans (currently 3 ohms), then the half-foot interval is marked as sand, otherwise it is
marked as shale.
If the type is brine, it is handled in the same was as the transition type, except that the values for
the parameters spMinSpanBrine and resCutBrine are used. After the sands and shales are
marked at each half-foot interval, then the next working interval is considered and the process is
repeated. When all of the working intervals have been processed for a particular log, the
amended Log American Standard Code for Information Interchange (ASCII) Standard file is
written. After all of the logs have been processed, summary sand/shale thickness and percent
tables are also written.
4.4.1.4 Quality Control
This automated method of lithology determination speeds the task of net sand thickness
determinations and is repeatable because it is applied uniformly to all logs. Log response,
however, is not always uniform, nor is the general lithologic character of the various intervals
across the study area similar. Therefore, after calculated values were posted on basemaps for
each interval, each value was compared to the original log by a geologist to confirm accuracy. In

TWDB Report ##: Structure of the Yegua-Jackson Aquifer of the Texas Gulf Coastal Plain
4-16
some cases the calculated value was significantly different than a manually calculated value
using curve baselines and cutoffs. In those cases, the manual values replaced computed values.
There are least two causes for anomalous values produced by the current algorithm. The first
potential cause is drift in the spontaneous potential shale and sand baselines created by gradual
changes in electrical properties of the clays or pore waters. Another potential cause of
anomalous values occurs in freshwater and transition zones, where vertical variation in salinity
affects resistivity-derived sand cutoffs. At least one way to overcome these causes is to actively
define baselines for sand and shale for both spontaneous potential and resistivity curves. This
process of, essentially, adding additional data curves to a well log can be accomplished easily in
many geologic interpretation software packages. As long as future workers are provided with
the baseline curves and algorithm used, lithologic interpretations can be accurate and repeatable.
Independent of whether lithology values from logs are determined manually or digitally, there is
always the issue of how to treat sand thickness values for incompletely penetrated or logged
layers. This study treated known sand thicknesses of incompletely logged intervals as minimum
values for the purpose of data contouring. In such cases values are posted as ‘>’ to visually
indicate a minimum value and note the associated uncertainty. The alternate approach of not
including these minimum values can lead to contouring errors because of a lack of constraint,
resulting in mapped areas of no sand where a partial penetration may document tens or hundreds
of feet of sand at that point.
4.4.2 Sand Thickness Mapping Sand thickness values at wellbores, determined algorithmically or manually, were divided by the
isopach values at the wellbores to determine the layer sand percent values at the wellbores.
From the sand percent values, sand percent grids were created using the “topo to raster” function
in ArcGIS 9.2. Preliminary grids and contours were reviewed to correct values below zero
percent and above 100 percent. Values below zero were redefined to zero and values above 100
were redefined to 100 to remove spurious data. To create the sand thickness grids, the sand
percent grids were multiplied by the layer isopach grids. Layer isopach grids were created by
subtracting bounding surface structure grids from one another in the regions downdip of the
outcrop, and by subtracting the lower bounding surface grid from the digital elevation maps
(DEM) in the outcropping regions (the region where the ground surface forms the upper

TWDB Report ##: Structure of the Yegua-Jackson Aquifer of the Texas Gulf Coastal Plain
4-17
boundary of the layer). For instance, the upper Jackson layer was created by subtracting the top
of the Lower Jackson Layer from the top of the Upper Jackson Layer in the downdip area and
subtracting the top of the Lower Jackson Layer from the digital elevation map (DEM) in the
outcrop area. In the outcrop regions of the layer isopach grids, grid values that were less than 10
feet were redefined to 10 feet. There were no layer isopach grid values less than 10 feet in the
down dip areas.
The “topo to raster” function used to create the sand percent grid interpolates values using a
spline technique that has been modified to allow for abrupt changes in the fitted surface. In the
function, the “enforce” option was turned on to remove sinks. Sinks are areas where lack of data
can yield extreme low values through normal interpolation. Sinks are removed by modifying the
surface to assume ‘drainage’ areas surrounding sinks (areas of open contours as opposed to a
series of closed contours). The grids were given a northern orientation and the grid size was
defined at one mile.
This simple approach was done to evaluate the similarity of layer sand thicknesses to published
sand thickness maps of equivalent stratigraphic units created using closer data spacing than
possible in this study. In all cases, major features of published maps were captured with just the
study wells and unbiased computer contouring. Because this process is simple and easily
repeatable as additional data become available, no additional efforts to add biasing were
undertaken.
4.5 Depositional Systems Mapping Approach The distribution of depositional systems within an aquifer layer is important because it provides
information on hydrologic parameters above and beyond sand thickness maps. Sand-rich
sediments deposited in different settings will have different hydrologic properties because of
differing grain size, sorting, sand body size and shape, and degree of interbedding of silts and
muds. This affects sediment properties such as horizontal and vertical conductivity and
storativity that might be measured at a wellbore. The internal architecture of an aquifer layer,
governed by the characteristics of its depositional system setting, creates an overlay of fluid flow
behavior on top of typical considerations such as head (fluid pressure) distribution. Large areas
of highly conductive sands may impress a lateral (along-strike) flow element to aquifer behavior
because of deposition in a wave-dominated, shore-parallel delta. Conversely, dip oriented sand-

TWDB Report ##: Structure of the Yegua-Jackson Aquifer of the Texas Gulf Coastal Plain
4-18
rich lowstand fluvial channels may provide a localized hydraulic conduit between saline-rich
basinal sands and shallower freshwater sands.
For the four Yegua-Jackson layers, sand thickness trends from this study and other published
studies were incorporated with interpretations of depositional setting based upon log curve shape
and previous work. Regions of a layer dominated by similar depositional facies were outlined by
hand, and hand-drawn boundaries were then digitized for incorporation as a geographic
information system layer. In many cases, sand thickness values were used as proxies for
determining position within a larger depositional system. For example, deltaic settings in a
Yegua layer containing less than 100 feet of sand were mapped as delta margins. The resulting
facies-based regions of a layer can be used in modeling to constrain hydrologic parameters
across a modeling layer.

TWDB Report ##: Structure of the Yegua-Jackson Aquifer of the Texas Gulf Coastal Plain
4-19
WebbDuval
Frio
Starr
Bee
Hidalgo
Kenedy
La Salle
ZapataBrooks
Goliad
Live Oak
Jim Hogg
McMullen
Kleberg
VictoriaAtascosa
Nueces
Dimmit
Refugio
Zavala
Jim Wells
Karnes
Willacy
San Patricio
Calhoun
DeWitt
Cameron
Jackson
Aransas
Wilson
-196
-118
-78
98
118
137
157
176
176
196
235
235
275
275
275 275
314
314
314
314
333
333
345
373
392
400
471
529549
549
549
588
588
608
627
667765
784
804
804
824
1020
1059
1275
1529
19022078
0
0
0
0
0
0
0
50
600
200
200
700
100 100
100100
200
100
200
100
100
800
300
300200200
100
100400
600
300
300
100
500
300
100300200
100
200
200200
600
200400
200
300200100
300
600
200
200300100
300100
500
500400
100100200
200
200
500600
300
1000
1000
1400
1000
1200
400
LegendWell locations - this study
Jackson faults - Quick et al. (1977)
State Line
County Boundaries
Yegua-Jackson outcrop
0 10 20 305Miles
Jackson Fault ThrowsDodge and Posey (1981)
Quick et al. (1977)
Fault Throws Unclear - Quick et al. (1977)
Figure 4-1. Faults for the Jackson Group, Southern Study Area. From Quick and others (1977) and Dodge and Posey (1981).

TWDB Report ##: Structure of the Yegua-Jackson Aquifer of the Texas Gulf Coastal Plain
4-20
Bee
Bexar
Duval
LeeTravis
DeWitt
Lavaca
Atascosa
Goliad
Hays
Wharton
Fayette
Live OakMcMullen
Wilson
Victoria
Bastrop
Gonzales
Nueces
Colorado
Karnes
Jackson
Austin
Refugio
Matagorda
Blanco
Frio
Comal
Kendall
Waller
Webb
Gillespie
Calhoun
Jim Wells
Guadalupe Fort Bend
Caldwell
La Salle
San Patricio
Medina
Harris
Washington
Aransas
GrimesBurleson
-118
-78
118
118
137
157
157
157
176
235275 275
275
314
314
314
314
333
373
373
549
549
588
588
608
667765
804
1020
1275
1529
0
0
0
0
50
600
200
200
200100 100 800
700
100 100
100100
200
100
200
100
100
800300
300200200
100
100400
600
300
300
100
500
300
100300200
100
200
200200
600
10001000
1200
400
Kerr
Brazoria
Montgome
Bandera
Brazos
Kleberg
Burnet Williamson
LegendYegua-Jackson outcropState LineCounty BoundariesJackson faults - Quick et al. (1977)Well locations (this study)
Dodge and Posey (1981)Quick et al. (1977)Fault Throws Unclear - Quick et al. (1977)
0 10 20 305Miles
Jackson Fault Throws
Figure 4-2. Faults for the Jackson Group, Central Study Area. From Quick and others (1977) and Dodge and Posey (1981).

TWDB Report ##: Structure of the Yegua-Jackson Aquifer of the Texas Gulf Coastal Plain
4-21
Harris
Polk
Leon
Tyler
Liberty
Brazoria
Houston
Jasper
Hardin
Wharton
Newton
Trinity
Walker
Grimes
Jefferson
Colorado
Austin
Angelina
Lee
Lavaca
Fort Bend
Montgomery
Falls
Limestone
Brazos
Fayette
Robertson
Sabine
Waller
Milam
Burleson
Jackson
Chambers
Matagorda
Madison
Freestone
San Jacinto
Washington Orange
Nacogdoches
San Augustine
AndersonCherokee
Galveston
Victoria
Sabine ParishShelby
-118
78
118
157
157
157
176
235235
275
275
314
353
373
549
Cameron Par
Calcasieu
cLennan
Beauregard P
Hill
eWitt
LegendYegua-Jackson outcropState LineCounty BoundariesWell locations - this study
Dodge and Posey (1981)0 10 20 305Miles
Jackson Fault Throws
Figure 4-3. Faults for the Jackson Group, Northern Study Area. From Quick and others (1977) and Dodge and Posey (1981).

TWDB Report ##: Structure of the Yegua-Jackson Aquifer of the Texas Gulf Coastal Plain
4-22
WebbDuval
Frio
Starr
Bee
Hidalgo
Kenedy
La Salle
ZapataBrooks
Goliad
Live Oak
Jim Hogg
McMullen
Kleberg
VictoriaAtascosa
Nueces
Dimmit
Refugio
Zavala
Jim Wells
Karnes
Willacy
San Patricio
Calhoun
DeWitt
Cameron
Jackson
Aransas
Wilson
Y: -39
Y: 39
Y: 78
Y: 98Y: 98
Y: 118
Y: 118
Y: 118
Y: 137
Y: 137
Y: 137
Y: 157
Y: 157
Y: 176
Y: 176
Y: 216 Y: 235
Y: 255
Y: 275
Y: 314
Y: 314
Y: 333
Y: 333
Y: 353
Y: 353
Y: 373
Y: 412
Y: 431
Y: 471
Y: 510
Y: 549
Y: 745
Y: 863
0
0
0
0
0
150
300100250
100
200
300
200300
200
400
300
200
200400
100100
200200
250
500
250
100200
400
100
200350
500300100
250100
100 200
500
100300400
400
550
200100 600
300
200450700800
100 450600
600600
200
400
500400
150
Y: 314
LegendYegua-Jackson outcropState LineCounty BoundariesYegua faults - Quick et al. (1977)Well locations - this study
Dodge and Posey (1981)Quick et al. (1977)
0 10 20 305Miles
Yegua Fault Throws
Figure 4-4. Faults for the Yegua Formation, Southern Study Area. From Quick and others (1977) and Dodge and Posey (1981).
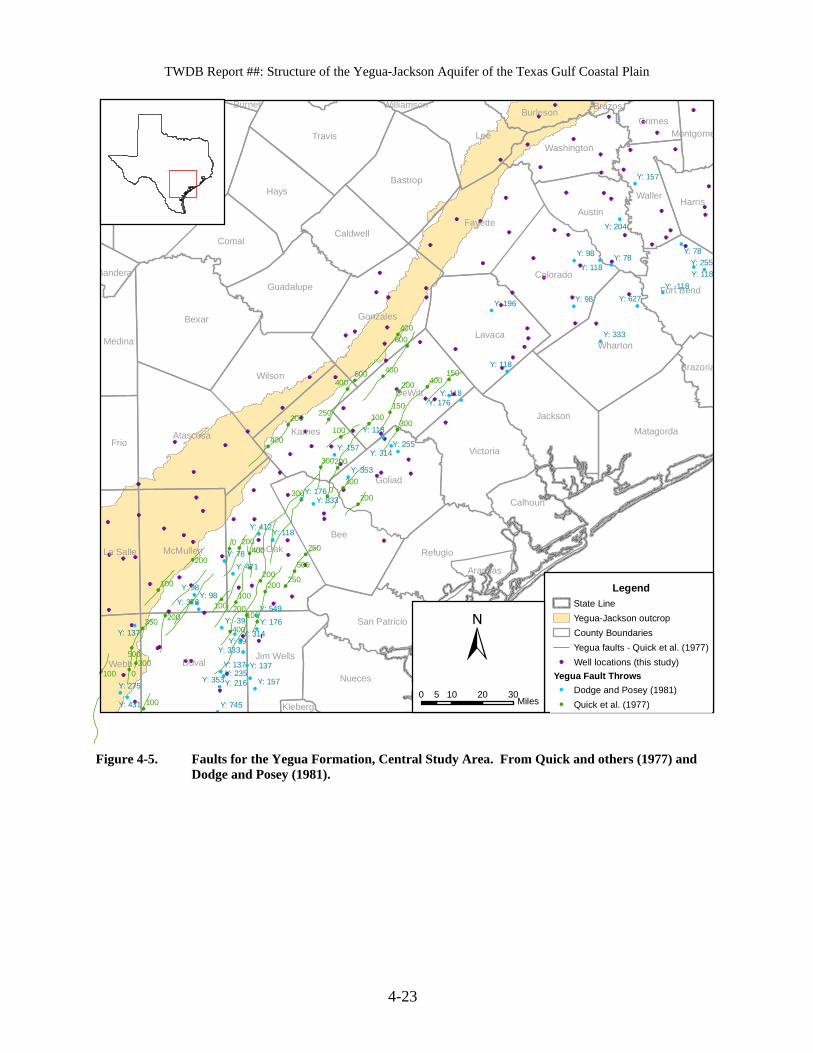
TWDB Report ##: Structure of the Yegua-Jackson Aquifer of the Texas Gulf Coastal Plain
4-23
Bee
Bexar
Duval
LeeTravis
DeWitt
Lavaca
Atascosa
Goliad
Hays
Wharton
Fayette
Live OakMcMullen
Wilson
Victoria
Bastrop
Gonzales
Nueces
Colorado
Karnes
Jackson
Austin
Refugio
Matagorda
Blanco
Frio
Comal
Kendall
Waller
Webb
Gillespie
Calhoun
Jim Wells
Guadalupe Fort Bend
Caldwell
La Salle
San Patricio
Medina
Harris
Washington
Aransas
GrimesBurleson
Y: -118
Y: -39
Y: 39
Y: 78
Y: 78Y: 78
Y: 98Y: 98
Y: 98
Y: 98
Y: 118
Y: 118
Y: 118
Y: 118
Y: 118Y: 118
Y: 137
Y: 137
Y: 137
Y: 157
Y: 157
Y: 157
Y: 176
Y: 176
Y: 176
Y: 196
Y: 204
Y: 216Y: 235
Y: 255
Y: 255
Y: 275
Y: 314
Y: 333
Y: 333
Y: 333
Y: 353
Y: 353
Y: 373
Y: 412
Y: 431
Y: 471
Y: 549
Y: 627
Y: 745
0
0
0
400600
600400
400 150400200
150
300100250
100
200
300
200300
200
400
300
200
200400
100100
200200
250
500
250
100200
400
100
200350
500300
100
100
Kerr
Brazoria
Montgome
Bandera
Brazos
Kleberg
Burnet Williamson
Y: 314
LegendState LineYegua-Jackson outcropCounty BoundariesYegua faults - Quick et al. (1977)Well locations (this study)
Dodge and Posey (1981)Quick et al. (1977)
0 10 20 305Miles
Yegua Fault Throws
Figure 4-5. Faults for the Yegua Formation, Central Study Area. From Quick and others (1977) and Dodge and Posey (1981).

TWDB Report ##: Structure of the Yegua-Jackson Aquifer of the Texas Gulf Coastal Plain
4-24
Harris
Polk
Leon
Tyler
Liberty
Brazoria
Houston
Jasper
Hardin
Wharton
Newton
Trinity
Walker
Grimes
Jefferson
Colorado
Austin
Angelina
Lee
Lavaca
Fort Bend
Montgomery
Falls
Limestone
Brazos
Fayette
Robertson
Sabine
Waller
Milam
Burleson
Jackson
Chambers
Matagorda
Madison
Freestone
San Jacinto
Washington Orange
Nacogdoches
San Augustine
AndersonCherokee
Galveston
Victoria
Sabine ParishShelby
Y: -118
Y: 78Y: 78
Y: 86
Y: 98
Y: 98
Y: 98Y: 98
Y: 118
Y: 118Y: 118
Y: 137
Y: 137 Y: 137
Y: 149Y: 157
Y: 157
Y: 157
Y: 157
Y: 196
Y: 196
Y: 196
Y: 204
Y: 235
Y: 255
Y: 294
Y: 333
Y: 392
Y: 392
Y: 392
Y: 471
Y: 510
Y: 627
Cameron Par
Calcasieu
cLennan
Beauregard P
Hill
eWitt
LegendYegua-Jackson outcropState LineCounty BoundariesWell locations - this studyYegua faults - Quick et al. (1977)
Dodge and Posey (1981)0 10 20 305
MilesYegua Fault Throws
Figure 4-6. Faults for the Yegua Formation, Northern Study Area. From Quick and others (1977) and Dodge and Posey (1981).

TWDB Report ##: Structure of the Yegua-Jackson Aquifer of the Texas Gulf Coastal Plain
4-25
Figure 4-7. Depositional cycles (modified from Galloway, 1989a).
Figure 4-8. Hierarchical cycle nomenclature and dominant factors at each scale. Modified from Fisher (1964), Hays and others (1976), Meckel and Galloway (1996), and Mitchum and Van Wagoner (1991). (Ky = 1,000 years)

TWDB Report ##: Structure of the Yegua-Jackson Aquifer of the Texas Gulf Coastal Plain
4-26
Figure 4-9. Construction of an aquifer.
Note: The upper diagram shows the location of sand-rich deposits at the last maximum glacial period (low sea level position) about 20,000 years ago, as mapped below the Gulf Coast seafloor by seismic data and coring. The shoreline then was more than 60 miles southeast of the current shoreline. The lower diagram shows the widespread mud deposits (blue) that have accumulated since sea level rose back to its current level. It also shows hypothetical sand-rich deposits that might be deposited as sea level gradually falls over the next 120,000 years. The result is two sand-rich layers similar to aquifer layers that are separated by a widespread muddy layer similar to an aquitard, which limits water flow between aquifer layers. LV= Lavaca Valley, CV= Colorado Valley, BV= Brazos Valley, TSV= Trinity/Sabine Valley, WLV= Western Louisiana Valley, LD= Lavaca Delta, CD= Colorado Delta, BD= Brazos Delta, and WLD= Western Louisiana Delta, BR = Brazos River, SBR = San Bernard River, CC = Caney Creek, CR = Colorado River. Modified from Anderson and Rodriguez (1999).
Sediments deposited on shelf during last lowstand
Sediments deposited on shelf during next lowstand
Landward-thinning shale blanket
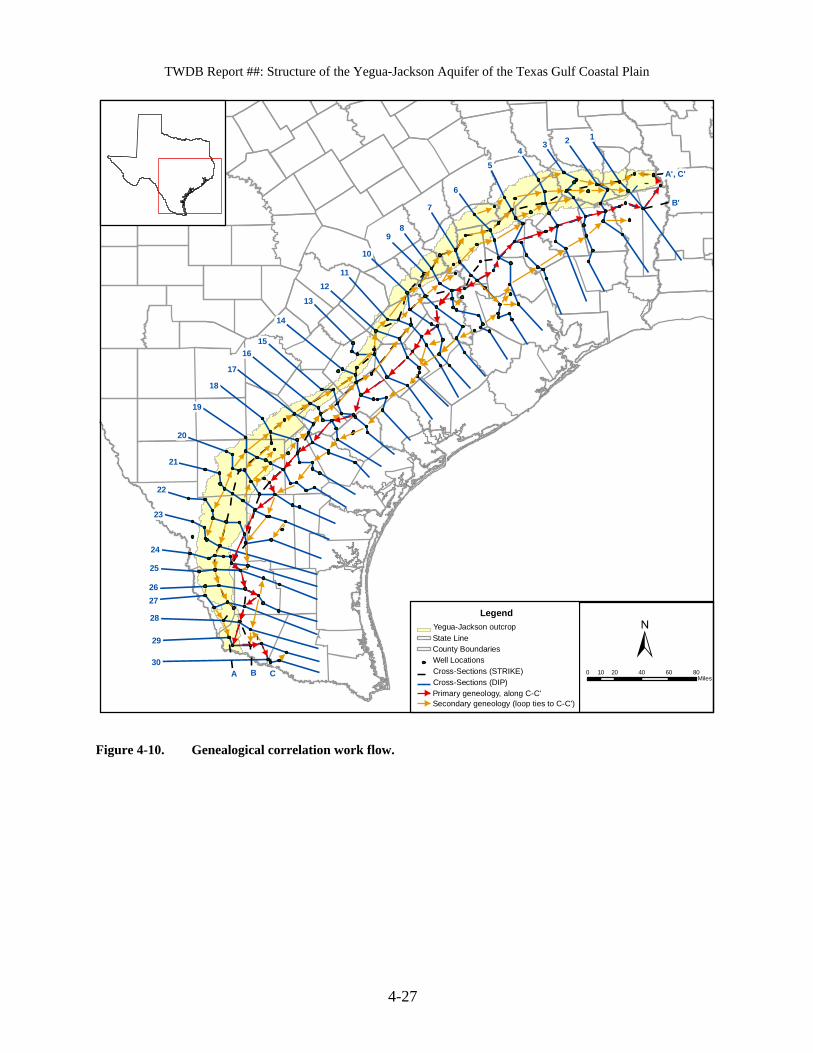
TWDB Report ##: Structure of the Yegua-Jackson Aquifer of the Texas Gulf Coastal Plain
4-27
LegendYegua-Jackson outcropState LineCounty BoundariesWell LocationsCross-Sections (STRIKE)Cross-Sections (DIP)Primary geneology, along C-C'Secondary geneology (loop ties to C-C')
±0 20 40 60 8010
Miles
124
3
5
6
7
89
10
1112
13
14
1516
17
18
19
20
21
22
23
24
25
2627
28
29
30A B C
B'
A', C'
Figure 4-10. Genealogical correlation work flow.

TWDB Report ##: Structure of the Yegua-Jackson Aquifer of the Texas Gulf Coastal Plain
4-28
Figure 4-11. Process chart for automated portion of lithologic log interpretation.
Start
Define working interval based on formation and water quality boundaries
Proceed based on water quality
fresh
transition
brine
spMin = 5th percentile spontaneous potential spMax = 95th percentile spontaneous potential
spontaneous potential = spontaneous potential ILD = induction log deep resCutFresh = 4 ohms resCutTrans = 3 ohms resCutBrine = 3 ohms spMinSpanTrans = 20 mV
spMin = 5th percentile spontaneous potential spMax = 95th percentile spontaneous potential
ILD >= resCutFresh, SandILD < resCutFresh, Shale
spSpan >= spMinSpanTrans
yes
no
ILD >= resCutTrans, SandILD < resCutTrans, Shale
spontaneous potential <=
last interval in log?
Write output
Finish
yes
no
spSpan >= spMinSpanBrine
yes
no
ILD >= resCutBrine, SandILD < resCutBrine, Shale
spontaneous potential <=

TWDB Report ##: Structure of the Yegua-Jackson Aquifer of the Texas Gulf Coastal Plain
5-1
5. Yegua-Jackson Aquifer Structure, Lithology, and Depositional Systems
Structure, sand thickness, sand percent, and depositional facies were mapped for each of the four
layers into which the Yegua-Jackson Aquifer has been divided. The following sections present
the interpreted framework for the Yegua-Jackson Aquifer in terms of stratigraphic subdivision,
structural mapping of resulting stratigraphic layers, and internal heterogeneity as reflected by
sand thickness and depositional facies.
5.1 Stratigraphy A chronostratigraphic framework was created for the Yegua-Jackson Aquifer on the basis of
micropaleontologic information and the three-dimensional distribution of maximum flooding
surfaces interpreted from well logs. Comparison with previous works such as United States
Geological Survey/TWDB County Resource Reports (in order from eastern counties to southern
counties: Anders, 1967; Guyton and Associates, 1970; Tarver, 1966; Baker and Others, 1974;
Follett, 1974; Thompson, 1966; Rogers, 1967; Anders, 1957; Anders and Baker, 1961; and
Harris, 1965) and published regional studies (Dodge and Posey, 1981; Meckel, 1993; Jackson
and Garner, 1982; Ewing, 1986; Fisher and others, 1970; and Coleman, 1990) allowed a
comparison of the interpreted layer boundaries with established stratigraphic nomenclature. The
interval contains both high-frequency and low-frequency depositional cycles that are resolvable
by log correlation.
5.1.1 Major Subdivisions In the dip direction, interval thickness and sand content change rapidly with respect to log
spacing, and can be dramatically influenced by growth faulting. Strike-oriented views display
distinct packaging of sand-rich deposits at different stratigraphic intervals and geographic
locations. On the basis of this packaging, the Yegua-Jackson Aquifer was divided into four
major layers that are bounded by clearly identifiable maximum flooding surfaces, with the
exception of the Base Yegua-Jackson Aquifer, which is lithostratigraphic as described in
Section 4.3. These four layers are, from the bottom of the aquifer upwards (earliest deposited to
latest deposited):
• the Lower Yegua Layer,

TWDB Report ##: Structure of the Yegua-Jackson Aquifer of the Texas Gulf Coastal Plain
5-2
• the Upper Yegua Layer,
• the Lower Jackson Layer,
• and the Upper Jackson Layer.
The definitions of these four layers, their boundaries, and their general character are discussed in
the following sections. Plates 3 through 11 are selected dip-oriented cross sections (dip
sections 3, 4, 6, 9, 14, 17, 20, 24, and 29) that show the thickness and log character of each layer.
Lower Yegua Layer
The basal boundary of the Yegua-Jackson Aquifer is the basal boundary of the deepest aquifer
layer, the Lower Yegua Layer. This surface extends from the northern outcrop boundary of the
aquifer (base of the Yegua Formation on Barnes, 1992) to the base of the first significant sand
(greater than 20 feet thick) above the Cook Mountain Formation in the subsurface (see cross
section 3, Plate 3). In some cases it was necessary to place this surface at the base of a group of
sands that were not the lowest in the section. This was the case when wells very near the outcrop
boundary encountered the basal sand anomalously deep in the interval and a connecting surface
would be unrealistically steep or would be in poor correspondence with adjacent wells. This can
be seen in cross sections 6 and 20 (Plates 5 and 9, respectively).
During development of the stratigraphic framework, a maximum flooding surface below the base
of the Yegua-Jackson Aquifer, above the top of the Sparta Aquifer, and within the Cook
Mountain Formation, was correlated and appears on cross sections as the “Bottom Yegua.”
The upper boundary of the Lower Yegua Layer is an maximum flooding surface that marks a
regional change in sand distribution. It is commonly reflected in logs as a low-resistivity marker
above a trend of upward fining or upward thinning sands (see well DP3-7R, section 4, Plate 4) or
as a pronounced low resistivity marker within a shaly interval of tens to a hundred or more feet
thick (see well WQ-16, section 6, Plate 5). It can also lie above an abrupt-topped upward-
coarsening sand (see well DP2-10, cross section 3, Plate 3) or under a thin symmetrical or
upward-coarsening sand (see well DP13-6, section 14, Plate 7).
The Lower Yegua Layer ranges in thickness from less than 500 feet near the updip limit of well
control to more than 1,100 feet in middip to downdip parts of the study area (Figure 5-1). Sand
deposition prograded gradually from landward (updip) areas to seaward (downdip areas), such

TWDB Report ##: Structure of the Yegua-Jackson Aquifer of the Texas Gulf Coastal Plain
5-3
that sand is present near the base of the layer in the outcrop area but overlies a progressively
thickening blanket of shale in the downdip direction (see section 14, Plate 7). Conversely, the
upper part of the layer is most shale-dominated in the updip area, with sand becoming
increasingly common toward the top of the layer farther downdip (see section 9, Plate 6). In a
strike orientation, sandy deposition was mostly pervasive in the Houston and Rio Grande
embayments and least concentrated over the San Marcos Arch.
Upper Yegua Layer
The boundary between the Yegua and Jackson intervals is expressed in well logs as a low-
resistivity shale, commonly above a 100 feet thick or thicker shaly section containing thin
interbedded sands of upward-decreasing thickness (see well DPB-13R, section 17, Plate 8). It
may also occur as a prominent break between upward-coarsening sands below and upward-fining
sands above. This surface often marks a boundary between sand-dominated deposition below
and shale-dominated deposition above (see well DP13-6, section 14, Plate 7).
The Upper Yegua Layer varies in thickness from less than 500 feet at the updip limit of well
control up to more than 1,200 feet at the downdip study edge (Figure 5-2). Sand deposition is
most prevalent in the middip to downdip parts of the study area. Shales in the updip area may
contain thin (5 feet) to thick (50 feet) upward-fining sand interbeds, whereas downdip shales
commonly occur in the upper part of the layer, may be several hundred feet thick, and may
contain thin (<10 feet thick) isolated sand interbeds (compare wells DP9-8R and DP9-12,
section 9, Plate 6). In a strike orientation, sandy deposition is significant in the Houston
embayment and in a part of the San Marcos Arch, but is pervasive in the Rio Grande
embayment.
Lower Jackson Layer
The upper boundary of the Lower Jackson Layer is a maximum flooding surface that commonly
lies above a 100 feet thick or thicker upward-fining silty shale and below 100 feet thick or
thicker sandy to silty shale. The boundary is often expressed in logs as a low-resistivity marker
overlain by an abrupt-based silt of very slightly higher resistivity than the underlying section (see
well DP3-8, section 4, Plate 4).

TWDB Report ##: Structure of the Yegua-Jackson Aquifer of the Texas Gulf Coastal Plain
5-4
Another significant maximum flooding surface with very low resistivity occurs locally within the
Lower Jackson Layer. This surface may have lower resistivity than either the top boundary of
the Upper Yegua Layer or the top boundary of the Lower Jackson Layer (see well DP3-8,
section 4, Plate 4). This surface might be mistaken for, or used by other workers as, the
maximum flooding surface marking the Yegua/Jackson formational boundary. However,
vertical distribution of sands across the study area is more effectively divided by the top Yegua
boundary as described herein.
The Lower Jackson Layer ranges in thickness from less than 400 feet at the updip limit of well
control to nearly 600 feet at the downdip edge of the study area (Figure 5-3). Sand is a minority
lithology in the Lower Jackson Layer and occurs in the lower part of the unit, rarely in updip
areas and more commonly in middip areas. Localized downdip areas are dominated by sand
deposition (see DP19-14, section 20, Plate 9). In strike orientation, sand deposition was minor in
the Houston embayment, almost nonexistent over the San Marcos Arch, and common in the Rio
Grande embayment (see Plate 18).
Upper Jackson Layer
The top of the Jackson Group is here taken as a maximum flooding surface below an upward-
coarsening interval containing thick (20 to 50 feet thick or more) abrupt-based sandstones
suggestive of fluvial incision surfaces. In the subsurface, the Jackson Group is overlain by the
Vicksburg Formation (Coleman, 1990). In the outcrop, the Jackson Group is considered to be
overlain by the Catahoula, which is a combination of the Vicksburg and Frio Formations
(Galloway, 1990) dominated by thick fluvial sands and gravels.
In well logs, the top of the Upper Jackson Layer is marked by low-resistivity shale above an
upward fining shale commonly exceeding 100 feet in thickness and often several hundred feet
thick (see wells DP13-9 and DPB-17, section 14, Plate 7). It is overlain by an upward
coarsening silty shale or abrupt-based sand. Where this surface occurs within a shale interval, it
is a distinct ‘neck’ on the logs, with a low resistivity combined with a pronounced shale response
on the spontaneous potential log (see DP16-6, section 17, Plate 8).
The Upper Jackson Layer varies in thickness from less than 500 feet at the updip limit of well
control to more than 1,000 feet at the downdip study edge (Figure 5-4). Shale dominates this
interval, with thin sands (most less than 30 feet thick) occurring in the middle or upper parts of
TWDB Report ##: Structure of the Yegua-Jackson Aquifer of the Texas Gulf Coastal Plain
5-5
the layer. In strike orientation, sands are uncommon in the Houston embayment, more common
over the San Marcos Arch, and are roughly equal to shales in abundance in the Rio Grande
embayment.
5.1.2 Minor Subdivisions The four major subdivisions of the Yegua-Jackson Aquifer defined above are at a scale
appropriate to regional numerical groundwater flow modeling. Previous work (Galloway and
others, 1991; Fang, 2000; and Harland and others, 1990) suggests that both the Yegua and
Jackson intervals each span a depositional period of about 2 to 3 million years (Figure 2-4 and
Figure 2-5), suggesting that the four major layers identified span roughly one million years each.
These are categorized as third-order depositional cycles; the controls on which are not well
understood. It is known that these longer cycles can be influenced by variations in the rate of
basin subsidence and sediment supply, as well as tectonically driven changes in global sea level.
However, periodicities of these factors are not well quantified.
Within each of the identified layers are depositional subcycles that are evident on a regional
scale. These subcycles are driven by fluctuations in global sea level that tend to have
periodicities ranging from 100,000 to 400,000 years (referred to as fourth-order cycles) down to
20,000 to 40,000 years (referred to as fifth-order cycles). Preliminary indications from
correlations within the study area suggest that the Lower Yegua Layer may have at least five
such cycles, the Upper Yegua Layer may have as many as three cycles, the Lower Jackson Layer
may have three cycles, and the Upper Jackson Layer may have as many as five such cycles.
These subcycles (fourth-order) are generally on the order of 100 feet thick, and change laterally
in lithologic character. Where subcycles are sand-rich, they might form individually traceable
features in outcrop such as a line of low sandy hills. Because surface mapping is dependent upon
lithology, lateral changes in sand content of two adjacent layers might cause miscorrelation at the
outcrop. In other words, surface mapping may follow a sand in one subcycle until it begins to
pinch out. If it is replaced laterally by a sand-rich interval in the subcycle above or below,
surface mapping might begin to follow this new sand as the boundary of the map unit, having
only a small discrepancy in stratigraphic position of one hundred feet or less. Thus do
lithostratigraphic boundaries come to cross or diverge from chronostratigraphic boundaries.

TWDB Report ##: Structure of the Yegua-Jackson Aquifer of the Texas Gulf Coastal Plain
5-6
Although these subcycles are thin in comparison to typical layers in current numerical
groundwater models, they are potentially separate flow units within an aquifer and are
consequently of note. In the future, given the increasing socioeconomic role of water resources,
models may require stratigraphic resolution consistent with these fourth-order
chronostratigraphic packages.
5.2 Structure The Yegua-Jackson Aquifer lies on the rim of the subsiding Gulf of Mexico basin. Aquifer
layers slope toward the coast (southeast) from the outcrop with dips gradually increasing toward
the coast. Large-scale tectonic features such as the Houston Embayment, San Marcos Arch, and
Rio Grande Embayment also impact dip. Dips are generally gentler in the embayments and
steeper across the arch. Dips steepen south of the Rio Grande Embayment, as indicated by the
narrowing of the outcrop belt near the Mexican border.
The overall gulfward-dipping layers of the Yegua-Jackson Aquifer are offset by normal faults
that trend parallel to the coast and are down-dropped to the southeast. Such faults in the Gulf
Coast are often ‘growth’ faults because faulting was active during deposition and sediment layers
can thicken dramatically across these features. In the Yegua-Jackson Aquifer, little mention is
made in the literature of significant expansion across growth faults. Offsets on down-to-the-
coast faults and minor growth faults can range from imperceptible to almost 1,000 feet (Quick
and others, 1977; Dodge and Posey, 1981; Figures 4-1 through 4-6). This pattern is locally
reversed by small up-to-the-coast faults with throws typically less than a few hundred feet (see
Figures 4-1 through 4-6).
Salt domes, diapirs, and other salt-related structures occur within the study area, but are
restricted to the Houston and Rio Grande Embayments. Another Gulf Coast feature which may
potentially have an impact on Yegua-Jackson structure is the Cretaceous shelf margin. This
margin had significant bathymetric relief prior to Tertiary clastic sedimentation. Sediment
loading and differential compaction across this boundary may result in faulting of the overlying
Tertiary section, which includes the Yegua-Jackson interval. In fact, many of the Yegua-Jackson
faults mapped in South Texas by Quick and others (1977) lie just south of this old shelf margin.
Plates 12 through 16 present structural information from this study as structural contour maps
(relative to sea level) for the:

TWDB Report ##: Structure of the Yegua-Jackson Aquifer of the Texas Gulf Coastal Plain
5-7
• Top of the Upper Jackson Layer
• Top of the Lower Jackson Layer
• Top of the Upper Yegua Layer
• Top of the Lower Yegua Layer, and
• Base of the Lower Yegua Layer (base of Yegua-Jackson Aquifer).
Interpreted measured depths to these surfaces in each well, along with the correlation certainty
grade (see Section 4.2.3) are provided in Appendix C. Data are machine contoured, with a
contour interval of 1,000 feet. Relevant fault traces and fault throw values from Quick and others
(1977) and fault intercepts and throws from Dodge and Posey (1981) are overlaid on the contour
maps. Additionally, the locations of salt features and the Cretaceous shelf edge from Salazar and
others (1997), who converted the Tectonic Map of Texas (Ewing, 1986) into digital GIS Format,
have been overlaid on the structure maps. Detailed, hand-drawn contour maps were precluded
by the data spacing of this study and the lack of published fault traces for the northern part of the
study area. Most of these mapped faults occur downdip of the outcrop, but where throws are
significant, faults may still have importance for hydrogeological modeling as fluid flow barriers
or baffles. Data spacing and computer contouring also precluded incorporation of salt-related
features into structure maps.
Structure contours are generally smooth and follow the directional trends of the outcrop belt.
Cross sections of the interpreted structure (Plates 3 through 11) demonstrate that layer
boundaries closely parallel one another except in far downdip parts of the study area where
thickening of layers results in divergence. Some up-to-the-coast faults, or small rollover
structures are indicated in cross sections. For example, in cross section 9 (Plate 6), structure
surfaces at well DP9-12 are shallower than at the updip neighbor, DP8-8. This can also be seen
as a data anomaly in all of the structure maps except that of the Base Yegua-Jackson Aquifer in
the southern part of Austin County. A significantly thickened stratigraphic interval in the updip
well, DP8-8, suggests the presence of a growth fault, with the downdip well, DP9-12 possibly
being located on the rollover anticline downdip of the main growth fault. Salt features also
affect the contours of each surface in the same location, as seen in southern Waller County on
Plates 12 through 16.

TWDB Report ##: Structure of the Yegua-Jackson Aquifer of the Texas Gulf Coastal Plain
5-8
In some cases, dips may flatten gradually or abruptly in the updip direction (see sections 3 and 6,
Plates 3 and 5, in contrast to sections 4 and 20, Plates 4 and 9). A general flattening of dip in the
direction away from a basin such as the Gulf of Mexico Basin is expected. The Earth’s crust is
pushed downward by the weight of sediment delivered by rivers to the margin of the basin. Dips
may increase from nearly flat away from the basin to slightly dipping at the basin margin,
becoming steeper below the area of major sediment accumulation. More abrupt changes in dip
on cross sections (Plates 4 and 9) may be a consequence of cross section construction. Where
wells are spaced farther apart, and dips between wells are simplified as straight lines, more
gentle curves are forced into just two line segments - one steeper and one shallower. Apparent
abrupt changes can also occur as a result of changes in the direction of cross section segments,
such as in cross section 20 (Plate 9). Here one cross section segment is aligned away from the
direction of dip, more closely paralleling strike, and consequently, creating the appearance of a
decreased dip.
Updip structure is important in placing the outcrop of a structural surface. Structure maps of the
five bounding surfaces used hand-drawn outcrop traces to define the elevation of the updip
termination. These outcrop traces were prepared on the basis of positions interpreted from
structural cross sections. Projection of surfaces from the last point of subsurface control to the
ground surface assumed reasonable dips as established by the two most updip wells correlated.
If flexures or faults occur in the outcrop area, this assumption may, locally, be invalid, leading to
minor errors in outcrop traces. A review of the geology map (Plate 2) shows no major faults.
However, abrupt lateral shifts of the outcrop boundaries perpendicular to trends, such as in La
Salle and Duval counties in the southern area, and at the junction of Houston, Leon, and Madison
counties in the northeastern area, suggest unrecognized folding or faulting, possibly including
subtle strike-slip faulting. Lateral motion along faults might be a consequence of movement of
deep salt or of subtle movement of transfer faults (Figure 2-1) that project onshore and produce
dispersed or discrete faulting. A strongly indented feature of the basal Yegua boundary in
Zapata County appears to be caused by a plunging fold axis. If such features exist in the outcrop
area, where the bulk of the Yegua-Jackson Aquifer is located, they may impact regional or
subregional fluid flow within the aquifer.
Projections of layer boundaries from the shallowest well intercept to outcrop were not bent or
forced to reach formation outcrop boundaries. As a consequence, discrepancies exist between

TWDB Report ##: Structure of the Yegua-Jackson Aquifer of the Texas Gulf Coastal Plain
5-9
outcrop boundaries from Barnes (1968a, 1968b, 1974a, 1974b, 1974c, 1975, 1976a, 1976b,
1976c, and 1992) and those used as surface elevations at layer boundary outcrops in structure
mapping for this study.
5.2.1 Comparison of Layer Boundary Outcrops and Formational Outcrops As just discussed, outcrop locations of chronostratigraphic surfaces bounding aquifer layers do
not always coincide with outcrop locations of lithostratigraphic formation boundaries of surface
geological mapping, such as in Barnes (1968a, 1968b, 1974a, 1974b, 1974c, 1975, 1976a, 1976b,
1976c, 1992). Reasons for this are associated with the different techniques used in surface
mapping (lithostratigraphy) and in the subsurface mapping of this study (chronostratigraphy).
Section 2.2.1 provides a more thorough discussion of this topic. Below are discussed the
variances between outcrop locations of the formation boundaries from geologic maps and
approximately equivalent layer boundaries from this study.
The chronostratigraphic Base Yegua surface (Bottom Yegua), as shown in cross sections
(Plates 3-11), occurs at or below the lithostratigraphic Base Yegua-Jackson Aquifer, and thus
commonly outcrops farther inland (north and west) than the base of the Yegua Formation (same
as Base Yegua-Jackson Aquifer) as mapped by Barnes (1968a, 1968b, 1974a, 1974b, 1974c,
1975, 1976a, 1976b, 1976c, 1992). The chronostratigraphic surface represents a maximum
flooding surface between the Sparta and Yegua depositional cycles and commonly occurs within
the shales of the Cook Mountain Formation. It is expressed in well logs in updip and middip
positions as a low resistivity, high spontaneous potential ‘neck’ overlying an upward-decreasing
resistivity profile (upward-fining grain size) and underlying an upward-increasing resistivity
profile (upward-coarsening) (for example, well DP2-7R on cross section 3, Plate 3). In South
Texas the interval between the chronostratigraphic Base Yegua and the Base Yegua-Jackson
Aquifer contains significant sands that are potentially water-bearing (see well DP19-7 on cross
section 20, Plate 9, and well Richardson McKendrick on cross section 24, Plate 10). These sands
were excluded from this study and thus lie between the Sparta and Yegua-Jackson Aquifers.
Any future reconsideration of existing formal aquifer boundaries might best place these sands in
the Yegua-Jackson Aquifer because they are probably most closely linked, hydrologically, with
this aquifer.

TWDB Report ##: Structure of the Yegua-Jackson Aquifer of the Texas Gulf Coastal Plain
5-10
The chronostratigraphic top of the Lower Yegua Layer typically outcrops at or below the middle
of the Yegua Formation as mapped by Barnes (1968a, 1968b, 1974a, 1974b, 1974c, 1975, 1976a,
1976b, 1976c, 1992), with the possible exception of far South Texas where it may occur within
the lower part of the Jackson Group (See cross section 29, Plate 11). However, dips in this
southern tip of the aquifer are steep, and well control is sparse, increasing uncertainty in
projection of boundaries from subsurface to outcrop.
The chronostratigraphic top of the Upper Yegua Layer outcrops in varying relationship to the
mapped lithostratigraphic Yegua/Jackson boundary of Barnes (1968a, 1968b, 1974a, 1974b,
1974c, 1975, 1976a, 1976b, 1976c, 1992). In East Texas it commonly lies below the top of the
Yegua Formation. In Central Texas it coincides often with either the base of the Caddell or base
of the Manning Formation. In South Texas the outcrop of the chronostratigraphic surface lies
within the upper part of the Yegua Formation or the lower part of the Jackson Group.
The top of the Lower Jackson Layer outcrops in varying relationship to boundaries of the
Jackson Group or Jackson formations as mapped by Barnes (1968a, 1968b, 1974a, 1974b, 1974c,
1975, 1976a, 1976b, 1976c, 1992). In East Texas the chronostratigraphic surface lies below the
base of the Yazoo Formation (lateral equivalent of the Wellborn and overlying Manning
Formations), or coincides variously with an interval from the base of the Caddell Formation to
the top of the Wellborn Formation. In Central Texas the outcrop coincides with the middle to
top of the Manning Formation. In South Texas the top of the Lower Jackson Layer lies within
the undivided Jackson Group outcrop, varying from the lower part to slightly above the middle
part of the Jackson Group.
The top of the Upper Jackson Layer, and consequently, the top of the Yegua-Jackson Aquifer,
generally corresponds to the top of the Jackson Group/base of the Catahoula Formation, as
mapped by Barnes (1968a, 1968b, 1974a, 1974b, 1974c, 1975, 1976a, 1976b, 1976c, 1992).
However, from the Brazos River eastward, the top of the upper aquifer layer diverges, varying
from a correspondence with the upper Manning to the lower Wellborn Formations, ultimately
returning to the top of the Jackson Group near the Texas/Louisiana border. In the water resource
report for Sabine and San Augustine counties, Anders (1967) states that it is not possible to
separate the Jackson from the overlying Vicksburg Formation, resulting in Vicksburg sediments
being mapped as part of the Jackson. Coleman (1990) correlated and mapped the Vicksburg
TWDB Report ##: Structure of the Yegua-Jackson Aquifer of the Texas Gulf Coastal Plain
5-11
Formation from South Texas to eastern Louisiana. Three wells in cross section 6 (Plate 5)
correspond with or are very near wells correlated by Coleman (1990). Her Top, Middle, and
Base Vicksburg chronostratigraphic surfaces appear slightly inconsistent with correlations
arising from this study (see cross section 6, Plate 5). To resolve inconsistencies, three major
flooding surfaces in the 1,000 feet of interval overlying the approximate Top Jackson were
correlated in wells throughout the eastern half of the study area. Results are shown in cross
sections 3, 4, 6, 9, 14, 17, and 20 (Plates 3 through 9) but are not recorded in the geodatabase
because of their preliminary nature. In sections 3, 4, and 6 (Plates 3 through 5), the
chronostratigraphic surface from this study that most often matches the Top Vicksburg of
Coleman (1990) projects to an outcrop location that closely corresponds with the Top Jackson
Group from Barnes (1968a, 1968b, 1974a, 1974b, 1974c, 1975, 1976a, 1976b, 1976c, 1992). A
maximum flooding surface several hundred feet above that surface projects to an outcrop
location at or near the top of the Catahoula Formation and lateral equivalents (for example, the
Frio Formation) in cross sections 6, 9, 14, 17, and 20 (Plates 5 through 9), and to a point below
the top of the Catahoula Formation in cross sections 3 and 4 (Plates 3 and 4).
The above discussion suggests that the Vicksburg Formation was mapped by Barnes (1968a,
1968b, 1974a, 1974b, 1974c, 1975, 1976a, 1976b, 1976c, 1992) as part of the Jackson Group
from approximately the Brazos River eastward and mapped as part of the Catahoula Formation
and lateral equivalents from the Brazos River southward. Inspection of Sheet 2 from Jackson
and Garner (1982), a map of environmental geology covering the northern part of the Yegua-
Jackson Aquifer outcrop, suggest that low sandy hills corresponding with the Whitsett Formation
of Barnes (1968a, 1968b, 1974a, 1974b, 1974c, 1975, 1976a, 1976b, 1976c, 1992) are
interrupted by the Brazos River and not exposed because of alluvial cover for more than
10 miles. Between the Brazos River and the Navasota River, to the north another 8 miles, the
area of expected Whitsett outcrop is a broad region of low sandy hills and the Whitsett/Catahoula
contact might be difficult to determine. North of the Navasota River, two distinct bands of sandy
hills emerge. The top of the Jackson Group as mapped by Barnes (1968a, 1968b, 1974a, 1974b,
1974c, 1975, 1976a, 1976b, 1976c, 1992) follows the southern hills, and the northern set of hills
corresponds with the chronostratigraphic top of the Upper Jackson Layer (Top Yegua-Jackson
Aquifer) from this study. This conflict between interpretations from this study and those of
Barnes (1968a, 1968b, 1974a, 1974b, 1974c, 1975, 1976a, 1976b, 1976c, 1992) are important,

TWDB Report ##: Structure of the Yegua-Jackson Aquifer of the Texas Gulf Coastal Plain
5-12
unexpected, and not resolvable within the scope of this study. Before this structural framework
of the Yegua-Jackson aquifer is incorporated into a numerical model, it is suggested that
sufficient investigation resolves stratigraphic inconsistencies and logically places the ‘region in
conflict’ within either the Yegua-Jackson Aquifer or the overlying Gulf Coast Aquifer.
In summary, the inconsistency described above and the potential explanation, related to
difficulties in surface mapping, highlight the reliance of surface mapping on lithostratigraphy
and the limitations of that mapping process induced by interruptions of surface exposures by
natural features and by alluvial cover. Additionally, across an outcrop belt spanning a broad
range of climates, key parameters used to locate formation boundaries, such as weathering relief,
may change, as indicated by Jackson and Garner (1982), furthering hindering uniform outcrop
boundaries.
It is important to realize that both surface-mapping and subsurface-mapping techniques have
limitations. Comparison of results from both techniques will often yield conflicts, small or large.
Consequently, although a chronostratigraphic framework for aquifers produces a better product
for incorporation into numerical groundwater models, some level of conflict with surface
mapping can be expected.
5.3 Lithology As discussed previously in Section 2.2.1, the Yegua-Jackson Aquifer is composed of interbedded
sand, silt, and clay. Sand-rich intervals form the high-conductivity framework of the aquifer, and
the percent of interbedded fine-grained material is critical to numerical modeling for
apportioning hydrologic properties across model grid cells. Mapping of both net sand thickness
and sand percent are used to evaluate the map-view distribution of aquifer properties.
Net sand values were determined as discussed in Section 4.4, and are listed by well and layer in
Appendix D. Net sand thickness and sand percent maps have been prepared for each of the four
aquifer layers. The distribution of sand for each layer and a comparison to distributions
determined by previous studies follows. Layers are addressed in the order of shallowest to
deepest (Upper Jackson through Lower Yegua).
Before this discussion however, it is important to note the capacity for sand quality to vary
across the breadth of the aquifer. Studies by Loucks and others (1986) suggest that the

TWDB Report ##: Structure of the Yegua-Jackson Aquifer of the Texas Gulf Coastal Plain
5-13
composition of sand grains changes from southeast Texas to South Texas. Bockoven (1985)
presents data specific to the Yegua, and Meckel (1993) summarized Yegua results from both
studies. Figure 5-5 provides a quartz-feldspar-lithic diagram presented in Meckel (1993). A
quartz-feldspar-lithic diagram is a ternary plotting technique used to classify clastic sedimentary
rocks. The percentage or feldspar, quartz, and lithic or rock fragments are plotted in these
diagrams. These diagrams help both classify sedimentary rocks but also provide a means to
study variability in sediment source. Ratios of quartz, feldspar, and rock fragments change
progressively from southeast Texas to South Texas. The dominant change is a reduction in
quartz content and an increase in feldspar and rock fragments in South Texas, most likely
associated with volcanism in the Big Bend area during deposition. The sand grain composition
is pertinent to aquifer studies because rock fragments, dominantly volcaniclastic grains, and
feldspar grains, are less physically and chemically stable than quartz. Even compaction from
shallow burial and chemical changes from early diagenesis can result in significant porosity loss
compared to more quartz-dominated sands, impacting both storativity and hydraulic
conductivity.
5.3.1 Upper Jackson Layer Net sand thickness values for the Upper Jackson Layer are posted with computer-generated
contours on Plate 17. Net sand thickness ranges from over 300 feet in two locations to 0 feet in
isolated or downdip areas in the south-central and northeastern parts of the study area.
5.3.1.1 Outcrop Region Sand thickness in the updip region, where fresh water is likely to be present, is greatest in north
Central Texas, in Grimes, Brazos, and Burleson counties, where sand thickness can exceed
300 feet. Mapping also suggests that thick sands may be encountered near the outcrop in far
southern Texas in Starr County. Intermediate sand thickness of 100 feet or more in the outcrop
region can be found Central Texas and slightly south, stretching from Fayette County
southeastward to McMullen County (Plate 17). Outcrop regions where less than 100 feet of sand
can reasonably be included East Texas (Sabine County westward to Trinity County), and South
Texas (southern McMullen County to Zapata and northern Starr counties). Thicker sands can be
found farther downdip in the latter area but are likely below any fresh water.

TWDB Report ##: Structure of the Yegua-Jackson Aquifer of the Texas Gulf Coastal Plain
5-14
Sand content of the Upper Jackson Layer (Figure 5-6) in the outcrop region exceeds 30 percent
in north Central Texas. Sand content in excess of 20 percent can be expected in the outcrop area
over a broad area from Walker County in the northeast to Live Oak County in the south.
5.3.1.2 General Study Area The area of thick sand in the northeast part of the study map extends from Walker County
through Grimes and southern Brazos counties. The sand thins rapidly from over 300 feet at the
northern edge of data control near the outcrop to less than 100 feet at about 20 miles downdip of
the outcrop. Sand thickness then tapers more slowly to ‘0’ values at a line running from central
Tyler County through northern Liberty and northern Harris County. Areas of thicker sand,
greater than 100 feet thick, occur in patches south of the main northeast accumulation. One such
patch extends from southern Austin County to northern Ft. Bend County, trending southeast.
Another region trends southward to southwestward from southern Colorado County to southern
DeWitt County.
An area of sand accumulation greater than 100 feet, and locally perhaps more than 200 feet thick,
extends southwest along the outcrop belt from northeast Fayette County to central Karnes
County. This trend turns more southerly in Karnes County, extending to central Duval County.
Wells between this southerly trend and the outcrop belt contain markedly less sand, with
thickness of 40 feet or less.
A southern area of thick sand accumulation occurs downdip of outcrops in Starr and Hidalgo
counties. Mapping suggests that a large area of sand thickness greater than 150 feet exists across
these counties, extending to include the southern edge of Brooks County. One well near the
center of Jim Hogg County with over 150 feet of sand may indicate that a northern branch of this
‘southern’ thick. This indication is supported by a sand thickness map for the whole Jackson
from Fisher and others (1970). The Fisher and others (1970) map further suggests that this
branch of the ‘southern’ thick is continuous in central Duval County, a region of data paucity in
this study.
With the exceptions noted above, sand accumulations generally thin downdip (southeastward)
away from the outcrop, with an absence of sand recorded in wells from northern Goliad through
southern Live Oak counties. An absence of sand is also noted in some updip locations near the
outcrop, such as in southeastern Webb County.

TWDB Report ##: Structure of the Yegua-Jackson Aquifer of the Texas Gulf Coastal Plain
5-15
The percent-sand map for the Upper Jackson Layer (Figure 5-6) shows that even in areas of
significant sand thickness, sand is only slightly more than 30 percent of the interval. In some
cases the associated fine-grained material occurs as layers more than 100 feet thick (see well
DP16-6, section 17, Plate 8), but in other areas fine material occurs interspersed with sand (see
well DP23-7, section 29, Plate 11).
Figure 5-6 contains annotations (arrows) taken from Fisher and others (1970) indicating
interpreted axes of fluvial sediment input for the combined upper and Lower Jackson. Larger
arrows indicate major inputs. These fluvial axes correspond to areas of thick sand accumulation,
although axes in the northeastern part of the study area tend to correspond with southeast
trending areas of thickness, whereas those in the southern half of the study area correspond with
more south- to slightly southwest-trending areas of thickness.
5.3.2 Lower Jackson Layer Net sand thickness values for the Lower Jackson Layer are posted with computer-generated
contours on Plate 18. Net sand thickness ranges from almost 300 feet in one area to 0 feet in
much of the downdip (southeast) extent of the study area. Thickest sand accumulations occur in
the south-central and southern part of the study area.
5.3.2.1 Outcrop Region Sand thickness of the Lower Jackson Layer in the outcrop region is less than that of the Upper
Jackson Layer, and is more erratically distributed (Plate 18). Areas where sand thickness
exceeds 100 feet include: (1) northern Central Texas, in Grimes, southern Burleson, northern
Washington, and northeastern Fayette counties; (2) Central Texas, in eastern Gonzales and
northern Karnes counties; southern Central Texas, along the boundaries of Atascosa and Live
Oak counties and perhaps in southern central McMullen County; and South Texas, in
southeastern Webb County, around the junction of Webb, Zapata, and Jim Hogg counties,
southeastern Zapata County, and southwestern Starr County.
Sand content in the Lower Jackson Layer (Figure 5-7) can exceed 30 percent in the areas of thick
sand accumulation described above. Values above 20 percent are more common in these thick
sand areas, and additionally in a region of thinner sand in Trinity County. Regions of less than
10 percent sand are small and include, in South Texas, eastern Webb/western Duval counties,
and in East Texas, the area surrounding the junction of Angelina, Trinity, and Polk counties.

TWDB Report ##: Structure of the Yegua-Jackson Aquifer of the Texas Gulf Coastal Plain
5-16
5.3.2.2 General Study Area In the northeastern part of the study area, two isolated areas of sand thickness exceeding 150 feet
occur in Washington County and around the intersection of Montgomery, Walker, and Grimes
counties. Each is surrounded by county-sized regions where sand thickness exceeds 50 feet. In
the central and southern part of the study area, three regions of thickness reaching or exceeding
200 feet occur in: central Live Oak County; near the junction of Live Oak, Duval, and McMullen
counties; and in the southern parts of Starr and Hidalgo counties. These thick sand
accumulations are surrounded by narrow regions where sand thickness exceeds 50 feet. These
regions extend southward from Lavaca and Gonzales counties to western Jim Wells County.
The region turns abruptly, heading southeast from southern Jim Wells to southern Starr and
Hidalgo counties. It should be noted that areas of sand accumulation less than 50 lie between the
south-trending sand thick and the outcrop.
The percent-sand map for the Lower Jackson Layer (Figure 5-7) shows that maximum sand
percentage exceeds 40 percent in only one small area, and is generally between 20 and 40
percent in areas of thick sand accumulation discussed previously. Fine-grained material (silt and
clay) occur in the Lower Jackson as layers 300 feet or more thick, in some cases overlying a
thick sand at the base of the layer (see well DP9-8R, section 9, Plate 6). Non-sand intervals
greater than 200 feet thick may also encase a significant sand, as seen in well DP13-6 where a
sand at the top of the Lower Jackson is underlain by Lower Jackson mud/shale and overlain by
mud/shale of the Upper Jackson (see section 14, Plate 7). In areas of highest sand percentage,
muds/shales occur as beds less than 30 feet thick between sands (see well DP19-14, section 20,
Plate 9).
Generalized fluvial axes from Fisher and others (1970) for the combined upper and lower
Jackson do not match Lower Jackson sand thicknesses (Figure 5-7) as well as they match Upper
Jackson sands (Figure 5-6). Large input axes in Fayette and La Salle counties do not appear to
be associated with significant Lower Jackson sand accumulations. A major axis in Wilson
County and lesser axes in Atascosa and Wilson counties appear to connect to the most significant
Lower Jackson sand-rich areas. The southern-most sand-rich area, in Starr and Hidalgo counties,
might be fed by an undocumented axis in Starr County and southern Mexico.

TWDB Report ##: Structure of the Yegua-Jackson Aquifer of the Texas Gulf Coastal Plain
5-17
5.3.3 Upper Yegua Layer Net sand thickness values for the Upper Yegua Layer are posted with computer-generated
contours on Plate 19. Net sand thickness exceeds 400 feet in small areas, and is greater than
100 feet across approximately one-half of the study area. Absence of sand occurs rarely in the
outcrop area, but is more widespread in the downdip region, at the southeast edge of the central
and southern parts of the study area.
5.3.3.1 Outcrop Region Sand thickness of the Upper Yegua Layer in the outcrop region is greatest in narrow regions of
McMullen, southeastern Webb, eastern Zapata, and southwestern Starr counties, likely exceeding
300 feet and locally reaching nearly 500 feet (Plate 19). Sand thickness commonly exceeds
100 feet over most of the outcrop region with the exception of Trinity, McMullen, Webb, and
northern Zapata counties.
Sand content in the Upper Yegua Layer (Figure 5-8) commonly exceeds 20 percent in areas of
thick sand accumulation mentioned above, being less than 20 percent elsewhere along the
outcrop. Locally, sand percent exceeds 40 in eastern Angelina, southern Brazos and Burleson,
Gonzales and eastern Fayette, and McMullen counties.
5.3.3.2 General Study Area In the northeastern part of the study area, a large region exists where sand accumulation exceeds
200 feet. This region trends southwestward from Polk through Austin counties, reaching a
maximum of more than 400 feet near the junction of Liberty, Montgomery, and San Jacinto
counties. Most of the northeastern part of the study area contains more than 100 feet of
accumulated sand. Areas of less than 100 feet sand thickness occur updip (northwest) of the
large area of thick accumulation, and may extend to the outcrop. These (relatively) sand-poor
areas include regions: from central Brazos County through Grimes and into Waller counties; a
north-south oriented zone in Trinity County extending into Polk County; and an area surrounding
the junction of San Augustine, Angelina, Tyler, and Jasper counties.
In the central and southern parts of the study area, a long southwest-trending region of more than
100 feet of sand thickness extends from outcrops in Gonzales and Fayette counties through
Zapata and Webb counties. This region contains large areas exceeding 200 feet in sand
thickness, with localized areas exceeding 400 feet. Thicknesses decrease toward the outcrop

TWDB Report ##: Structure of the Yegua-Jackson Aquifer of the Texas Gulf Coastal Plain
5-18
belt, to the northwest, with sand being absent in parts of Webb and Zapata counties. Another
area of thick sand accumulation in this part of the study area extends east or southeast from Starr
County to Hidalgo County where sand thickness is greater than 200 feet and locally reaches
575 feet.
The percent-sand map for the Upper Yegua Layer (Figure 5-8) shows that maximum sand
percentage exceeds 60 percent in a small area near the outcrop in southern Houston County, but
elsewhere is generally between 20 and 50 percent in the previously noted areas of thick sand
accumulation. Intervals of fine-grained sediments in the Upper Yegua occur as layers as thick as
200 feet that can encase sands (see well DP22-13, section 24, Plate 10). Fines also occur as thin
layers less than a few tens of feet thick interbedded with high-quality sands (see well DP19-14,
section 20, Plate 9).
Arrows on Figure 5-8 represent fluvial axes for the Upper Yegua Formation compiled from
Meckel (1993). One large axis in the north corresponds with the high percent-sand area of
Houston County. Other major inputs correspond to thick sandy areas in Fayette/Lavaca and in
Wilson/Karnes counties. Other lesser inputs occur updip of sand-rich trends that are separated
from the outcrop by sand-poor regions. This suggests that narrow sand-rich areas in these
regions may not have been encountered and mapped because of the sparser data coverage of this
study compared to that of Meckel (1993).
5.3.4 Lower Yegua Layer Net sand thickness values for the Lower Yegua Layer are posted with computer-generated
contours on Plate 20. Net sand thickness exceeds 400 feet in small areas, and is greater than
100 feet across three-quarters of the study area. Absence of sand occurs rarely in the outcrop
area, but is more broadly distributed downdip at the southeast edge of the central and southern
parts of the study area.
5.3.4.1 Outcrop Region Sand thickness of the Lower Yegua Layer in the outcrop region is generally greater than 100 feet
(Plate 20), except in northern Central Texas (Burleson, Lee, and eastern Fayette counties). Sand
thickness exceeds 200 feet in isolated areas of East Texas (San Augustine and Trinity counties).
Values also exceed 200 feet in Central Texas, in Fayette County, and over about one third of the
outcrop area south of Karnes County. Thicknesses approaching or exceeding 300 feet in South

TWDB Report ##: Structure of the Yegua-Jackson Aquifer of the Texas Gulf Coastal Plain
5-19
Texas include LaSalle, southern McMullen, eastern Webb, eastern Zapata, and western Starr
counties (Plate 20).
Sand content in the Lower Yegua Layer (Figure 5-9) exceeds 20 percent over much of the
outcrop area with the exception of small areas in Central and South Texas. One area of greater
than 40 percent sand occur in East Texas from the Louisiana border westward to Brazos County,
with values in Madison County that exceed 80 percent. A region of more than 40 percent sand
occurs in Central Texas, from Fayette County south to Wilson and Live Oak counties – peak
values here exceed 60 percent. Isolated areas of more than 40 percent sand also occur in eastern
Webb and southwestern Starr counties.
5.3.4.2 General Study Area A great majority of the northeastern half of the study area contains more than 100 feet of sand
thickness, with a small area of less than 100 feet thickness extends southwest from Burleson
County to the southern-central area of Fayette County. A small region of greater than 200 feet of
sand occurs in Houston, Walker, Trinity, and Polk counties, and includes a value of almost
400 feet of sand encountered in one well. In Polk County, a much larger region of sand
thickness in excess of 200 feet covers about one-half of the northeastern half of the study area
just downdip (southeastward) of the outcrop. This region extends from northern Jasper County
southwest to the boundary of Lavaca and Colorado counties. Within this region are small to
moderately sized areas where thickness exceeds 300 feet, reaching almost 400 feet in some
wells. These areas are located in Tyler and Jasper counties, and dotted across Montgomery,
Waller, Austin, and Colorado counties.
In the central and southern half of the study area, a broad southwest-trending region of more than
100 feet of sand thickness covers the updip half, or more, of the area. Only small areas of less
than 100 feet of sand occur within this region, in Dimmit, Webb, and Zapata counties. Several
large subregions occur within the larger region of thick sand accumulation in which thickness
exceeds 200 feet, with some large areas exceeding 300 feet. These subregions include: (1) an
area along the outcrop belt from Gonzales County to central Live Oak County; (2) a large area
from southern La Salle, McMullen, and Live Oak counties that extends south to southeastern
Webb County, and then turns west, intercepting the outcrop in southern Webb County (one well
within this area contains over 400 feet of sand); (3) a small area in central Zapata County;

TWDB Report ##: Structure of the Yegua-Jackson Aquifer of the Texas Gulf Coastal Plain
5-20
(4) small areas in northwestern and southwestern Starr County, with one well having greater than
600 feet of sand; and (5) an area along the Starr/Hidalgo County border. An area of less than
100 feet thickness lies downdip of the sand-thick trend, extending along a line from central Starr
County through southeast Live Oak County and up to the southern half of Lavaca County.
Southwest of this line, sand thicknesses quickly decrease to zero.
The percent-sand map for the Lower Yegua Layer (Figure 5-9) shows that, in the downdip area,
maximum sand percentage often exceeds 40 percent in the previously noted areas of thick sand
accumulation with many small isolated areas of greater than 60 percent sand. Fine-grained
material (silt and mud) occurs as a layer up to 100 feet thick between or above Lower Yegua
sands (see well DP2-7R, section 3, Plate 3, well DP5-8, section 6, Plate 5, and well DP22-13,
section 24, Plate 10), and as thin layers less than 30 feet thick between good sands or as even
thinner silty layers interbedded with thin sands (see Richardson well, section 24, Plate 10).
Fluvial axes specific to the Lower Yegua (arrows, Figure 5-9) were compiled from Meckel
(1993). Major axes exist across the study area, including the northern area (Nacogdoches
County), southern central area (Atascosa County) and southern area (central Webb County).
However, many large sand-rich areas correspond best to collections of lesser axes, such as in the
Houston/Leon County area. A small axis noted by Meckel (1993) corresponds with a localized
sand thick in this study at the Starr/Hidalgo County border that is not mentioned by previous
workers.
5.4 Depositional Systems Net sand thickness and sand percent provide information regarding the distribution of sand
within an aquifer layer. However, parameters such as conductivity (vertical and horizontal) and
storativity are not uniform for all sand in a given aquifer layer. These hydrologic characteristics
are a function of the grain size, sorting, mineralogy, and degree of interbedding or
interlamination of silt and clay. These properties are dependent on the sediment source area and
the energy of the depositional setting. For example, sand from a given source area that is
deposited in a fluvial environment will have a relatively coarse grain size, moderate sorting, and
a moderate amount of interbedded fine material. It will have good storativity and a high contrast
between vertical and horizontal hydraulic conductivity. Whereas, sand from the same source
area that is deposited in a barrier bar/strandplain setting might have a finer grain size, but has

TWDB Report ##: Structure of the Yegua-Jackson Aquifer of the Texas Gulf Coastal Plain
5-21
better sorting, fewer compactable grains, and far fewer interbedded silt and clay layers, resulting
in better aquifer characteristics. It will have good to very good storativity and a low contrast
between vertical and horizontal conductivity. Thus, a modification of aquifer characteristics on
the basis of depositional facies may improve the accuracy of the resulting numerical model.
Depositional facies for each aquifer layer are discussed in the following sections, in the order in
which the layers were deposited (Lower Yegua through Upper Jackson). Interpretation of facies
at each wellbore was based on log curve shape and was generalized for the layer. This
generalization must be done because a layer may contain many sand bodies, each deposited in
different settings. In this case, a well is assigned the facies that is most abundant in the mapped
layer at that well. Facies boundaries are hand-drawn based upon facies and log curve profiles in
individual wells and surrounding wells, in addition to sand thickness trends. Facies boundaries
may often follow sand thickness contours, such as when distinguishing between proximal and
distal deltaic settings. However, if, during creation of an overall understanding of the deposition
of a layer, computer-generated sand thickness contours appear inconsistent with the depositional
model, they are disregarded for the purposes of mapping facies boundaries.
5.4.1 Lower Yegua Layer In the updip regions (northwestern edge of study area) log curves are dominated by upward-
fining sands and shaly intervals containing thin spikey sands and silts. Along the middle region
of the study area, log curves contain a mixture of upward-fining and upward coarsening sands,
but upward coarsening sands dominate. In parts of this region, spontaneous potential curves
appear blocky and the corresponding resistivity curve increases upward (upward-coarsening) or
is also blocky. In mud-rich interval of the downdip region (southeast) of the study area, sand is
generally absent, replaced by thin silt beds. In some downdip areas, thick upward-coarsening to
blocky sands occur.
The interpreted facies map for the Lower Yegua Layer is shown in Figure 5-10. Updip sand-rich
intervals dominated by upward-fining sands are interpreted as dip-oriented fluvial deposits.
Intervening areas of less than 100 feet of sand are marginal to these fluvial axes and are here
considered floodplain deposits, even though these areas may contain some individual thick
upward-fining fluvial sand bodies. Sand-rich regions across the middle of the study area that are
dominated by upward coarsening or blocky sand bodies are interpreted as deltaic facies fed by

TWDB Report ##: Structure of the Yegua-Jackson Aquifer of the Texas Gulf Coastal Plain
5-22
updip fluvial systems. In the northern and southern part of the study area, these deltas prograde
out to the shelf-edge position as interpreted by Galloway and others (1983). Areas between the
fluvial deposits and the shelf edge that contain less than 100 feet of net sand are interpreted as
delta margin deposits. The area downdip of the shelf edge is dominated by shale, but a sandy
interval in a well in South Texas contains an upward-fining sand body approximately 100 feet
thick. This suggests that sandy sediment bypassed the deltas and was carried by channels across
the slope.
5.4.2 Upper Yegua Layer In the updip regions of the Upper Yegua Layer, log curves are again dominated by upward-fining
sands and shaly intervals containing thin spikey sands and silts. Along the axis of the study area,
as in the Lower Yegua Layer, log curves contain a mixture of upward-fining and upward
coarsening sands, but upward coarsening sands dominate. In parts of this region, spontaneous
potential curves appear blocky and the corresponding resistivity curve increases upward
(upward-coarsening) or is also blocky (this shape is very common in the southern part of the
Upper Yegua Layer). In mud-rich intervals of the downdip region (southeast) of the study area,
net sand thickness is markedly decreased, and log curves indicate the presence of shale and thin
(10–30 feet thick) sands that are symmetrical, upward coarsening, or upward fining. In downdip
regions in the northern and southern parts of the study area, thick upward-coarsening to blocky
sands and thick, overall upward coarsening intervals of interbedded sand and shale occur.
The interpreted facies map for the Upper Yegua Layer is shown in Figure 5-11. As in the Lower
Yegua, updip regions are interpreted as fluvial axes separated by floodplain deposits (defined as
having less than 100 feet of net sand). Sand-rich regions across the middle of the study area are
interpreted as deltaic deposits fed by the updip fluvial systems. Deltaic centers in the southern
part of the study area are likely more wave-dominated as suggested by strike alignment and the
dominance of blocky sand bodies. Thick sand accumulations at the shelf edge containing blocky
sands or interbedded sand and shale are interpreted as shelf-edge deltas constructed as deltas
built to the shelf edge. These deltas received sustained volumes of sediment, resulting in
aggradational stacking of sand as delta progradation was slowed by having to fill increasing
depths of water on the slope. It is extremely likely, assuming the shelf-edge position is accurate,
that abundant sand bypassed deltas near the shelf edge and was deposited on, and carried across,
the slope.

TWDB Report ##: Structure of the Yegua-Jackson Aquifer of the Texas Gulf Coastal Plain
5-23
5.4.3 Lower Jackson Layer In the updip regions of the Lower Jackson Layer, log curves are again dominated by upward-
fining sands and shaly intervals containing thin spikey sands and silts. Along the axis of the
study area, as in the Yegua layers, log curves contain a mixture of upward-fining and upward
coarsening sands, but upward coarsening sands dominate. In parts of this region, spontaneous
potential curves appear blocky and the corresponding resistivity curve increases upward
(upward-coarsening) or is also blocky (this shape is very common in the southern part of the
Upper Yegua Layer). In mud-rich intervals of the downdip region (southeast) of the study area,
sand is nearly absent, and intervals contain thick shales with thin silt beds. In downdip regions
in the southern part of the study area, thick upward-coarsening to blocky sands and thick, overall
upward coarsening intervals of interbedded sand and shale occur in a few wells.
The interpreted facies map for the Upper Yegua Layer is shown in Figure 5-12. As in the Yegua,
updip regions are interpreted as fluvial axes separated by floodplain deposits (defined as having
less than 50 feet of net sand). Sand-rich regions across the middle of the study area are
interpreted as deltaic deposits fed by the updip fluvial systems. Areas between fluvial axes,
updip of deltaic settings, but containing less than 50 feet of net sand and dominated by thin
upward-coarsening sands were interpreted as delta margins. Areas downdip of deltaic regions
and containing from less than 50 feet of net sand to zero sand are interpreted as distal deltaic
facies. Deltaic centers in the southern part of the study area have been interpreted by Fisher and
others (1970) as being more wave-dominated deltas, or even strandplain/barrier bar systems, as
suggested by strike alignment and the dominance of blocky sand bodies. A similar interpretation
is made here, and it is noted that more strike-aligned sandbodies result in thinning or decrease of
sand in the outcrop direction. Downdip shale dominated intervals are more abundant in the
Lower Jackson than in either of the Yegua layers, indicating a significantly higher relative sea
level, possibly related to decreased sediment supply. Thick sand accumulations at the shelf edge
containing blocky sands or interbedded sand and shale are again interpreted as shelf-edge deltas,
which feed sand down across the slope in narrow dip-oriented channels.
5.4.4 Upper Jackson Layer In the updip regions of the Upper Jackson Layer, log curves are again dominated by upward-
fining sands and shaly intervals containing thin spikey sands and silts. In middip regions of the
study area, as in the Yegua layers, log curves contain a mixture of upward-fining and upward
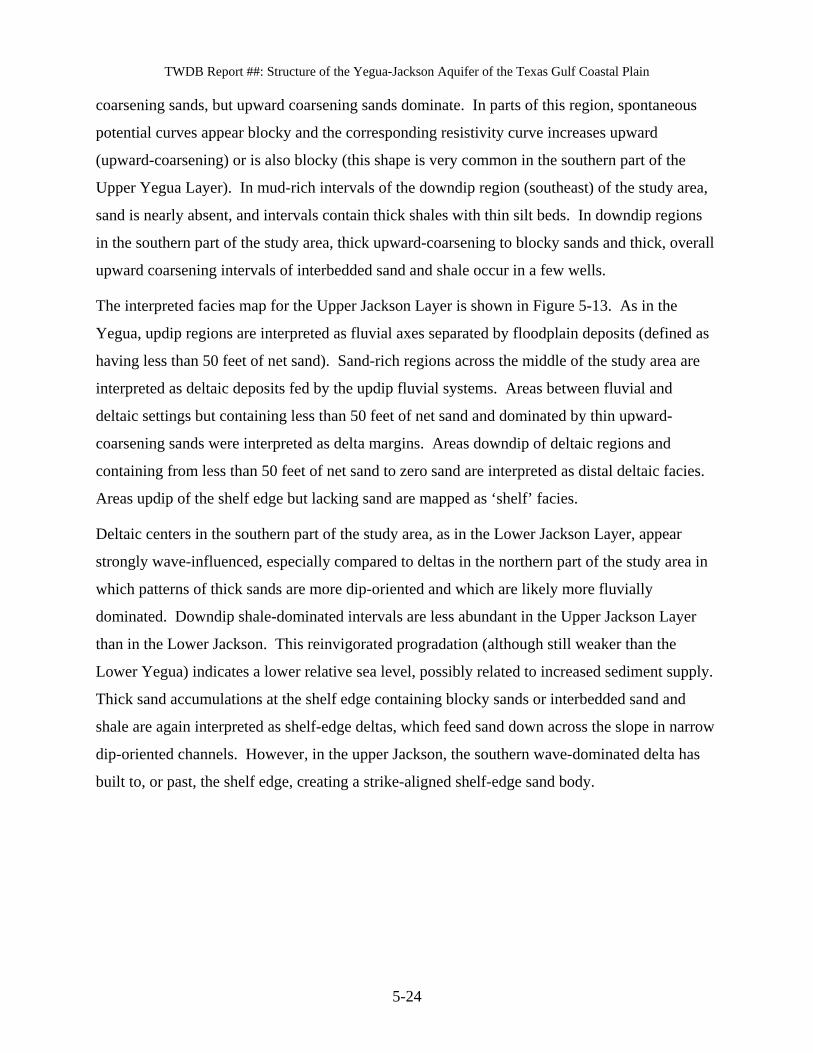
TWDB Report ##: Structure of the Yegua-Jackson Aquifer of the Texas Gulf Coastal Plain
5-24
coarsening sands, but upward coarsening sands dominate. In parts of this region, spontaneous
potential curves appear blocky and the corresponding resistivity curve increases upward
(upward-coarsening) or is also blocky (this shape is very common in the southern part of the
Upper Yegua Layer). In mud-rich intervals of the downdip region (southeast) of the study area,
sand is nearly absent, and intervals contain thick shales with thin silt beds. In downdip regions
in the southern part of the study area, thick upward-coarsening to blocky sands and thick, overall
upward coarsening intervals of interbedded sand and shale occur in a few wells.
The interpreted facies map for the Upper Jackson Layer is shown in Figure 5-13. As in the
Yegua, updip regions are interpreted as fluvial axes separated by floodplain deposits (defined as
having less than 50 feet of net sand). Sand-rich regions across the middle of the study area are
interpreted as deltaic deposits fed by the updip fluvial systems. Areas between fluvial and
deltaic settings but containing less than 50 feet of net sand and dominated by thin upward-
coarsening sands were interpreted as delta margins. Areas downdip of deltaic regions and
containing from less than 50 feet of net sand to zero sand are interpreted as distal deltaic facies.
Areas updip of the shelf edge but lacking sand are mapped as ‘shelf’ facies.
Deltaic centers in the southern part of the study area, as in the Lower Jackson Layer, appear
strongly wave-influenced, especially compared to deltas in the northern part of the study area in
which patterns of thick sands are more dip-oriented and which are likely more fluvially
dominated. Downdip shale-dominated intervals are less abundant in the Upper Jackson Layer
than in the Lower Jackson. This reinvigorated progradation (although still weaker than the
Lower Yegua) indicates a lower relative sea level, possibly related to increased sediment supply.
Thick sand accumulations at the shelf edge containing blocky sands or interbedded sand and
shale are again interpreted as shelf-edge deltas, which feed sand down across the slope in narrow
dip-oriented channels. However, in the upper Jackson, the southern wave-dominated delta has
built to, or past, the shelf edge, creating a strike-aligned shelf-edge sand body.

TWDB Report ##: Structure of the Yegua-Jackson Aquifer of the Texas Gulf Coastal Plain
5-25
LegendState LineShelf EdgeYegua-Jackson outcropCounty BoundariesWell Locations
Lower Yegua Isopach (ft)10 - 250251 - 500501 - 750751 - 1,0001,001 - 1,2501,251 - 1,500
0 40 8020Miles
Sediment Input Axis(Size Relative to Sed. Vol.)
Figure 5-1. Lower Yegua isopach map.
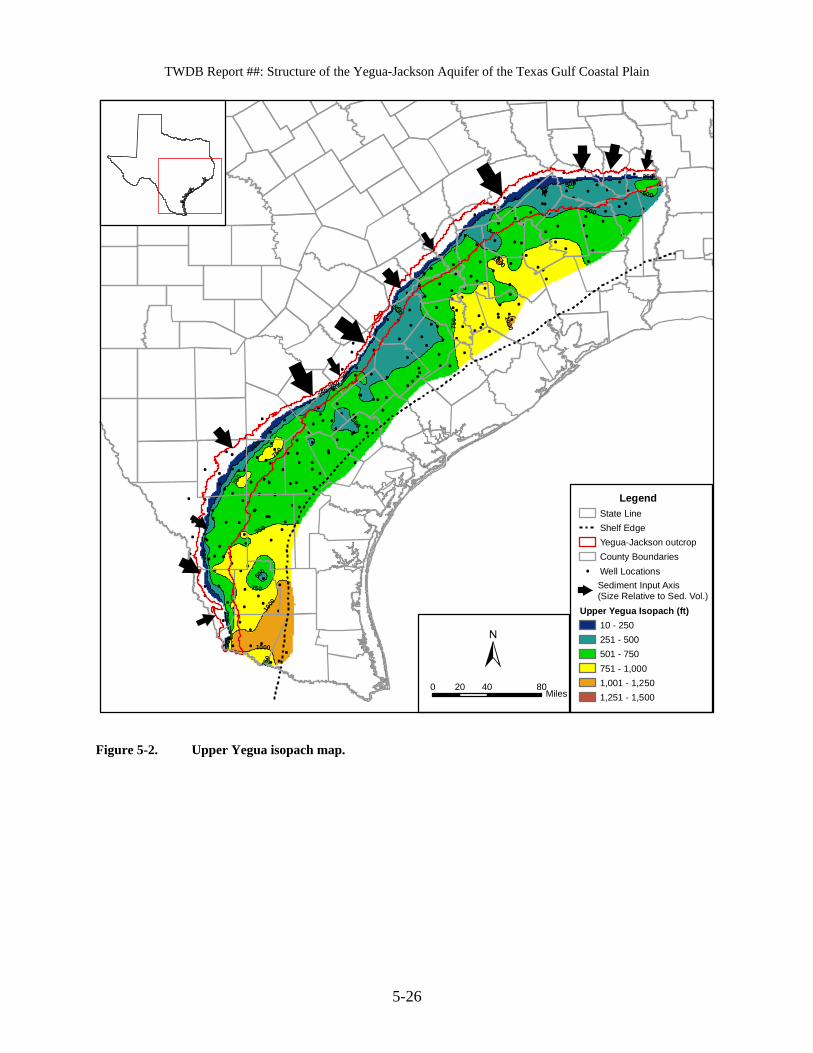
TWDB Report ##: Structure of the Yegua-Jackson Aquifer of the Texas Gulf Coastal Plain
5-26
750
250
1000
500
250
500
500
250
750
750
250
250
1000
750
750
1000
500
500
250
500
250
1000
750
250
500
LegendState LineShelf EdgeYegua-Jackson outcropCounty BoundariesWell Locations
Upper Yegua Isopach (ft)10 - 250251 - 500501 - 750751 - 1,0001,001 - 1,2501,251 - 1,500
0 40 8020Miles
Sediment Input Axis(Size Relative to Sed. Vol.)
Figure 5-2. Upper Yegua isopach map.
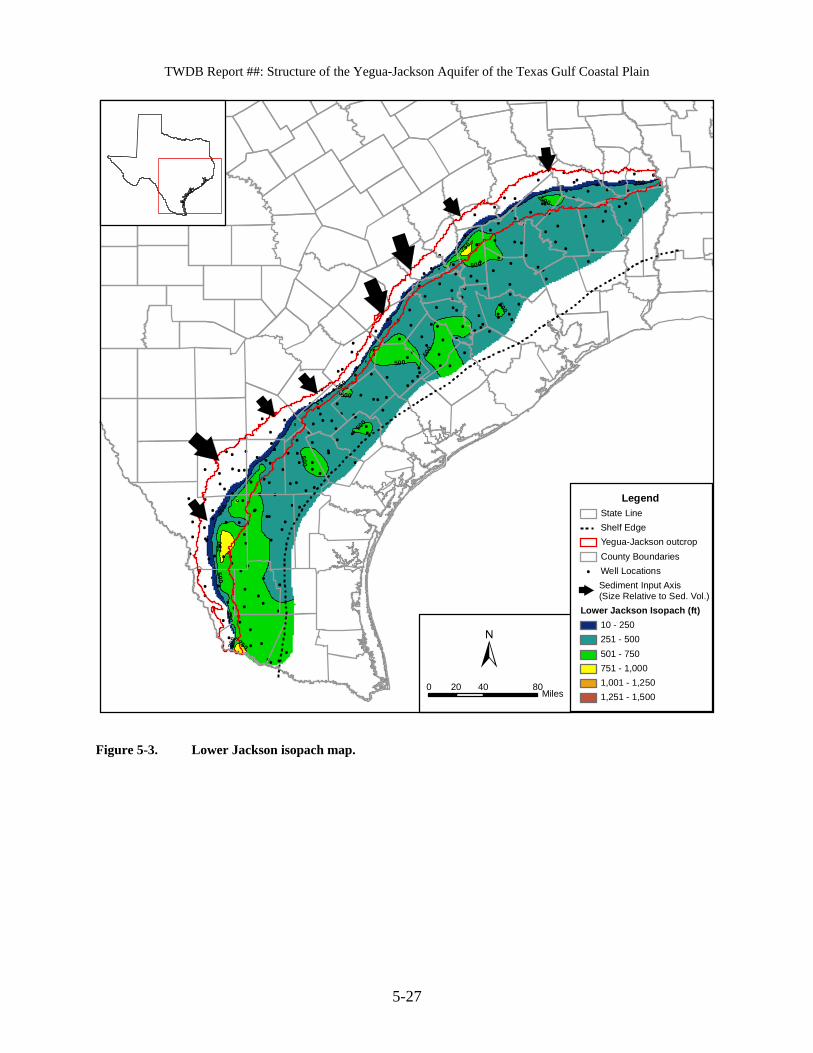
TWDB Report ##: Structure of the Yegua-Jackson Aquifer of the Texas Gulf Coastal Plain
5-27
250
500
750
750
500
500
500
500
750
250
500
500
250
250
250
500
500
LegendState LineShelf EdgeYegua-Jackson outcropCounty BoundariesWell Locations
Lower Jackson Isopach (ft)10 - 250251 - 500501 - 750751 - 1,0001,001 - 1,2501,251 - 1,500
0 40 8020Miles
Sediment Input Axis(Size Relative to Sed. Vol.)
Figure 5-3. Lower Jackson isopach map.

TWDB Report ##: Structure of the Yegua-Jackson Aquifer of the Texas Gulf Coastal Plain
5-28
1250
1500
1000
250
750
500
250
500
1250
750
250
250
1000
750
1000
250
250
250
250
LegendState LineShelf EdgeYegua-Jackson outcropCounty BoundariesWell Locations
Upper Jackson Isopach (ft)10 - 250251 - 500501 - 750751 - 1,0001,001 - 1,2501,251 - 1,5001,501 - 1,7501,751 - 2,000
0 40 8020Miles
Sediment Input Axis(Size Relative to Sed. Vol.)
Figure 5-4. Upper Jackson isopach map.

TWDB Report ##: Structure of the Yegua-Jackson Aquifer of the Texas Gulf Coastal Plain
5-29
Figure 5-5. Quartz-Feldspar-Lithic diagram showing sand grain composition for samples in the Yegua-Jackson Aquifer (after Meckel), 1993. Original data from Bockoven (1985) and Loucks and others (1986).

TWDB Report ##: Structure of the Yegua-Jackson Aquifer of the Texas Gulf Coastal Plain
5-30
0.30.4
0.1
0
0.2
0.2
0.1
0.3
0.1
0.1
0.20.2
0
0 0
0
0.1
0.2
0.1
0
0
0
0.1
0.2
0.2
0 40 8020Miles
LegendState LineShelf EdgeYegua-Jackson outcropCounty BoundariesWell Locations
Upper Jackson - Sand Percent0
0-1010-2020-3030-4040-5050-60
Sediment Input Axis(Size Relative to Sed. Vol.)
Figure 5-6. Upper Jackson sand percent map.

TWDB Report ##: Structure of the Yegua-Jackson Aquifer of the Texas Gulf Coastal Plain
5-31
0.4
0.5
0
0.3
0.1
0.2
0
0.4
0.2
0.3
0
0.3
0
0.1
0
0.2
0.3
0.3
0.30
0.30.2
LegendState LineShelf EdgeYegua-Jackson outcropCounty BoundariesWell Locations
Lower Jackson - Sand Percent0
0-1010-2020-3030-4040-5050-60
0 40 8020Miles
Sediment Input Axis(Size Relative to Sed. Vol.)
Figure 5-7. Lower Jackson sand percent map.

TWDB Report ##: Structure of the Yegua-Jackson Aquifer of the Texas Gulf Coastal Plain
5-32
LegendState LineShelf EdgeYegua-Jackson outcropCounty BoundariesWell Locations
Upper Yegua - Sand Percent0
0-2020-4040-6060-8080-100
0 40 8020Miles
Sediment Input Axis(Size Relative to Sed. Vol.)
Figure 5-8. Upper Yegua sand percent map.

TWDB Report ##: Structure of the Yegua-Jackson Aquifer of the Texas Gulf Coastal Plain
5-33
Legendlow_yeg_sand10State LineShelf EdgeYegua-Jackson outcropCounty BoundariesWell Locations
Lower Yegua - Percent Sand0
0-2020-4040-6060-8080-100
0 40 8020Miles
Sediment Input Axis(Size Relative to Sed. Vol.)
Figure 5-9. Lower Yegua sand percent map.

TWDB Report ##: Structure of the Yegua-Jackson Aquifer of the Texas Gulf Coastal Plain
5-34
LegendYegua-Jackson outcropState LineCounty BoundariesShelf EdgeWell Locations
FaciesFluvialFloodplain < 100'Deltaic/Delta Front/StrandplainDelta Margin < 100'SlopeShelf/Slope Sand > 100'
0 20 40 6010Miles
Sediment Input Axis(Size Relative to Sed. Vol.)
Figure 5-10. Lower Yegua depositional facies map.

TWDB Report ##: Structure of the Yegua-Jackson Aquifer of the Texas Gulf Coastal Plain
5-35
LegendState LineShelf EdgeYegua-Jackson outcropCounty BoundariesWell Locations
FaciesDeltaic/Delta Front/StrandplainWave-Dominated DeltaDelta Margin < 100'FluvialFloodplainSlopeShelf-Edge DeltaShelf/Slope Sand > 100'
0 20 40 6010Miles
Sediment Input Axis(Size Relative to Sed. Vol.)
Figure 5-11. Upper Yegua depositional facies map.

TWDB Report ##: Structure of the Yegua-Jackson Aquifer of the Texas Gulf Coastal Plain
5-36
LegendState LineShelf EdgeYegua-Jackson outcropCounty BoundariesWell Locations
FaciesFluvialFloodplain < 50'Deltaic/Delta Front/StrandplainDistal DeltaDelta Margin < 50'ShelfShelf ChannelShelf Edge DeltaSlopeShelf/Slope Sand > 50'
0 20 40 6010Miles
Sediment Input Axis(Size Relative to Sed. Vol.)
Figure 5-12. Lower Jackson depositional facies map.

TWDB Report ##: Structure of the Yegua-Jackson Aquifer of the Texas Gulf Coastal Plain
5-37
LegendState LineShelf EdgeYegua-Jackson outcropCounty BoundariesWell Locations
FaciesFluvialFloodplain < 50'Deltaic/Delta Front/StrandplainDistal DeltaDelta Margin < 50'ShelfShelf ChannelSlopeShelf/Slope Sand > 50'
0 20 40 6010Miles
Sediment Input Axis(Size Relative to Sed. Vol.)
Figure 5-13. Upper Jackson depositional facies map.

TWDB Report ##: Structure of the Yegua-Jackson Aquifer of the Texas Gulf Coastal Plain
5-38
This page is intentionally blank.

TWDB Report ##: Structure of the Yegua-Jackson Aquifer of the Texas Gulf Coastal Plain
6-1
6. Conclusions and Recommendations
This report documents the development of the structure and depositional framework for the
Yegua-Jackson Aquifer in Texas. The Eocene-age Yegua-Jackson interval is designated as a
minor aquifer by the Texas Water Development Board. The Yegua-Jackson Aquifer is reported
to have an estimated available groundwater supply of 25,000 acre-feet per year. The purpose of
this study is to provide the basic data regarding aquifer structure and depositional framework
capable of supporting the future development of a Yegua-Jackson Aquifer Groundwater
Availability Model.
The Yegua-Jackson Aquifer exists predominantly in the outcrop or near-outcrop areas of the
Yegua Formation and Jackson group. In Texas, this outcrop area stretches in a relatively thin
band approximately parallel to the coastline, from Starr County in the Rio Grande Valley to
Sabine County in East Texas, and is thus bracketed by the Rio Grande River to the south, and the
Toledo Bend Reservoir (along the Sabine River) to the east. The width of this outcrop varies
from less than 10 miles in Gonzales County to near 40 miles in La Salle County, with an area of
approximately 11,000 square miles.
The Yegua Formation overlies the Cook Mountain Formation and is uppermost in the Middle
Eocene Upper Claiborne group. This group is overlain by the Upper Eocene to Oligocene
Jackson Group. In Texas, the Jackson Group consists of the Whitsett, Manning, Wellborn, and
Caddell formations (and lateral equivalents). The Yegua-Jackson interval continues across the
Sabine River into Louisiana, where the Yegua Formation is called the Cockfield Formation, and
the Jackson Group is undifferentiated.
This study created a chronostratigraphic framework for the Yegua-Jackson Aquifer that spans its
entire extent in Texas. A chronostratigraphic approach to mapping provides a consistent
depositional framework for the geologic intervals comprising the aquifer. The dominant controls
on aquifer framework in terms of fluid flow characteristics result from the distribution of
sedimentary processes, both geographically and through geologic time. Estimating aquifer
framework and heterogeneity on the basis of outcrop and limited subsurface data requires a
predictive approach founded on an understanding of the activities that built the aquifer. The
concepts of chronostratigraphy and depositional systems provide that predictive capability.

TWDB Report ##: Structure of the Yegua-Jackson Aquifer of the Texas Gulf Coastal Plain
6-2
Unlike lithostratigraphic correlation, which relies on lithologic changes to subdivide sedimentary
intervals, chronostratigraphic correlation relies on recognition of depositional surfaces formed at
critical times in a depositional cycle. At these relatively brief periods of time, broad areas of the
coast are undergoing similar depositional processes. At sea-level highstand times, deposition of
fine-grained deposits (an aquitard) cover a large portion of the sand-rich sediments deposited
during the last lowstand (an aquifer). These highstand times are represented by maximum
flooding surfaces, and their associated fine-grained deposits are especially useful in defining
aquifer framework because they often have a characteristic signature on geophysical logs from
wellbores. Thus these deposits can be traced across a regional extent in the subsurface. The
intervals above and below these fine-grained deposits are sand-rich packages deposited under a
common set of conditions, including positions of major sediment input. Predictive methods for
evaluating the geographic distribution of sand-rich areas within the package can then be applied.
These predictive methods are based on observations of modern depositional processes and
systems such as rivers and deltas. These methods rely on the commonality of depositional
conditions within the time frame of the package, and the location and style of sand-rich
deposition will vary from package to package.
The following bullets will summarize the key findings or conclusions from this study.
• The general chronostratigraphic correlation approach used in this study is based upon the
correlation of maximum flooding surfaces within fine-grained highstand deposits as
defined in geophysical well logs arranged in dip-oriented cross sections, connecting low-
resistivity markers in downdip shale sections with shales or abrupt-based sands in updip
sandy and silty intervals.
• Correlation was based upon the use geophysical logs from 250 wells. These wells were
used to develop a grid of 30 dip-oriented cross sections and 3 strike-oriented cross
sections for correlation purposes. Dip sections extend from the Yegua-Jackson outcrop
area downdip (southeast) more than 50 miles and to depths exceeding 6,000 feet subsea
to allow a more complete stratigraphic analysis. Strike sections extend from the Mexico
to Louisiana borders. Two sections roughly parallel the outcrop and, depending on their
location, show either mostly the Jackson interval or mostly the Yegua interval. A third

TWDB Report ##: Structure of the Yegua-Jackson Aquifer of the Texas Gulf Coastal Plain
6-3
strike section was created from selected wells such that coverage of both intervals was
optimized.
• Four major chronostratigraphic units (third-order genetic units) were defined for the
Yegua-Jackson Aquifer. These include, from the bottom upward, the Lower Yegua,
Upper Yegua, Lower Jackson, and Upper Jackson Units, which each span one to two
million years of deposition (third-order genetic units) and are of appropriate scale for
regional groundwater availability modeling (generally 400 to 800 feet thick, thickening in
the downdip direction).
• Each of the four major chronostratigraphic units is bounded above and below by time-
synchronous maximum flooding surfaces dominated in the sedimentary record by fine-
grained (clay-rich) deposition. Such surfaces and associated fine-grained sediments
impede vertical fluid flow, forming low-flow units within the aquifer. Maximum
flooding surfaces also bound laterally contiguous sand-rich sediments, which form high-
flow units within the aquifer.
• These four aquifer chronostratigraphic units are comprised of 15 or more finer units
which are of fourth-order scale, each spanning a period of 100,000 to 400,000 years.
These minor sequence stratigraphic units represent finer-scale (fourth-order) genetic units
that are also bounded by finer-scale maximum flooding surfaces.
• The four chronostratigraphic units were used as the basis for defining four operational
aquifer layers within the Yegua-Jackson Aquifer; the Lower Yegua Layer, the Upper
Yegua Layer, the Lower Jackson Layer and the Upper Jackson Layer. Of these four
aquifer layers, only the Lower Yegua Layer differs from it’s chronostratigraphic unit
equivalent. This is because the chronostratigraphic Base Yegua Unit occurs at or below
the lithostratigraphic Base Yegua-Jackson Aquifer, and thus commonly outcrops farther
inland (north and west) of the base of the Yegua Formation as mapped in outcrop. The
chronostratigraphic surface represents a maximum flooding surface between the Sparta
and Yegua depositional cycles and commonly occurs within the shale of the Cook
Mountain Formation. To address this issue, the base of the Lower Yegua Aquifer Layer,
which comprises the base of the Yegua-Jackson Aquifer, was defined to occur at the first
significant freshwater sand and was tied to the base Yegua outcrop boundary.

TWDB Report ##: Structure of the Yegua-Jackson Aquifer of the Texas Gulf Coastal Plain
6-4
• Five types of maps were developed for the four aquifer layers. These are a structure map,
an isopach map, a sand thickness map, a sand percent map, and a depositional facies map.
These maps provide the necessary framework for future groundwater availability model
development.
• The results of this research provide direct support for the future development of the
Yegua-Jackson Aquifer Groundwater Availability Model and the advancement of the
understanding of the hydrogeology, and controls on availability and sustainability, of the
aquifer. Through the integration of the data presented, future modelers can impose
conceptual constraints on regional model parameterization and will have the depositional
framework necessary to evaluate characterization data and to apply interpolation
techniques during calibration.
• The following bullets will summarize recommendations from this study.
• In South Texas the interval between the chronostratigraphic Base Yegua Unit and the
Base Yegua-Jackson Aquifer contains significant sands that are potentially water-bearing.
These sands were excluded from this study and thus lie between the Sparta and Yegua-
Jackson Aquifers. Future reconsideration of existing formal aquifer boundaries might
place these sands in the Yegua-Jackson Aquifer because they are probably most closely
linked, hydrologically, with this aquifer.
• This study provides significant evidence that the Vicksburg Formation was mapped by
Barnes (1968a, 1968b, 1974a, 1974b, 1974c, 1975, 1976a, 1976b, 1976c, 1992) as part of
the Jackson Group from approximately the Brazos River eastward and mapped as part of
the Catahoula Formation and lateral equivalents from the Brazos River southward. This
conclusion is substantiated by this work and the work of others. This conflict between
interpretations from this study and those of Barnes (1968a, 1968b, 1974a, 1974b, 1974c,
1975, 1976a, 1976b, 1976c, 1992) are important, unexpected, and not resolvable within
the scope of this study. Before this structural framework of the Yegua-Jackson aquifer is
incorporated into a numerical model, it is suggested that sufficient investigation resolves
stratigraphic inconsistencies and logically places the ‘region in conflict’ within either the
Yegua-Jackson Aquifer or the overlying Gulf Coast Aquifer.

TWDB Report ##: Structure of the Yegua-Jackson Aquifer of the Texas Gulf Coastal Plain
6-5
• As water resources in the state become more valuable and subject to greater use, it is
expected that groundwater availability models will have to increase their accuracy, which
implies an increase in understanding of the aquifer flow controls and dynamics. There
are many valuable stratigraphic studies within the Texas Tertiary aquifers. However,
many times these studies are at a sub-regional scale and differences in nomenclature
between studies make integration of these studies into a coherent whole difficult. It is
recommended that similar studies be funded for aquifers where detailed structure,
lithology, and depositional facies are not defined at the relevant aquifer scale. The
resulting uniformity will prove critical to future groundwater resource management.

TWDB Report ##: Structure of the Yegua-Jackson Aquifer of the Texas Gulf Coastal Plain
6-6
This page is intentionally blank.

TWDB Report ##: Structure of the Yegua-Jackson Aquifer of the Texas Gulf Coastal Plain
7-1
7. Acknowledgements
The well logs critical to this investigation could not have been gathered without open access to
resources at the Bureau of Economic Geology, the Texas Water Development Board, and the
Texas Commission on Environmental Quality Surface Casing Division. Friendly and helpful
guidance in these respective facilities was provided by Daniel Ortuno, Deborah Schultz, and
Julia Harvey. We would like to acknowledge Scott Hamlin, the TWDB Project manager for his
support and guidance through this structure development project. The skills and patience of
Sarah Pierson, and Michelle Tiemeier at INTERA, Incorporated, and Alex Sanders at Baer
Engineering and Environmental Services, Incorporated, have transformed thoughts and ideas into
geographic information system-based maps. Computer aided design-based cross section drawing
was accomplished by Jorge Garza of INTERA, Incorporated and we appreciate his patience.
Funding for this study was provided by TWDB under contract 0604830617.

TWDB Report ##: Structure of the Yegua-Jackson Aquifer of the Texas Gulf Coastal Plain
7-2
This page is intentionally blank.

TWDB Report ##: Structure of the Yegua-Jackson Aquifer of the Texas Gulf Coastal Plain
8-1
8. References
Anders, R.B., 1957, Ground-water geology of Wilson County, Texas: Texas Water Commission
Bulletin 5710, Austin, Texas, 62 p.
Anders, R.B., 1967, Ground-water resources of Sabine and San Augustine Counties, Texas:
Texas Water Development Board Report 37, Austin, Texas, 104 p.
Anders, R.B., and Baker, Jr., E.T., 1961, Groundwater geology of Live Oak County, Texas:
Texas Water Commission Bulletin 6105, 93 p.
Anderson, J.B., and A.B. Rodriguez, 1999, Late Quaternary clastic depositional systems of the
Texas coast and continental shelf, Guidebook for Field Trip #17, SEPM: Depositional
systems of the East Texas coastal plain and continental shelf, 48 p.
Baker, Jr., E.T., Follett, C.R., McAdoo, G.D., and Bonnet, C.W., 1974, Ground-water resources
of Grimes County, Texas: Texas Water Development Board Report 186, 103 p.
Barnes, V.E., 1968a, project director, Beaumont sheet – Geologic Atlas of Texas: The University
of Texas at Austin, Bureau of Economic Geology, scale 1:250,000, revised 1992.
Barnes, V.E., 1968b, project director, Palestine sheet – Geologic Atlas of Texas: The University
of Texas at Austin, Bureau of Economic Geology, scale 1:250,000, Revised 1993.
Barnes, V.E., 1974a, project director, Austin sheet – Geologic Atlas of Texas: The University of
Texas at Austin, Bureau of Economic Geology, scale 1:250,000, revised 1981.
Barnes, V.E., 1974b, project director, San Antonio sheet – Geologic Atlas of Texas: The
University of Texas at Austin, Bureau of Economic Geology, scale 1:250,000, revised 1983.
Barnes, V.E., 1974c, project director, Seguin sheet – Geologic Atlas of Texas: The University of
Texas at Austin, Bureau of Economic Geology, scale 1:250,000.
Barnes, V.E., 1975, project director, Beeville-Bay City sheet – Geologic Atlas of Texas: The
University of Texas at Austin, Bureau of Economic Geology, scale 1:250,000, revised 1987.
Barnes, V.E., 1976a, project director, Crystal City-Eagle Pass sheet – Geologic Atlas of Texas:
The University of Texas at Austin, Bureau of Economic Geology, scale 1:250,000.

TWDB Report ##: Structure of the Yegua-Jackson Aquifer of the Texas Gulf Coastal Plain
8-2
Barnes, V.E., 1976b, project director, Laredo sheet – Geologic Atlas of Texas: The University of
Texas at Austin, Bureau of Economic Geology, scale 1:250,000.
Barnes, V.E., 1976c, project director, McAllen-Brownsville sheet – Geologic Atlas of Texas:
The University of Texas at Austin, Bureau of Economic Geology, scale 1:250,000.
Barnes, V.E., 1992, Geologic Map of Texas: The University of Texas, Bureau of Economic
Geology, State Map No. 3, Scale 1:500,000.
Bockoven, F.D., 1985, Source, transport, and deposition of the (Eocene) Yegua sediments of the
Middle Texas Gulf Coast: M.A. Thesis, The University of Texas at Austin, Austin, Texas,
127 p.
Chapin, C.E., 1979, Evolution of the Rio Grande Rift, a summary, in Riecker, R.E., ed., Rio
Grande Rift: Tectonics and Magmatism, American Geophysical Union, p. 1-5.
Chapin, C.E., and Cather, S.M., 1981, Eocene tectonics and sedimentation in the Colorado
Plateau – Rocky Mountains area: Arizona Geological Society Digest, v. 14, p. 199-213.
Coleman, J.M.C., 1990, Depositional systems and tectonic/eustatic history of the Oligocene
Vicksburg episode of the northern Gulf Coast: The University of Texas at Austin, Ph.D.
Dissertation.
Dale, O.C., 1952, Groundwater resources of Starr County, Texas: Texas Water Commission
Bulletin 5209, 47 p.
Davis, G.A., 1980, Problems of intraplate extensional tectonics, western United States, in Studies
of Geophysics: Continental Tectonics: National Research Council, P. 84-95.
Dickinson, W.R., Plate tectonic evolution of the Southern Cordillera: Arizona Geological
Society Digest, v. 14, p. 113-135.
Dodge, M.M., and J.S. Posey, 1981, Structural cross sections, Tertiary formations, Texas Gulf
Coast: The University of Texas at Austin, Bureau of Economic Geology Cross Section Series
no. 2, 6 p.
Eargle, D.H., 1972, Revised classification and nomenclature of the Jackson Group (Eocene),
South-Central Texas: American Association of Petroleum Geologists Bulletin, v. 56,
p. 561-566.
TWDB Report ##: Structure of the Yegua-Jackson Aquifer of the Texas Gulf Coastal Plain
8-3
Eaton, G., 1986, A tectonic redefinition of the southern Rocky Mountains: Tectonophysics,
v. 12, p. 163-193.
Ewing, T.E., 1986, Tectonic map of Texas: The University of Texas at Austin, Bureau of
Economic Geology SM0001.
Ewing, T.E., 1994, Surface to subsurface correlation of the Claiborne and Jackson Groups,
Colorado River to Trinity River, Bulletin, v. 78, issue 9: 44th annual convention of the Gulf
Coast Association of Geological Societies and the 41st annual convention of the Gulf Coast
Section of the Society of Economic Paleontologists and Mineralogists, Austin, Texas (United
States), 5-7 Oct 1994, PBD: Sep 1994.
Ewing, T.E., 1991, Chapter 3: Structural Framework, in Amos Salvador, ed., The Gulf of
Mexico basin, The geology of North America, v. J: The Geological Society of America, Inc.,
Boulder, Colorado, p. 31-52.
Ewing, T.E., and Vincent, F., 1997: American Association of Petroleum Geologists Bulletin,
v. 81, no. 9, p. 1574-1575.
Fang, Q., 2000, Biostratigraphic and sequence stratigraphic analysis of the Yegua Formation,
Houston salt embayment, northern Gulf of Mexico: The University of Texas at Austin, Ph.D.
Dissertation.
Fischer, A.G., 1964, The Lofer cyclothems of the Alpine Triassic: Kansas Geological Survey
Bulletin, v. 169, p. 107-149.
Fisher, W.L., 1963, Lignites of the Texas Gulf Coastal Plain: The University of Texas at Austin,
Bureau of Economic Geology Report of Investigations no. 50, 164 p.
Fisher, W.L., 1969, Facies characterization of Gulf Coast basin delta systems, with some
Holocene analogues: Gulf Coast Association of Geological Societies Transactions, v. 19,
p. 239—261.
Fisher, W.L., Proctor, Jr., C.V., Galloway, W.E., and Nagle, J.S., 1970, Depositional systems in
the Jackson Group of Texas – their relationship to oil, gas, and uranium: Gulf Coast
Association of Geological Societies Transactions, v. 20, p. 234-261.

TWDB Report ##: Structure of the Yegua-Jackson Aquifer of the Texas Gulf Coastal Plain
8-4
Follett, C.R., 1974, Ground-water resources of Brazos and Burleson Counties, Texas: Texas
Water Development Board Report 185, Austin, Texas, 194 p.
Galloway, W.E., 1989a, Genetic stratigraphic sequences in basin analysis I, architecture and
genesis of flooding-surface bounded depositional units: American Association of Petroleum
Geologists Bulletin, v. 73, No. 2, p. 124-142.
Galloway, W.E., 1989b, Genetic stratigraphic sequences in basin analysis II, application to
northwest Gulf of Mexico Cenozoic Basin: American Association of Petroleum Geologists
Bulletin, v. 73, no. 2, p. 143-154.
Galloway, W.E., 1990, Paleogene depositional episodes, genetic stratigraphic sequences, and
sediment accumulation rates, NW Gulf of Mexico basin: Gulf Coast Section, Society of
Economic Paleontology and Mineralogy, 11th Annual Research Conference Proceedings,
p. 165–176.
Galloway, W.E., Bebout, D.G., Fisher, W.L., Dunlap, Jr., J.B., Cabrera-Castro, R., Lugo-Rivera,
J.E., and Scott, T.M., 1991, Chapter 11: Cenozoic, in Amos Salvador, ed., The Gulf of
Mexico basin, The geology of North America, v. J: The Geological Society of America, Inc.,
Boulder, Colorado, p. 245-324.
Galloway, W.E., Ewing, T.E., Garrett, C.M., Tyler, N., Bebout, D.G., 1983, Atlas of Major
Texas Oil Reservoirs: The University of Texas, Bureau of Economic Geology, Austin, Texas,
139 p. (oversize).
Galloway, W.E., Finley, R.J., and Henry, C.D., 1979, South Texas uranium province – Geologic
perspective, Guidebook 18: The University of Texas at Austin, Bureau of Economic
Geology, 87 p.
Galloway, W.E., Ganey-Curry, P.E., Li, X., and Buffler, R.T., 2000, Cenozoic depositional
history of the Gulf of Mexico basin: American Association of Petroleum Geologist Bulletin,
v. 84, no. 11, p. 1743–1774.
Goings, R.E., and Smosna, R., 1994, A regional subsurface study of the expanded Yegua
Formation in the Houston diapir province: Gulf Coast Association of Geological Societies
Transactions, v. 44, p. 245-254.

TWDB Report ##: Structure of the Yegua-Jackson Aquifer of the Texas Gulf Coastal Plain
8-5
Gries, R., 1983, North-south compression of Rocky Mountain foreland structures (abs.):
American Association of Petroleum Geologists Bulletin, v. 66, p. 574.
Guyton, W.F., and Associates, 1970, Ground-water conditions in Angelina and Nacogdoches
counties, Texas: Texas Water Development Board Report 110, Austin, Texas, 89 p.
Haq, B.U., Hardenbol, J., and Vail, P.R., 1987, Chronology of Fluctuating sea levels since the
Triassic: Science, v. 235, p. 1156-1166.
Harland, W.B., Armstrong, R.L., Cox, A.V., Craig, L.E., Smith, A.G., and Smith, D.G., 1990, A
geologic time scale1989: Cambridge University Press, Cambridge, England, 263 p.
Harris, H.B., 1965, Ground-water resources of LaSalle and McMullen Counties, Texas: Texas
Water Commission Bulletin 6520, Austin, Texas, 59 p.
Hays, J.D., Imbrie, J., and Shackleton, N.J., 1976, Variation in the Earth’s orbit: pacemaker of
the ice ages: Science, v. 194, p. 1121-1132.
Huh, S., Watkins, J.S., Kasande, R., Fiduk, J.C., Bryant, S., Silver, K.E., Bradshaw, B.E., Xue,
F., and Xi, J., 1996, Regional structure and tectonics of the Texas shelf; in Jones, J.O., and
Freed, R.L., eds., Structural Framework of the Northern Gulf of Mexico: Gulf Coast
Association of Geological Societies Special Publication, Austin, Texas, p. 39–51.
Jackson, M.L.W., and Garner, L.E., 1982, Environmental geology of the Yegua-Jackson lignite
belt, southeast Texas: The University of Texas at Austin, Bureau of Economic Geology
Report of Investigations no. 129, 40 p.
Kaiser, W.R., Ayers, Jr., W.B., and La Brie, L.W., 1980, Lignite resources in Texas: The
University of Texas at Austin, Bureau of Economic Geology Report of Investigations
no. 104, 52 p.
Larkin, T.J., and G.W. Bomar, 1983. Climatic Atlas of Texas. Department of Water Resources,
Report LP-192, 151 p.
Loucks, R.G., Dodge, M.M., and Galloway, W.E., 1986, Controls on Porosity and Permeability
of Hydrocarbon Reservoirs in Lower Tertiary Sandstones Along the Texas Gulf Coast: The
University of Texas, Bureau of Economic Geology Report of Investigations no. 149, 78 p.

TWDB Report ##: Structure of the Yegua-Jackson Aquifer of the Texas Gulf Coastal Plain
8-6
Loutit, T.S., and Kennett, J.P., 1981, Australian Cenozoic sedimentary cycles, global sea level
changes, and deep sea sedimentary record: Oceanologica Acta Special Volume, p. 45-63.
McDowell, F.W., and Clabaugh, S.E., 1979, Ignimbrites of the Sierra Madre Occidental and their
relation to the tectonic history of western Mexico, in Chapin C.E., and Elston, W.E., eds.,
Ash-Flow Tuffs: Geological Society of America Special Paper 180, p. 113-124.
Meckel, III, L.D., 1993, Stratigraphy and sedimentology of the Eocene Yegua Formation, Texas
Gulf Coast: M.S. Thesis, The University of Texas at Austin, Austin, Texas, 112 p.
Meckel, III, L.D., and Galloway, W.E., 1996, Formation of high-frequency sequences and their
bounding surfaces; Case study of the Eocene Yegua Formation, Texas Gulf Coast, USA:
Sedimentary Geology, v. 102, p. 155-187.
Mitchum, R.M., and J.C. Van Wagoner, 1991, High-frequency sequences and their stacking
patterns: sequence-stratigraphic evidence of high-frequency eustatic cycles: Sedimentary
Geology, v. 70, p. 131-160.
Preston, R.D., 2006, in Mace, R.E., Davidson, S.C., Angle, E.S., and Mullican, III, W.F., eds.,
Aquifers of the Gulf Coast of Texas: Texas Water Development Board Report 365, p. 51-59.
Quick, J.V., Thomas, N.G., Brogdon, L.D., Jones, C.A, and Martin, T.S., 1977, Uranium
favorability of late Eocene through Pliocene rocks of the South Texas Coastal Plains: U.S.
Energy Research and Development Administration, Grand Junction, Colorado, 47 p.
Price, J.G., and Henry, C.D., 1984, Stress orientations during Oligocene volcanism in Trans-
Pecos Texas: timing and transition from Laramide compression to Basin and Range tension:
Geology, v. 12, p. 238-241.
Renick, B.C., 1926, The Jackson Group and the Catahoula and Oakville formations in a part of
the Texas Gulf Coastal Plain: The University of Texas at Austin, Bureau of Economic
Geology Bulletin 2645, 187 p.
Renick, B.C., 1936, The Jackson Group and the Catahoula and Oakville formations in a part of
the Texas Gulf Coastal Plain: The University of Texas at Austin, Bureau of Economic
Geology Bulletin 3619, 104 p.

TWDB Report ##: Structure of the Yegua-Jackson Aquifer of the Texas Gulf Coastal Plain
8-7
Rogers, L.T., 1967, Availability and quality of ground water in Fayette County, Texas: Texas
Water Development Board Report 56, 117 p.
Routh, J., McDonald, T.S., and Grossman, E.L., 1999, Sedimentary organic matter sources and
depositional environment in Yegua Formation (Brazos County, Texas): Organic
Geochemistry, v. 30, p. 1437-1453.
Salazar, D.A., Dale, S.B., and Tremblay, T.A., 1997, Digital automation notes for the Tectonic
Map of Texas: Bureau of Economic Geology, The University of Texas, Austin, Texas, open-
file report, 14 p.
Sellards, E.H., Adkins, W.W., and Plummer, F.B., 1932, The Geology of Texas, Volume I
Stratigraphy: The University of Texas at Austin, Bureau of Economic Geology
Bulletin 3232, 818 p.
Sneider, J.S., 1992, Sequence stratigraphy of the Yegua and Cook Mountain formations, Eocene
of southeastern Texas, The Geological Society of America Abstracts with Programs, v. 24,
no. 1, p.47.
Swenson, D.R., 1997, Basal Yegua shelf margin failures along the Texas Gulf Coast: Gulf Coast
Association of Geological Societies Transactions, v. 47, p. 571-577.
Tarver, G.R., 1966, Ground-water resources of Houston County, Texas: Texas Water
Development Board Report 18, Austin, Texas, 86 p.
Tarver, G.R., 1968, Ground-water Resources of Tyler County, Texas: Texas Water Development
Board Report 74, Austin, Texas, 91 p.
Texas Natural Resource Information System, 2006, Geologic Atlas of Texas: digital conversion
of 1:250,000, University of Texas, Bureau of Economic Geology map sheets, vector version,
Austin, Texas.
Texas Water Development Board, 2002, Water for Texas – 2002: Texas Water Development
Board, , 156 p.
Texas Water Development Board, 2007, Water for Texas – 2007, Volume II: Texas Water
Development Board, 392 p.

TWDB Report ##: Structure of the Yegua-Jackson Aquifer of the Texas Gulf Coastal Plain
8-8
Thomas, S.H., 1999, Interpretation of seismic amplitude attributes in the updip Yegua trend of
South Texas: Texas A&M University, M.S. thesis, 83 p.
Thompson, G.L., 1966, Ground-water resources of Lee County, Texas: Texas Water
Development Board Report 20, 131 p.
Van Dalen, S.C., 1981, Depositional systems and natural resources of the Middle Eocene Yegua
Formation, south and central Texas Coastal Plain: The University of Texas at Austin,
Masters Thesis.
Wesselman, J.B., 1967, Ground-water resources of Jasper and Newton counties, Texas: Texas
Water Development Board Report 59, 152 p.
Wiltschko, D.V., and Dorr, Jr., J.A., 1983, Timing of deformation in overthrust belt and foreland
of Idaho, Wyoming, and Utah: American Association of Petroleum Geologists Bulletin,
v. 67, p. 1304-1322.
Winslow, A.G., 1950, Geology and ground-water resources of Walker County, Texas: Texas
Board of Water Engineers Bulletin 5003, 48 p.
Yuliantoro, F., 1995, Genetic sequence stratigraphy of the Yegua Formation and the Jackson
Group, including the ‘Hockley’ sandstone in northeastern Duval County and northwestern
Jim Wells County, South Texas: University of Texas at San Antonio, M.S. Thesis, 210 p.

Plates

This page is intentionally blank.

Appendix A
Study Wells, Locations, Cross Section Occurrence,
and Key Log Parameters

This page is intentionally blank.

TWDB Report ##: Structure of the Yegua-Jackson Aquifer of the Texas Gulf Coastal Plain
A-1
Appendix A Study Wells, Locations, Cross Section Occurrence, and Key Log Parameters
Unique Well Identifier API Well Number1 Longitude Latitude County Dip Strike Digitized KB2 Base of
Log Top
of Log 5944109 420515544109 -96.58722 30.37278 BURLESON 9 A N 3383 329 6617614 -96.91500 29.68583 FAYETTE 12 B N 3623 1090 26 AHERNHUBBARD205 -99.45234 27.61498 WEBB N 637 2602 136 AQ-39 420050019500 -94.40840 31.24045 ANGELINA 2 A Y 238 5054 144 AQ-52 -94.52108 31.17882 ANGELINA N 2373 5466 323 AQ-78 420050022400 -94.81377 31.38711 ANGELINA 3 Y 350 8165 90 ARCOSAENZ299 424270445100 -98.98486 26.45269 STARR 29 A,C Y 3223 7503 1631 ARCOTEMPLE948 422410026900 -94.06502 31.02761 JASPER B,C Y 214 10814 100 ATQ-228 420130082300 -98.33219 28.84983 ATASCOSA A Y 272 2573 100 BENTSENVIDAURRI235 425050187700 -99.37886 27.24390 ZAPATA 25 Y 389 5510 135 BLANCOJENNINGS247 425050179400 -99.14327 27.08941 ZAPATA 26 A Y 421 11667 142 CLARKSALINAS279 424270185900 -98.89712 26.70530 STARR 28 B,C Y 376 3914 141 CONSOLIDATEDVELA215 424793128000 -99.48432 27.43511 WEBB 24 Y 418 7660 468 CQ-343 -96.74585 29.55443 COLORADO C N 234 9214 2067 DP10-10N -96.42370 29.38855 COLORADO 11 N 163 11047 DP10-11 -96.30903 29.38330 WHARTON 10 N 143 14950 430 DP10-3R 421490006300 -97.05167 29.89721 FAYETTE 11 Y 419 6340 175 DP10-4R 421490004000 -96.92181 29.88502 FAYETTE 11 A Y 3043 7037 811 DP10-5R 421490002700 -96.77888 29.99284 FAYETTE 10 B N 4793 7497 787 DP10-6 421493269900 -96.76743 29.82856 FAYETTE 11 B Y 246 13700 2054 DP10-7 420890087500 -96.63988 29.70296 COLORADO 11 C Y 338 12733 2241 DP10-8 -96.58532 29.60938 COLORADO 11 N 307 11150 50 DP10-9 -96.43502 29.51067 COLORADO 10 N 200 11948 DP11-10 -96.68132 29.32400 LAVACA 12 N 176 11722 2984 DP11-11 -96.70356 29.28299 LAVACA 12 N 165 10156 1242 DP11-7R 422853015200 -96.82290 29.48497 LAVACA 12 C Y 320 10002 1802 DP11-8 422850032600 -96.68429 29.37153 LAVACA 12 Y 220 16720 188 DP12-6A 421230000300 -97.26828 29.31944 DEWITT B Y 345 8017 741 DP12-7 422850035800 -97.07708 29.28255 LAVACA 13 C Y 266 10251 100 DP12-8 -96.82653 29.18642 LAVACA 13 N 164 16015 63 DP13-3 -97.61983 29.37674 GONZALES 14 N 317 7099 169 DP13-4R 421770028700 -97.46088 29.31554 GONZALES 14 A Y 2733 6740 734

TWDB Report ##: Structure of the Yegua-Jackson Aquifer of the Texas Gulf Coastal Plain
A-2
Appendix A, continued
Unique Well Identifier API Well Number1 Longitude Latitude County Dip Strike Digitized KB2 Base of
Log Top
of Log DP13-5 421770042400 -97.45603 29.23655 GONZALES 14 B Y 241 13356 100 DP13-6 421230087000 -97.40049 29.09896 DEWITT 14 C Y 238 14191 57 DP13-7 -97.24656 29.05147 DEWITT 14 N 210 14472 1717 DP13-8 -97.19685 29.04774 DEWITT 14 N 162 13000 1515 DP13-9 421233162200 -97.09277 29.06901 DEWITT 14 Y 225 15500 100 DP1-4 424050002800 -94.12601 31.25995 SAN AUGUSTINE 1 A Y 184 10029 297 DP14-4R 421230033700 -97.69045 29.01454 DEWITT 15 B Y 494 9012 1018 DP14-5R -97.64167 28.90614 DEWITT N 369 14848 1286 DP14-6 421233000500 -97.49090 28.89030 DEWITT 15 C Y 344 12496 2066 DP14-7 -97.47293 28.86545 GOLIAD 15 N 283 14320 1799 DP14-8 421753010500 -97.34597 28.76476 GOLIAD 15 Y 240 24755 97 DP14-9 -97.33563 28.69792 GOLIAD 15 N 178 16000 100 DP1-4A -94.28219 31.18229 ANGELINA 2 N 1783 1816 201 DP1-5 422410000200 -94.36998 31.03559 JASPER 2 Y 117 10108 206 DP15-10 -97.71260 28.75000 KARNES 16 N 305 11424 173 DP15-11R 421750192800 -97.70030 28.62804 GOLIAD 16 Y 365 9303 100 DP15-13 -97.48775 28.38284 BEE 17 N 121 16335 824 DP15-5 424930153600 -98.02026 29.02221 WILSON 16 A Y 390 8168 492 DP15-6R 422550068900 -97.92059 28.97352 KARNES 16 Y 360 11367 667 DP15-7 422550063400 -97.89902 28.90755 KARNES 16 B Y 344 8346 90 DP15-8 -97.86759 28.83833 KARNES 16 N 336 8799 1648 DP15-9 422553022800 -97.76062 28.83507 KARNES 16 C Y 277 14070 56 DP1-6 424570005400 -94.31878 30.95545 TYLER 2 B,C Y 364 12019 70 DP16-3 424930174700 -98.21063 28.91319 WILSON 17 A Y 319 6214 398 DP16-5A 422970001100 -98.04020 28.71429 LIVE OAK 17 B Y 396 7699 807 DP16-5R 422550084200 -97.98382 28.80270 KARNES 17 Y 4723 7998 38 DP16-6 420250047400 -98.00049 28.60813 BEE 17 C Y 363 16988 52 DP16-8 -97.80807 28.51742 BEE 17 N 344 12850 2016 DP1-7 424570025700 -94.12650 30.69987 TYLER 2 Y 75 7512 970 DP17-10 422973000200 -98.00635 28.39298 LIVE OAK 18 Y 232 14051 100 DP17-11 -98.00464 28.32379 LIVE OAK 18 N 177 10905 1523 DP17-13 -97.98677 28.12696 LIVE OAK 19 N 194 6707 899

TWDB Report ##: Structure of the Yegua-Jackson Aquifer of the Texas Gulf Coastal Plain
A-3
Appendix A, continued
Unique Well Identifier API Well Number1 Longitude Latitude County Dip Strike Digitized KB2 Base of
Log Top
of Log DP17-3R -98.60384 28.86719 ATASCOSA 18 N 4643 7378 40 DP17-4 420130288700 -98.50541 28.72439 ATASCOSA 18 A Y 336 5598 100 DP17-5 423110016700 -98.49363 28.60330 MCMULLEN Y 295 10517 100 DP17-6 -98.45833 28.53993 MCMULLEN N 306 12126 40 DP17-7R -98.29380 28.49783 LIVE OAK N 190 13794 81 DP17-8 422970082400 -98.18284 28.49566 LIVE OAK 18 B,C Y 174 8018 85 DP17-9 -98.16226 28.39670 LIVE OAK 18 N 234 9204 1527 DP18-10 423110092700 -98.35938 28.32348 MCMULLEN 19 B,C Y 256 15018 75 DP18-11 422973033000 -98.27295 28.17335 LIVE OAK 19 Y 428 14838 58 DP18-13 -98.20147 28.18162 LIVE OAK 19 N 412 14857 78 DP18-14 -98.16926 27.91899 JIM WELLS 20 N 305 6820 777 DP18-5 421630158200 -98.80294 28.67014 FRIO 19 Y 510 6449 200 DP18-6 422830005100 -98.80315 28.52300 LA SALLE 19 Y 366 5492 315 DP18-7R 423110123700 -98.66814 28.45819 MCMULLEN 19 A Y 2973 11407 90 DP18-8 -98.56226 28.42465 MCMULLEN 19 N 313 11574 100 DP18-9 423113010800 -98.51373 28.39286 MCMULLEN 19 Y 297 12036 60 DP19-10R 422830011500 -98.82549 28.32310 LA SALLE 20 Y 413 5992 147 DP19-11 423110153200 -98.74805 28.19630 MCMULLEN 20 Y 284 24213 487 DP19-12 -98.58971 28.22565 MCMULLEN N 296 7594 228 DP19-13 423110158000 -98.52696 28.18649 MCMULLEN B,C Y 351 8505 200 DP19-14 421313044500 -98.45898 28.05619 DUVAL 20 C Y 6053 11023 2007 DP19-15 421310107500 -98.25392 27.94207 DUVAL 20 Y 472 5885 430 DP19-6 422830003300 -99.03809 28.52127 LA SALLE 20 Y 420 6709 239 DP19-7 422830006000 -98.97108 28.49171 LA SALLE 20 N 362 5100 160 DP19-8R 422830020400 -98.96569 28.33737 LA SALLE 20 Y 474 21992 100 DP19-9 422830012400 -98.89020 28.31834 LA SALLE 20 A Y 408 11994 100 DP20-10 422830072500 -99.11965 28.18031 LA SALLE 21 Y 395 5753 250 DP20-11 -99.06615 28.12284 LA SALLE 21 N 313 6348 348 DP20-12 422830064600 -98.97010 28.07465 LA SALLE 21 A Y 309 6455 100 DP20-13 424790018600 -98.84706 28.00087 WEBB 21 Y 327 7704 142 DP20-14 421310545000 -98.71045 27.89063 DUVAL 21 C Y 543 9502 108 DP20-15R 421311060000 -98.70058 27.89749 DUVAL 21 B Y 547 7682 100

TWDB Report ##: Structure of the Yegua-Jackson Aquifer of the Texas Gulf Coastal Plain
A-4
Appendix A, continued
Unique Well Identifier API Well Number1 Longitude Latitude County Dip Strike Digitized KB2 Base of
Log Top
of Log DP20-16 -98.56152 27.82840 DUVAL 21 N 632 15439 DP20-17 421311115900 -98.53272 27.82753 DUVAL 21 Y 601 16015 1527 DP20-18 421310188100 -98.34217 27.76519 DUVAL 21 Y 428 5999 600 DP20-19 -98.38086 27.68533 DUVAL N 476 7011 789 DP20-8 -99.29688 28.33116 LA SALLE 21 N 557 4502 103 DP20-9 422830030900 -99.12696 28.28950 LA SALLE 21 Y 348 5337 107 DP2-10 -94.59337 30.81576 TYLER 3 N 368 10261 929 DP2-11 424570047700 -94.56500 30.70052 TYLER 3 Y 291 16005 80 DP21-10 424790062800 -99.04834 27.77170 WEBB 22 A Y 516 20571 100 DP21-11R -98.89453 27.76481 WEBB 22 N 509 7904 815 DP21-12 424790108500 -98.83512 27.63780 WEBB 22 C Y 811 10506 100 DP21-13 424790141800 -98.81663 27.54443 WEBB 22 B Y 792 12505 900 DP21-14 422470014000 -98.79554 27.30295 JIM HOGG 24 Y 748 7101 272 DP21-15 422470033000 -98.61100 27.16710 JIM HOGG 25 N 480 6085 1710 DP21-16 -98.41795 27.09679 BROOKS 25 N 338 8240 1049 DP2-12 -94.50100 30.54427 TYLER 3 N 156 12804 90 DP2-13 421993002100 -94.56125 30.43380 HARDIN 3 Y 136 10955 2006 DP21-6R 424790002000 -99.49660 28.02483 WEBB 22 Y 729 5484 100 DP21-7 424793018000 -99.29981 28.01492 WEBB 22 Y 489 6803 367 DP21-8R 424793121400 -99.20898 27.89583 WEBB 22 Y 4863 10401 39 DP21-9R 424790064600 -99.20671 27.81380 WEBB 22 Y 5263 DP22-10R 424793084800 -99.18931 27.41102 WEBB 24 A Y 477 10515 722 DP22-11 424793036800 -99.08253 27.40278 WEBB 24 Y 612 9510 1549 DP22-12 424790285100 -99.00048 27.40375 WEBB 24 Y 790 10019 1074 DP22-13 424790305100 -98.98547 27.33030 WEBB 24 B,C Y 903 11510 1023 DP22-14 422470277000 -98.88081 27.25260 JIM HOGG 25 B,C Y 840 15615 100 DP22-15 422470152900 -98.83091 27.05556 JIM HOGG 26 B,C Y 722 3851 100 DP22-16 -98.67326 26.98270 JIM HOGG 26 C N 513 6300 212 DP22-17 422470237200 -98.61945 26.90182 JIM HOGG Y 465 6506 340 DP22-18 -98.43774 26.81727 JIM HOGG N 270 8501 2042 DP22-6 424793000100 -99.45020 27.77691 WEBB 23 Y 732 15010 180 DP22-7R 424790071300 -99.31031 27.71311 WEBB 23 Y 574 7000 348
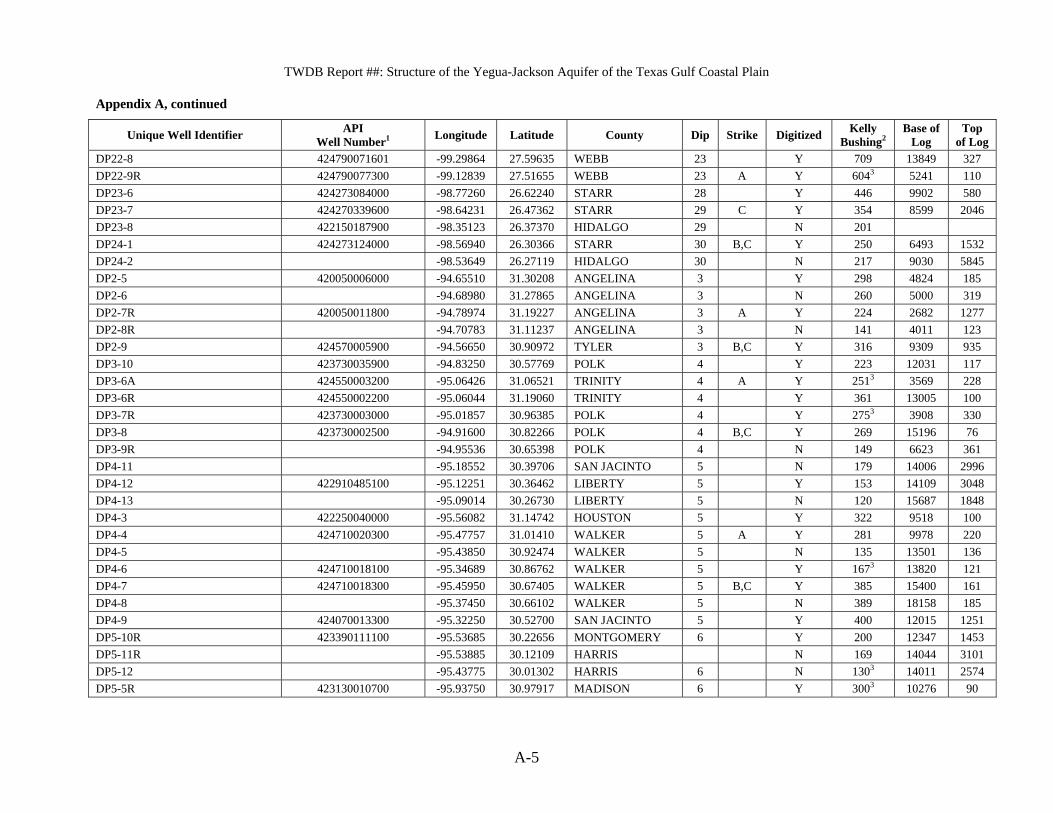
TWDB Report ##: Structure of the Yegua-Jackson Aquifer of the Texas Gulf Coastal Plain
A-5
Appendix A, continued
Unique Well Identifier API Well Number1 Longitude Latitude County Dip Strike Digitized Kelly
Bushing2 Base of
Log Top
of Log DP22-8 424790071601 -99.29864 27.59635 WEBB 23 Y 709 13849 327 DP22-9R 424790077300 -99.12839 27.51655 WEBB 23 A Y 6043 5241 110 DP23-6 424273084000 -98.77260 26.62240 STARR 28 Y 446 9902 580 DP23-7 424270339600 -98.64231 26.47362 STARR 29 C Y 354 8599 2046 DP23-8 422150187900 -98.35123 26.37370 HIDALGO 29 N 201 DP24-1 424273124000 -98.56940 26.30366 STARR 30 B,C Y 250 6493 1532 DP24-2 -98.53649 26.27119 HIDALGO 30 N 217 9030 5845 DP2-5 420050006000 -94.65510 31.30208 ANGELINA 3 Y 298 4824 185 DP2-6 -94.68980 31.27865 ANGELINA 3 N 260 5000 319 DP2-7R 420050011800 -94.78974 31.19227 ANGELINA 3 A Y 224 2682 1277 DP2-8R -94.70783 31.11237 ANGELINA 3 N 141 4011 123 DP2-9 424570005900 -94.56650 30.90972 TYLER 3 B,C Y 316 9309 935 DP3-10 423730035900 -94.83250 30.57769 POLK 4 Y 223 12031 117 DP3-6A 424550003200 -95.06426 31.06521 TRINITY 4 A Y 2513 3569 228 DP3-6R 424550002200 -95.06044 31.19060 TRINITY 4 Y 361 13005 100 DP3-7R 423730003000 -95.01857 30.96385 POLK 4 Y 2753 3908 330 DP3-8 423730002500 -94.91600 30.82266 POLK 4 B,C Y 269 15196 76 DP3-9R -94.95536 30.65398 POLK 4 N 149 6623 361 DP4-11 -95.18552 30.39706 SAN JACINTO 5 N 179 14006 2996 DP4-12 422910485100 -95.12251 30.36462 LIBERTY 5 Y 153 14109 3048 DP4-13 -95.09014 30.26730 LIBERTY 5 N 120 15687 1848 DP4-3 422250040000 -95.56082 31.14742 HOUSTON 5 Y 322 9518 100 DP4-4 424710020300 -95.47757 31.01410 WALKER 5 A Y 281 9978 220 DP4-5 -95.43850 30.92474 WALKER 5 N 135 13501 136 DP4-6 424710018100 -95.34689 30.86762 WALKER 5 Y 1673 13820 121 DP4-7 424710018300 -95.45950 30.67405 WALKER 5 B,C Y 385 15400 161 DP4-8 -95.37450 30.66102 WALKER 5 N 389 18158 185 DP4-9 424070013300 -95.32250 30.52700 SAN JACINTO 5 Y 400 12015 1251 DP5-10R 423390111100 -95.53685 30.22656 MONTGOMERY 6 Y 200 12347 1453 DP5-11R -95.53885 30.12109 HARRIS N 169 14044 3101 DP5-12 -95.43775 30.01302 HARRIS 6 N 1303 14011 2574 DP5-5R 423130010700 -95.93750 30.97917 MADISON 6 Y 3003 10276 90

TWDB Report ##: Structure of the Yegua-Jackson Aquifer of the Texas Gulf Coastal Plain
A-6
Appendix A, continued
Unique Well Identifier API Well Number1 Longitude Latitude County Dip Strike Digitized Kelly
Bushing2 Base of
Log Top
of Log DP5-6 -95.64900 30.87976 WALKER N 237 14543 93 DP5-7R 421850002400 -95.92779 30.66090 GRIMES Y 379 4802 85 DP5-8 423390000600 -95.66235 30.51081 MONTGOMERY 6 B,C Y 249 16764 277 DP5-9 -95.51494 30.44792 MONTGOMERY 6 N 279 13060 90 DP6-10 -95.69494 29.88019 HARRIS 7 N 157 14934 207 DP6-11 -95.56200 29.91220 HARRIS 7 N 136 15508 100 DP6-12 -95.53274 29.85048 HARRIS 7 N 120 17004 80 DP6-3 420410001200 -96.19500 30.61068 BRAZOS 7 A Y 201 6902 90 DP6-4 420410006300 -96.14550 30.48394 BRAZOS 7 Y 190 8215 150 DP6-5R 421850008300 -96.01345 30.33045 GRIMES 7 B Y 333 6980 739 DP6-6 -95.94000 30.27768 GRIMES 7 C N 340 11616 1723 DP6-7 424730004400 -95.84412 30.19444 WALLER 7 Y 249 12047 2535 DP6-8 422010788900 -95.66883 30.01346 HARRIS 7 Y 184 17470 2590 DP6-9 -95.69544 29.91652 HARRIS 7 N 163 16488 2600 DP7-1R 420410002700 -96.38975 30.56207 BRAZOS Y 307 4568 330 DP7-2 -96.22450 30.45920 BRAZOS N 2923 7776 30 DP7-3 424770025600 -96.20150 30.35986 WASHINGTON Y 308 9796 999 DP7-4 424730000500 -96.09163 30.19948 WALLER B,C Y 254 20788 68 DP7-5 -96.13050 30.10758 WALLER N 235 11635 96 DP7-6 424730031800 -95.93155 29.90528 WALLER 8 Y 211 13525 132 DP7-7 -95.88785 29.81272 WALLER 8 N 186 19013 3002 DP7-8 -95.91255 29.77941 WALLER 8 N 181 11344 2538 DP7-9 -95.80926 29.73611 FORT BEND 8 N 147 13521 2776 DP8-2 420510007700 -96.49550 30.42491 BURLESON 8 A Y 323 65164 DP8-3R 424770023900 -96.40040 30.25998 WASHINGTON 8 Y 345 9424 90 DP8-4 424770027200 -96.25473 30.18294 WASHINGTON 8 B,C Y 291 10964 1322 DP8-5 424770029400 -96.25347 30.09722 WASHINGTON 8 Y 285 10501 120 DP8-6 -96.24450 30.00022 AUSTIN 8 N 275 10005 DP8-7 420150024200 -96.20418 29.97159 AUSTIN 8 Y 192 10513 1397 DP8-8 420150053600 -96.13645 29.79704 AUSTIN 9 Y 190 7570 610 DP8-9 -95.99058 29.74957 WALLER N 136 13509 111 DP9-10R -96.44600 29.80793 COLORADO 10 C N 333 10998 2014

TWDB Report ##: Structure of the Yegua-Jackson Aquifer of the Texas Gulf Coastal Plain
A-7
Appendix A, continued
Unique Well Identifier API Well Number1 Longitude Latitude County Dip Strike Digitized Kelly
Bushing2 Base of
Log Top
of Log DP9-11R 420890017200 -96.38492 29.66050 COLORADO 10 Y 227 9023 1683 DP9-12 -96.21379 29.67422 AUSTIN 9 N 169 11988 115 DP9-13 -96.12599 29.51764 WHARTON 9 N 136 14701 154 DP9-5R 422870008400 -96.80379 30.17231 LEE 10 A N 4473 3052 155 DP9-6 424770036500 -96.65239 30.24110 WASHINGTON 9 Y 340 10235 715 DP9-7 424770036600 -96.58665 30.13281 WASHINGTON 9 B N 438 4108 DP9-8R 420150001700 -96.44900 30.00825 AUSTIN 9 C Y 335 10802 1819 DP9-9 420890001500 -96.51942 29.83247 COLORADO 10 N 320 11424 60 DPA-22 424570005700 -94.35492 30.85273 TYLER 2 Y 300 14510 100 DPB-12 422970153300 -97.91397 28.27517 LIVE OAK 18 Y 222 6310 317 DPB-13R 420250160200 -97.80663 28.49135 BEE 17 Y 326 8725 1520 DPB-15A -97.51716 28.69141 GOLIAD N 212 10498 100 DPB-15R -97.49510 28.70595 GOLIAD N 297 9726 1746 DPB-17 -97.14032 28.93555 VICTORIA 14 N 145 9226 921 DPB-2 422470225800 -98.84183 26.86635 JIM HOGG 27 B,C Y 6033 5006 90 DPB-20 -96.76722 29.23481 LAVACA N 156 10006 1026 DPB-5 421310782600 -98.51265 27.57509 DUVAL 22 Y 477 6312 425 DPB-9R 422973030100 -98.08706 28.09528 LIVE OAK 19 Y 281 7005 1635 DPC-2 422150078300 -98.43726 26.28571 HIDALGO 30 C Y 230 10260 9887 FQ-103 421490013700 -97.19862 29.77778 FAYETTE 12 A Y 434 5015 265 FRAZIERCOCHRAN719 422550023600 -97.73081 29.16233 KARNES 15 A Y 3333 3050 95 GINTHERKILLAM206 -99.28162 27.58058 WEBB 23 N 685 4509 152 GQ-90 421770006100 -97.22768 29.53082 GONZALES 13 A Y 409 7503 410 GRQ-29 421850009400 -95.89300 30.47692 GRIMES B Y 390 GULFSNB258 425050228800 -99.03933 26.91754 ZAPATA 27 A Y 460 11188 80 GULFURIBE246 425053148600 -99.30677 27.08803 ZAPATA 26 Y 431 11516 55 HEWITTMANFORD718 -97.87105 29.16507 WILSON 15 N 420 7023 85 HOWETHRAMIREZ288 424270226000 -99.02740 26.54007 STARR 29 A Y 367 5206 328 HQ-31 -95.43131 31.13507 HOUSTON N 294 8237 50 HQ-327 -95.13214 31.31909 HOUSTON 4 N 294 1892 50 HUMBLEGARCIA269 425050274200 -98.96635 26.85504 ZAPATA A Y 486 6502 100 JONNELLLOPEZ278 425050297300 -99.09460 26.72474 ZAPATA 28 A Y 382 10215 117
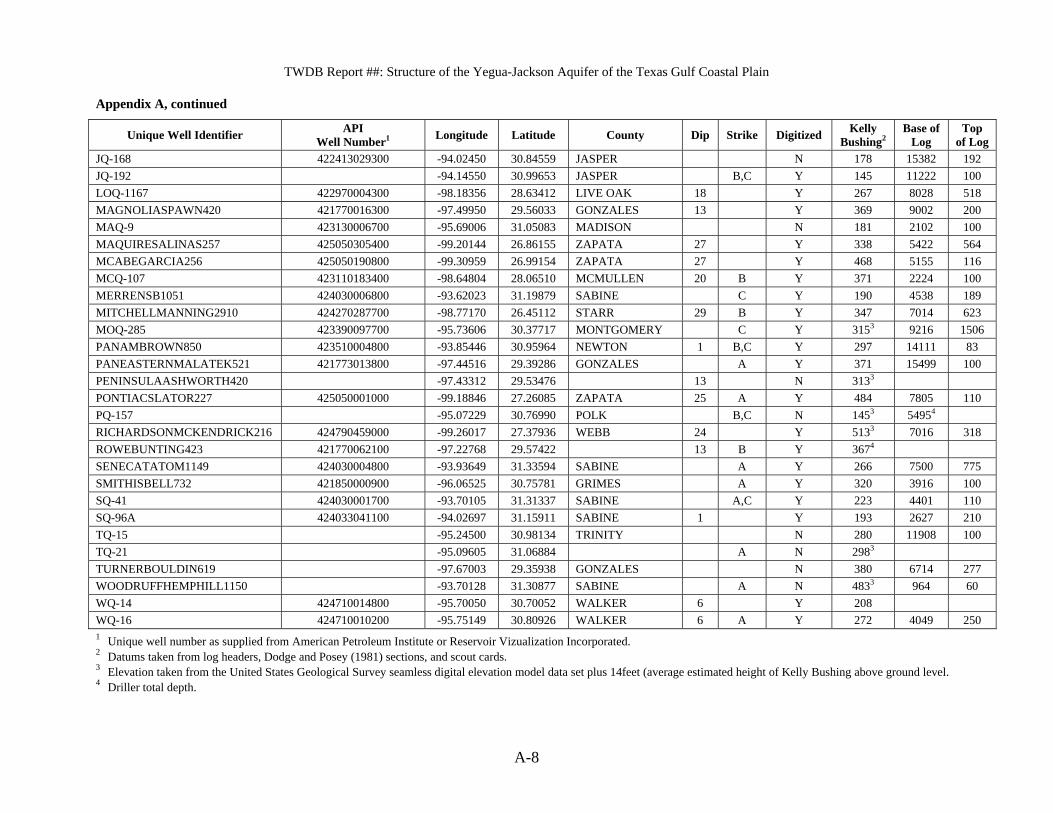
TWDB Report ##: Structure of the Yegua-Jackson Aquifer of the Texas Gulf Coastal Plain
A-8
Appendix A, continued
Unique Well Identifier API Well Number1 Longitude Latitude County Dip Strike Digitized Kelly
Bushing2 Base of
Log Top
of Log JQ-168 422413029300 -94.02450 30.84559 JASPER N 178 15382 192 JQ-192 -94.14550 30.99653 JASPER B,C Y 145 11222 100 LOQ-1167 422970004300 -98.18356 28.63412 LIVE OAK 18 Y 267 8028 518 MAGNOLIASPAWN420 421770016300 -97.49950 29.56033 GONZALES 13 Y 369 9002 200 MAQ-9 423130006700 -95.69006 31.05083 MADISON N 181 2102 100 MAQUIRESALINAS257 425050305400 -99.20144 26.86155 ZAPATA 27 Y 338 5422 564 MCABEGARCIA256 425050190800 -99.30959 26.99154 ZAPATA 27 Y 468 5155 116 MCQ-107 423110183400 -98.64804 28.06510 MCMULLEN 20 B Y 371 2224 100 MERRENSB1051 424030006800 -93.62023 31.19879 SABINE C Y 190 4538 189 MITCHELLMANNING2910 424270287700 -98.77170 26.45112 STARR 29 B Y 347 7014 623 MOQ-285 423390097700 -95.73606 30.37717 MONTGOMERY C Y 3153 9216 1506 PANAMBROWN850 423510004800 -93.85446 30.95964 NEWTON 1 B,C Y 297 14111 83 PANEASTERNMALATEK521 421773013800 -97.44516 29.39286 GONZALES A Y 371 15499 100 PENINSULAASHWORTH420 -97.43312 29.53476 13 N 3133 PONTIACSLATOR227 425050001000 -99.18846 27.26085 ZAPATA 25 A Y 484 7805 110 PQ-157 -95.07229 30.76990 POLK B,C N 1453 54954 RICHARDSONMCKENDRICK216 424790459000 -99.26017 27.37936 WEBB 24 Y 5133 7016 318 ROWEBUNTING423 421770062100 -97.22768 29.57422 13 B Y 3674 SENECATATOM1149 424030004800 -93.93649 31.33594 SABINE A Y 266 7500 775 SMITHISBELL732 421850000900 -96.06525 30.75781 GRIMES A Y 320 3916 100 SQ-41 424030001700 -93.70105 31.31337 SABINE A,C Y 223 4401 110 SQ-96A 424033041100 -94.02697 31.15911 SABINE 1 Y 193 2627 210 TQ-15 -95.24500 30.98134 TRINITY N 280 11908 100 TQ-21 -95.09605 31.06884 A N 2983 TURNERBOULDIN619 -97.67003 29.35938 GONZALES N 380 6714 277 WOODRUFFHEMPHILL1150 -93.70128 31.30877 SABINE A N 4833 964 60 WQ-14 424710014800 -95.70050 30.70052 WALKER 6 Y 208 WQ-16 424710010200 -95.75149 30.80926 WALKER 6 A Y 272 4049 250 1 Unique well number as supplied from American Petroleum Institute or Reservoir Vizualization Incorporated. 2 Datums taken from log headers, Dodge and Posey (1981) sections, and scout cards. 3 Elevation taken from the United States Geological Survey seamless digital elevation model data set plus 14feet (average estimated height of Kelly Bushing above ground level. 4 Driller total depth.

Appendix B
Operator, Well Name and Number, and
Tobin Grid Location for Study Wells

This page is intentionally blank.

TWDB Report ##: Structure of the Yegua-Jackson Aquifer of the Texas Gulf Coastal Plain
B-1
Appendix B Operator, Well Name and Number, and Tobin Grid Location for Study Wells
UNIQUE WELL IDENTIFIER COMPANY WELL NAME/NUMBER TOWNSHIP
RANGE SECTION LOCATION1
5944109 LASALLE ENERGY 6617614 LAYNE TEXAS COMPANY CITY OF SCHULENBURG TEST HOLE #1-80 AHERNHUBBARD205 T.J. AHERN HUBBARD A-1 AQ-39 K.L. MC HENRY LONG BELL #1 AQ-52 C. ANDRADE III OTIS NERRIN #1 AQ-78 PLACID OIL COMPANY FAIRCHILD #1 ARCOSAENZ299 THE ATLANTIC REFINING COMPANY TOMAS SAENZ NO. 1 29S-9E-4 ARCOTEMPLE948 ATLANTIC-RICHFIELD COMPANY TEMPLE INDUSTRIES 1 9N-48E-8 ATQ-228 TRI-MARK & TEXITA OIL COMPANY JOE WILLIAMS #1 BENTSENVIDAURRI235 BENTSEN & WHITTINGTON JUAN VIDAURRI #1 BLANCOJENNINGS247 BLANCO OIL CO. JENNINGS #1 CLARKSALINAS279 CLARK FUEL PRODUCING COMPANY JOSE R. SALINAS #6 CONSOLIDATEDVELA215 CONSOLIDATED OIL & GAS, INC. VELA #1 CQ-343 CITIES SERVICE OIL COMPANY GOECKLER UNIT #1 DP10-10N STANDARD OIL COMPANY OF TEXAS GUY F. STOVALL #4, WELL NO. 1 5S-29E-8 DP10-11 MAGNOLIA PETROLEUM COMPANY C.R. REYNOLDS #1 5S-30E-8 DP10-3R TRADERS OIL CO. FLECK #1 1S-24E-7 DP10-4R KENNECOTT COPPER CORP. SCHWARTZ #1 1S-25E-8 DP10-5R AMERICAN LIBERTY OIL COMPANY BOHLOTTMAN #1 1S-26E-1 DP10-6 AMOCO WEGENHOFT #1 2S-26E-6 DP10-7 CARTHAY LAND COMPANY LEROY STEIN #1 3S-27E-6 DP10-8 NATIONAL EXPLORATION COMPANY C.G. GLASSCOCK # 1 4S-28E-3 DP10-9 SHELL KYLE EST. #1 4S-29E-8 DP11-10 SHELL TAYLOR NO. 1 6S-27E-5 DP11-11 H.L. HAWKINS & H.L. HAWKINS JR.
NORTH CENTRAL OIL MRS. SADA BARNES #1 6S-27E-8
DP11-7R THE SUPERIOR OIL COMPANY L.M. KLEKAR #1 5S-25E-4 DP11-8 THE PURE OIL COMPANY E.E. KOLAR #1 6S-27E-2 DP12-6A O.W. KILLAM E.F. HOCH #1 6S-22E-1 DP12-7 H.J. CHAVANNE, TRUSTEE CARTER #1 6S-24E-8 DP12-8 SHELL OIL COMPANY WILLIAM BORCHERS #3 7S-26E-5 DP13-3 KIRKWOOD & MORGAN J.R. TINSLEY #1 5S-20E-9 DP13-4R AMERADA PETR. CORP. MORGAN-KUMETKA #2 6S-21E-4/5 DP13-5 H.L. HUNT W.R. MILLER 7S-21E-2/3

TWDB Report ##: Structure of the Yegua-Jackson Aquifer of the Texas Gulf Coastal Plain
B-2
Appendix B, continued
UNIQUE WELL IDENTIFIER COMPANY WELL NAME/NUMBER TOWNSHIP
RANGE SECTION LOCATION1
DP13-6 GULF OIL CORPORATION MUELLER #1 8S-21E-1 DP13-7 LONE STAR PRODUCING COMPANY FELIX HILLER #1 8S-22E-6 DP13-8 TEXACO, INCORPORATED O.G. PROBST #1 8S-23E-5 DP13-9 HUMBLE OIL & REFINING COMPANY ADA B. PRIDGEN #1 8S-23E-4 DP1-4 LESTER & CULBERTSON CHILDERS 1 11N-47E-7 DP14-4R GEOCHEMICAL SURVEYS ANTON F. TAM JR. #1 8S-19-8 DP14-5R TEXAS EASTERN TRANSMISSION CORP. HERMAN A. GARBE #1 9S-19E-7 DP14-6 MONSANTO COMPANY & PENNZOIL UNITED INC. DENTLER #1 9S-21-9 DP14-7 LONE STAR PRODUCING COMPANY EMMA HAYNES ESTATE #1 10S-21E-3 DP14-8 CHEVRON OIL COMPANY R.G. JACOBS #1 10S-22E-9 DP14-9 SHELL OIL COMPANY O.J. FRIEDRICHES #1 11S-22E-4 DP1-4A TALMADGE COMBS W.B. THORNTON EST 1 10N-46E-6 DP1-5 HUMBLE OIL & REFINING COMPANY NONA MILLS ET AL 1 9N-46E-9 DP15-10 SHELL OIL COMPANY C.A. ATKINSON #1 10S-19E-9 DP15-11R VIKING DRILLING COMPANY ET AL J.W. RAY ESTATE #1 11S-19E-8 DP15-13 PURE OIL COMPANY O'BRIEN-HARKINS "B" #1 13S-21E-9 DP15-5 TEXON ROYALTY CO. MOCZYGEMBA #1 8S-16E-7 DP15-6R COASTAL STATES GAS PRODUCING COMPANY J. KOWALIK #1 9S-17E-2 DP15-7 TEXAS EASTERN PRODUCTION CORPORATION OTIS S. WUEST A#1 9S-17E-7 DP15-8 HARRISON HYSAW #1 10S-18E-3 DP15-9 GENERAL CRUDE OIL COMPANY TIPPS #1 10S-18E-1/6 DP1-6 DAVIDSON ET-AL HERBERT NEYLAND ET-AL 1 8N-46E-1-2 DP16-3 O.G. MCCLAIN S.V. HOUSTON #1 9S-15E-9 DP16-5A HAMMAN OIL & REFINING COMPANY & STATE WALTER A. GOETZE #1 11S-16E-1 DP16-5R SEABOARD OIL COMPANY SALLYE TREADWELL #1 10S-16E-4 DP16-6 SHELL OIL COMPANY ALVIN L. O'NEAL #1 12S-17E-3 DP16-8 ATLANTIC-RICHFIELD COMPANY J.R. DOUGHERTY ESTATE #2 12S-18E-8 DP1-7 GRUBB & HAWKINS KIRBY LUMBER CO. 1 6N-47-6 DP17-10 CONTINENTAL OIL COMPANY ALVINA MCKINNEY #1 13S-16E-7 DP17-11 H.L. BROWN JR. G.L. HAYES #1 14S-16E-6 DP17-13 SKINNER CORP. HOLMAN CARTWRIGHT 15S-17E-9 DP17-3R MAGNOLIA PETROLEUM COMPANY STEINLE #1 10S-12E-2/3 DP17-4 THOMAS DRILLING CORP. PEELER-SHAW 11S-12E-1

TWDB Report ##: Structure of the Yegua-Jackson Aquifer of the Texas Gulf Coastal Plain
B-3
Appendix B, continued
UNIQUE WELL IDENTIFIER COMPANY WELL NAME/NUMBER TOWNSHIP
RANGE SECTION LOCATION1
DP17-5 HUMBLE OIL & REFINING COMPANY GUBBELS #14 12S013E-3 DP17-6 CONTINENTAL OIL COMPANY RICHARD HORTON #1 12S-13E-8/9 DP17-7R STANDARD OIL COMPANY OF TEXAS J.V. ISAACKS #1 13S-14E-1/2 DP17-8 SEABOARD OIL COMPANY GIBBENS #1 13S-15E-2 DP17-9 HUMBLE OIL & REFINING COMPANY A.W. WEST, ET.AL. #1 13S-15E-7 DP18-10 TEXAM OIL CORP. HAYS-EZZELL #1 14S-14E-4 DP18-11 ATLANTIC-RICHFIELD COMPANY EL PASO NAT'L GAS 300 #1 15S-14E-6 DP18-13 STANDARD OIL COMPANY OF TEXAS MRS. CLAY WEST BURNS #1 15S-15E-5 DP18-14 HAAS OIL COMPANY & MELBA PRODUCTION
COMPANY B.W. COX #1 17S-15E-5
DP18-5 MILAM DRILLING COMPANY W.R. HINDES EST. #1 11S-10E-5 DP18-6 WINDSOR OIL COMPANY JESSE MCNEEL #1 12S-10E-8 DP18-7R H.R. SMITH & GULF OIL CORP. GEO. SEALY EST #1 13S-11E-5 DP18-8 STANDARD OIL COMPANY OF TEXAS J.F. HENRY #1 13S-12E-1 DP18-9 PAN AMERICAN PETROLEUM CORP. L.S. MCCLAUGHERTY NO. 1 13S-12E-7 DP19-10R JACK FROST SOUTH TEXAS SYNDICATE #4 14S-10E-5 DP19-11 PHILLIPS PETROLEUM COMPANY NUECES "A" LEASE WELL #1 15S-11E-4 DP19-12 RUSSELL MAGUIRE HOLLAND RANCH #1 15S-12E-3 DP19-13 W. RIDLEY WHEELER ESTATE RIVES WELL #1 15S-12E-6 DP19-14 COASTAL STATES GAS PRODUCING COMPANY RAGSDALE #1 16S-13E-4 DP19-15 ARGO OIL CORPORATION JUAN R. LOPEZ #1 17S-14E-6 DP19-6 LANN AND MCCLANNAHAM STOREY & REED #1 12S-8E-7 DP19-7 ENGEO OIL & GAS CO. & SAM LARUE ET. AL. MARGARET ANN KIMBALL #1 13S-9E-3 DP19-8R PAN AMERICAN PETROLEUM CORP. A.M. FOERSTER #1 14S-9E-3 DP19-9 PHILLIPS PETROLEUM COMPANY LA SALLE #1 14S-9E-6 DP20-10 HUGHES & HUGHES LOUIS C. KOEHNE #1 15S-8E-4 DP20-11 ROYAL OIL & GAS CORPORATION ROBERT COQUAT #B-1 16S-8E-2 DP20-12 COASTAL STATES GAS PRODUCING COMPANY ST. LOUIS UNION TRUST CO. NO. 1 16S-9E-4 DP20-13 GENERAL CRUDE OIL COMPANY ADAMI "A" WELL #2 16S-10E-9 DP20-14 MAGNOLIA PETROLEUM COMPANY D.C.R.C. SEC. #79 17S-11E-9 DP20-15R MOBIL OIL COMPANY DUVAL COUNTY RANCH COMPANY,
SECTION 80, WELL # 8 18S-11E
DP20-16 SHELL OIL COMPANY L.H. PENWELL #1 18S-12E-5 DP20-17 SHELL OIL COMPANY L.C. WEATHERBY "A" #1 18S-12E-6

TWDB Report ##: Structure of the Yegua-Jackson Aquifer of the Texas Gulf Coastal Plain
B-4
Appendix B, continued
UNIQUE WELL IDENTIFIER COMPANY WELL NAME/NUMBER TOWNSHIP
RANGE SECTION LOCATION1
DP20-18 TAYLOR REFINING COMPANY PARR NO. T-2 18S-14E-9 DP20-19 THE TEXAS COMPANY H.M. GRAVIS #1-A 19S-13E-6 DP20-8 LIGHTNING OIL COMPANY LLOYD HURT #1-68 14S-6E-5 DP20-9 SUTTON PROD. CO. C.N. COOKE #2A 14S-7E-7 DP2-10 JUSTISS-MEARS OIL COMPANY W.T. CARTER & BROTHER B-1 7N-44E-4 DP2-11 GULF OIL CORPORATION CARTER-CAMDEN 1 6N-44E-4-5 DP21-10 HUNT OIL CO. L.O. WALKER #1 18S-8E-8 DP21-11R THE TEXAS COMPANY A. MOSS # B-1 18S-9E-7 DP21-12 THE ATLANTIC REFINING COMPANY BILLINGS #1-A 19S-10E-9 DP21-13 JAKE L. HAMON, ET AL AMADO PEREZ, ET AL #1 20S-10E-5/8 DP21-14 THE BRITISH AMERICAN PROD. CO. ADAMS #1 22S-10E-5 DP21-15 HUMBLE OIL & REFINING COMPANY MESTINA NO. 3 S.H. 23S-12E-4/9 DP21-16 RUSSELL MAGUIRE SAUNDERS #1 24S-13E-2 DP2-12 SHELL OIL COMPANY KIRBY LUMBER CO. A-352 NO. 1 5N-44E-6 DP2-13 INTERNATIONAL NUCLEAR CORP. A.R. E 5. 4N-44-5 DP21-6R UNIVERSAL PETROLEUM CORP. B.B. DUNBAR NO. 1 16S-5E-9 DP21-7 MAYFAIR MINERALS INC. R.J. MARTIN #1 16S-6E-8 DP21-8R MOBIL OIL COMPANY CALLAGHAN RANCH #36 17S-7E-9 DP21-9R SUN OIL HIRSCH #2 18S-7E-5 DP22-10R NORTHERN NATURAL GAS COMPANY B.M.T. #1 21S-7E-8 DP22-11 SKELLY OIL COMPANY J.C. MARTIN #6 21S-8E-8/9 DP22-12 TEXACO, INCORPORATED O.G. DE DA CAMARA NO. 28 21S-8E-8/9 DP22-13 THE ATLANTIC REFINING COMPANY PUIG GAS UNIT #1 22S-9E-3 DP22-14 ATLANTIC-RICHFIELD COMPANY MARRS MCLEAN "C" #3 22S-9E-7 DP22-15 ALLEN & BEMIS D.O. GALLAGHER NO. 2 24S-10E-5 DP22-16 CORPUS CHRISTI OIL & GAS COMPANY WEIL BROTHERS #4 25S-11E-2 DP22-17 SUN OIL A.C. JONES #45 25S-12E-9 DP22-18 HUMBLE OIL & REFINING COMPANY BASS #30 26S-13E-5 DP22-6 LAMAR HUNT S. BENAVIDES #1 18S-5E-8 DP22-7R RODNEY DELANGE AND O. NEATHERY JR. CALLAGHAN LAND PASTORAL COMPANY #2 19S-6E-2 DP22-8 GINTHER, WARREN & GINTHER, GULF &
HALBOUTY O.W. KILLAM # 1-A 20S-6E-2
DP22-9R KILLAM KILLAM #1 20S-7E-7
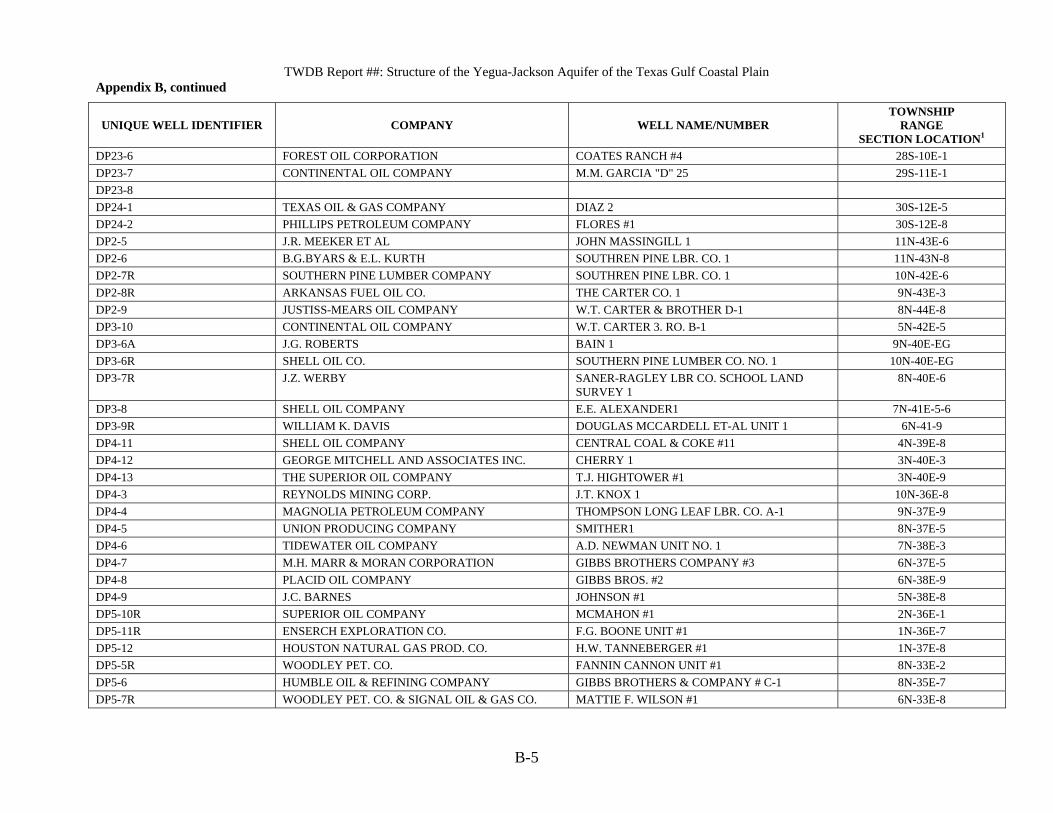
TWDB Report ##: Structure of the Yegua-Jackson Aquifer of the Texas Gulf Coastal Plain
B-5
Appendix B, continued
UNIQUE WELL IDENTIFIER COMPANY WELL NAME/NUMBER TOWNSHIP
RANGE SECTION LOCATION1
DP23-6 FOREST OIL CORPORATION COATES RANCH #4 28S-10E-1 DP23-7 CONTINENTAL OIL COMPANY M.M. GARCIA "D" 25 29S-11E-1 DP23-8 DP24-1 TEXAS OIL & GAS COMPANY DIAZ 2 30S-12E-5 DP24-2 PHILLIPS PETROLEUM COMPANY FLORES #1 30S-12E-8 DP2-5 J.R. MEEKER ET AL JOHN MASSINGILL 1 11N-43E-6 DP2-6 B.G.BYARS & E.L. KURTH SOUTHREN PINE LBR. CO. 1 11N-43N-8 DP2-7R SOUTHERN PINE LUMBER COMPANY SOUTHREN PINE LBR. CO. 1 10N-42E-6 DP2-8R ARKANSAS FUEL OIL CO. THE CARTER CO. 1 9N-43E-3 DP2-9 JUSTISS-MEARS OIL COMPANY W.T. CARTER & BROTHER D-1 8N-44E-8 DP3-10 CONTINENTAL OIL COMPANY W.T. CARTER 3. RO. B-1 5N-42E-5 DP3-6A J.G. ROBERTS BAIN 1 9N-40E-EG DP3-6R SHELL OIL CO. SOUTHERN PINE LUMBER CO. NO. 1 10N-40E-EG DP3-7R J.Z. WERBY SANER-RAGLEY LBR CO. SCHOOL LAND
SURVEY 1 8N-40E-6
DP3-8 SHELL OIL COMPANY E.E. ALEXANDER1 7N-41E-5-6 DP3-9R WILLIAM K. DAVIS DOUGLAS MCCARDELL ET-AL UNIT 1 6N-41-9 DP4-11 SHELL OIL COMPANY CENTRAL COAL & COKE #11 4N-39E-8 DP4-12 GEORGE MITCHELL AND ASSOCIATES INC. CHERRY 1 3N-40E-3 DP4-13 THE SUPERIOR OIL COMPANY T.J. HIGHTOWER #1 3N-40E-9 DP4-3 REYNOLDS MINING CORP. J.T. KNOX 1 10N-36E-8 DP4-4 MAGNOLIA PETROLEUM COMPANY THOMPSON LONG LEAF LBR. CO. A-1 9N-37E-9 DP4-5 UNION PRODUCING COMPANY SMITHER1 8N-37E-5 DP4-6 TIDEWATER OIL COMPANY A.D. NEWMAN UNIT NO. 1 7N-38E-3 DP4-7 M.H. MARR & MORAN CORPORATION GIBBS BROTHERS COMPANY #3 6N-37E-5 DP4-8 PLACID OIL COMPANY GIBBS BROS. #2 6N-38E-9 DP4-9 J.C. BARNES JOHNSON #1 5N-38E-8 DP5-10R SUPERIOR OIL COMPANY MCMAHON #1 2N-36E-1 DP5-11R ENSERCH EXPLORATION CO. F.G. BOONE UNIT #1 1N-36E-7 DP5-12 HOUSTON NATURAL GAS PROD. CO. H.W. TANNEBERGER #1 1N-37E-8 DP5-5R WOODLEY PET. CO. FANNIN CANNON UNIT #1 8N-33E-2 DP5-6 HUMBLE OIL & REFINING COMPANY GIBBS BROTHERS & COMPANY # C-1 8N-35E-7 DP5-7R WOODLEY PET. CO. & SIGNAL OIL & GAS CO. MATTIE F. WILSON #1 6N-33E-8

TWDB Report ##: Structure of the Yegua-Jackson Aquifer of the Texas Gulf Coastal Plain
B-6
Appendix B, continued
UNIQUE WELL IDENTIFIER COMPANY WELL NAME/NUMBER TOWNSHIP
RANGE SECTION LOCATION1
DP5-8 PHILLIPS PETROLEUM COMPANY COKE "A" #1 5N-35E-7 DP5-9 THE SUPERIOR OIL COMPANY &
CARLTON D. SPEED JR. JAMES B. SYKES #1 4N-36E-6
DP6-10 STANDARD OIL COMPANY OF TEXAS G.J. MELLINGER ET AL 4 #1 1S-35E-8 DP6-11 PAN AMERICAN PETROLEUM CORP. DOROTHY D. BROWN #1 1S-36E-8 DP6-12 PAN AMERICAN PETROLEUM CORP. HOUSTON UNIT N-6W-10 #1 2S-36E-1 DP6-3 HUMBLE OIL & REFINING COMPANY R.P. TRANT #1 5N-31E-2 DP6-4 THE TEXAS COMPANY ORLANDO #1 4N-31E-1 DP6-5R LEIGH J. SESSIONS BARRY #1 3N-32E-6 DP6-6 GULF OIL CORPORATION WM. GARDNER #2 3N-33E-8 DP6-7 THE TEXAS COMPANY RICE INSTITUTE #1 2N-34-4 DP6-8 TEXACO, INCORPORATED M.M. MERGELE #1 DP6-9 TEXACO, INCORPORATED J.J. SWEENEY ESTATE #1 1S-35E-5 DP7-1R VEE TIPT OIL COMPANY N.A. STEWART NO. 1 5N-29E-6 DP7-2 PHILLIPS PETROLEUM COMPANY RENCHIE #1 4N-31E-3 DP7-3 GULF COAST LEASEHOLDS, INC. G.W.TATE ET UX #1 3N-31E-2 DP7-4 SHELL OIL COMPANY G.A. CHAPMAN #1 2N-32E-4 DP7-5 MIAMI OIL PRODUCERS, INC. ARCH H. ROWAN #1 1N-31E-1 DP7-6 MICHEL T HALBOUTY JOHN W. HARRIS ET AL WELL #1 1S-33E-8 DP7-7 HUMBLE OIL & REFINING COMPANY KATY GAS FIELD UNIT 1-W 3 2S-33E-6 DP7-8 EXXON COMPANY, U.S.A. A.D. PARKER #1 2S-33E-7 DP7-9 SCURLOCK OIL COMPANY VIRGINA J. MEEK #1 3S-34E-2 DP8-2 HAVEN OIL CO. LEWIS EST. NO. 1 4N-29E-4 DP8-3R TEX HARVEY OIL COMPANY FRED W. DALLAS #1 3N-29E-7 DP8-4 UNION SULPHER COMPANY JOE KUBECZA #1 2N-30E-6 DP8-5 MAGNOLIA PETROLEUM COMPANY GIDDINGS EST. #1 1N-30E-1 DP8-6 SKELLY OIL COMPANY LANDER #1 1N-31E-9 DP8-7 H.L. HAWKINS MEWIS #1 1S-31E-2 DP8-8 LUETH & ROBISHAW O.C. KURTZ #1 2S-31E-6 DP8-9 MOUND COMPANY JOHN H. ENGLAND ET AL #1 3S-33E-3 DP9-10R THE PETROLEUM CORPORATION OF DELAWARE H.A. LEVRIER #1 2S-29E-5 DP9-11R CITIES SERVICE OIL COMPANY POOLE #A-2 3S-29E-7

TWDB Report ##: Structure of the Yegua-Jackson Aquifer of the Texas Gulf Coastal Plain
B-7
Appendix B, continued
UNIQUE WELL IDENTIFIER COMPANY WELL NAME/NUMBER TOWNSHIP
RANGE SECTION LOCATION1
DP9-12 HUMBLE OIL & REFINING COMPANY CHARLES KAECHELE "B" #1 3S-31E-4 DP9-13 GETTY OIL COMPANY W.C. LEVERAGE #1 4S-31E-7 DP9-5R M.M. MILLER & SONS SMITH NO. 1 2N-26E-5 DP9-6 R.J. WMELAN SOLOMON #1 2N-27E-1 DP9-7 SPEED MAKOWSKY #1 2N-28E-9 DP9-8R DAKAMONT EXPLORATION CORP. WEISE #1 1N-29E-8 DP9-9 SINCLAIR-PRARIE T. GORDON #1 2S-28E-1 DPA-22 PAN AMERICAN PETROLEUM CORP. LONG BELL 1 7N-46E-3 DPB-12 HASS BROTHERS W.H. RANGE 1 14S-17E-7 DPB-13R MOKEEN OIL COMPANY AUSTIN E BROWN 1 135-18E-2-6 DPB-15A HUMBLE OIL & REFINING COMPANY OTTO A. NEESE #1 11S-20E-6 DPB-15R VAQUERO PETROLEUM COMPANY T.A. BUCKERT 1 11S-21E-4 DPB-17 MRS. JAMES R. DOUGHERTY MURPHY 1 9S-23E-6 DPB-2 HUMBLE OIL & REFINING COMPANY E.B. ATWOOD # D-3 26S-10E-3 DPB-20 CHRISTIE MITCHELL & MITCHELL CRANZ 3 7S-26E-1 DPB-5 A.M. & R. CO. J. OLIVERA #1 20S-12E-6 DPB-9R HUMBLE OIL & REFINING COMPANY C.L. MC CASLIN #12 16S-16E-3 DPC-2 COASTAL STATES GAS PRODUCING COMPANY T.F. MURCHISON #1 30S-13E-8 FQ-103 RODNEY DE LANGE- O' NEATHERY, JR. E.A. ARNIM #1 FRAZIERCOCHRAN719 JACK W. FRAZIER COCHRAN RANCH #1 GINTHERKILLAM206 GINTHER, WARREN & GINTHER, GULF &
HALBOUTY O.W. KILLAM #2
GQ-90 TEX-PENN OIL & GAS CORPORATION & SOUTHLAND DRLG. COMPANY
J.T. THOMPSON #1
GRQ-29 KELLY #1 GULFSNB258 GULF RESOURCES INC. SECURITY NATINAL BANK OF
LOS ANGELES CALF. #1
GULFURIBE246 GULF OIL CORPORATION S. URIBE #8 HEWITTMANFORD718 HEWIT B. DOUGHERTY T.D. MANFORD #1 HOWETHRAMIREZ288 HOWETH RAMIREZ #1 HQ-31 CONTINENTAL OIL COMPANY BYRLE E. WOOTTERS #1 HQ-327 COOK EXPLORATION SEEDTICK #1 HUMBLEGARCIA269 HUMBLE OIL & REFINING COMPANY ANASTASIO GARCIA #1

TWDB Report ##: Structure of the Yegua-Jackson Aquifer of the Texas Gulf Coastal Plain
B-8
Appendix B, continued
UNIQUE WELL IDENTIFIER COMPANY WELL NAME/NUMBER TOWNSHIP
RANGE SECTION LOCATION1
JONNELLLOPEZ278 JONNELL GAS COMPANY LOPEZ (HEIRS) #1 JQ-168 LAMAR HUNT MCMAHON #1 JQ-192 KELLY-BROOK ARCO HULING #1 LOQ-1167 BUZZINI DRILLING COMPANY W.R. SEALE #1 MAGNOLIASPAWN420 MAGNOLIA PETROLEUM COMPANY WALTER SPAHN #1 4S-20E-6 MAQ-9 WOODLEY PET. CO. FORREST #1 MAQUIRESALINAS257 RUSSELL MAGUIRE SALINAS-LOPEZ UNIT #1 MCABEGARCIA256 J. C. MCCABE GARCIA-TREVINO SISTERS #1 MCQ-107 HAROLD K. BOYSEN WALKER #1 MERRENSB1051 K.E. MERREN STARK & BROWN 1 10N-51E MITCHELLMANNING2910 J.B. MITCHELL GREEN & MANNING #1 29S-10E MOQ-285 THE TEXAS COMPANY SEALY SMITH #1 PANAMBROWN850 PAN AMERICAN PETROLEUM CORP. E.W. BROWN. JR. "A" 1 8N-50E-5 PANEASTERNMALATEK521 PAN EASTERN EXPLORATION COMPANY MALATEK #1 5S-21E-8 PENINSULAASHWORTH420 PONTIACSLATOR227 PONTIAC REFINING CORPORATION SLATOR RANCH #1 PQ-157 KOUNTZE MUD SERVICE T.D. STANFORD #1 RICHARDSONMCKENDRICK216 RICHARDSON PETROLEUM ENT. INC. W.H. MCKENDRICK #1 ROWEBUNTING423 SENECATATOM1149 SENECA DEVELOPMENT COMPANY LYNN TATOM #1 SMITHISBELL732 JAMES E. SMITH ISBELL #1 7N-32E-8 SQ-41 GOLDSMITH SOUTHERN PINE LUMBER CO. NO. 1 SQ-96A SONERRA RESOURCES BEAR CREEK #1 TQ-15 PAULEY PETROLEUM INCORPORATED &
MCCULLOCH OIL CORP. CAMERON HEIRS #4
TQ-21 TURNERBOULDIN619 M.O. TURNER C.P. BOULDIN #1 6S-19E-2 WOODRUFFHEMPHILL1150 R.S. WOODRUFF & ASSOCIATES, INC. HEMPHILL 2 11N-50E WQ-14 WQ-16 **** A. JACKSON 1 Township, range, section location from Tobin Maps.

Appendix C
Measured Depth to Layer Boundaries by Well,
Annotated with Correlation Quality Ranking

This page is intentionally blank.

TWDB Report ##: Structure of the Yegua-Jackson Aquifer of the Texas Gulf Coastal Plain
C-1
Appendix C Measured Depth to Layer Boundaries by Well, Annotated with Correlation Quality Ranking (see Section 4.2.4)
Unique Well Identifier Top Jackson Quality
Top Lower
Jackson Quality Top
Yegua Quality Top
Lower Yegua
Quality
Base Yegua-Jackson Aquifer
Quality
5944109 270 A 6617614 440 A 1160 C AHERNHUBBARD205 AQ-39 190 A 550 A 840 A AQ-52 440 A 830 A 1150 A AQ-78 360 A ARCOSAENZ299 2070 A ARCOTEMPLE948 870 A 1510 A 1810 A 2300 A 2740 A ATQ-228 270 A 640 A BENTSENVIDAURRI235 BLANCOJENNINGS247 800 A 1350 A CLARKSALINAS279 755 A 1695 A 2280 A 3190 A 3720 A CONSOLIDATEDVELA215 CQ-343 1750 A 2480 A 2990 A 3360 A 3790 A DP10-10N 4660 A 5610 A 6130 A 6730 A 7040 A DP10-11 5030 A 6020 A 6620 A 7300 A DP10-3R 330 A 840 A DP10-4R 700 C 980 A 1430 A 1860 A DP10-5R 850 B 1250 A 1590 A 1985 A 2300 A DP10-6 2180 A 2490 A 2875 A 3280 A DP10-7 2510 A 3340 A 3755 A 4250 A 4720 A DP10-8 3120 A 3985 A 4440 A 4880 A 5410 A DP10-9 4090 A 4980 A 5560 A 6180 A 6440 A DP11-10 3850 A 4780 A 5210 A 5860 A 6170 A DP11-11 4035 A 4955 A 5400 A 6030 A 6360 A DP11-7R 1750 C 2530 A 3030 A 3415 A 3740 A DP11-8 3735 A 4640 A 5160 A 5780 A 6100 A DP12-6A 1450 A 1990 A 2390 A 2800 A 3150 A

TWDB Report ##: Structure of the Yegua-Jackson Aquifer of the Texas Gulf Coastal Plain
C-2
Appendix C, continued
Unique Well Identifier Top Jackson Quality
Top Lower
Jackson Quality Top
Yegua Quality Top
Lower Yegua
Quality
Base Yegua-Jackson Aquifer
Quality
DP12-7 2700 A 3295 A 3745 A 4220 A 4390 A DP12-8 4000 A 4620 A 5040 A 5710 A 6030 A DP13-3 DP13-4R 950 A 1330 A DP13-5 610 A 1090 A 1440 A 1845 A 2390 A DP13-6 2260 A 2810 A 3250 A 3730 A 4170 A DP13-7 3440 A 3950 A 4410 A 4890 A 5200 A DP13-8 3710 A 4210 A 4650 A 5180 A 5270 A DP13-9 3660 A 4250 A 4680 A 5270 A 5550 A DP1-4 410 A 700 A DP14-4R 1630 A 2100 A 2390 A 2960 A 3390 A DP14-5R 2330 A 3000 A 3420 A 3850 A 4260 A DP14-6 3460 A 4100 A 4490 A 5010 A 5330 A DP14-7 3440 A 4080 A 4480 A 5000 A 5160 A DP14-8 4030 A 4520 A 5050 A 5570 A 5790 A DP14-9 4280 A 4700 A 5210 A 5745 A 5950 A DP1-4A 447 A 820 A 1270 A DP1-5 398 A 1072 A 1442 A 1840 A 2340 A DP15-10 2940 A 3550 A 4070 A 4525 A 5760 A DP15-11R 3110 A 3720 A 4200 A 4820 A 5140 A DP15-13 5810 A 6490 A 6895 A 7470 A 7660 A DP15-5 670 A DP15-6R 790 A 1140 A 1580 A 2090 A DP15-7 980 A 1500 A 1860 A 2365 A 2830 A DP15-8 2025 A 2380 A 2890 A 3320 A DP15-9 1785 A 2485 A 2910 A 3440 A 3720 A DP1-6 1470 A 2160 A 2580 A 2990 A 3520 A DP16-3 480 A 900 A

TWDB Report ##: Structure of the Yegua-Jackson Aquifer of the Texas Gulf Coastal Plain
C-3
Appendix C, continued
Unique Well Identifier Top Jackson Quality
Top Lower
Jackson Quality Top
Yegua Quality Top
Lower Yegua
Quality
Base Yegua-Jackson Aquifer
Quality
DP16-5A 750 C 1280 A 1710 A 2250 A 2660 A DP16-5R 840 A 1270 A 1600 A 2215 A 2590 A DP16-6 1280 A 2010 A 2490 A 2940 A 3380 A DP16-8 2955 A 3730 A 4135 A 4680 A 5100 A DP1-7 3515 A 4235 A 4520 A 5160 A 5620 A DP17-10 2380 A 3255 A 3890 A 4540 A 4820 A DP17-11 2775 A 3630 A 4180 A 4850 A 5130 A DP17-13 4300 A 5030 A 5380 A 5925 A DP17-3R DP17-4 340 A 775 A DP17-5 625 A 1170 A DP17-6 305 A 1050 A 1500 A DP17-7R 10 C 690 A 1080 A 1810 A 2260 A DP17-8 505 A 1270 A 1760 A 2320 A 2810 A DP17-9 1450 C 2250 A 2690 A 3245 A 3715 A DP18-10 730 A 1470 A 1920 A 2570 A 3160 A DP18-11 2110 A 2920 A 3340 A 3990 A 4510 A DP18-13 2500 A 3370 A 3770 A 4390 A 4920 A DP18-14 4240 A 5080 A 5555 A 6270 A 6530 A DP18-5 DP18-6 200 C 590 A DP18-7R 650 A 1060 A DP18-8 50 C 405 A 1150 A 1630 A DP18-9 210 A 590 A 1305 A 1840 A DP19-10R 450 A 920 A DP19-11 610 A 1280 A 1900 A DP19-12 300 A 1090 A 1420 A 1970 A 2420 A DP19-13 890 A 1680 A 2110 A 2580 A 3030 A

TWDB Report ##: Structure of the Yegua-Jackson Aquifer of the Texas Gulf Coastal Plain
C-4
Appendix C, continued
Unique Well Identifier Top Jackson Quality
Top Lower
Jackson Quality Top
Yegua Quality Top
Lower Yegua
Quality
Base Yegua-Jackson Aquifer
Quality
DP19-14 2600 A 3065 A 3750 A 4320 A DP19-15 3350 A 4210 A 4650 A 5350 A 5730 A DP19-6 DP19-7 190 A DP19-8R 360 A 850 A DP19-9 410 A 880 A DP20-10 150 C 610 A DP20-11 485 A 1160 A DP20-12 235 A 870 A 1470 A DP20-13 570 A 1030 A 1650 A 2350 A DP20-14 1115 A 1915 A 2450 A 3050 A 3710 A DP20-15R 1120 A 1930 A 2440 A 3070 A 3730 A DP20-16 1920 A 2720 A 3210 A 3870 A 4620 A DP20-17 2010 A 2830 A 3330 A 4040 A 4740 A DP20-18 3140 A 3930 A 4415 A 5120 A 5690 A DP20-19 3020 A 3840 A 4300 A 5110 A 5780 A DP20-8 DP20-9 DP2-10 2350 A 3100 A 3440 A 4068 A 4590 A DP2-11 3140 A 3835 A 4210 A 4970 A 5550 A DP21-10 390 A 820 A 1400 A 2030 A DP21-11R 1340 A 1770 A 2390 A 3120 A DP21-12 1355 A 2160 A 2690 A 3480 A 4210 A DP21-13 1520 A 2280 A 2810 A 3530 A 4240 A DP21-14 2005 A 2910 A 3510 A 4415 A 4740 A DP21-15 4105 A 5210 A 5720 A DP21-16 5320 A 6400 A 6865 A 8030 B 8280 D DP2-12 4590 A 5280 A 5615 A 6300 A 6570 A

TWDB Report ##: Structure of the Yegua-Jackson Aquifer of the Texas Gulf Coastal Plain
C-5
Appendix C, continued
Unique Well Identifier Top Jackson Quality
Top Lower
Jackson Quality Top
Yegua Quality Top
Lower Yegua
Quality
Base Yegua-Jackson Aquifer
Quality
DP2-13 5382 A 6090 A 6420 A 7145 A 7740 A DP21-6R DP21-7 DP21-8R 460 C 960 A DP21-9R 190 A 730 A 1300 A DP22-10R 840 A 1400 A DP22-11 1740 A 2375 A DP22-12 1230 A 1800 A 2710 A 3400 A DP22-13 1570 A 2140 A 3000 A 3740 A DP22-14 1540 A 2360 A 2940 A 3820 A 4140 A DP22-15 1900 A 2860 A 3385 A 4185 D 4485 D DP22-16 3810 A 4800 A 5385 A 6285 D 6535 D DP22-17 4395 A 5540 A 6065 A 7015 D DP22-18 5840 A 6960 A 7480 A 8580 D DP22-6 DP22-7R DP22-8 750 A 1170 A DP22-9R 210 A 670 A 1270 A 1850 A DP23-6 1660 A 2570 A 3226 A 4110 A 4680 A DP23-7 4310 A 5400 A 6035 A 7155 A 7980 A DP23-8 DP24-1 4200 A 5290 A 6030 A DP24-2 DP2-5 160 C 520 A DP2-6 350 A 640 A DP2-7R 300 A 695 A 980 A DP2-8R 400 A 690 A 1105 A 1400 A DP2-9 1530 A 2250 A 2630 A 3160 A 3660 A

TWDB Report ##: Structure of the Yegua-Jackson Aquifer of the Texas Gulf Coastal Plain
C-6
Appendix C, continued
Unique Well Identifier Top Jackson Quality
Top Lower
Jackson Quality Top
Yegua Quality Top
Lower Yegua
Quality
Base Yegua-Jackson Aquifer
Quality
DP3-10 3340 A 3950 A 4370 A 5245 A 5710 A DP3-6A 660 A 1060 A 1475 A 1740 A DP3-6R 260 A 660 A DP3-7R 620 A 1320 A 1740 A 2200 A 2440 A DP3-8 1530 A 2250 A 2745 A 3270 A 3790 A DP3-9R 2500 A 3240 A 3650 A 4495 A 4840 A DP4-11 4030 A 4775 A 5140 A 6030 A 6400 A DP4-12 4265 A 5070 A 5425 A 6370 A 6670 A DP4-13 4750 A 5545 A 5960 A 6930 A 7160 A DP4-3 450 A DP4-4 440 A 950 A 1320 A DP4-5 460 A 880 A 1490 A 2010 A DP4-6 310 A 905 A 1360 A 1975 A 2600 A DP4-7 1980 A 2650 A 3100 A 3680 A 4100 A DP4-8 2270 A 2930 A 3350 A 4000 A 4480 A DP4-9 3120 A 3780 A 4210 A 5010 A 5490 A DP5-10R 4230 A 4975 A 5390 A 6145 A 6700 A DP5-11R 4460 A 5240 A 5655 A 6340 A DP5-12 5040 A 5865 A 6280 A 7040 A 7340 A DP5-5R 300 A DP5-6 345 A 825 A 1390 A 1590 A DP5-7R 840 A 1200 A 1755 A 2100 A DP5-8 2200 A 2970 A 3500 A 4025 A 4250 A DP5-9 3070 A 3805 A 4300 A 4890 A 5460 A DP6-10 5140 A 5870 A 6380 A 7210 A 7440 A DP6-11 5300 A 6100 A 6600 A 7480 A 7590 A DP6-12 5630 A 6430 A 6900 A 8000 A 8055 A DP6-3 710 A 930 A
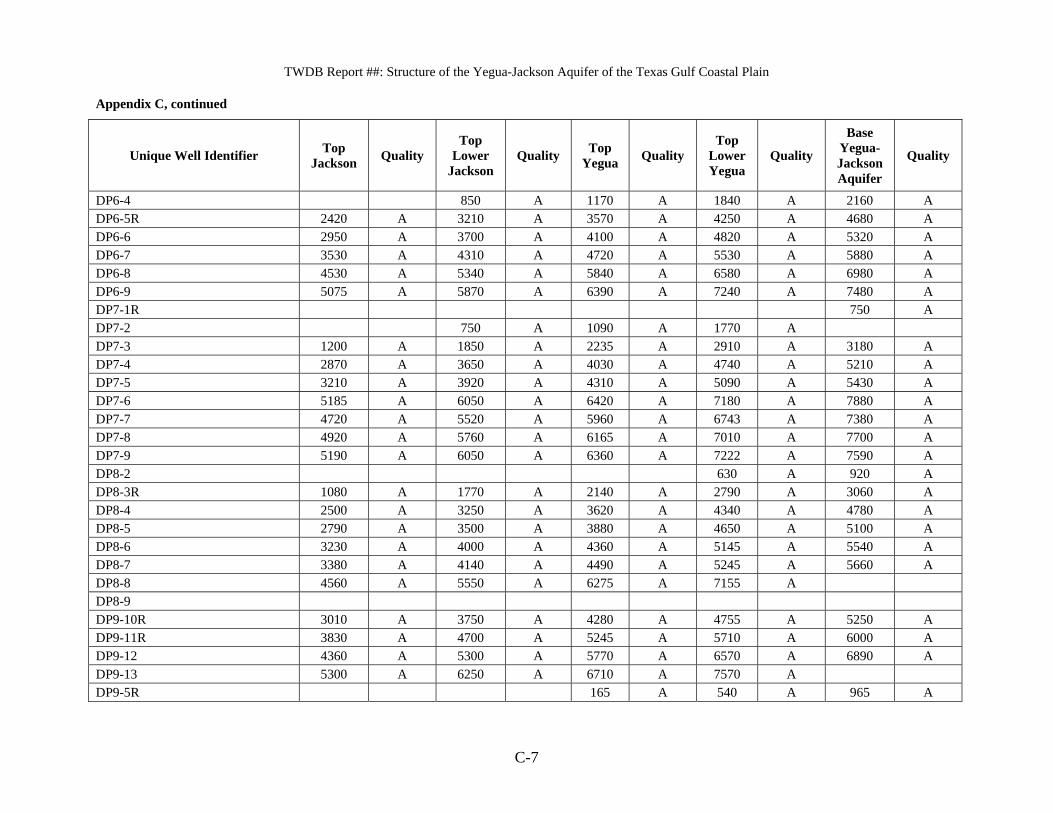
TWDB Report ##: Structure of the Yegua-Jackson Aquifer of the Texas Gulf Coastal Plain
C-7
Appendix C, continued
Unique Well Identifier Top Jackson Quality
Top Lower
Jackson Quality Top
Yegua Quality Top
Lower Yegua
Quality
Base Yegua-Jackson Aquifer
Quality
DP6-4 850 A 1170 A 1840 A 2160 A DP6-5R 2420 A 3210 A 3570 A 4250 A 4680 A DP6-6 2950 A 3700 A 4100 A 4820 A 5320 A DP6-7 3530 A 4310 A 4720 A 5530 A 5880 A DP6-8 4530 A 5340 A 5840 A 6580 A 6980 A DP6-9 5075 A 5870 A 6390 A 7240 A 7480 A DP7-1R 750 A DP7-2 750 A 1090 A 1770 A DP7-3 1200 A 1850 A 2235 A 2910 A 3180 A DP7-4 2870 A 3650 A 4030 A 4740 A 5210 A DP7-5 3210 A 3920 A 4310 A 5090 A 5430 A DP7-6 5185 A 6050 A 6420 A 7180 A 7880 A DP7-7 4720 A 5520 A 5960 A 6743 A 7380 A DP7-8 4920 A 5760 A 6165 A 7010 A 7700 A DP7-9 5190 A 6050 A 6360 A 7222 A 7590 A DP8-2 630 A 920 A DP8-3R 1080 A 1770 A 2140 A 2790 A 3060 A DP8-4 2500 A 3250 A 3620 A 4340 A 4780 A DP8-5 2790 A 3500 A 3880 A 4650 A 5100 A DP8-6 3230 A 4000 A 4360 A 5145 A 5540 A DP8-7 3380 A 4140 A 4490 A 5245 A 5660 A DP8-8 4560 A 5550 A 6275 A 7155 A DP8-9 DP9-10R 3010 A 3750 A 4280 A 4755 A 5250 A DP9-11R 3830 A 4700 A 5245 A 5710 A 6000 A DP9-12 4360 A 5300 A 5770 A 6570 A 6890 A DP9-13 5300 A 6250 A 6710 A 7570 A DP9-5R 165 A 540 A 965 A

TWDB Report ##: Structure of the Yegua-Jackson Aquifer of the Texas Gulf Coastal Plain
C-8
Appendix C, continued
Unique Well Identifier Top Jackson Quality
Top Lower
Jackson Quality Top
Yegua Quality Top
Lower Yegua
Quality
Base Yegua-Jackson Aquifer
Quality
DP9-6 620 C 1050 A 1470 A DP9-7 1200 A 1750 A 2150 A 2630 A 2970 A DP9-8R 2050 A 2750 A 3250 A 3890 A 4490 A DP9-9 2740 A 3470 A 3950 A 4410 A 4690 A DPA-22 2150 A 2830 A 3210 A 3754 A 4340 A DPB-12 3720 A 4515 A 5100 A 5740 A 6020 A DPB-13R 2990 A 3745 A 4200 A 4775 A 5170 A DPB-15A 3540 A 4025 A 4495 A 5020 A DPB-15R 3650 A 4135 A 4655 A 5110 A DPB-17 3980 A 4680 A 5160 A 5740 A 5980 A DPB-2 1820 A 2780 A 3385 A 4285 A 4630 A DPB-20 3990 A 4850 A 5275 A 5910 A DPB-5 3285 A 3970 A 4475 A 5310 A 5920 A DPB-9R 3430 A 4200 A 4590 A 5210 A 5810 A DPC-2 5000 A 6000 A 6760 A 8065 A 8440 A FQ-103 280 A FRAZIERCOCHRAN719 130 A 535 A 900 A GINTHERKILLAM206 200 C 775 A 1190 A GQ-90 350 C 780 A 1160 A 1500 A 1840 A GRQ-29 1640 A 2425 A 2920 C GULFSNB258 810 A 1350 A 2130 A 2790 A GULFURIBE246 260 A HEWITTMANFORD718 HOWETHRAMIREZ288 1200 A HQ-31 120 A 350 A HQ-327 230 A HUMBLEGARCIA269 A 1490 A 2160 A 3140 A 3920 A JONNELLLOPEZ278 170 A
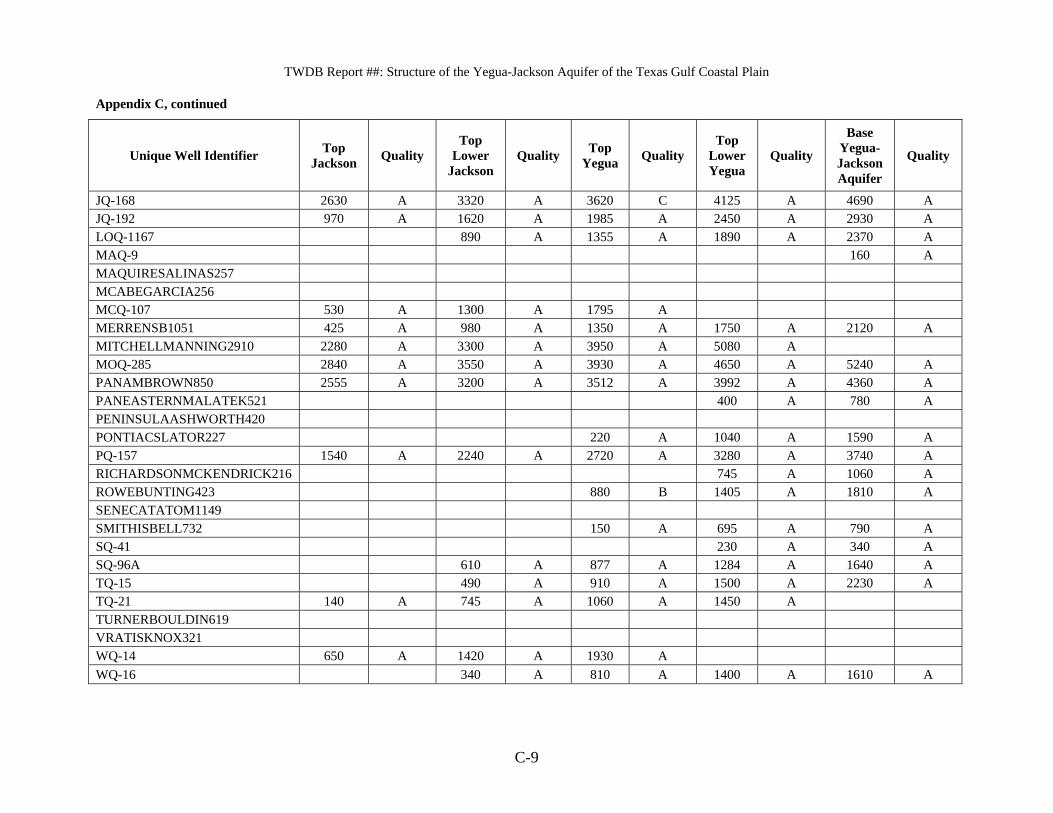
TWDB Report ##: Structure of the Yegua-Jackson Aquifer of the Texas Gulf Coastal Plain
C-9
Appendix C, continued
Unique Well Identifier Top Jackson Quality
Top Lower
Jackson Quality Top
Yegua Quality Top
Lower Yegua
Quality
Base Yegua-Jackson Aquifer
Quality
JQ-168 2630 A 3320 A 3620 C 4125 A 4690 A JQ-192 970 A 1620 A 1985 A 2450 A 2930 A LOQ-1167 890 A 1355 A 1890 A 2370 A MAQ-9 160 A MAQUIRESALINAS257 MCABEGARCIA256 MCQ-107 530 A 1300 A 1795 A MERRENSB1051 425 A 980 A 1350 A 1750 A 2120 A MITCHELLMANNING2910 2280 A 3300 A 3950 A 5080 A MOQ-285 2840 A 3550 A 3930 A 4650 A 5240 A PANAMBROWN850 2555 A 3200 A 3512 A 3992 A 4360 A PANEASTERNMALATEK521 400 A 780 A PENINSULAASHWORTH420 PONTIACSLATOR227 220 A 1040 A 1590 A PQ-157 1540 A 2240 A 2720 A 3280 A 3740 A RICHARDSONMCKENDRICK216 745 A 1060 A ROWEBUNTING423 880 B 1405 A 1810 A SENECATATOM1149 SMITHISBELL732 150 A 695 A 790 A SQ-41 230 A 340 A SQ-96A 610 A 877 A 1284 A 1640 A TQ-15 490 A 910 A 1500 A 2230 A TQ-21 140 A 745 A 1060 A 1450 A TURNERBOULDIN619 VRATISKNOX321 WQ-14 650 A 1420 A 1930 A WQ-16 340 A 810 A 1400 A 1610 A

TWDB Report ##: Structure of the Yegua-Jackson Aquifer of the Texas Gulf Coastal Plain
C-10
This page is intentionally blank.
Appendix D
Net Sand Values by Well and by Layer

This page is intentionally blank.

TWDB Report ##: Structure of the Yegua-Jackson Aquifer of the Texas Gulf Coastal Plain
D-1
Appendix D Net Sand Values by Well and by Layer. NL – interval not logged NDE – well not deep enough
Unique Well Identifier Upper Jackson Layer
Lower Jackson Layer
Upper Yegua Layer
Lower Yegua Layer
5944109 NL NL NL NDE 6617614 >20 NDE NDE NDE AQ-39 NL NL 181.5 189 AQ-52 NL NL NL 140 ARCOSAENZ299 NL >150 324.5 258 ARCOTEMPLE948 0 22.5 80 305.5 ATQ-228 NL NL >40 130 BENTSENVIDAURRI235 NL NL NL NL BLANCOJENNINGS247 NL NL >20 120 CLARKSALINAS279 58 81.5 319.5 208 DP10-11 10 0 55 0 DP10-3R NL NL >90 110 DP10-4R NL >0 177.5 70 DP10-5R >110 120 150 120 DP10-6 NL 0 0 37 DP10-7 110 0 100 330 DP10-8 10 0 120 170 DP10-9 90 0 40 25 DP11-11 60 0 40 40 DP11-7R >20 0 164.5 190 DP11-8 123 0 50 40 DP12-6A 30 13.5 151 165.5 DP12-7 0 0 89.5 8.5 DP12-8 70 0 0 0 DP13-4R NL NL >90 205 DP13-5 169 74 177 266 DP13-6 5 20 107 134 DP13-7 0 0 10 0 DP13-9 133 0 0 0 DP1-4 NL NL >30 208 DP14-4R 189.5 111 177 268 DP14-6 19 5.5 112 72 DP14-8 0 0 5 10 DP14-9 0 0 0 0 DP1-4A NL NL 50 90 DP1-5 20 47.5 94.5 124 DP15-10 0 0 0 0 DP15-11R 1 0 132 15 DP15-13 0 0 0 0 DP15-5 NL NL NL >110 DP15-6R >3 108 149.5 260 DP15-7 127.5 140 140 150 DP15-9 95.5 89.5 251.5 160.5 DP1-6 20 67 97 256.5

TWDB Report ##: Structure of the Yegua-Jackson Aquifer of the Texas Gulf Coastal Plain
D-2
Appendix D, continued
Unique Well Identifier Upper Jackson Layer
Lower Jackson Layer
Upper Yegua Layer
Lower Yegua Layer
DP16-3 NL NL NL 200 DP16-5A 120.5 26.5 120 241.5 DP16-5R 60.5 54.5 270 204 DP16-6 99 169 139 193 DP16-8 0 0 130 80 DP1-7 0 34 189 200.5 DP17-10 40 116.5 137 147 DP17-4 NL NL >30 102.5 DP17-5 NL NL >50 110 DP17-8 180.5 155 200.5 294 DP17-9 >240 200 290 180 DP18-10 130 79 333.5 107.5 DP18-11 170 130 310 260 DP18-14 50 0 80 >25 DP18-6 NL NL NL >100 DP18-7R NL NL >30 100 DP18-9 >20 0 319.5 130 DP19-10R NL NL >15 130 DP19-11 NL >0 102.5 250 DP19-12 70 65 150 180 DP19-13 164.5 96 231 345.5 DP19-14 >140 270 331 326 DP19-15 124 49 132 >70 DP19-7 NL NL NL >30 DP19-8R NL NL >5 147 DP19-9 NL NL >10 78 DP20-10 NL NL NL 143 DP20-11 NL NL NL 360 DP20-12 NL >0 35 266.5 DP20-13 >10 9.5 27 368.5 DP20-14 20.5 83 232 283 DP20-15R 21.5 16 154.5 210 DP20-17 210 110 290 480 DP20-18 2.5 40 89 163 DP2-10 50 60 75 100 DP2-11 0 10 313.5 357 DP21-10 >80 35.5 0 314 DP21-11R >10 10 50 275 DP21-12 0 79 238.5 286.5 DP21-13 0 128 229.5 310 DP21-14 60 153 464.5 141.5 DP21-15 30 60 >60 NDE DP21-16 40 3 0 NDE DP2-13 0 24 289.5 260 DP21-8R NL NL NL 80

TWDB Report ##: Structure of the Yegua-Jackson Aquifer of the Texas Gulf Coastal Plain
D-3
Appendix D, continued
Unique Well Identifier Upper Jackson Layer
Lower Jackson Layer
Upper Yegua Layer
Lower Yegua Layer
DP21-9R NL >10 0 80 DP22-10R NL NL >0 387 DP22-11 NL NL >0 261.5 DP22-12 >0 0 129.5 424 DP22-13 >10 63.5 314 190.5 DP22-14 0 144.5 333 185 DP22-15 152.5 71.5 >150 NDE DP22-16 40 40 >30 NDE DP22-17 50 50 >30 NDE DP22-18 160 50 >120 NDE DP22-8 NL NL >140 293 DP22-9R NL 12.5 22 338.5 DP23-6 110 100 90 30 DP23-7 393 220 575 527.5 DP24-1 226.5 100 >50 NDE DP2-5 NL NL NL >170 DP2-7R NL >0 163.5 152.5 DP2-8R NL 50 80 80 DP2-9 65 77 143.5 236 DP3-10 0 30 314 173.5 DP3-6A >90 93 91 206.5 DP3-6R NL NL >15 140 DP3-7R 39 20 70 70 DP3-8 40 40 104.5 373 DP3-9R 50 15 180 180 DP4-11 0 0 230 180 DP4-12 0 0 475.5 185 DP4-3 NL NL NL >140 DP4-4 NL >70 218.5 235.5 DP4-5 >100 50 60 140 DP4-6 70 24 122 140 DP4-7 84.5 37 131.5 101.5 DP4-9 30 83 273.5 180 DP5-10R 94.5 42.5 319.5 376.5 DP5-12 0 0 140 120 DP5-5R NL NL NL 180 DP5-6 >80 50 120 70 DP5-7R >320 140 170 125 DP5-8 119 80.5 81 168.5 DP6-10 0 0 210 80 DP6-11 0 20 210 70 DP6-12 0 0 100 10 DP6-3 NL NL >70 145 DP6-4 >330 13.5 40 70.5 DP6-5R 123 35 147.5 128.5

TWDB Report ##: Structure of the Yegua-Jackson Aquifer of the Texas Gulf Coastal Plain
D-4
Appendix D, continued
Unique Well Identifier Upper Jackson Layer
Lower Jackson Layer
Upper Yegua Layer
Lower Yegua Layer
DP6-6 35 50 300 115 DP6-7 60 20 322.5 235 DP6-8 0 15 219.5 190 DP6-9 0 0 200 120 DP7-1R NL NL >60 100 DP7-3 85 70 226 159.5 DP7-4 170 30 160 280 DP7-6 20 0 260 320 DP7-8 70 0 180 210 DP7-9 150 0 70 80 DP8-2 NL NL NL 35 DP8-3R 220 171 267.5 147.5 DP8-4 180 20 167.5 274 DP8-5 60 50 260 204.5 DP8-7 30 0 297 252 DP8-8 60 6.5 163.5 >210 DP9-10R 40 30 170 160 DP9-11R 0 0 66 123 DP9-13 35 0 60 10 DP9-5R NL NL 120 95 DP9-6 NL NL >40 71.5 DP9-7 60 100 100 100 DP9-8R 58 50.5 242 323 DP9-9 30 40 250 170 DPA-22 0 54 163.5 351 DPB-12 0 0 70 20 DPB-13R 0 0 134.5 98 DPB-2 70 120 330 140 DPB-5 60 30 321.5 260.5 DPB-9R 10 0 46.5 30 DPC-2 414.5 187 359 150 FRAZIERCOCHRAN719 NL NL 110 186.5 GINTHERKILLAM206 NL NL >40 200 GQ-90 >180 139.5 313.5 142.5 GRQ-29 176 72 NDE NDE GULFSNB258 >0 80 497.5 258 GULFURIBE246 NL NL NL >30 HQ-31 NL NL >10 130 HOWETHRAMIREZ288 NL NL NL >630.5 HUMBLEGARCIA269 63 100 349 150 JONNELLLOPEZ278 NL NL NL >20 JQ-168 0 >20 >80 100 JQ-192 0 36 140.5 306 LOQ-1167 >90 133.5 249 300 MAQ-9 NL NL NL >70

TWDB Report ##: Structure of the Yegua-Jackson Aquifer of the Texas Gulf Coastal Plain
D-5
Appendix D, continued
Unique Well Identifier Upper Jackson Layer
Lower Jackson Layer
Upper Yegua Layer
Lower Yegua Layer
MCQ-107 40 3 >80 NDE MERRENSB1051 0 40 25 140 MITCHELLMANNING2910 192 40 60 NDE MOQ-285 50 25 153 251 PANAMBROWN850 10 91 80 135 PANEASTERNMALATEK521 NL NL >60 305 PONTIACSLATOR227 NL >10 10 127 RICHARDSONMCKENDRICK216 NL NL >0 71.5 ROWEBUNTING423 NL NL 290 250 SMITHISBELL732 NL NL 110 86.5 SQ-41 NL NL NL 90 SQ-96A >10 43 141 130 WQ-14 279 118.5 NDE NDE WQ-16 >30 50 100 80

TWDB Report ##: Structure of the Yegua-Jackson Aquifer of the Texas Gulf Coastal Plain
D-6
This page is intentionally blank.

Appendix E
Structure Draft Final Report Technical / Administrative Comments

This page is intentionally blank.

TWDB Report ##: Structure of the Yegua-Jackson Aquifer of the Texas Gulf Coastal Plain
E-1
Structure of the Yegua-Jackson Aquifer of the Texas Gulf Coastal Plain
(TWDB Contract #0604830617) By Paul R. Knox, Van A. Kelley, Astrid Vreugdenhil, Neil Deeds, and Steven Seni Review of Draft Report by TWDB Staff General comments
1. We expected that subsurface layer boundaries would tie to outcrop contacts. Please revisit and re-submit all cross-sections, isopach maps, net sand thickness maps, and structure maps as it appears the cross-sections were not tied to the geologic outcrop points. Wells that plot to the north and west of the outcrop should be discarded in the evaluation, as these locations should represent wells completed in the Cook Mountain or Sparta formations. Also Section 5 of the report should be reviewed for relevant edits to reflect the adjusted analysis of the structure. In addition, all related data in the geodatabase should be adjusted and resubmitted. If during this project research indicates that the Geologic Atlas Sheets are incorrect, sufficient documentation and proof should be provided to substantiate this claim.
In response to the TWDB comments, we reviewed the chronostratigraphic units to understand, and potentially reconcile differences between the base of the Lower Yegua Unit (time chronostratigraphic) and the outcrop base of the Yegua and also between the top of the Upper Jackson Unit (chronostratigraphic) and the outcrop top of the Jackson in areas north and east of the Brazos River. Below we will discuss how we addressed this comment. The report has been revised per TWDB comments and the associated geodatabase has been updated. Outcrop descriptions of geologic units are inherently different from subsurface descriptions. Weathering of geologic units at outcrop creates differential erosion, leaving sands and more cemented lithologies standing in relief as low hills above the more easily eroded clays that commonly form lowlands and river valleys. This concept is especially applicable in areas of low rainfall, but can be negated in wetter areas such as East Texas, where sands and muds are equally eroded and dissected (Jackson and Garner, 1982). Weathering also oxidizes the sediments, creating distinctive colors, textures, and features. Conversely, subsurface observation is limited to well borings, lithologic logs, and geophysical logs of resistivity and natural gamma-ray values. This information may be less indicative of trace mineralogic content but is more sensitive to slight changes in lithology that reflect changes in depositional setting and are laterally correlative. These changes are indicative of regional or subregional time-stratigraphic, or chronostratigraphic, relationships. Subsurface data may more accurately relate sediments deposited during a certain time interval, regardless of their gross lithology. In

TWDB Report ##: Structure of the Yegua-Jackson Aquifer of the Texas Gulf Coastal Plain
E-2
this way, sands that are hydrologically linked can be grouped together to constitute a ‘flow layer’ within the aquifer. The general chronsotratigraphic correlation approach used in this study is based upon the correlation of maximum flooding surfaces within fine-grained highstand deposits as defined in geophysical well logs arranged in dip-oriented cross sections, connecting low-resistivity markers in downdip shale sections with shales or abrupt-based sands in updip sandy and silty intervals. Utilizing this technique, four major chronostratigraphic units (third-order genetic units) were defined for the Yegua-Jackson Aquifer. These include, from the bottom upward, the Lower Yegua, Upper Yegua, Lower Jackson, and Upper Jackson Units, which each span one to two million years of deposition (third-order genetic units) and are of appropriate scale for regional groundwater availability modeling (generally 400 to 800 feet thick, thickening in the downdip direction). The four chronostratigraphic units were used a the basis for defining four operational aquifer layers within the Yegua-Jackson Aquifer; the Lower Yegua Layer, the Upper Yegua Layer, the Lower Jackson Layer and the Upper Jackson Layer. Of these four aquifer layers, only the Lower Yegua Layer differs from it’s chronostratigraphic unit equivalent. This is because the chronostratigraphic Base Yegua Unit occurs at or below the lithostratigraphic Base Yegua-Jackson Aquifer, and thus commonly outcrops farther inland (north and west) than the base of the Yegua Formation as mapped in outcrop. The chronostratigraphic surface represents a maximum flooding surface between the Sparta and Yegua depositional cycles and commonly occurs within the shale of the Cook Mountain Formation. To address this issue, the base of the Lower Yegua Aquifer Layer, which comprises the base of the Yegua-Jackson Aquifer, was defined to occur at the first significant sand above the Cook Mountain shales and was tied to the base Yegua outcrop boundary. In South Texas the interval between the Base Lower Yegua Unit (chronostratigraphic) and the Base Yegua Layer (base Yegua-Jackson Aquifer) contains significant sands that are potentially water-bearing. These sands were excluded from this study and thus lie between the Sparta and Yegua-Jackson Aquifers. Future reconsideration of existing formal aquifer boundaries might place these sands in the Yegua-Jackson Aquifer because they are probably most closely linked, hydrologically, with this aquifer. This study provides significant evidence that the Vicksburg Formation was mapped by Barnes (1968a, 1968b, 1974a, 1974b, 1974c, 1975, 1976a, 1976b, 1976c, 1992) as part of the Jackson Group from approximately the Brazos River eastward and mapped as part of the Catahoula Formation and lateral equivalents from the Brazos River southward. This conclusion is substantiated by this work and the work of others. This conflict between interpretations from this study and those of Barnes (1968a, 1968b, 1974a, 1974b, 1974c, 1975, 1976a, 1976b, 1976c, 1992) are important, unexpected, and not resolvable within the scope of this study. Before this structural framework of the Yegua-Jackson aquifer is incorporated into a numerical model, it is suggested that sufficient investigation resolves stratigraphic inconsistencies and logically places the ‘region in conflict’ within either the Yegua-Jackson Aquifer or the overlying Gulf Coast Aquifer.

TWDB Report ##: Structure of the Yegua-Jackson Aquifer of the Texas Gulf Coastal Plain
E-3
2. Please update the descriptive sections of the report to provide a greater focus on the updip, near-outcrop parts of the Yegua-Jackson aquifer. For example, vertical bedding styles as described on page 5-10 paragraph 4 refer to wells that are below the base of fresh water. Also on page 5-13 paragraph 2, good detail of description but all way below the zone of interest.
Sections 2.2.1, 5.3.1.1, 5.3.2.1, 5.3.3.1, and 5.3.4.1 have been added to provide more information relative to the shallow sections of the aquifer.
3. Please add descriptions from previous studies of Yegua-Jackson outcrops to Section 2.
Please use county groundwater reports, Eargle (1972), and formation descriptions included with the GAT sheets to provide information about outcrop lithologies in Section 2. Section 2.2.1and many sections in Section 5 have been greatly expanded to provide more information relative to the shallow sections of the aquifer with emphasis on previous outcrop studies.
4. Please expand the Executive Summary to capture all important points and findings. This may be the only section that some people read. The Executive Summary has been re-written and expanded from the draft report.
5. Please seal the appropriate figures/plates and follow the protocol for geoscience related
work in Texas to comply with the Texas Board of Professional Geoscientists rules and regulations per http://www.tbpg.state.tx.us/chapter-851c.html#6 §851.156. Geoscientist’s Seals, subsection (i) and (j).
Upon review and consent of the TWDB, we will seal the cover which is considered adequate by the Texas Board of Professional Geoscientists.
6. Please spell out all abbreviated phrases or symbols throughout the report and figures, such as: AFY, SP, m.y., yrs, Ky, MFS, ft, mi, ft/mi, 3D, TDS, dpi, GIS, %, QFL, GAMs, TCEQ, CAD, UWI, API, KB, and et al.
Completed.
7. Digitized well logs are not included in the source data. Please provide us with the LAS
files for all digitized logs.
Completed.
8. All CAD files included in the electronic data will not open with Adobe Illustrator or ArcGIS. Please check these files and resubmit.

TWDB Report ##: Structure of the Yegua-Jackson Aquifer of the Texas Gulf Coastal Plain
E-4
Completed. We have saved the CAD files to an older version. 9. Please recreate selected cross sections using digitized log curves. Cross sections on the
Plates using scanned logs are difficult to use owing to their size. It is also difficult to see the log curves on some of the scans. On digitized sections wells could be placed closer together, and log curve scales could be standardized.
We are in agreement that developing cross-sections with digitized logs would be of value. However, the production of this specific type of section with digitized logs are outside of the scope and would be extremely time consuming given our software. The current sections with the scanned logs are legible, representative, and consistent.
10. Sections 4.4.1.2 and 4.4.1.3 describe a Perl program for measuring net sandstone. Please
provide a copy of the Perl code.
Completed 11. Please describe in the report the contouring software and interpolation method(s) that
were used to create contours of structure, net sand, and sand percent.
A description of the contouring algorithm used has been included in Sections 4.3 and 4.4 for the structure and sand thickness mapping.
12. Please add county names to all plates, both maps and cross sections.
Completed 13. Please consider adding a figure showing major structural elements of the Texas Gulf
Coast, including Rio Grande Embayment, San Marcos Arch, and Houston Embayment. Or maybe add to existing figure(s).
Figure 2.1 has been modified to include the major structural elements in the study area.
Technical comments
1. 2.1 Description of the Study Area, page 2-1, 2nd paragraph, 1st sentence: Please provide a reference for rainfall estimates and update Section 8. References, as needed. Completed – the reference is Larkin and Bomar (1983).
2. Page 2-2, 3rd paragraph, line 2: Reference to Barnes 1992. Please expand the citation to include the rest of the relevant GAT sheets. Completed, Full references are provided.
3. Plate 1 (and Figure 2-2): Please review, clarify, and adjust where Strike C-C’ begins and ends. The legend in Plate 1 indicates Strike C-C’ is denoted by a red dashed line; however, a blue dashed line extends from well DPC-2 to the C label in Hidalgo County and a blue-dashed line extends from well SQ-41 in Sabine County to the C’ label. Completed

TWDB Report ##: Structure of the Yegua-Jackson Aquifer of the Texas Gulf Coastal Plain
E-5
4. Table 4-1, page 4-2: Please update contact information from McMullen Groundwater Conservation District from Lonnie to Lonnie Stewart. Completed
5. 4.1.2 Geophysical Log Sources, page 4-3, 2nd paragraph: Please provide a brief explanation of the significance of using Tobin basemaps and what a Tobin basemap represents. In addition, please provide a brief explanation of what a Kelly Bushing datum represents. It is unlikely that the casual reader will understand what these terms signify. Completed.
6. 4.2.1 Incorporation of Existing Data and Knowledge, page 4-5, 3rd paragraph, 1st sentence: Please update the References section with the Texas Natural Resource Information System (2006) reference. Completed.
7. Page 4-7, 3rd paragraph, line 5: “future aquifer (MFSs)” suggests that “aquifer” equals “MFSs”. Please update if necessary for correct meaning. Accepted and the sentence has been re-written to avoid confusion.
8. 4.3 Structure Mapping Approach, page 4-9, 1st paragraph, last sentence: Sentence states that issues with negative thicknesses were resolved by adding estimated depths for a surface to increase control for the contouring algorithm. Please clarify if virtual wells were used and included (and identified as such) in the accompanying geodatabase. Complete.
9. 4.4.1.3 The Algorithm, page 4-12, 2nd paragraph, last sentence: Sentence states values shown in Figure 4-10 were the final values used; however, Figure 4-10 shows the genealogical correlation work flow and does not list any values. Please adjust text to direct reader to the correct figure. The reference was corrected to point to Figure 4-11.
10. 4.4.2 Sand Thickness Mapping, page 4-14, 1st paragraph: Section states sand thickness values were gridded and contoured without directional bias. Please expand to include information on the process and software used to contour and more information on gridding, such as grid size and orientation. Completed.
11. Figures 4-1 to 4-6: Please provide a better explanation of map symbology in the Legends, including letters (“J” and “Y”), numbers without letters, orange numbers, etc. Complete.
12. Figures 4-7 and 4-8: Please consider also including the chart of Gulf Coast chronostratigraphic cycles (Galloway) with Yegua-Jackson cycles highlighted. Figure 2-4 has been added as suggested.
13. Figure 4-7: Caption cites Galloway (1989). Please update References section with this citation or possibly adjust the text, if appropriate, to agree with the citation listed in the References section of the report. Completed.
14. Figure 4-8: Caption cites Hays (1976) and Meckal and Galloway (1990). Please update References section with these citations or possibly adjust the text, if appropriate, to agree with the citations listed in the References section of the report. Please note the References section does list Hays and others (1976) and Meckel and Galloway (1996). Also please correct spelling of nomenclature in the header and include a footnote explanation for the Ky abbreviation shown in figure. The references were incorrectly cited and have been corrected.
15. Figure 4-9: Please expand caption to also include definitions for CR, CC, SBR, and BR shown in the figure or remove these abbreviations from figure, if not needed. Complete.
16. Figure 4-11: The text in the final decision diamond is truncated. Please resubmit with text visible. Complete.

TWDB Report ##: Structure of the Yegua-Jackson Aquifer of the Texas Gulf Coastal Plain
E-6
17. Page 5-1, 2nd paragraph, general: “micropaleontologic information” is stated here but not described or referred to again. Please provide more details, even if it is just to state that paleo was not a significant source of data for this study. A complete discussion of the relevant paleo and its significance to the study is provided in Section 2.2 as well as a new Figure 2-4. Only one well on the cross-section plates had paleo information. That plate (Plate 3), has been updated.
18. Page 5-1, 2nd paragraph, general: “Comparisons with previous works” is stated here but not elaborated further. Please provide more information of the results of this comparison. A chart showing the comparison would be nice. Previous works have been cited and comparisons to the critical Coleman (1990) study have been added to the cross-sections.
19. Page 5-2, paragraph 2, lines 9 and 10: Description of vertical trends (fining vs coarsening) may be reversed. Please adjust if necessary. Corrected, well citation has been corrected from DP2-12 to -2-10.
20. Page 5-4, 1st paragraph, last sentence: Please consider referring to Plate 18 here (Lower Jackson net sand). Complete.
21. Page 5-4, 4th paragraph, general: It would be helpful if you point out in the text the geographic locations of high net sand near outcrop and refer to Plate 17. The discussion of lithology in the outcrop has been greatly expanded in Section 5.3.
22. Page 5-4, last paragraph, general: Please cite previous work (“Previous work suggests…”). References provided.
23. Page 5-5, 2nd paragraph, general: Please consider if some of these higher order cycle boundaries might correlate more closely with outcrop contacts or could be used as layer boundaries locally. This discussion has been added in Section 5.1.2.
24. Page 5-7, 2nd paragraph, general: Please explain the “structural hinge” concept a little more. The Plate 4 example seems pretty extreme for a hinge point. The explanation has been provided in Section 5.2.
25. Page 5-7, 3rd paragraph, 2nd half of paragraph: Strike-slip faulting is very unusual in the Gulf Coast Basin. Please support the statement about strike-slip faulting a little more or consider revising text. A formation having very low dips might display apparently dramatic outcrop convolutions that are attributable to the interaction of gentle folding and topography. Figure 2-1 shows transfer faults offshore that trend across the Yegua-Jackson outcrop. Discussion of the structural setting in Section 2.2 and in 5.2 has been expanded.
26. Page 5-7, last paragraph, last line: Please consider changing “boundaries from Barnes (1992)” to “boundaries from the Geologic Atlas of Texas (cite all relevant GAT sheets)”. Complete
27. Page 5-13, 2nd paragraph, last line: Reference to cross section well in parentheses seems wrong. You may have meant to refer to a different well. Please update if necessary. Well reference has been updated.
28. Page 5-14, 3rd paragraph, line 2: “axis of the study area” is unclear. Please clarify with additional text such as “mid-dip area”. Completed.
29. Page 5-15, 1st paragraph, line 3: Instead of “fluvial deposits” you may have meant “deltaic deposits”. Please update if necessary. This is intentional. This refers to areas in the updip region of deltas that lack abundant sand.
30. Page 5-17, 2nd paragraph, line 1: Instead of “Upper Yegua Layer” you may have meant “Upper Jackson Layer”. Please update if necessary. Complete

TWDB Report ##: Structure of the Yegua-Jackson Aquifer of the Texas Gulf Coastal Plain
E-7
31. Section 5, figures: Please identify black arrows in Legends. Complete. 32. Section 5, figures: Wells on sand percent maps are not the same as wells on net sand
plates. Please adjust as necessary. Complete. 33. Figure 5-5: Please provide more explanation in the text and caption on the purpose of the
QFL diagram as it is unlikely that the casual reader will understand what this diagram represents. A description of the QFL Diagram as well as their use has been added.
34. Page 5-27 and 5-28, Figures 5-10 and 5-11: Light green color for “Shelf” should probably be labeled “Slope”. Please update if necessary. Complete
35. Page 5-29, Figure 5-12: Some facies have a 100-ft cutoff in Legend but text states that cutoff is 50 ft. Please adjust if necessary. Legend on Jackson Plates has been changed to 50 feet.
36. Page 5-30, figure 5-13: Same comment about cutoff values. Also some shelf facies extend onto slope in south. Please adjust if necessary. Completed as in previous comment.
37. Plate 3: Please update Sheet title from “Dip Cross Section” to “Dip Cross Section 3” to agree with text on page 5-2. Complete
38. Plates 6: Please review layer boundary labels and verify that they are consistently labeled correctly for each unit. Complete
39. Plates 12-16, Structure Maps: Some salt dome locations are inaccurate, although this is probably Ewing’s fault. But please take the “salt domes” out of Gillespie and Blanco Counties. Please identify Cretaceous shelf margins in the Legend and color differently from the salt domes. Also suggest citing sources for salt domes and Cretaceous shelf margins on the plates. Complete
40. Appendix A, Appendix B, Appendix C, and Appendix D: Suggest including an introduction or caption that document or explains the headers and data. Complete.
Editorial comments
1. Table of Contents, page vii, Plates: Please label plates 12, 13, and 16. Complete. 2. Section 1. Introduction, page 1-1, 2nd paragraph, 1st sentence: Suggest rewording,
“Because of the Yegua-Jackson has been designated…” to “Because the Yegua-Jackson has been designated…” Complete.
3. Section 2.1 Description of the Study Area, page 2-1, 1st paragraph, 6th sentence: Please adjust capitalization of “counties” to lower case. Complete.
4. Section 2.1 Description of the Study Area, page 2-1, 1st paragraph and 3.2 Hydrogeology, page 3-2, 2nd paragraph, 2nd sentence: Please remove the word “River” when referring to the Rio Grande since when translated “River” is redundant. Complete.
5. Section 3.2 Hydrogeology, page 3-2, 1st paragraph, 1st partial sentence: Suggest rewording, “…evidence of recovering heads during from the 1980s…” to clarify if intending to convey that heads recovered during the 1980s or that heads recovered from sometime in the 1980s to present. Complete.
6. Page 4-2, last paragraph: “Evergreen” and “Fayette County” should probably be “Evergreen GCD” and “Fayette County GCD”. Please adjust. Complete.
7. Page 4-3, 3rd paragraph: Please correct the spelling of “Visualization”. 8. Page 4-4, 1st paragraph, line 7: Suggest that “were” should be “was”. Complete.
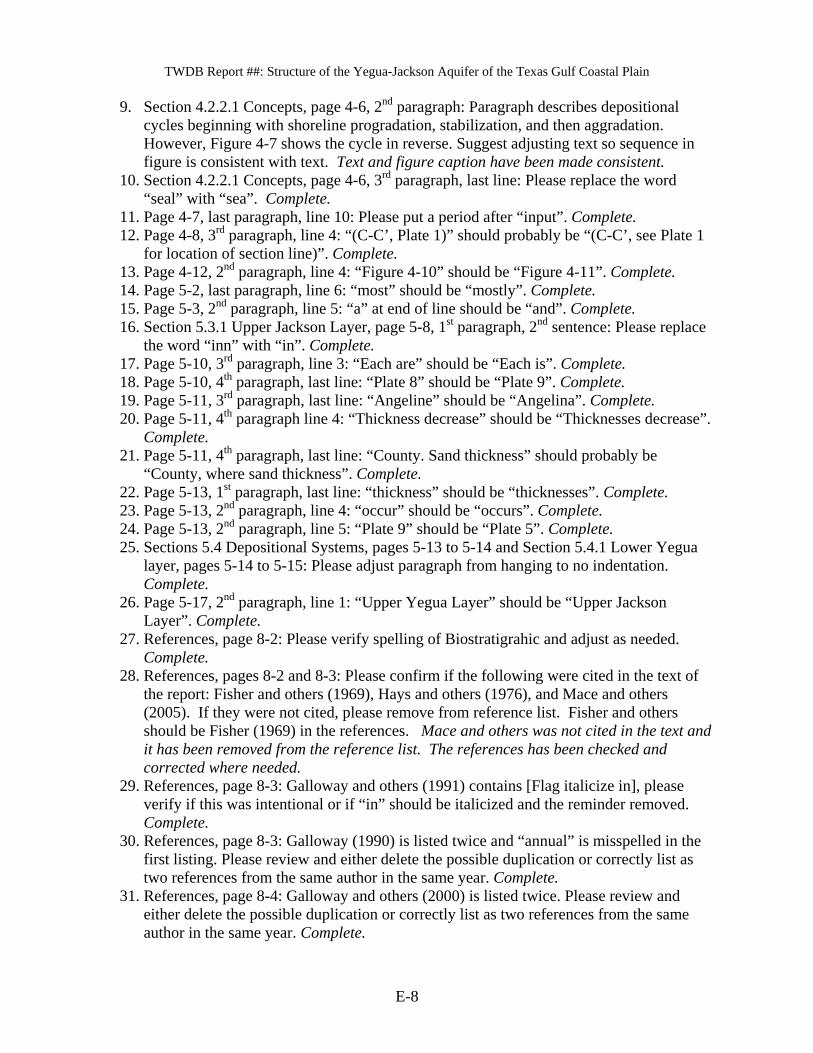
TWDB Report ##: Structure of the Yegua-Jackson Aquifer of the Texas Gulf Coastal Plain
E-8
9. Section 4.2.2.1 Concepts, page 4-6, 2nd paragraph: Paragraph describes depositional cycles beginning with shoreline progradation, stabilization, and then aggradation. However, Figure 4-7 shows the cycle in reverse. Suggest adjusting text so sequence in figure is consistent with text. Text and figure caption have been made consistent.
10. Section 4.2.2.1 Concepts, page 4-6, 3rd paragraph, last line: Please replace the word “seal” with “sea”. Complete.
11. Page 4-7, last paragraph, line 10: Please put a period after “input”. Complete. 12. Page 4-8, 3rd paragraph, line 4: “(C-C’, Plate 1)” should probably be “(C-C’, see Plate 1
for location of section line)”. Complete. 13. Page 4-12, 2nd paragraph, line 4: “Figure 4-10” should be “Figure 4-11”. Complete. 14. Page 5-2, last paragraph, line 6: “most” should be “mostly”. Complete. 15. Page 5-3, 2nd paragraph, line 5: “a” at end of line should be “and”. Complete. 16. Section 5.3.1 Upper Jackson Layer, page 5-8, 1st paragraph, 2nd sentence: Please replace
the word “inn” with “in”. Complete. 17. Page 5-10, 3rd paragraph, line 3: “Each are” should be “Each is”. Complete. 18. Page 5-10, 4th paragraph, last line: “Plate 8” should be “Plate 9”. Complete. 19. Page 5-11, 3rd paragraph, last line: “Angeline” should be “Angelina”. Complete. 20. Page 5-11, 4th paragraph line 4: “Thickness decrease” should be “Thicknesses decrease”.
Complete. 21. Page 5-11, 4th paragraph, last line: “County. Sand thickness” should probably be
“County, where sand thickness”. Complete. 22. Page 5-13, 1st paragraph, last line: “thickness” should be “thicknesses”. Complete. 23. Page 5-13, 2nd paragraph, line 4: “occur” should be “occurs”. Complete. 24. Page 5-13, 2nd paragraph, line 5: “Plate 9” should be “Plate 5”. Complete. 25. Sections 5.4 Depositional Systems, pages 5-13 to 5-14 and Section 5.4.1 Lower Yegua
layer, pages 5-14 to 5-15: Please adjust paragraph from hanging to no indentation. Complete.
26. Page 5-17, 2nd paragraph, line 1: “Upper Yegua Layer” should be “Upper Jackson Layer”. Complete.
27. References, page 8-2: Please verify spelling of Biostratigrahic and adjust as needed. Complete.
28. References, pages 8-2 and 8-3: Please confirm if the following were cited in the text of the report: Fisher and others (1969), Hays and others (1976), and Mace and others (2005). If they were not cited, please remove from reference list. Fisher and others should be Fisher (1969) in the references. Mace and others was not cited in the text and it has been removed from the reference list. The references has been checked and corrected where needed.
29. References, page 8-3: Galloway and others (1991) contains [Flag italicize in], please verify if this was intentional or if “in” should be italicized and the reminder removed. Complete.
30. References, page 8-3: Galloway (1990) is listed twice and “annual” is misspelled in the first listing. Please review and either delete the possible duplication or correctly list as two references from the same author in the same year. Complete.
31. References, page 8-4: Galloway and others (2000) is listed twice. Please review and either delete the possible duplication or correctly list as two references from the same author in the same year. Complete.

TWDB Report ##: Structure of the Yegua-Jackson Aquifer of the Texas Gulf Coastal Plain
E-9
32. References, page 8-5: Preston (2006) contains [Flag: italicize in], please verify if this was intentional or if “in” should be italicized and the reminder removed. Complete.
33. References, page 8-5: Renick (1926) and Renick (1936), please clarify if the same article was reprinted in 1936 or the author gave the same title to two different publications. These references are correct.
34. References, page 8-6: Please redo reference for Texas Water Development Board (2006) as the reference is actually Texas Water Development Board Report 365. See http://www.twdb.state.tx.us/publications/reports/GroundWaterReports/GWReports/R365/AGCindex.htm Complete.

TWDB Report ##: Structure of the Yegua-Jackson Aquifer of the Texas Gulf Coastal Plain
E-10
This page is intentionally blank.