Embed Size (px)
Citation preview

Yimin Math Centre
Year 8 Term 2 Homework
Student Name: Grade:
Date: Score:
Table of contents
3 Year 8 Term 2 Week 3 Homework 1
3.1 Reading Tables . . . . . . . . . . . . . . . . . . . . . . . . . . . . . . . . . . . . . . . 1
3.2 Organising Data . . . . . . . . . . . . . . . . . . . . . . . . . . . . . . . . . . . . . . . 2
3.2.1 The frequency distribution table . . . . . . . . . . . . . . . . . . . . . . . . . . 2
3.2.2 The frequency histogram . . . . . . . . . . . . . . . . . . . . . . . . . . . . . . 3
3.2.3 The frequency polygon . . . . . . . . . . . . . . . . . . . . . . . . . . . . . . . 3
3.2.4 The dot plot . . . . . . . . . . . . . . . . . . . . . . . . . . . . . . . . . . . . . 5
3.2.5 Stem-and-leaf Plots . . . . . . . . . . . . . . . . . . . . . . . . . . . . . . . . . 6
3.3 Miscellaneous Exercises . . . . . . . . . . . . . . . . . . . . . . . . . . . . . . . . . . 8
This edition was printed on March 23, 2018 with worked solutions.Camera ready copy was prepared with the LATEX2e typesetting system.Copyright © 2000 - 2018 Yimin Math Centre
Year 8 Homework

Year 8 Term 2 Week 3 Homework Page 1 of 13
3 Year 8 Term 2 Week 3 Homework3.1 Reading TablesExercise 3.1.1 The advanced and Intermediate Maths students in Year 8 were given a commontest to assess their numeracy skills. Their results are shown in the table below:
Mark range (%) 1 – 20 21 – 40 41 – 60 61 – 80 81 – 100
Advanced 1 4 8 13 7
Intermediate 4 12 22 9 3
1. Show this data in the form of a side-by-side column graph with the Intermediate students in the
left-hand column.
2. Show the data in the form of a stacked column graph with the Intermediate students in the bottom
section of each column.
Copyright © 2000 – 2018 Yimin Math Centre (www.yiminmathcentre.com)
Year 8 Term 2 Week 3 Homework Page 2 of 13
3.2 Organising Data
It is difficult to make sense of a large amount of data that has been collected. In order to make judgementsabout the data it must first be organised in some meaningful way. By arranging the data into a graphor table, we can instantly make out detail such as the highest and the lowest scores and the score thatoccurs the most.
3.2.1 The frequency distribution table
The frequency distribution table is often the first step in organising a set of data. In a frequency distri-bution table:
• The score column shows the possible scores.
• The tally column is used to enter the scores into the table one at a time.
• The frequency indicates the number of times each score occurs.
• The total of the frequencies is sometimes written at the base of the frequency column.
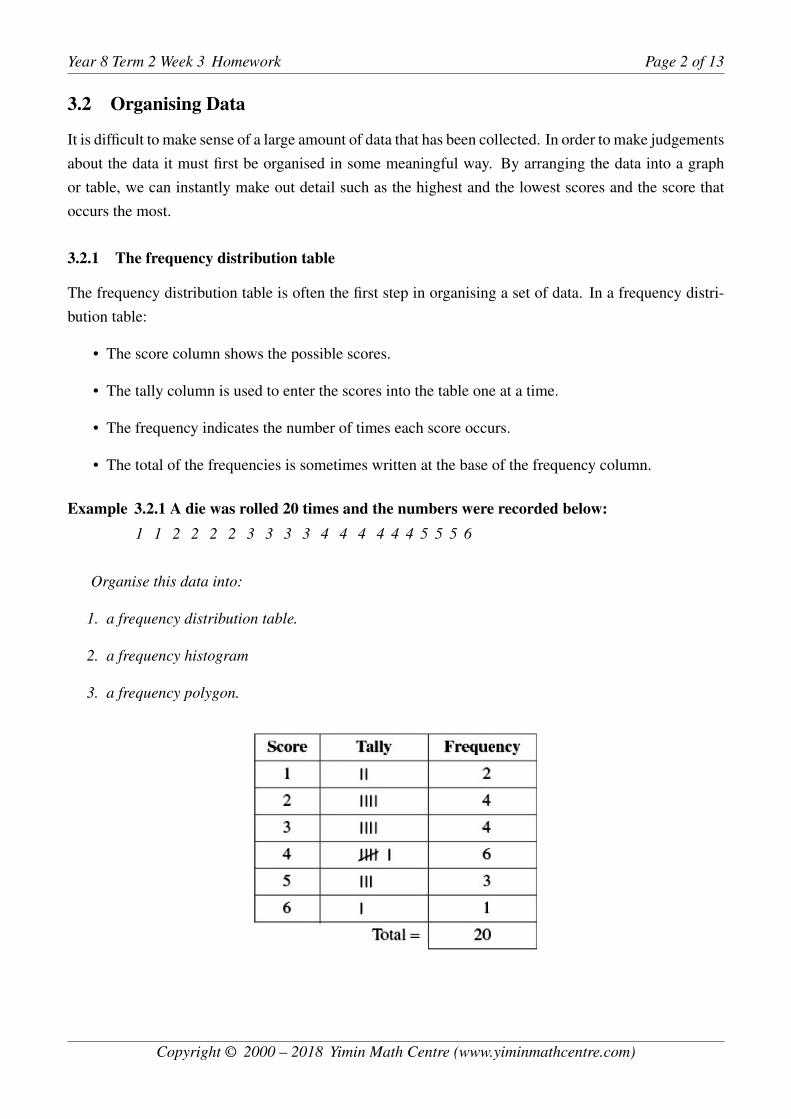
Example 3.2.1 A die was rolled 20 times and the numbers were recorded below:1 1 2 2 2 2 3 3 3 3 4 4 4 4 4 4 5 5 5 6
Organise this data into:
1. a frequency distribution table.
2. a frequency histogram
3. a frequency polygon.
Copyright © 2000 – 2018 Yimin Math Centre (www.yiminmathcentre.com)
Year 8 Term 2 Week 3 Homework Page 3 of 13
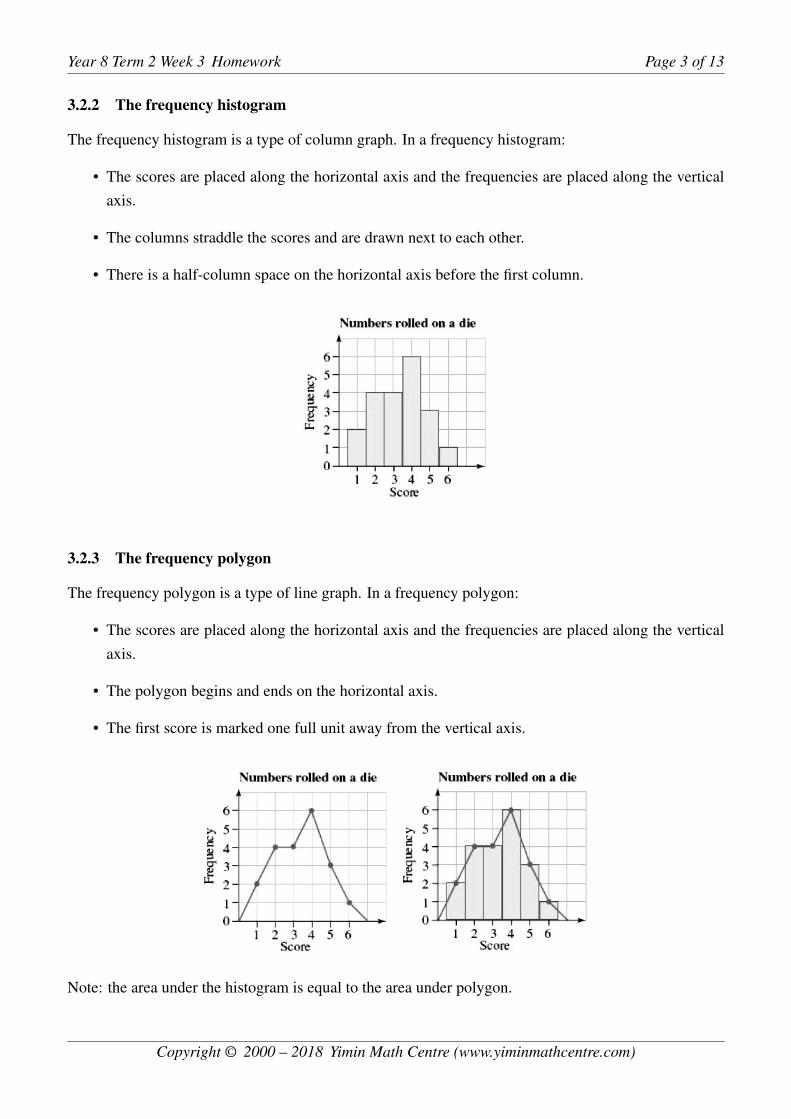
3.2.2 The frequency histogram
The frequency histogram is a type of column graph. In a frequency histogram:
• The scores are placed along the horizontal axis and the frequencies are placed along the verticalaxis.
• The columns straddle the scores and are drawn next to each other.
• There is a half-column space on the horizontal axis before the first column.
3.2.3 The frequency polygon
The frequency polygon is a type of line graph. In a frequency polygon:
• The scores are placed along the horizontal axis and the frequencies are placed along the verticalaxis.
• The polygon begins and ends on the horizontal axis.
• The first score is marked one full unit away from the vertical axis.
Note: the area under the histogram is equal to the area under polygon.
Copyright © 2000 – 2018 Yimin Math Centre (www.yiminmathcentre.com)
Year 8 Term 2 Week 3 Homework Page 4 of 13
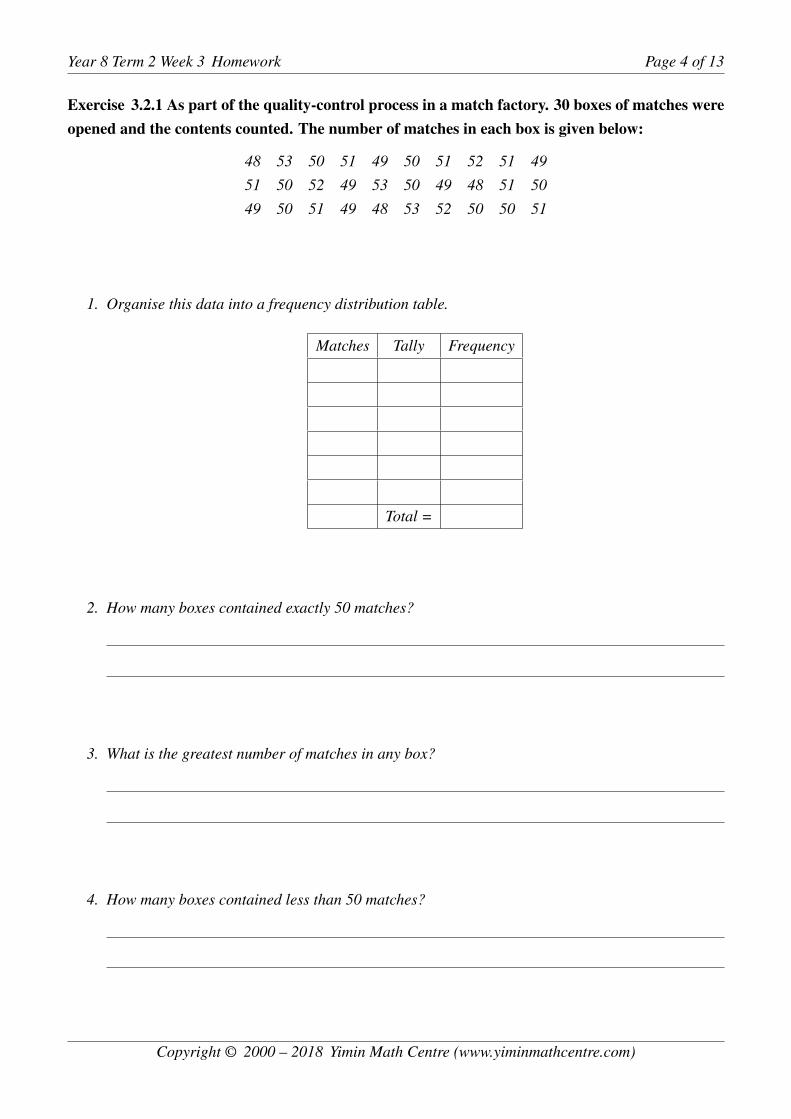
Exercise 3.2.1 As part of the quality-control process in a match factory. 30 boxes of matches wereopened and the contents counted. The number of matches in each box is given below:
48 53 50 51 49 50 51 52 51 49
51 50 52 49 53 50 49 48 51 50
49 50 51 49 48 53 52 50 50 51
1. Organise this data into a frequency distribution table.
Matches Tally Frequency
Total =
2. How many boxes contained exactly 50 matches?
3. What is the greatest number of matches in any box?
4. How many boxes contained less than 50 matches?
Copyright © 2000 – 2018 Yimin Math Centre (www.yiminmathcentre.com)

Year 8 Term 2 Week 3 Homework Page 5 of 13
3.2.4 The dot plot
The dot plot is a simpler version of the histogram. In is only useful for small numbers of scores sinceone dot represents a single score. In a dot plot:
• The scores are placed along the horizontal axis.
• One dot is placed above the score in a vertical line each time that score occurs.
Exercise 3.2.2 This dot plot shows the thickness in millimetres of lengths of pre-cut timber.
1. To what thickness do you think the timber should have been cut?
2. Are there any clusters in the data?
3. Are there any outliers?
4. The timber will be rejected at the quality control stage if its thickness is more 1 mm outside the
ideal thick (10 mm). How many pieces of timber will be rejected?
Copyright © 2000 – 2018 Yimin Math Centre (www.yiminmathcentre.com)
Year 8 Term 2 Week 3 Homework Page 6 of 13
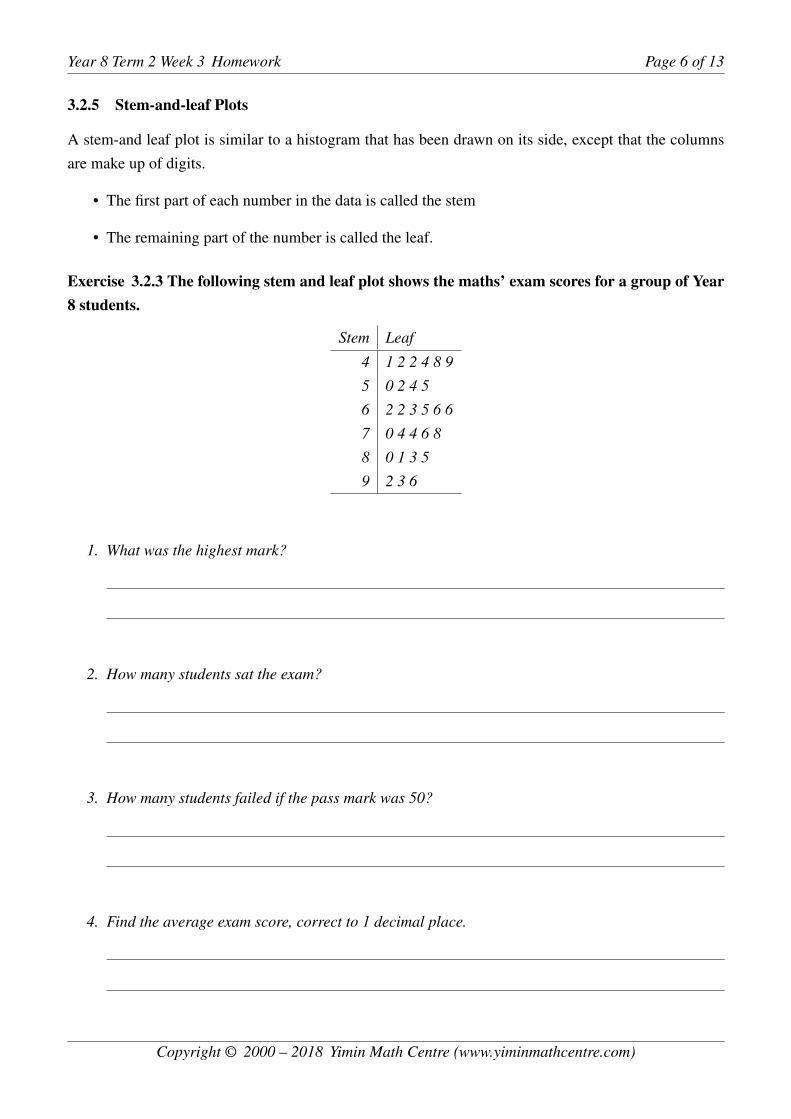
3.2.5 Stem-and-leaf Plots
A stem-and leaf plot is similar to a histogram that has been drawn on its side, except that the columnsare make up of digits.
• The first part of each number in the data is called the stem
• The remaining part of the number is called the leaf.
Exercise 3.2.3 The following stem and leaf plot shows the maths’ exam scores for a group of Year8 students.
Stem Leaf
4 1 2 2 4 8 9
5 0 2 4 5
6 2 2 3 5 6 6
7 0 4 4 6 8
8 0 1 3 5
9 2 3 6
1. What was the highest mark?
2. How many students sat the exam?
3. How many students failed if the pass mark was 50?
4. Find the average exam score, correct to 1 decimal place.
Copyright © 2000 – 2018 Yimin Math Centre (www.yiminmathcentre.com)

Year 8 Term 2 Week 3 Homework Page 7 of 13
Exercise 3.2.4 The number of points scored per game by a women’s netball team are listed below:75 77 78 80 82 84 84 85 87 87 88 88 89 90 92 94 95 96 97 98
1. Show this information on a stem-and-leaf with class intervals of 5.
Stem Leaf
2. In what percentage of games did the team score 90 points or more?
Exercise 3.2.5 Redraw this stem-and-leaf plot with class intervals of 5 and hence find the differencebetween the highest and lowest scores
Stem Leaf
1 2 3 3 4 5 6 6 7 7 9
2 0 0 1 1 3 6 7 7 8 9
3 1 2 3 4 6 7 8 8 9 9
Stem Leaf
Copyright © 2000 – 2018 Yimin Math Centre (www.yiminmathcentre.com)

Year 8 Term 2 Week 3 Homework Page 8 of 13
3.3 Miscellaneous Exercises
Exercise 3.3.1 The scatter diagram compares a farm’s grain production, in tonnes per hectare, tothe amount of rain that fell during the growing season, in millimetres, for the last 25 years.
1. In how many years was the rainfall more than 200 mm?
2. What was the highest grain return in this 25-year period?
3. What was the lowest grain return? What do you think may have caused this low return?
4. What was the second lowest grain return? What do you think may have caused this low return?
5. Describe the relationship that this scatter diagram shows between the level of grain production
and rainfall.
Copyright © 2000 – 2018 Yimin Math Centre (www.yiminmathcentre.com)
Year 8 Term 2 Week 3 Homework Page 9 of 13
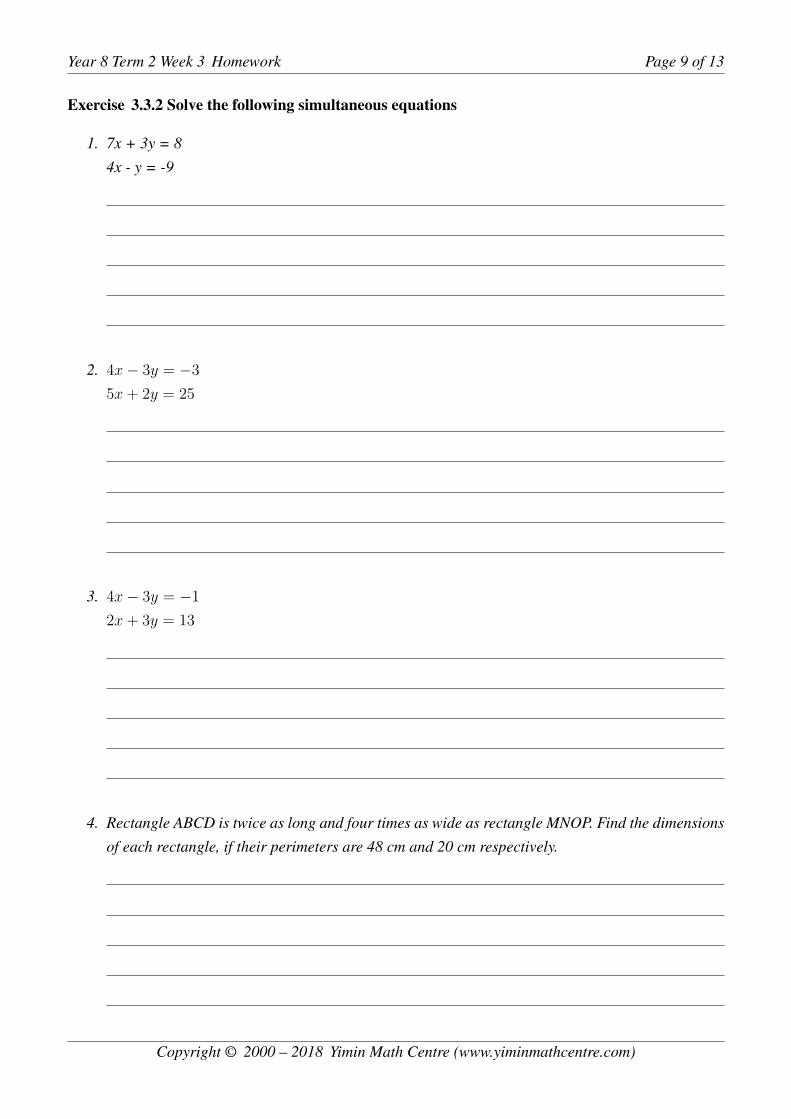
Exercise 3.3.2 Solve the following simultaneous equations
1. 7x + 3y = 8
4x - y = -9
2. 4x− 3y = −3
5x+ 2y = 25
3. 4x− 3y = −1
2x+ 3y = 13
4. Rectangle ABCD is twice as long and four times as wide as rectangle MNOP. Find the dimensions
of each rectangle, if their perimeters are 48 cm and 20 cm respectively.
Copyright © 2000 – 2018 Yimin Math Centre (www.yiminmathcentre.com)

Year 8 Term 2 Week 3 Homework Page 10 of 13
Exercise 3.3.3 The diagram not drawn to scale shows a regular pentagon with its centre at o. Findthe size of the angle x.
Exercise 3.3.4 Find the angle x:
Exercise 3.3.5 These two squares have been cut into five pieces. The pieces can be rearranged tomake a large square. Find the perimeter of the large square.
Copyright © 2000 – 2018 Yimin Math Centre (www.yiminmathcentre.com)

Year 8 Term 2 Week 3 Homework Page 11 of 13
Exercise 3.3.6 The following data recorded a group of 18 boys and 18 girls in a math topic test:
Boys 86 45 38 90 68 75 73 79 89 86 91 83 69 78 80 66 53 51
Girls 61 47 32 59 69 79 85 89 94 84 87 78 80 82 89 52 48 74
1. Organise this data into a two-sided stem-and-leaf plot.
Leaf Stem Leaf
2. What is the highest mark?
3. What is the lowest mark?
4. How many students passed the exam if the pass mark was 50?
5. Do boys or girls have the higher average score?
6. Find the average exam score, correct to 1 decimal place.
Copyright © 2000 – 2018 Yimin Math Centre (www.yiminmathcentre.com)

Year 8 Term 2 Week 3 Homework Page 12 of 13
Exercise 3.3.7
1. Tony and Mike have a bicycle race. Tony cycles at a speed of 12 km/h. Mike cycles at a speed of
16 km/h. If Mike lets Tony start 40 min before him, how long will Mike take to catch up with Tony?
2. Peter travelled from Town A to Town B which was 560 km away. for the first 450 km of the journey,
he drove at a speed of 90 km/h. He then reduced his speed by 55 km/h and completed the rest of
the journey. What was his average speed for the whole journey?
3. Express the following as a single fraction in its simplest form.
32x−3 −
26−4x
4. Given x = aya+y
, express y in terms of x and a
Copyright © 2000 – 2018 Yimin Math Centre (www.yiminmathcentre.com)

Year 8 Term 2 Week 3 Homework Page 13 of 13
Exercise 3.3.8 Simplify the following expression:
1. 3x2− x
7
2. (2x+ x)3
3. 12a3d2 ÷ 4ab2
4. (a+ 3)2 − (a− 3)2
Exercise 3.3.9 The distance a stone falls in metres is given by the formula d = 12gt2 where g = 9.8
and t is the number of seconds. How far will it fall in 9 seconds, correct to 1 decimal.
Copyright © 2000 – 2018 Yimin Math Centre (www.yiminmathcentre.com)