Embed Size (px)
Citation preview

1
RRAACCEE,, EETTHHNNIICCIITTYY aanndd PPuubblliicc RReessppoonnsseess ttoo CClliimmaattee CChhaannggee

2
Cover image courtesy of NASA. This study was conducted by the Yale Project on Climate Change and the George Mason University Center for Climate Change Communication. It was funded by the Surdna Foundation, the 11th Hour Project, the Pacific Foundation, and the Robert Wood Johnson Foundation. The race and ethnicity analysis was supported by the Natural Resources Defense Council. Principal investigators: Anthony Leiserowitz, PhD Yale Project on Climate Change School of Forestry and Environmental Studies, Yale University (203) 432-4865 [email protected] Karen Akerlof Center for Climate Change Communication Department of Communication, George Mason University (703) 282-1289 [email protected] Cite as: Leiserowitz, A. & Akerlof, K. (2010) Race, Ethnicity and Public Responses to Climate Change. Yale University and George Mason University. New Haven, CT: Yale Project on Climate Change. http://environment.yale.edu/uploads/RaceEthnicity2010.pdf

3
�“The climate change movement still remains highly homogenous by race and class and significantly by gender in its leadership. Even in 2009, climate briefings held across the country consistently feature mostly male and all-white casts. Like other pockets of environmental and conservation movements, climate change still suffers from the perception, and arguably the reality, that it is a movement led by and designed for the interests of the white, upper-middle class. Many people erroneously believe that interest in environmental issues is dependent on race, education, and class. To the contrary, growing numbers of people of color working in the environmental field and public polling demonstrate that reality often differs from conventional assumptions.�” �– Angela Park1
In this report we examine American public support for climate change and energy policies among different racial and ethnic groups. We find that in many cases, minorities are equally as supportive, and often more supportive of national climate and energy policies, than white Americans.

4
Introduction As the United States becomes increasingly diverse over the first half of the twenty-first century2, understanding the viewpoints of people of different racial and ethnic groups on climate change is becoming ever more important. This report provides an analysis of the global warming and energy policy preferences of both the overall American public and of particular racial and ethnic groups, based upon an October and November 2008 nationally representative survey of American 2,164 adults. A follow-up survey of 1,001 respondents in December 2009 and January 2010 (see Survey Methodology, p. 18) is also discussed. The impacts of climate change are likely to be felt disproportionately by those who face socioeconomic inequalities.3 In the United States this includes many Hispanics, African Americans and other racial and ethnic groups who are likely to be more vulnerable to heat waves, extreme weather events, environmental degradation, and subsequent labor market dislocations.4 Climate and energy policies that limit greenhouse gas emissions can often help reduce these impacts and improve the health of all Americans by decreasing other concomitant air pollutants and increasing opportunities for active and less carbon intensive lifestyles. These reductions are of great benefit to low-income and minority communities since many suffer greater impacts from air pollution and as a result will have the most to gain from policies that will improve air quality. Economic opportunities for low-income and minority communities are also forecast to improve access to green jobs and grow the green economy.5
Overall Policy Support
The fall of 2008 survey asked Americans how much they supported or opposed a wide variety of climate change policies, including possible regulations, subsidies, tax incentives, research and development funding, and international treaties. Overall, there was broad-based, bipartisan support for most policy options, with the notable exception of a higher gas tax (Fig. 1).
5
Figure 1 | Support for climate and energy policies, 2008
Very large majorities of Americans supported a variety of climate change policies:
92 percent said the government should increase funding for research into renewable energy sources, such as solar and wind power;
85 percent supported tax rebates for people buying energy efficient vehicles or solar panels; 80 percent said the government should regulate carbon dioxide (the primary greenhouse gas)
as a pollutant; 69 percent of Americans said the United States should sign an international treaty that
requires the U.S. to cut its emissions of carbon dioxide 90% by the year 2050. Importantly, large majorities of Americans also said they would support policies that would personally cost them more. For example:
79 percent supported a 45 mpg fuel efficiency standard for cars, trucks, and SUVs, even if that meant a new vehicle cost up to $1,000 more to buy;
72 percent supported a Renewable Portfolio Standard that required electric utilities to produce at least 20 percent of their electricity from wind, solar, or other renewable energy sources, even if it cost the average household an extra $100 a year;
72 percent supported a government subsidy to replace old water heaters, air conditioners, light bulbs, and insulation, even if it cost the average household $5 a month in higher taxes;
6
63 percent supported establishment of a special fund to make buildings more energy efficient and teach Americans how to reduce their energy use, even if this cost the average household $2.50 a month in higher electric bills.
At the time of the survey, nationwide retail gas prices were approximately $3.25/gallon and energy had become a major issue in the presidential campaign. Only 33 percent of the public supported increasing taxes on gasoline by 25 cents per gallon and returning the revenues to taxpayers by reducing the federal income tax. Finally, a national cap and trade system received relatively weak support compared with other policy options, however, a majority of Americans (53%) supported the creation of a national cap and trade system.

7
Policy Support by Race and Ethnicity Hispanics, African Americans and people of other races and ethnicities were often the strongest supporters of climate and energy policies and were also more likely to support these policies even if they incurred greater costs.
Clean Energy Policies Renewable Energy Investing in renewable energy sources has enjoyed sustained public support for many years. Most energy suppliers are today relying, at least in small part, on electricity supplied from renewable energy sources, such as wind and solar power, geothermal and biomass. In the fall of 2008, Americans overwhelmingly supported funding for more research into renewable energy sources, such as wind and solar power (91% support). This support was consistent across all racial and ethnic groups, including Hispanics (85%), African Americans (95%), �“Other�” races and ethnicities (94%) and non-Hispanic whites (92%), although African Americans were somewhat less likely to strongly support an investment in renewable energy research.
Renewable Portfolio Standards (RPS) Many states have set Renewable Portfolio Standards requiring that electric utilities produce a certain percentage of electricity from renewable or alternative energy sources like wind or solar. The standards range from modest to ambitious and qualifying energy sources vary. It is argued that renewable portfolio standards can stimulate the use of renewable energy and thereby provide significant greenhouse gas reductions, create jobs, and improve energy security.6 While the first RPS was established in 1983, most participating states created their standards after 2000. For example, California has set one of the most ambitious renewable energy standards in the country, requiring
8
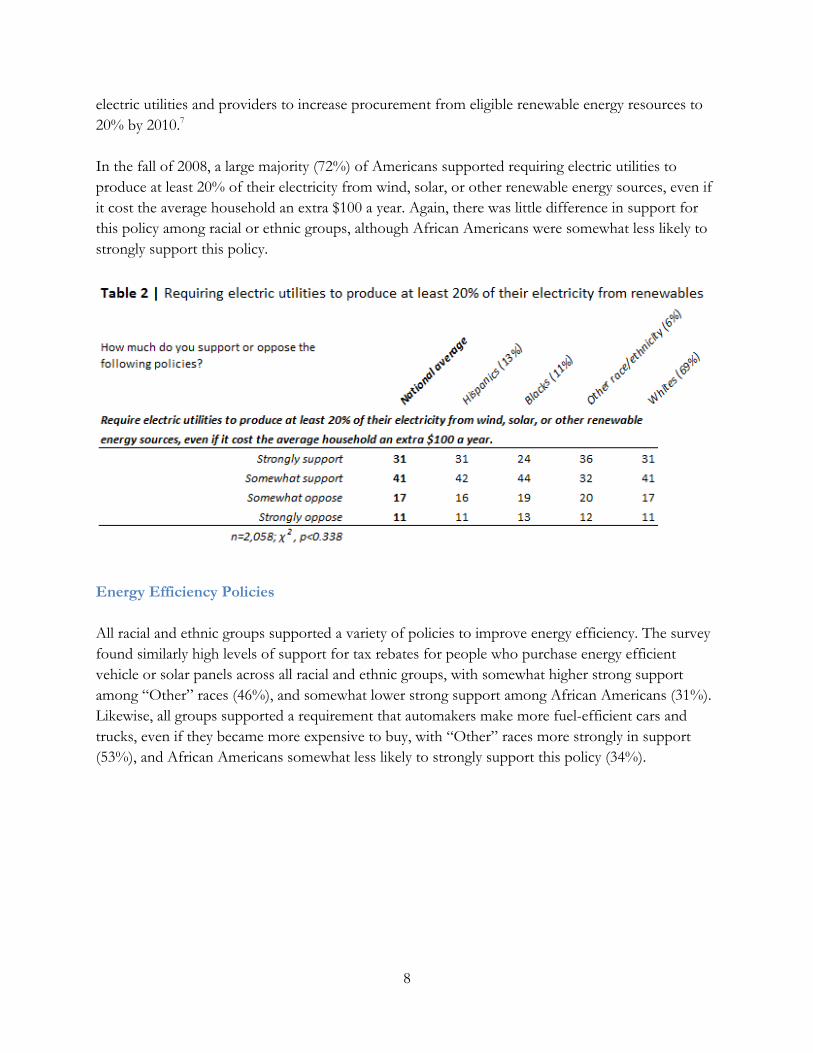
electric utilities and providers to increase procurement from eligible renewable energy resources to 20% by 2010.7 In the fall of 2008, a large majority (72%) of Americans supported requiring electric utilities to produce at least 20% of their electricity from wind, solar, or other renewable energy sources, even if it cost the average household an extra $100 a year. Again, there was little difference in support for this policy among racial or ethnic groups, although African Americans were somewhat less likely to strongly support this policy.
Energy Efficiency Policies All racial and ethnic groups supported a variety of policies to improve energy efficiency. The survey found similarly high levels of support for tax rebates for people who purchase energy efficient vehicle or solar panels across all racial and ethnic groups, with somewhat higher strong support among �“Other�” races (46%), and somewhat lower strong support among African Americans (31%). Likewise, all groups supported a requirement that automakers make more fuel-efficient cars and trucks, even if they became more expensive to buy, with �“Other�” races more strongly in support (53%), and African Americans somewhat less likely to strongly support this policy (34%).

9
Large majorities of all racial and ethnic groups also supported government subsidies to help improve the energy efficiency of households. Hispanics, however, were more likely to strongly support this policy than other groups (39%).

10
A majority of Americans (63%) also said they supported a special fund to help improve the energy efficiency of buildings and teach Americans how to reduce their energy use, even if it added $2.50 to their monthly electric bills. Hispanics (30%) and �“Other�” racial and ethnic groups (26%) were the most likely to strongly support this policy.
The Regulation of Carbon Dioxide
The regulation of carbon dioxide, which the Environmental Protection Agency moved to undertake in December 2009, was the most supported comprehensive policy to limit greenhouse gas emissions. The EPA�’s 2009 "endangerment finding" was made in response to a U.S. Supreme Court ruling in April 2007 that carbon dioxide should be considered a pollutant under the Clean Air Act and that EPA had both the authority and obligation to regulate CO2.8
Over three-quarters (80%) of Americans supported the regulation of carbon dioxide as a pollutant. Compared to the other racial and ethnic groups, African Americans were the most likely to somewhat or strongly support this policy (89%), while Hispanics were the most likely to strongly support it (40%).

11
Putting a Price on Carbon
In Congress, a cap and trade system remains one of the preferred comprehensive policies to reduce greenhouse gas emissions. Cap and trade legislation will place a mandatory cap on emissions while providing polluters some flexibility in how they comply, through market mechanisms, thereby encouraging innovation and achieving emissions reductions at lower economic costs. In June of 2009, the U.S. House of Representatives passed cap and trade legislation9, which is currently being considered by the Senate. In the fall of 2008, a majority of Americans supported a cap and trade system once provided a brief description, however, support was more lukewarm than for other policies, with only 11% of the public strongly supporting it. Majorities of all racial and ethnic groups supported a cap and trade system, with significantly stronger support from Hispanics, albeit still relatively lukewarm.

12
By contrast large majorities (67%) of Americans opposed a 25 cent per gallon gasoline tax, even if the revenues were returned to taxpayers by reducing the federal income tax, including majorities of all racial and ethnic groups. African Americans were slightly more likely to support this policy (43%) than the national average (33%).

13
An International Treaty A large majority of Americans (68%) supported signing an international treaty requiring the United States to cut its emissions of carbon dioxide 90% by the year 2050. Support was especially strong among Hispanics (77%) and �“Other�” races (76%).

14
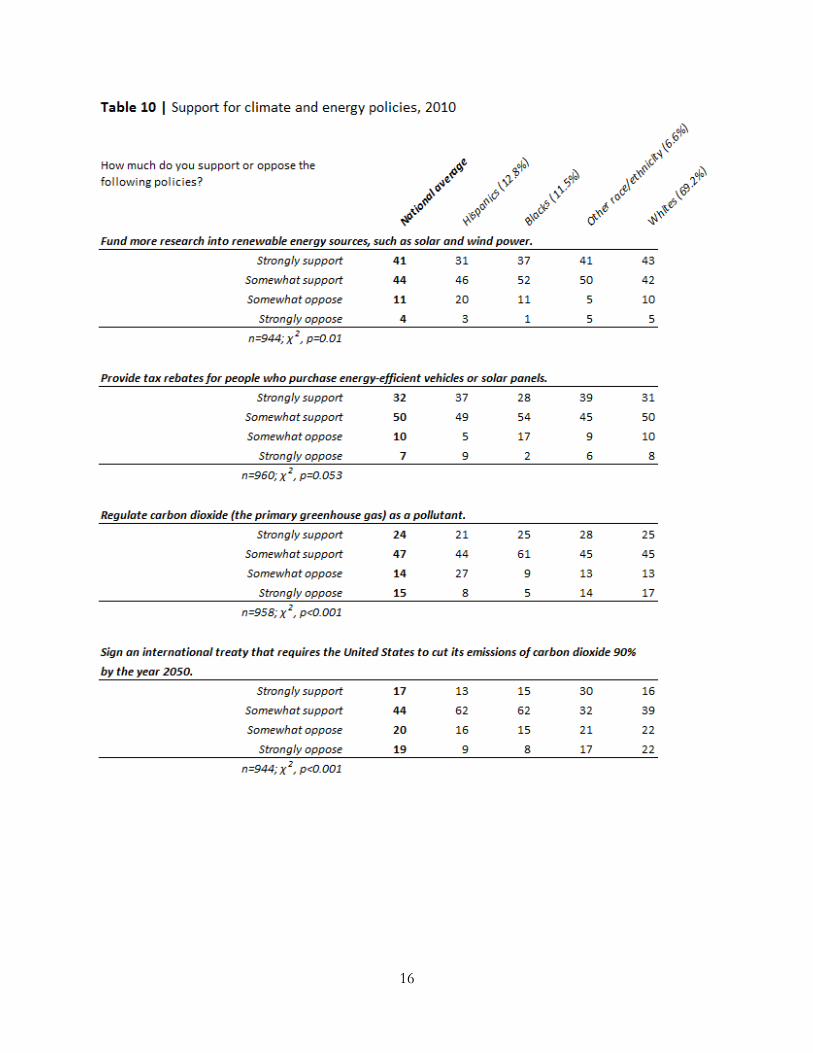
Overall Policy Support in 2010 Between Dec. 24, 2009 and Jan. 3, 2010, we conducted a follow-up national survey (n = 1,001) to assess changes in support for a variety of climate change policies (see Survey Methodology, p. 18). As the economy and unemployment worsened, overall support for funding more research on renewable energy, an international treaty, and building efficiency each declined 7 percentage points, while regulating carbon dioxide as a pollutant declined 9 points, and a renewable portfolio standard declined 14 points. Tax rebates, however, only declined 3 points, while support for a gasoline tax remained essentially unchanged. Despite these declines, however, large majorities of Americans continued to support most climate and energy policies. Figure 2 | Support for climate and energy policies, 2010

15
Policy Support in 2010 by Racial and Ethnic Groups Below we report the updated levels of public support for the same climate and energy policies as in 2008. This survey, however, had a smaller overall sample size (n = 1,001) than in 2008 (n = 2,164). Due to the relatively small sample sizes of minority groups in this 2010 survey, the results should be interpreted with caution, as the margin of error for each minority group ranges from +/- 9 to 12%. Nonetheless, the results largely mirror the primary finding of the 2008 study: that minority groups often had equally as strong, and sometimes stronger support for a variety of climate and energy policies than non-Hispanic whites. Large majorities of all racial and ethnic groups supported funding more research into renewable energy sources (77-91%); tax rebates for solar panels and fuel-efficient cars (81-85%); regulating carbon dioxide as a pollutant (65-86%); a 20% renewable portfolio standard, even if it cost the average household an extra $100 a year (55-72%); and signing an international climate change treaty (55-77%). Support for a building energy efficiency fund ranged from 49 to 71%, while support for a carbon tax ranged from 30 to 55%. This survey also measured support for a cap and trade system with a different description of the policy than the 2008 study. The overall results, however, were very similar to 2008. Among different racial and ethnic groups, support for a cap and trade system ranged from 55 to 77%, but most of that support was lukewarm. Again, while there is a large margin of error around each of these estimates, the overall results are consistent with both the slight decline in overall public support for climate and energy policies since the fall of 2008 and the finding that minority groups often supported these policies as much or more than non-Hispanic whites.
16

17

18
Conclusion Despite a serious economic recession with high unemployment, majorities of Americans in both the fall of 2008 and the winter of 2009/2010 supported a variety of climate change and energy policies, including a national investment in renewable energy research, tax breaks to encourage Americans to become more energy efficient, and the regulation of carbon dioxide as a pollutant. A majority of Americans also supported a cap and trade system, although less strongly than most other policies. Hispanics, African Americans and people of �“Other�” races and ethnicities were often the strongest supporters of policies to reduce greenhouse gas emissions, even when informed that some of these policies would entail individual costs. It is commonly believed that global climate change is primarily a concern of only upper and middle class whites, while minorities are focused only on local issues of environmental justice. These two national studies strongly suggest that these assumptions are often wrong. In fact, minorities often support action to respond to this global threat at levels equal to or greater than whites. And, since minorities are often disproportionally vulnerable to the impacts of climate change, it is vitally important that concerted efforts be made to engage these communities in both mitigation and adaptation efforts. As writer Angela Park argues, climate change must become �“everybody�’s movement.�”
Survey Methodology
2008. From October 7 through November 12 of 2008, we conducted a nationally representative survey of American adults aged 18 or older using KnowledgePanel, an online panel operated by Knowledge Networks. Recruited nationally using random-digit dialing (RDD) telephone methodology, KnowledgePanel is representative of the U.S. population. The panel tracks closely the December 2007 Current Population Survey (published jointly by the U.S. Census Bureau and the Bureau of Labor Statistics) on age, race, Hispanic ethnicity, geographic region, employment status, and other demographic variables. Completed questionnaires were received from 2,164 respondents, a 54% within panel completion rate, with a margin of sampling error of plus or minus 2 percent, with 95 percent confidence for the national results. The margin of error for each group is +/- 2% (whites), +/- 6% (Hispanics and African Americans), and +/- 8% (�“Other�”).
2010. From December 24, 2009 to January 3, 2010, we conducted a fresh cross-sectional nationally representative survey of American adults, again with Knowledge Networks. Completed questionnaires were received from 1,001 American adults, aged 18 or older, a 53% within panel completion rate. The sample was weighted, as in 2008, to correspond with US Census Bureau parameters for the United States. The margin of sampling error was plus or minus 3 percent, with 95 percent confidence for the national results. The margin of error for each group is +/-4% (whites), +/- 9% (Hispanics and African Americans), and +/- 12% (�“Other�”).

19
References
1Park, A. (2009). Everybody�’s movement: Environmental justice and climate change. Washington, DC: Environmental Support Center. Retrieved from http://envsc.org/esc-publications/everybodys-movement
2U.S. Census Bureau. (2008, Aug. 14). An older and more diverse nation by midcentury. Retrieved from http://www.census.gov/Press-Release/www/releases/archives/population/001249.html 3 Environmental Protection Agency. (2009). Endangerment and cause or contribute findings for greenhouse gases under Section 202(a) of the Clean Air Act. Federal Register, 74(239), 66495-66546. Retrieved from http://www.epa.gov/climatechange/endangerment/downloads/Federal_Register-EPA-HQOAR-2009-0171-Dec.15-09.pdf 4Shonkoff, S. B., Morello-Frosch, R., Pastor, M., & Sadd, J. (2009). Environmental health and equity impacts from climate change and mitigation policies in California: A review of the literature. Publication # CEC-500-2009-038-D. Retrieved from http://www.energy.ca.gov/2009publications/CEC-500-2009-038/CEC-500-2009-038-D.PDF 5Pollin, R., Wicks-Lim, J., & Garrett-Peltier, H. (2009). Green prosperity: How clean-energy policies can fight poverty and raise living standards in the United States. Amherst, MA: Department of Economics and Political Economy Research Institute, University of Massachusetts. Retrieved from: http://docs.nrdc.org/globalWarming/glo_09062504.asp 6Pew Center on Global Climate Change. (2009). Renewable & alternative energy portfolio standards. Retrieved from http://www.pewclimate.org/what_s_being_done/in_the_states/rps.cfm 7The California Energy Commission. (2010). California's renewable energy programs. Retrieved from: http://www.energy.ca.gov/renewables/index.html 8Massachusetts v. EPA, 549 U.S. 497 (2007). 9 American Clean Energy and Security Act of 2009, H. R. 2454, 111th Cong. (2009). Retrieved from http://www.govtrack.us/congress/bill.xpd?bill=h111-2454

Table Title Page1.0 Global Warming Belief and Certainty 22
2.0 Issue Involvement 23
Perceived Global Warming Knowledge and Beliefs3.0 Self Assessed Knowledge 243.1 Causes and Scientific Consensus 253.2 26
Risk Perceptions4.0 Estimates of Injuries and Fatalities 274.1 Who Is at Risk 28 294.2 Timing of Harm 304.3 Types of Harm 31 334.4 Likelihood of Harm 34
Outcomes from National Action to Reduce Global Warming5.0 Expectations 355.1 Most Important Benefit 365.2 Greatest Concern 375.3 37
Beliefs about Potential Outcomes and the Effectiveness of Actions6.0 Will We Succeed? 386.1 Saving Energy 39
7.0 National Issue Priorities 40
8.0 Environmental Issue Priorities 41 42
Support for National Response9.0 Conditions for Action 439.1 Magnitude of Action 439.2 Specific Climate and Energy Policies 44 46
10.0 Expectations of Elected Officials, Corporations and Citizens 47 48
Climate System Mental Models
Should the U.S. Act?
Table of ContentsRace, Ethnicity and Public Responses to Climate Change: 2008 National Survey
20

Table Title PagePolitical Activism
11.0 Actions 4911.1 Intentions 5011.2 Confidence in Own Ability to Act 50 5111.3 Perceived Effectiveness of Own Action 51 52
Consumer Activism12.0 Actions 5212.1 Intentions 53
Energy Efficiency13.0 Energy Efficiency Actions and Intentions 54 5514.0 Barriers to Home Energy Efficiency Improvements 56 58
Energy Conservation15.0 Energy Conservation Actions 58 5916.0 Barriers to Public Transportation 60
17.0 Perceived Lifestyle Impacts from Personal Actions 60
18.0 Interpersonal Communication 61
19.0 61
Environmental Beliefs and Concerns20.0 Identification as Environmentalist 6220.1 Concern for Other Species, Humans, Self 62
21.0 Information Seeking and Attention 63 64
22.0 Trust in Information Sources 65 66
23.0 Frequency of Media Use 67 68
24.0 Preferred News Sources 69
Political Affiliation and Ideology
Table of Contents continuedRace, Ethnicity and Public Responses to Climate Change: 2008 National Survey
21

Table 1.0 | Global Warming Belief and Certainty
Recently, you may have noticed that global warminghas been getting some attention in the news. Globalwarming refers to the idea that the world�’s averagetemperature has been increasing over the past 150years, may be increasing more in the future, and thatthe world�’s climate may change as a result. What doyou think? Do you think that global warming ishappening? Na
tional average
Hispanics(13%)
Blacks (11%)
Other race/ethnicity(6%
)
Whites(69%)
Recently, you may have noticed that global warminghas been getting some attention in the news. Globalwarming refers to the idea that the world�’s averagetemperature has been increasing over the past 150years, may be increasing more in the future, and thatthe world�’s climate may change as a result. What doyou think? Do you think that global warming ishappening?
Yes 71 81 72 77 69Don't know 19 15 28 16 19
No 10 4 0 7 12
n=2,157; 2 , p<0.001
How sure are you that global warming is happening?[How sure are you that global warming is nothappening?]
National average
Hispanics(13%)
Blacks (11%)
Other race/ethnicity(6%
)
Whites(69%)
Extremely sure global warming is happening 25 32 24 33 23Very sure global warming is happening 26 31 24 28 26
Somewhat sure global warming is happening 17 10 22 12 18Not at all sure global warming is happening 3 8 2 4 2
Don't know 19 15 28 16 19Not at all sure global warming is not happening 1 0 0 0 1
Somewhat sure global warming is not happening 4 3 0 1 4Very sure global warming is not happening 3 0 0 2 4
Extremely sure global warming is not happening 3 1 0 4 3
n=2,156; 2 , p<0.001
"I could easily change my mind about global warming."
National average
Hispanics(13%)
Blacks (11%)
Other race/ethnicity(6%
)
Whites(69%)
Strongly disagree 34 36 21 44 34Somewhat disagree 34 29 35 33 35
Somewhat agree 27 34 29 21 27Strongly agree 5 2 15 2 4
n=2,124; 2 , p<0.001
22

Table 2.0 |Issue Involvement
How important is the issue of global warming to youpersonally?
National average
Hispanics(13%)
Blacks (11%)
Other race/ethnicity(6%
)
Whites(69%)How important is the issue of global warming to you
personally?
Extremely important 11 21 8 15 9Very important 21 16 28 28 20
Somewhat important 39 44 48 35 38Not too important 18 12 10 14 21
Not at all important 11 7 7 9 13
n=2,144; 2 , p<0.001
How much had you thought about global warmingbefore today?
National average
Hispanics(13%)
Blacks (11%)
Other race/ethnicity(6%
)
Whites(69%)How much had you thought about global warming
before today?
A lot 20 22 18 30 19Some 35 25 29 39 37A little 33 35 29 21 34
Not at all 12 18 24 10 10
n=2,149; 2 , p<0.001
How worried are you about global warming?
National average
Hispanics(13%)
Blacks (11%)
Other race/ethnicity(6%
)
Whites(69%)How worried are you about global warming?
Very worried 17 28 18 26 13Somewhat worried 46 48 41 39 47Not very worried 24 17 33 25 24Not at all worried 13 7 8 9 16
n=2,148; 2 , p<0.001
23

Table 3.0 | Perceived Global Warming Knowledge and Beliefs: Self Assessed Knowledge
Personally, do you think that you are well informed or notabout�…
National average
Hispanics(13%)
Blacks (11%)
Other race/ethnicity(6%
)
Whites(69%)Personally, do you think that you are well informed or not
about�…
The different causes of global warming
Very well informed 11 13 4 17 11Fairly well informed 51 50 38 47 54
Not very well informed 29 26 37 29 28Not at all informed 9 11 21 7 7
n=2,142; 2 , p<0.001
Very well informed 12 12 3 18 13Fairly well informed 50 49 38 45 52
Not very well informed 30 29 40 31 28Not at all informed 9 11 18 7 7
n=2,138; 2 , p<0.001
Very well informed 12 15 3 15 13Fairly well informed 53 45 49 48 56
Not very well informed 27 28 31 29 26Not at all informed 8 13 17 7 5
n=2,130; 2 , p<0.001
The different causes of global warming
The different consequences of global warming
Ways in which we can reduce global warming
24
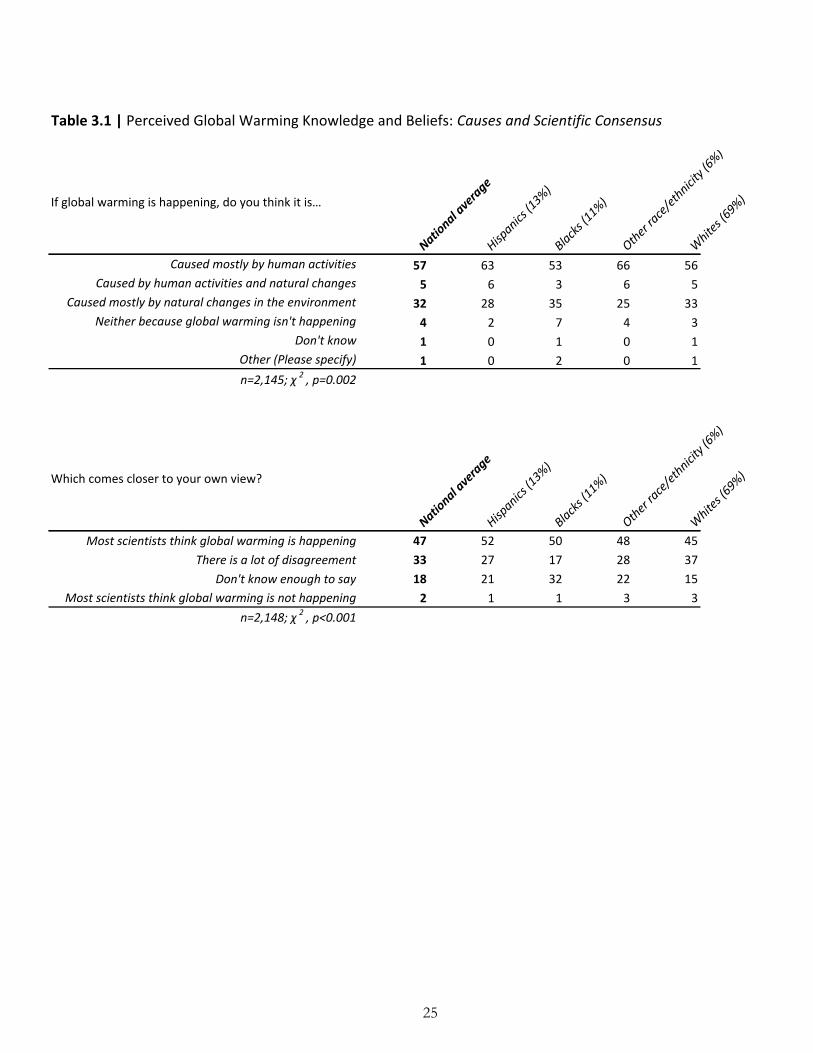
Table 3.1 | Perceived Global Warming Knowledge and Beliefs: Causes and Scientific Consensus
If global warming is happening, do you think it is�…
National average
Hispanics(13%)
Blacks (11%)
Other race/ethnicity(6%
)
Whites(69%)
Caused mostly by human activities 57 63 53 66 56Caused by human activities and natural changes 5 6 3 6 5
Caused mostly by natural changes in the environment 32 28 35 25 33Neither because global warming isn't happening 4 2 7 4 3
Don't know 1 0 1 0 1Other (Please specify) 1 0 2 0 1n=2,145; 2 , p=0.002
Which comes closer to your own view?
National average
Hispanics(13%)
Blacks (11%)
Other race/ethnicity(6%
)
Whites(69%)
Most scientists think global warming is happening 47 52 50 48 45There is a lot of disagreement 33 27 17 28 37
Don't know enough to say 18 21 32 22 15Most scientists think global warming is not happening 2 1 1 3 3
n=2,148; 2 , p<0.001
25

Table 3.2 | Perceived Global Warming Knowledge and Beliefs: Climate System Mental Models
People disagree about how the climate systemworks. The five pictures below illustrate five
26
pdifferent perspectives. Each picture depicts theearth�’s climate system as a ball balanced on a line,yet each one has a different ability to withstandhuman caused global warming. Which one of thefive pictures best represents your understanding ofhow the climate system works?
National average
Hispanics(13%)
Blacks (11%)
Other race/ethnicity(6%
)
Whites(69%)
pdifferent perspectives. Each picture depicts theearth�’s climate system as a ball balanced on a line,yet each one has a different ability to withstandhuman caused global warming. Which one of thefive pictures best represents your understanding ofhow the climate system works?
Gradual 32 41 31 27 31Random 27 22 31 20 28
Threshold 24 16 21 32 25Fragile 12 16 12 20 10Stable 5 4 4 1 6
n=2,068; 2 , p<0.001
26

Table 4.0 | Risk Perceptions: Estimates of Injuries and Fatalities
Now please think about the human health effects ofglobal warming. (Please choose the answercorresponding to your best estimate.) Worldwide,how many people do you think�…
National average
Hispanics(13%)
Blacks (11%)
Other race/ethnicity(6%
)
Whites(69%)
Now please think about the human health effects ofglobal warming. (Please choose the answercorresponding to your best estimate.) Worldwide,how many people do you think�…
Currently die each year due to global warming?
Millions 3 5 3 4 3Thousands 14 16 12 20 13Hundreds 12 14 12 13 11
None 23 16 9 20 27Don't Know 48 49 65 43 46
n=2,138; 2 , p<0.001
Millions 5 5 2 7 5Thousands 15 21 18 19 13Hundreds 13 14 8 12 13
None 21 15 7 19 25Don't Know 46 45 65 43 44
n=2,140; 2 , p<0.001
Millions 11 13 8 15 10Thousands 17 18 17 21 16Hundreds 8 10 3 6 9
None 14 8 4 15 17Don't Know 50 51 67 43 48
n=2,146; 2 , p<0.001
Millions 13 14 8 22 13Thousands 15 19 16 15 15Hundreds 7 9 4 4 8
None 15 9 4 13 18Don't Know 50 49 68 45 47
n=2,125; 2 , p<0.001
Currently die each year due to global warming?
Are currently injured or become ill each year due to global warming?
Will be injured or become ill each year 50 years from now due to global warming?
Will die each year 50 years from now due to global warming?
27

Table 4.1 |Risk Perceptions:Who Is at Risk
How much do you think global warming will harm:
National average
Hispanics(13%)
Blacks (11%)
Other race/ethnicity(6%
)
Whites(69%)
You personally
How much do you think global warming will harm:
A great deal 10 23 12 19 6A moderate amount 22 24 27 22 21
Only a little 24 22 15 26 25Not at all 22 10 11 19 26
Don't know 23 22 35 14 22n=2,140; 2 , p<0.001
A great deal 11 22 13 21 8A moderate amount 24 28 26 24 23
Only a little 23 21 18 24 24Not at all 18 8 8 17 22
Don't know 23 21 35 14 22n=2,137; 2 , p<0.001
A great deal 13 22 14 24 11A moderate amount 26 30 28 33 24
Only a little 20 16 16 18 22Not at all 17 8 6 14 20
Don't know 23 24 36 11 22n=2,136; 2 , p<0.001
A great deal 21 27 24 37 18A moderate amount 28 31 28 28 27
Only a little 15 11 11 10 17Not at all 14 7 5 14 16
Don't know 22 24 32 10 21n=2,144; 2 , p<0.001
Your community
People in the United States
You personally
Your family
28

Table 4.1 continued |Risk Perceptions:Who Is at Risk
How much do you think global warming will harm:
National average
Hispanics(13%)
Blacks (11%)
Other race/ethnicity(6%
)
Whites(69%)
People in other modern industrialized countries
How much do you think global warming will harm:
A great deal 22 28 23 36 20A moderate amount 28 29 25 26 28
Only a little 13 11 10 9 15Not at all 13 6 4 14 16
Don't know 24 26 38 14 22
A great deal 31 39 28 48 29A moderate amount 21 24 23 19 21
Only a little 11 6 8 4 12Not at all 13 6 3 14 15
Don't know 24 25 38 14 22
A great deal 44 49 39 67 42A moderate amount 17 16 18 18 8
Only a little 7 6 3 9 4Not at all 10 6 3 11 12
Don't know 22 22 37 21 9
A great deal 45 46 46 63 43A moderate amount 17 18 15 15 17
Only a little 8 6 6 3 10Not at all 9 6 3 12 11
Don't know 20 24 30 8 19
n=2,136; 2 , p<0.001
n=2,127; 2 , p<0.001
n=2,130; 2 , p<0.001
People in other modern industrialized countries
People in developing countries
n=2,138; 2 , p<0.001
Future generations of people
Plant and animal species
29

Table 4.2 |Risk Perceptions: Timing of Harm
When do you think global warming will start to harm peoplein the United States?
National average
Hispanics(13%)
Blacks (11%)
Other race/ethnicity(6%
)
Whites(69%)When do you think global warming will start to harm people
in the United States?
They are being harmed now 34 37 43 44 31In 10 years 13 15 15 15 12In 25 years 13 16 10 15 13In 50 years 13 13 13 10 14
In 100 years 12 12 9 10 13Never 15 7 9 7 18
They are being harmed now
n=2,095; 2 , p<0.001
When do you think global warming will start to harm otherpeople around the world?
National average
Hispanics(13%)
Blacks (11%)
Other race/ethnicity(6%
)
Whites(69%)
They are being harmed now
When do you think global warming will start to harm otherpeople around the world?
38 36 45 42 37In 10 years 13 17 12 16 12In 25 years 12 16 13 14 11In 50 years 12 11 10 11 12
In 100 years 11 10 13 10 11Never 14 10 7 7 17
They are being harmed now
n=2,088; 2 , p<0.001
30

Table 4.3 |Risk Perceptions: Types of Harm
Worldwide over the next 20 years, do you think globalwarming will cause more or less of the following, if nothingis done to address it?
National average
Hispanics(13%)
Blacks (11%)
Other race/ethnicity(6%
)
Whites(69%)
Worldwide over the next 20 years, do you think globalwarming will cause more or less of the following, if nothingis done to address it?
Severe heat wavesMany more 42 52 49 50 38A few more 24 20 22 19 26
No difference 14 6 3 16 17A few less 1 2 2 0 0Many less 1 1 0 4 1
Don't Know 19 19 24 12 18
Many more 43 50 50 50 40A few more 22 17 19 22 23
No difference 14 11 6 13 16A few less 1 4 3 0 1Many less 1 1 0 4 1
Don't Know 19 17 23 11 20
Many more 41 51 45 47 37A few more 24 17 22 25 25
No difference 14 10 4 15 17A few less 1 2 3 0 1Many less 1 3 0 4 1
Don't Know 19 18 25 9 19
Many more 39 48 48 49 35A few more 24 18 20 22 26
No difference 15 9 6 14 17A few less 1 2 2 0 1Many less 1 2 1 4 1
Don't Know 21 21 24 12 21
Droughts and water shortages
Severe heat waves
n=2,140; 2 , p<0.001
n=2,131; 2 , p<0.001
Extinctions of plant and animal species
Famines and food shortages
n=2,140; 2 , p<0.001
n=2,131; 2 , p<0.001
31
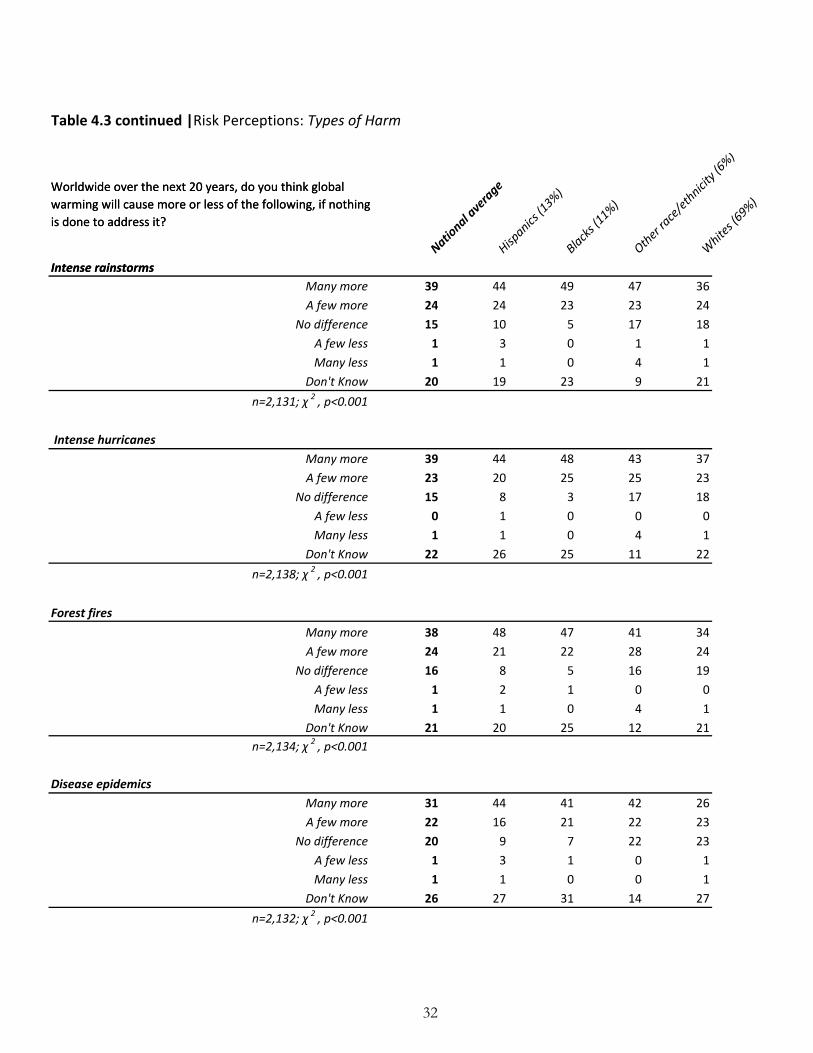
Table 4.3 continued |Risk Perceptions: Types of Harm
Worldwide over the next 20 years, do you think globalwarming will cause more or less of the following, if nothingis done to address it?
National average
Hispanics(13%)
Blacks (11%)
Other race/ethnicity(6%
)
Whites(69%)
Worldwide over the next 20 years, do you think globalwarming will cause more or less of the following, if nothingis done to address it?
Intense rainstormsMany more 39 44 49 47 36A few more 24 24 23 23 24
No difference 15 10 5 17 18A few less 1 3 0 1 1Many less 1 1 0 4 1
Don't Know 20 19 23 9 21
Many more 39 44 48 43 37A few more 23 20 25 25 23
No difference 15 8 3 17 18A few less 0 1 0 0 0Many less 1 1 0 4 1
Don't Know 22 26 25 11 22
Many more 38 48 47 41 34A few more 24 21 22 28 24
No difference 16 8 5 16 19A few less 1 2 1 0 0Many less 1 1 0 4 1
Don't Know 21 20 25 12 21
Many more 31 44 41 42 26A few more 22 16 21 22 23
No difference 20 9 7 22 23A few less 1 3 1 0 1Many less 1 1 0 0 1
Don't Know 26 27 31 14 27
Intense hurricanes
Intense rainstorms
n=2,131; 2 , p<0.001
n=2,138; 2 , p<0.001
Forest fires
Disease epidemics
n=2,132; 2 , p<0.001
n=2,134; 2 , p<0.001
32
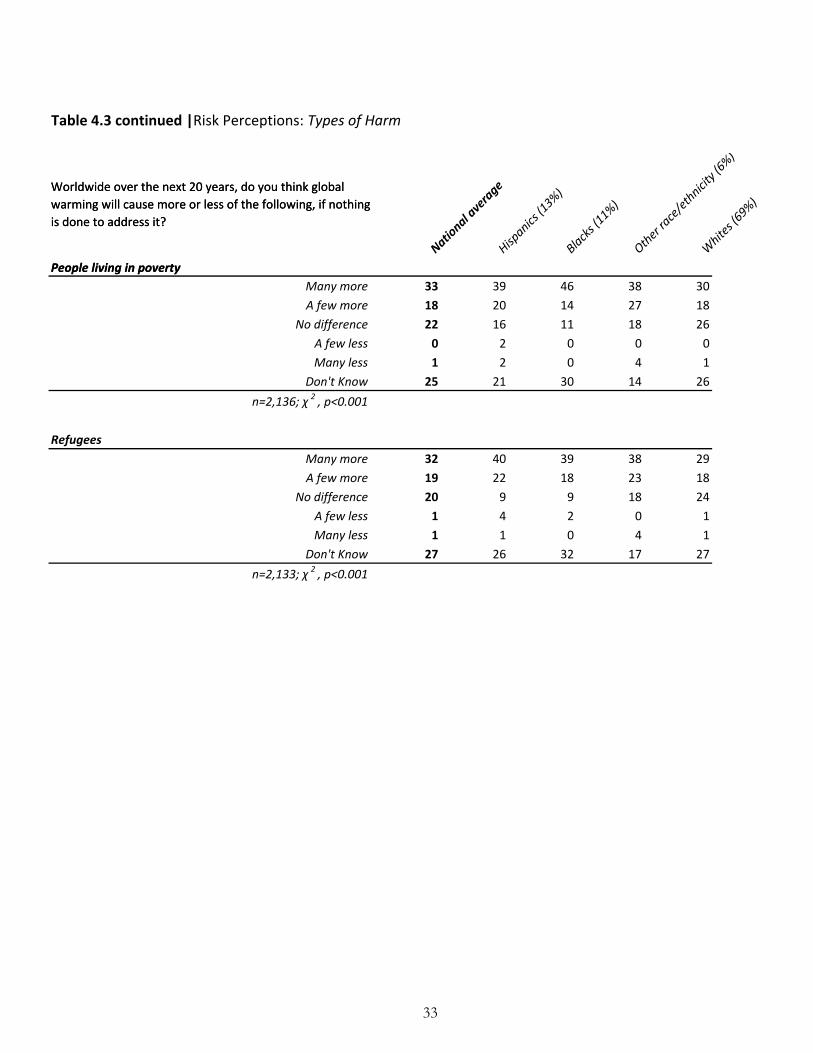
Table 4.3 continued |Risk Perceptions: Types of Harm
Worldwide over the next 20 years, do you think globalwarming will cause more or less of the following, if nothingis done to address it?
National average
Hispanics(13%)
Blacks (11%)
Other race/ethnicity(6%
)
Whites(69%)
Worldwide over the next 20 years, do you think globalwarming will cause more or less of the following, if nothingis done to address it?
People living in povertyMany more 33 39 46 38 30A few more 18 20 14 27 18
No difference 22 16 11 18 26A few less 0 2 0 0 0Many less 1 2 0 4 1
Don't Know 25 21 30 14 26
Many more 32 40 39 38 29A few more 19 22 18 23 18
No difference 20 9 9 18 24A few less 1 4 2 0 1Many less 1 1 0 4 1
Don't Know 27 26 32 17 27
n=2,133; 2 , p<0.001
People living in poverty
n=2,136; 2 , p<0.001
Refugees
33
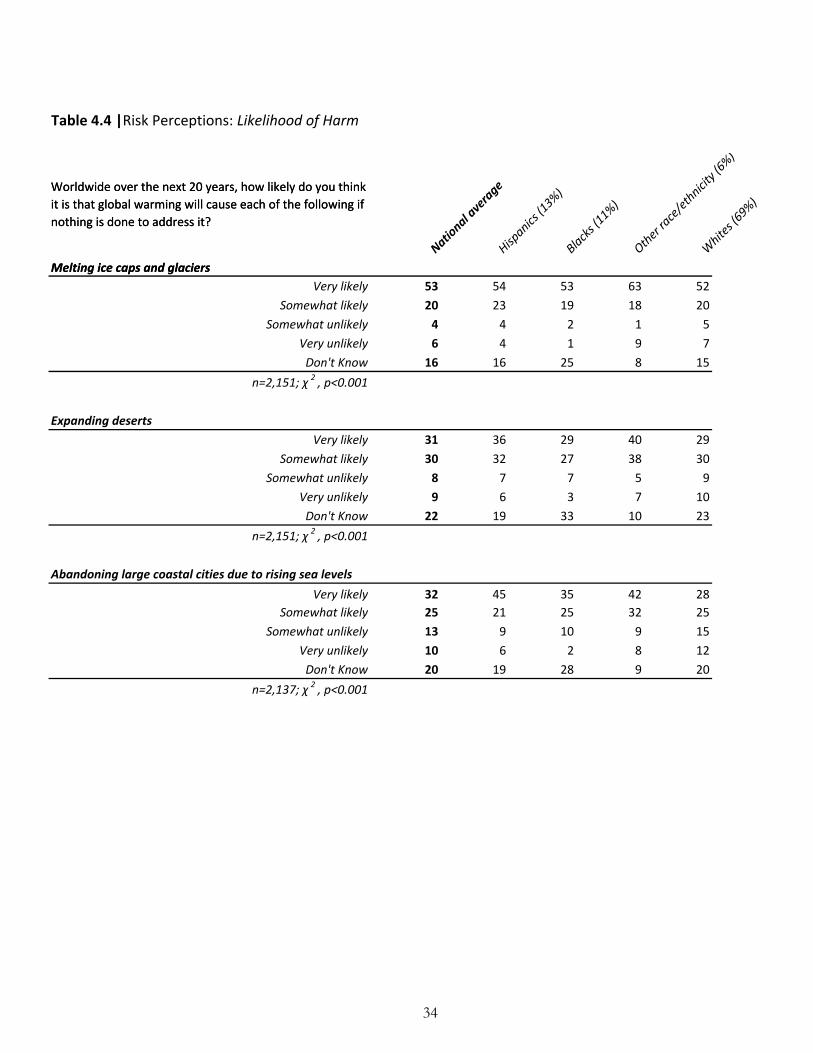
Table 4.4 |Risk Perceptions: Likelihood of Harm
Worldwide over the next 20 years, how likely do you thinkit is that global warming will cause each of the following ifnothing is done to address it?
National average
Hispanics(13%)
Blacks (11%)
Other race/ethnicity(6%
)
Whites(69%)
Worldwide over the next 20 years, how likely do you thinkit is that global warming will cause each of the following ifnothing is done to address it?
Melting ice caps and glaciersVery likely 53 54 53 63 52
Somewhat likely 20 23 19 18 20Somewhat unlikely 4 4 2 1 5
Very unlikely 6 4 1 9 7Don't Know 16 16 25 8 15
Very likely 31 36 29 40 29Somewhat likely 30 32 27 38 30
Somewhat unlikely 8 7 7 5 9Very unlikely 9 6 3 7 10Don't Know 22 19 33 10 23
Very likely 32 45 35 42 28Somewhat likely 25 21 25 32 25
Somewhat unlikely 13 9 10 9 15Very unlikely 10 6 2 8 12Don't Know 20 19 28 9 20
n=2,151; 2 , p<0.001
Abandoning large coastal cities due to rising sea levels
n=2,137; 2 , p<0.001
Melting ice caps and glaciers
n=2,151; 2 , p<0.001
Expanding deserts
34

Table 5.0 |National Action to Reduce Global Warming: Expectations
Please check all of the answers below that you believeare true. If our nation takes steps to reduce globalwarming, it will....
National average
Hispanics(13%)
Blacks (11%)
Other race/ethnicity(6%
)
Whites(69%)
Please check all of the answers below that you believeare true. If our nation takes steps to reduce globalwarming, it will....
Provide a better life for next generation 1 66 67 70 69 65Prevent plant/animal extinction * 2 65 73 70 65 63
Improve people�’s health 60 62 65 65 58Create jobs/a strong economy * 3 54 56 62 61 52
Prevent the destruction of most life * 4 50 66 63 54 44Protect God�’s creation * 48 60 65 31 44
Lessen foreign oil dependence 5 48 44 47 55 48Lead to more government regulation * 44 31 38 50 46Protect the world�’s poor from harm * 6 35 38 44 41 32
Save people from poverty and starvation * 7 34 33 45 41 32Cause energy prices to rise * 31 28 15 28 34
Improve our national security * 17 20 21 17 15Cost jobs and harm our economy 17 16 12 15 18Interfere with the free market * 13 6 3 14 15
Harm poor people more than it helps them * 11 13 6 6 12Undermine American sovereignty * 8 10 1 12 8
n= 2164 286 240 1499 138
1Item wording: Provide a better life for our children and grandchildren2Item wording: Save many plant and animal species from extinction3Item wording: Create green jobs and a stronger economy4Item wording: Prevent the destruction of most life on the planet5Item wording: Help free us from dependence on foreign oil6Item wording: Protect the world�’s poorest people from harm caused by the world�’s richest people7Item wording: Save many people around the world from poverty and starvation
* 2 statistically significant, p<0.05
35

Table 5.1 |National Action to Reduce Global Warming:Most Important Benefit
Of the reasons you selected, which one is mostimportant to you personally?
National average
Hispanics(13%)
Blacks (11%)
Other race/ethnicity(6%
)
Whites(69%)Of the reasons you selected, which one is most
important to you personally?
Provide a better life for next generation 1 26 24 20 41 26Protect God's creation 19 21 34 11 16
Prevent the destruction of most life 2 16 18 6 11 18Improve people's health 10 8 12 14 10
Lessen foreign oil dependence 3 8 9 6 8 9Prevent plant/animal extinction 4 8 6 7 4 9Create jobs/a strong economy 5 6 10 3 7 5
Save people from poverty and starvation 6 4 0 10 4 4Improve our national security 1 3 1 0 0
Protect the world�’s poor from harm 7 1 0 2 0 22 , p<0.001 n= 1427 206 179 950 92
1Item wording: Provide a better life for our children and grandchildren2Item wording: Prevent the destruction of most life on the planet3Item wording: Help free us from dependence on foreign oil4Item wording: Save many plant and animal species from extinction5Item wording: Create green jobs and a stronger economy6Item wording: Save many people around the world from poverty and starvation7Item wording: Protect the world�’s poorest people from harm caused by the world�’s richest people
36

Table 5.2 |National Action to Reduce Global Warming: Greatest Concern
Of the things you selected which one is of greatest
concern to you personally?1
National average
Hispanics(13%)
Blacks (11%)
Other race/ethnicity(6%
)
Whites(69%)Of the things you selected which one is of greatest
concern to you personally?1
Lead to more government regulation 33 23 40 9 36Cause energy prices to rise 27 3 13 48 29
Cost jobs and harm our economy 20 33 47 4 18Harm poor people more than it helps them 8 40 0 0 5
Undermine American sovereignty 7 0 0 22 7Interfere with the free market 6 0 0 17 5
2 , p<0.001 n= 343 30 15 275 23
1Only asked if respondent previously selected more than one item of concern
Table 5.3 |National Action to Reduce Global Warming: Should the U.S. Act?
Which of the following two statements do you find the most convincing?2
National average
Hispanics(13%)
Blacks (11%)
Other race/ethnicity(6%
)
Whites(69%)
We should take steps because �… 3 92 97 99 96 90We should not take steps because �… 4 8 3 1 4 10
2 , p=0.002 n= 953 116 103 664 70
2Only asked if respondent selected at least one benefit and one harm3Item wording: We should take steps to reduce global warming because it will [top or only reason for action inserted]4Item wording: We should not take steps to reduce global warming because it will [top or only concern inserted]
37

Table 6.0 |Beliefs about Potential Outcomes and the Effectiveness of Actions:Will We Succeed?
Which of the following statements comes closestto your view?
National average
Hispanics(13%)
Blacks (11%)
Other race/ethnicity(6%
)
Whites(69%)
Humans can, and we are going to 1 6 9 9 6 4Humans could, but it's unclear whether we will 2 51 48 43 52 53
Humans could, but people aren't willing 3 22 29 27 23 20Humans can't reduce global warming 4 16 13 17 13 17
Global warming isn't happening 5 1 4 6 6
going to.4Item wording: Humans can't reduce global warming, even if it is happening.
n=2,125; 2 , p<0.001
1Item wording: Humans can reduce global warming, and we are going to do so successfully.2Item wording: Humans could reduce global warming, but it's unclear at this point whether we will do what's needed.3Item wording: Humans could reduce global warming, but people aren't willing to change their behavior, so we're not
38
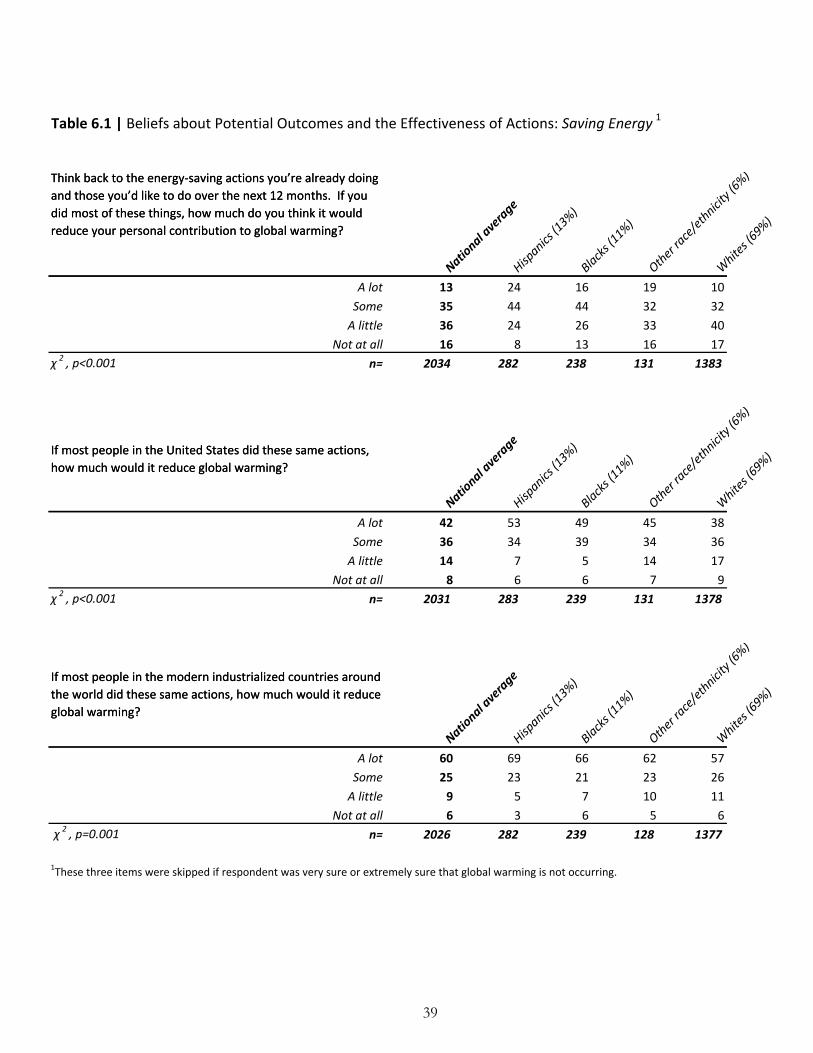
Table 6.1 | Beliefs about Potential Outcomes and the Effectiveness of Actions: Saving Energy 1
Think back to the energy saving actions you�’re already doingand those you�’d like to do over the next 12 months. If youdid most of these things, how much do you think it wouldreduce your personal contribution to global warming?
National average
Hispanics(13%)
Blacks (11%)
Other race/ethnicity(6%
)
Whites(69%)
Think back to the energy saving actions you�’re already doingand those you�’d like to do over the next 12 months. If youdid most of these things, how much do you think it wouldreduce your personal contribution to global warming?
A lot 13 24 16 19 10Some 35 44 44 32 32A little 36 24 26 33 40
Not at all 16 8 13 16 17n= 2034 282 238 131 1383
If most people in the United States did these same actions,how much would it reduce global warming?
2 , p<0.001
National average
Hispanics(13%)
Blacks (11%)
Other race/ethnicity(6%
)
Whites(69%)If most people in the United States did these same actions,
how much would it reduce global warming?
A lot 42 53 49 45 38Some 36 34 39 34 36A little 14 7 5 14 17
Not at all 8 6 6 7 9n= 2031 283 239 131 1378
If most people in the modern industrialized countries aroundthe world did these same actions, how much would it reduceglobal warming?
2 , p<0.001
National average
Hispanics(13%)
Blacks (11%)
Other race/ethnicity(6%
)
Whites(69%)
If most people in the modern industrialized countries aroundthe world did these same actions, how much would it reduceglobal warming?
A lot 60 69 66 62 57Some 25 23 21 23 26A little 9 5 7 10 11
Not at all 6 3 6 5 6n= 2026 282 239 128 13772 , p=0.001
1These three items were skipped if respondent was very sure or extremely sure that global warming is not occurring.
39

Table 7.0 |National Issue Priorities1
Here are some issues now being discussed in Washington,D.C. Do you think each of these issues should be a low,medium, high, or very high priority for the next presidentand Congress?
National average
Hispanics(13%)
Blacks (11%)
Other race/ethnicity(6%
)
Whites(69%)
Here are some issues now being discussed in Washington,D.C. Do you think each of these issues should be a low,medium, high, or very high priority for the next presidentand Congress?
The economyVery High 76 80 84 79 73
High 20 13 14 17 22Medium 3 5 2 4 3
Low 1 2 0 0 1
Very High 49 47 58 55 47High 37 38 33 28 39
Medium 13 12 8 16 14Low 1 2 0 1 1
Very High 45 40 57 65 42High 39 40 33 23 41
Medium 13 14 9 6 15Low 3 7 1 5 3
n=2,149; 2 , p<0.001
Very High 20 27 26 31 17High 33 39 40 27 31
Medium 30 29 30 30 30Low 17 6 4 12 21
n=2,140; 2 , p<0.001
n=2,148; 2 , p<0.001
The wars in Iraq and Afghanistan
Global warming
1Included here are the top three priorities by national average and global warming, ranked tenth. Other items on the list of 11 includehealth care, social security, terrorism, education, tax cuts, illegal immigration and abortion.
The economy
n=2,152; 2 , p<0.001
The federal budget deficit
40

Table 8.0 |Environmental Issue Priorities
Here are some environmental issues now being discussedin Washington, D.C. Do you think each of these issuesshould be a low, medium, high, or very high priority for thenext president and Congress?
National average
Hispanics(13%)
Blacks (11%)
Other race/ethnicity(6%
)
Whites(69%)
Here are some environmental issues now being discussedin Washington, D.C. Do you think each of these issuesshould be a low, medium, high, or very high priority for thenext president and Congress?
Water pollutionVery High 30 37 43 41 25
High 42 40 40 35 43Medium 24 21 16 20 26
Low 5 2 2 4 6
Very High 26 32 35 38 23High 39 41 39 36 39
Medium 28 23 26 23 30Low 6 4 0 3 8
Very High 24 33 34 35 20High 40 39 38 37 40
Medium 30 24 28 23 32Low 6 4 0 6 7
Very High 25 37 27 38 21High 32 36 41 27 31
Medium 31 21 29 22 34Low 12 6 3 12 14
Very High 27 40 33 41 22High 30 33 36 27 29
Medium 28 20 28 21 30Low 16 7 3 11 20
Toxic waste
Water pollution
n=2,148; 2 , p<0.001
n=2,142; 2 , p<0.001
n=2,145; 2 , p<0.001
Air pollution
n=2,149; 2 , p<0.001
Damage to the Earth's ozone layer
n=2,149; 2 , p<0.001
Global warming
41

Table 8.0 continued |Environmental Issue Priorities
Here are some environmental issues now being discussedin Washington, D.C. Do you think each of these issuesshould be a low, medium, high, or very high priority for thenext president and Congress?
National average
Hispanics(13%)
Blacks (11%)
Other race/ethnicity(6%
)
Whites(69%)
Here are some environmental issues now being discussedin Washington, D.C. Do you think each of these issuesshould be a low, medium, high, or very high priority for thenext president and Congress?
Loss of tropical rainforestsVery High 21 32 17 25 19
High 33 39 35 23 33Medium 32 16 38 37 34
Low 14 13 10 14 14
Very High 19 29 21 24 16High 29 32 28 32 28
Medium 36 26 40 26 38Low 17 13 10 18 18
Very High 13 21 13 17 11High 31 34 41 31 28
Medium 40 31 37 36 42Low 16 14 9 16 18
n=2,132; 2 , p<0.001
Very High 14 22 10 20 12High 27 30 29 22 27
Medium 41 28 46 36 43Low 18 19 15 21 17
n=2,142; 2 , p<0.001
n=2,144; 2 , p<0.001
Acid rain
Urban sprawl and loss of open spaces
Loss of tropical rainforests
n=2,149; 2 , p<0.001
Extinction of plant and animal species
42

Table 9.0 |Support for National Response: Conditions for Action
People disagree whether the United States should reducegreenhouse gas emissions on its own, or make reductionsonly if other countries do too. Which of the followingstatements comes closest to your own point of view? TheUnited States should reduce its greenhouse gasemissions�…
National average
Hispanics(13%)
Blacks (11%)
Other race/ethnicity(6%
)
Whites(69%)
People disagree whether the United States should reducegreenhouse gas emissions on its own, or make reductionsonly if other countries do too. Which of the followingstatements comes closest to your own point of view? TheUnited States should reduce its greenhouse gasemissions�…
Regardless of what other countries do 67 63 65 61 69Only if other industrialized countries do 1 2 2 1 9 2
Only if other industrialized and developing countries do 2 7 7 4 8 8The US should not reduce its emissions 4 4 0 5 4
Don't know 19 24 30 18 17n=2,146; 2 , p<0.001
Table 9.1 |Support for National Response:Magnitude of Action
1Item wording: Only if other industrialized countries (such as England, Germany and Japan) reduce their emissions.2Item wording: Only if other industrialized countries and developing countries (such as China, India and Brazil) reduce theiremissions.
How big of an effort should the United States make toreduce global warming?
National average
Hispanics(13%)
Blacks (11%)
Other race/ethnicity(6%
)
Whites(69%)
A large scale effort, even if it has large economic costs 34 41 43 37 31A medium scale effort, even if moderate economic cost 1 40 38 41 45 40A small scale effort, even if it has small economic costs 17 13 9 8 19
No effort 9 9 6 11 10n=2,099; 2 , p<0.001
1Item wording: A medium scale effort, even if it has moderate economic costs.
43

Table 9.2 |Support for National Response: Specific Climate and Energy Policies
How much do you support or oppose thefollowing policies?
National average
Hispanics(13%)
Blacks (11%)
Other race/ethnicity(6%
)
Whites(69%)How much do you support or oppose the
following policies?
Fund more research into renewable energy sources, such as solar and wind power.Strongly support 53 54 39 59 55
Somewhat support 38 31 56 35 37Somewhat oppose 6 13 3 4 6Strongly oppose 2 2 3 3 2
n=2,062; 2 , p<0.001
Provide tax rebates for people who purchase energy efficient vehicles or solar panels.Strongly support 38 40 31 46 38
Somewhat support 47 43 51 41 47Somewhat oppose 11 14 13 8 10Strongly oppose 4 3 5 5 5
n=2,073; 2 , p=0.096
Regulate carbon dioxide (the primary greenhouse gas) as a pollutant.
Strongly support 30 40 27 31 28Somewhat support 50 42 62 45 50Somewhat oppose 13 11 8 10 15Strongly oppose 7 7 3 14 7
n=2,055; 2 , p<0.001
Require automakers to increase the fuel efficiency of cars, trucks, and SUVS, to 45 mpg, even if it meansa new vehicle will cost up to $1,000 more to buy.
Strongly support 41 38 34 53 42Somewhat support 38 41 41 32 38Somewhat oppose 13 14 11 7 13Strongly oppose 8 7 14 8 7
n=2,067; 2 , p<0.001
Expand offshore drilling for oil and natural gas off the U.S. coast.Strongly support 37 35 24 32 40
44

Table 9.2 continued |Support for National Response: Specific Climate and Energy Policies
How much do you support or oppose thefollowing policies?
National average
Hispanics(13%)
Blacks (11%)
Other race/ethnicity(6%
)
Whites(69%)How much do you support or oppose the
following policies?
Require electric utilities to produce at least 20% of their electricity from wind, solar, or other renewableenergy sources, even if it cost the average household an extra $100 a year.
Strongly support 31 31 24 36 31Somewhat support 41 42 44 32 41Somewhat oppose 17 16 19 20 17Strongly oppose 11 11 13 12 11
n=2,058; 2 , p<0.338
Provide a government subsidy to replace old water heaters, air conditioners, light bulbs, and insulation.This subsidy would cost the average household $5 a month in higher taxes. Those who took advantage ofthe program would save money on their utility bills.
Strongly support 27 39 30 28 25Somewhat support 45 46 53 48 43Somewhat oppose 15 7 15 8 18Strongly oppose 12 8 3 16 15
n=2,068; 2 , p<0.001
by the year 2050.Strongly support 24 34 19 33 23
Somewhat support 44 43 56 43 42Somewhat oppose 19 14 22 9 20Strongly oppose 13 9 3 16 15
n=2,040; 2 , p<0.001
Build more nuclear power plants.Strongly support 23 21 14 22 25
Somewhat support 38 27 35 34 40Somewhat oppose 24 29 27 27 23Strongly oppose 15 23 24 17 11
n=2,043; 2 , p<0.001
Sign an international treaty that requires the United States to cut its emissions of carbon dioxide 90%
45

Table 9.2 continued |Support for National Response: Specific Climate and Energy Policies
How much do you support or oppose thefollowing policies?
National average
Hispanics(13%)
Blacks (11%)
Other race/ethnicity(6%
)
Whites(69%)How much do you support or oppose the
following policies?
Establish a special fund to help make buildings more energy efficient and teach Americans how to reduce theirenergy use. This would add a $2.50 surcharge to the average household�’s monthly electric bill.
Strongly support 20 30 19 26 17Somewhat support 43 42 61 43 41Somewhat oppose 21 19 12 13 24Strongly oppose 16 9 8 18 18
n=2,064; 2 , p<0.001
Drill for oil in the Arctic National Wildlife Refuge.Strongly support 25 17 6 21 29
Somewhat support 32 32 41 31 31Somewhat oppose 22 25 29 22 20Strongly oppose 22 26 24 25 20
n=2,051; 2 , p<0.001
Create a new national market that allows companies to buy and sell the right to emit the greenhouse
company would then purchase the right to emit a portion of this total amount. If a company then emittedmore than its portion, it would have to buy more emission rights from other companies or pay large fines.
Strongly support 11 17 12 18 10Somewhat support 42 53 42 42 40Somewhat oppose 24 15 30 19 25Strongly oppose 23 15 16 22 25
n=2,019; 2 , p<0.001
Increase taxes on gasoline by 25 cents per gallon and return the revenues to taxpayers by reducingthe federal income tax.
Strongly support 9 12 8 14 8Somewhat support 24 24 35 23 22Somewhat oppose 30 34 29 24 30Strongly oppose 37 29 27 39 39
n=2,062; 2 , p<0.001
gases said to cause global warming. The federal government would set a national cap on emissions. Each
46

Table 10.0 |Expectations of Elected Officials, Corporations and Citizens
Do you think the following should be doing moreor less to address global warming?
National average
Hispanics(13%)
Blacks (11%)
Other race/ethnicity(6%
)
Whites(69%)Do you think the following should be doing more
or less to address global warming?
Corporations and industryMuch more 41 41 38 50 40
More 32 29 39 25 31Currently Doing the Right Amount 17 19 18 14 17
Less 5 7 3 3 5Much Less 6 5 2 8 6
n=2,090; 2 , p=0.012
Citizens themselvesMuch more 29 28 28 38 29
More 41 43 45 36 41Currently Doing the Right Amount 20 17 25 18 20
Less 5 8 1 4 5Much Less 5 4 1 4 5
n=2,089; 2 , p=0.001
The U.S. CongressMuch more 26 25 26 37 25
More 41 43 50 34 40Currently Doing the Right Amount 20 19 19 17 21
Less 6 7 2 9 6Much Less 7 6 3 4 8
n=2,088; 2 , p=0.001
The PresidentMuch more 28 27 31 37 27
More 38 42 42 30 38Currently Doing the Right Amount 21 20 20 19 22
Less 6 5 2 10 6Much Less 7 6 5 4 8
n=2,089; 2 , p=0.011
47

Table 10.0 continued |Expectations of Elected Officials, Corporations and Citizens
National average
Hispanics(13%)
Blacks (11%)
Other race/ethnicity(6%
)
Whites(69%)
Your state legislatorsMuch more 16 19 16 23 14
More 47 47 52 44 46Currently Doing the Right Amount 25 22 26 19 26
Less 6 8 3 10 6Much Less 6 4 2 4 7
n=2,097; 2 , p=0.002
Your GovernorMuch more 16 22 17 25 14
More 46 43 54 41 46Currently Doing the Right Amount 26 24 25 20 27
Less 6 5 2 10 6Much Less 6 5 3 4 7
n=2,097; 2 , p<0.001
Your local government officialsMuch more 13 18 16 21 11
More 45 43 51 42 45Currently Doing the Right Amount 29 23 25 27 31
Less 7 9 6 5 6Much Less 6 7 2 4 7
n=2,103; 2 , p<0.001
48

Table 11.0 |Political Activism: Actions
Over the past 12 months, how many times have youdone each of the following?
National average
Hispanics(13%)
Blacks (11%)
Other race/ethnicity(6%
)
Whites(69%)Over the past 12 months, how many times have you
done each of the following?
Written letters, email, or phone government officials to urge them to take action to reduce global warmingMany times (6+) 1 1 2 0 0
Several times(4 5) 1 0 4 4 1A few times(2 3) 3 3 2 4 3
Once 3 4 3 7 3Never 89 88 87 80 91
Don't Know 2 4 3 7 2n=2,131; 2 , p<0.001
Attended a community meeting or rally about global warmingMany times (6+) 0 0 0 1 0
Several times(4 5) 1 2 0 0 1A few times(2 3) 2 0 5 2 2
Once 3 3 2 2 3Never 92 91 91 88 93
Don't Know 2 4 1 7 1n=2,125; 2 , p<0.001
Volunteered with or donated money to an organization working to reduce global warmingMany times (6+) 1 0 0 1 1
Several times(4 5) 1 1 0 1 1A few times(2 3) 4 3 6 1 5
Once 7 4 11 9 7Never 84 88 78 81 85
Don't Know 3 4 5 7 2n=2,116; 2 , p<0.001
49

Table 11.1 |Political Activism: Intentions
Over the next 12 months, would you like to do eachof the following �…
National average
Hispanics(13%)
Blacks (11%)
Other race/ethnicity(6%
)
Whites(69%)Over the next 12 months, would you like to do each
of the following �…
Write letters, email, or phone government officials to urge them to take action to reduce global warmingMore frequently 13 16 16 11 11About the same 71 60 63 67 74Less frequently 17 23 21 22 15
n=2,077; 2 , p<0.001
Attend a community meeting or rally about global warmingMore frequently 15 22 20 14 12About the same 69 56 60 64 73Less frequently 17 22 20 23 15
n=2,080; 2 , p<0.001
Volunteer with or donated money to an organization working to reduce global warmingMore frequently 16 21 23 14 14About the same 68 58 62 66 70Less frequently 16 21 16 20 15
n=2,076; 2 , p<0.001
Table 11.2 |Political Activism: Confidence in Own Ability to Act 1
How confident are you that you can do these thingsmore frequently over the next 12 months?
National average
Hispanics(13%)
Blacks (11%)
Other race/ethnicity(6%
)
Whites(69%)How confident are you that you can do these things
more frequently over the next 12 months?
Write letters, email, or phone government officials to urge them to take action to reduce global warmingCompletely confident 14 16 14 13 13Moderately confident 39 28 46 67 38
Little bit confident 36 51 32 20 34Not at all confident 11 5 8 0 14
2 , p=0.110 n= 261 43 37 15 166
1Only asked of those who responded to an earlier item that they would like to do more of this within the next 12 months.
50

Table 11.2 continued |Political Activism: Confidence in Own Ability to Act
How confident are you that you can do these thingsmore frequently over the next 12 months?
National average
Hispanics(13%)
Blacks (11%)
Other race/ethnicity(6%
)
Whites(69%)How confident are you that you can do these things
more frequently over the next 12 months?
Attend a community meeting or rally about global warmingCompletely confident 8 5 13 6 7Moderately confident 34 34 49 44 29
Little bit confident 47 57 36 28 48Not at all confident 12 3 2 22 16
2 , p=0.008 n= 301 58 45 18 180
Volunteer with or donated money to an organization working to reduce global warmingCompletely confident 10 6 6 15 11Moderately confident 33 36 48 45 27
Little bit confident 49 55 42 40 51Not at all confident 8 4 4 0 11
2 , p=0.051 n= 334 53 52 20 209
Table 11.3 |Political Activism: Perceived Effectiveness of Own Action
If you were to do each of the following, howeffective would it be in getting government officialsto take action to reduce global warming?
National average
Hispanics(13%)
Blacks (11%)
Other race/ethnicity(6%
)
Whites(69%)
If you were to do each of the following, howeffective would it be in getting government officialsto take action to reduce global warming?
Write letters, email, or phone government officials to urge them to take action to reduce global warmingHighly effective 2 4 5 1 1Pretty effective 13 21 15 18 10A little effect 42 28 34 40 45
No effect 28 31 21 25 29Don't know 16 16 24 16 14
2 , p<0.001 n=2,099
Attend a community meeting or rally about global warmingHighly effective 2 2 6 2 1Pretty effective 12 22 17 19 9A little effect 38 29 36 30 41
No effect 33 31 21 33 35Don't know 15 16 20 16 14
2 , p<0.001 n=2,094
51
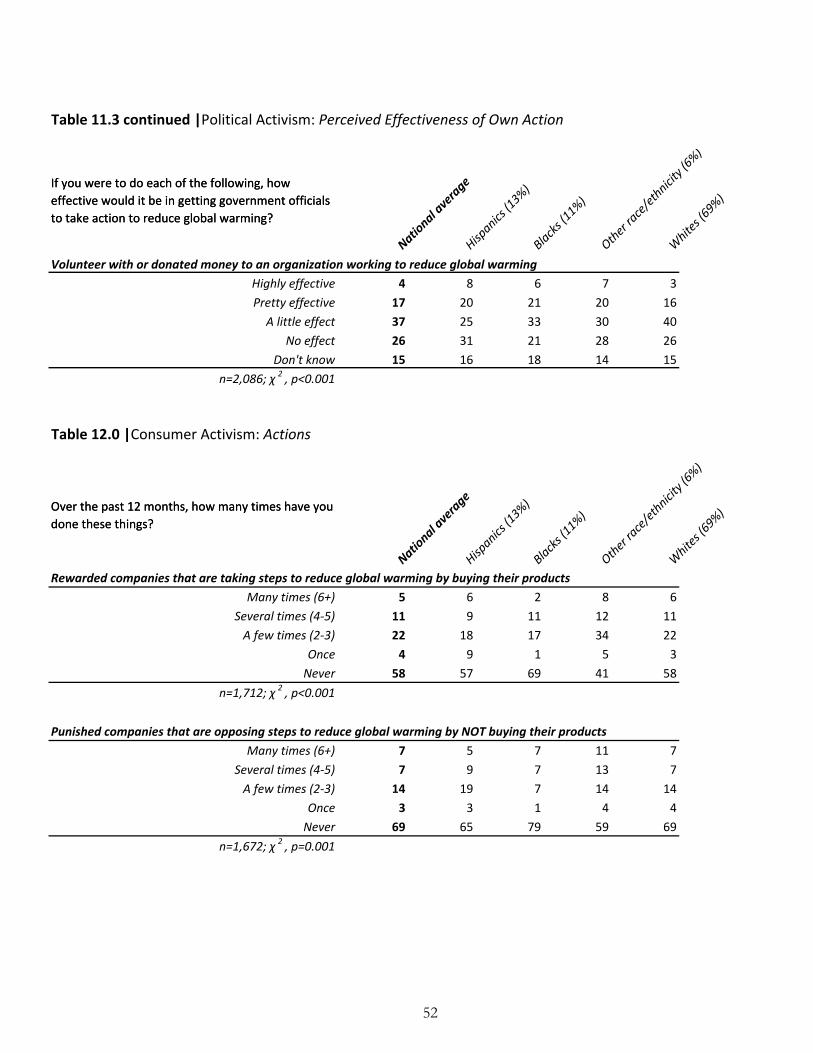
Table 11.3 continued |Political Activism: Perceived Effectiveness of Own Action
If you were to do each of the following, howeffective would it be in getting government officialsto take action to reduce global warming?
National average
Hispanics(13%)
Blacks (11%)
Other race/ethnicity(6%
)
Whites(69%)
If you were to do each of the following, howeffective would it be in getting government officialsto take action to reduce global warming?
Volunteer with or donated money to an organization working to reduce global warmingHighly effective 4 8 6 7 3Pretty effective 17 20 21 20 16A little effect 37 25 33 30 40
No effect 26 31 21 28 26Don't know 15 16 18 14 15
n=2,086; 2 , p<0.001
Table 12.0 |Consumer Activism: Actions
Over the past 12 months, how many times have youdone these things?
National average
Hispanics(13%)
Blacks (11%)
Other race/ethnicity(6%
)
Whites(69%)Over the past 12 months, how many times have you
done these things?
Rewarded companies that are taking steps to reduce global warming by buying their productsMany times (6+) 5 6 2 8 6
Several times (4 5) 11 9 11 12 11A few times (2 3) 22 18 17 34 22
Once 4 9 1 5 3Never 58 57 69 41 58
n=1,712; 2 , p<0.001
Punished companies that are opposing steps to reduce global warming by NOT buying their productsMany times (6+) 7 5 7 11 7
Several times (4 5) 7 9 7 13 7A few times (2 3) 14 19 7 14 14
Once 3 3 1 4 4Never 69 65 79 59 69
n=1,672; 2 , p=0.001
52

Table 12.1 |Consumer Activism: Intentions
Over the next 12 months �…
National average
Hispanics(13%)
Blacks (11%)
Other race/ethnicity(6%
)
Whites(69%)Over the next 12 months �…
�… would you like to punish companies that are opposing steps to reduce global warming by NOT buying their products �…More frequently than you are now 40 47 35 45 39
About the same as you are now 53 49 56 51 54Less frequently than you are now 7 5 9 5 7
n=2,108; 2 , p=0.063
... do you intend to buy the products of companies that are taking steps to reduce global warming �…More frequently than you are now 40 44 46 41 38
About the same as you are now 56 49 45 57 59Less frequently than you are now 4 7 9 1 3
n=2,102; 2 , p<0.001
53

Table 13.0 | Energy Efficiency Actions and Intentions
The next questions ask about what energy relatedactions you would like to do. Which of the followingbest describes what you are likely to do over the next 12
months?1
National average
Hispanics(13%)
Blacks (11%)
Other race/ethnicity(6%
)
Whites(69%)
The next questions ask about what energy relatedactions you would like to do. Which of the followingbest describes what you are likely to do over the next 12
months?1
Install new insulation in your atticAlready have done this 55 35 40 47 62
Would like to do this and probably will 5 12 7 1 4Would like to do this but probably won't 9 8 8 15 9
No intention to do this 3 3 4 3 2Not applicable 28 42 42 33 23
Caulk and weather strip your home to reduce draftsAlready have done this 64 44 55 54 70
Would like to do this and probably will 13 21 23 15 9Would like to do this but probably won't 11 9 6 10 12
No intention to do this 4 8 4 6 3Not applicable 8 17 13 15 5
n=1,957; 2 , p<0.001
Purchase an energy efficient home furnaceAlready have done this 50 38 44 47 53
Would like to do this and probably will 5 11 6 5 4Would like to do this but probably won't 21 24 18 14 21
No intention to do this 8 7 11 5 8Not applicable 16 20 21 29 13
n=1,887; 2 , p<0.001
Purchase an energy efficient home air conditionerAlready have done this 52 47 53 48 53
Would like to do this and probably will 5 11 15 5 3Would like to do this but probably won't 17 18 9 14 18
No intention to do this 6 5 9 8 6Not applicable 20 19 14 25 20
n=1,953; 2 , p<0.001
1Response categories were created by combining questions that first asked respondents which energy efficiency improvements theyhad made followed by questions on their intentions over the coming year if they had not yet made the improvement.
n=2,035; 2 , p<0.001
54

Table 13.0 continued | Energy Efficiency Actions and Intentions
The next questions ask about what energy related actionsyou would like to do. Which of the following best describeswhat you are likely to do over the next 12 months?
National average
Hispanics(13%)
Blacks (11%)
Other race/ethnicity(6%
)
Whites(69%)
The next questions ask about what energy related actionsyou would like to do. Which of the following best describeswhat you are likely to do over the next 12 months?
Purchase an energy efficient home water heaterAlready have done this 58 50 62 56 59
Would like to do this and probably will 7 14 8 9 6Would like to do this but probably won't 20 20 13 18 21
No intention to do this 8 5 9 6 8Not applicable 7 11 8 11 6
n=1,865; 2 , p<0.001
Change most of the light bulbs in your home to high energy efficiency compact fluorescents (CFLs)Already have done this 45 53 36 57 45
Would like to do this and probably will 28 33 39 24 25Would like to do this but probably won't 16 9 18 10 18
No intention to do this 11 6 6 9 13n=1,891; 2 , p<0.001
Purchase a car that averages 30 miles per gallon or more.Already have done this 21 14 20 20 22
Would like to do this and probably will 20 35 17 24 18Would like to do this but probably won't 41 35 38 34 43
No intention to do this 15 11 19 20 14Don't drive 3 6 6 2 3
n=1,879; 2 , p<0.001
55

Table 14.0 |Barriers to Home Energy Efficiency Improvements
The following items are the actions that you said you wouldlike to take over the next 12 months, but probably won�’t.Please help us understand why. Check all the reasons that
apply.1
National average
Hispanics(13%)
Blacks (11%)
Other race/ethnicity(6%
)
Whites(69%)
The following items are the actions that you said you wouldlike to take over the next 12 months, but probably won�’t.Please help us understand why. Check all the reasons that
apply.1
Install new insulation in your attic.I can't afford it * 56 62 24 67 58I rent my home 22 19 18 33 21
I don't know how 19 29 12 33 15It's too much effort * 6 0 6 19 5
I'm too busy * 9 0 35 19 6I don't want to spend the money 2 4 0 0 0 7
Someone else in my home would object 1 0 0 0 1* 2 statistically significant, p<0.050 n= 182 21 17 123 21
Caulk and weather strip your home to reduce drafts.I can't afford it 38 43 9 38 39
I rent my home * 27 25 83 15 24I don't know how 22 17 9 23 23
It's too much effort 18 13 18 43 17I'm too busy 17 4 0 23 19
I don't want to spend the money 2 5 4 0 0 5Someone else in my home would object * 2 13 0 0 1
* 2 statistically significant, p<0.050 n= 218 23 11 170 13
Purchase an energy efficient home furnace.I can�’t afford it * 56 53 34 47 59
I don�’t need a new one yet * 28 14 24 44 30I rent my home 22 27 29 6 21
I don't want to spend the money 2 5 4 0 6 6I�’m too busy * 3 10 11 6 1
Someone else in my house would object * 2 4 6 0 1It�’s too much effort 1 0 0 0 1
* 2 statistically significant, p<0.050 n= 394 51 34 290 18
2Item wording: I could afford it, but don't want to spend the money.
1Respondents were asked these questions if: (1) they had not made an energy efficiency improvement; and (2) they would like to makethe improvement but probably won't.
56

Table 14.0 continued |Barriers to Home Energy Efficiency Improvements
The following items are the actions that you said you wouldlike to take over the next 12 months, but probably won�’t.Please help us understand why. Check all the reasons thatapply.
National average
Hispanics(13%)
Blacks (11%)
Other race/ethnicity(6%
)
Whites(69%)
The following items are the actions that you said you wouldlike to take over the next 12 months, but probably won�’t.Please help us understand why. Check all the reasons thatapply.
Purchase an energy efficient home air conditioner.I can�’t afford it 64 72 47 67 63
I don�’t need a new one yet * 32 13 53 22 35I rent my home 19 24 24 6 19I don't need one 8 9 0 5 9
I don't want to spend the money 2 5 0 6 6 6I�’m too busy 3 0 0 6 4
It�’s too much effort 2 0 0 0 3Someone else in my house would object 1 0 0 0 1
* 2 statistically significant, p<0.050 n= 331 46 17 250 18
Purchase an energy efficient home water heater.I can't afford it 54 59 50 52 54
I don't need a new one yet 36 30 36 22 38I rent my home 22 27 29 26 20
I don't want to spend the money 2 4 2 4 0 5I'm too busy 3 0 0 5 3
It's too much effort 2 0 0 0 3Someone else in my house would object 0 0 0 0 0
* 2 statistically significant, p<0.050 n= 365 44 24 274 23
Change most of the light bulbs in your home to high energy efficiency compact fluorescents (CFLs)I can't afford it 33 30 45 33 32
They are too expensive 29 35 34 27 27I rent my home 13 25 13 0 12I don't like them 13 20 13 9 13
I don't want to spend the money 2 11 5 11 0 13I'm too busy 5 5 0 0 6
Someone else in my house would object * 4 15 0 18 3It's too much effort 3 0 0 0 4
* 2 statistically significant, p<0.050 n= 305 20 38 236 11
57

Table 14.0 continued |Barriers to Home Energy Efficiency Improvements
The following items are the actions that you said you wouldlike to take over the next 12 months, but probably won�’t.Please help us understand why. Check all the reasons thatapply.
National average
Hispanics(13%)
Blacks (11%)
Other race/ethnicity(6%
)
Whites(69%)
Please help us understand why you would like to purchase a car that averages 30 miles per gallon or more,but probably won�’t. Check all the reasons that apply.
The following items are the actions that you said you wouldlike to take over the next 12 months, but probably won�’t.Please help us understand why. Check all the reasons thatapply.
I can't afford to * 47 50 57 46 45I don't need a new car * 45 39 31 41 49
I already drive a fuel efficient car 22 16 20 22 24They're too small 18 14 13 20 19They're not safe * 8 17 5 7 8
They're not powerful enough * 8 2 4 15 8Someone else in my home would object * 1 2 3 1 1
* 2 statistically significant, p<0.050 n= 1773 204 204 1254 111
Table 15.0 | Energy Conservation Actions
Please help us understand why you would like to purchase a car that averages 30 miles per gallon or more,but probably won�’t. Check all the reasons that apply.
How often do you do the following things?
National average
Hispanics(13%)
Blacks (11%)
Other race/ethnicity(6%
)
Whites(69%)How often do you do the following things?
Turn off the lights when they are not needed
Always 63 70 63 63 62Often 31 25 27 33 32
Sometimes 4 3 5 4 5Rarely 1 1 3 0 1Never 1 1 2 1 1
n=2,146; 2 , p=0.001
Always 42 46 30 39 43Often 27 23 28 24 27
Sometimes 17 21 25 22 15Rarely 9 8 8 9 9Never 6 2 9 6 6
n=1,957; 2 , p<0.001
Set the thermostat in winter to 68 degrees or cooler
Turn off the lights when they are not needed
58
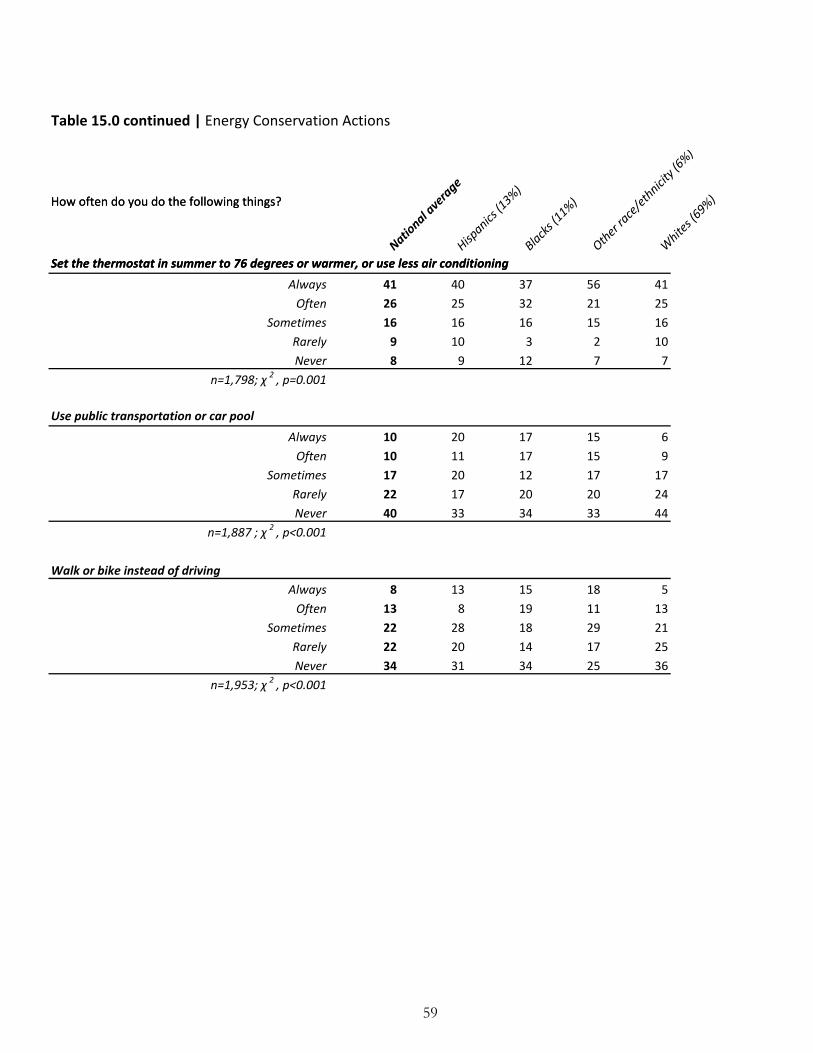
Table 15.0 continued | Energy Conservation Actions
How often do you do the following things?
National average
Hispanics(13%)
Blacks (11%)
Other race/ethnicity(6%
)
Whites(69%)How often do you do the following things?
Set the thermostat in summer to 76 degrees or warmer, or use less air conditioning
Always 41 40 37 56 41Often 26 25 32 21 25
Sometimes 16 16 16 15 16Rarely 9 10 3 2 10Never 8 9 12 7 7
n=1,798; 2 , p=0.001
Always 10 20 17 15 6Often 10 11 17 15 9
Sometimes 17 20 12 17 17Rarely 22 17 20 20 24Never 40 33 34 33 44
n=1,887 ; 2 , p<0.001
Walk or bike instead of drivingAlways 8 13 15 18 5Often 13 8 19 11 13
Sometimes 22 28 18 29 21Rarely 22 20 14 17 25Never 34 31 34 25 36
n=1,953; 2 , p<0.001
Set the thermostat in summer to 76 degrees or warmer, or use less air conditioning
Use public transportation or car pool
59

Table 16.0 |Barriers to Public Transportation
The following are the actions that you said you intend to doless frequently or about the same over the next 12 months.Please help us understand why. Check all the reasons thatapply.
National average
Hispanics(13%)
Blacks (11%)
Other race/ethnicity(6%
)
Whites(69%)
The following are the actions that you said you intend to doless frequently or about the same over the next 12 months.Please help us understand why. Check all the reasons thatapply.
Use public transportation or car poolI don't have the option * 35 20 19 30 41
They are not available in my area * 34 18 18 35 38It's too inconvenient 27 24 29 27 27
I'm already doing this as much as I can * 17 23 28 26 14I like to commute by myself * 16 16 27 10 14
I already drive a fuel efficient vehicle 16 13 13 14 18It's physically too uncomfortable 8 11 10 9 7
I wouldn't feel safe * 7 11 5 7 6It's too much effort 7 10 7 6 7I can't afford to * 3 7 3 2 2
I don't think it's important * 3 5 2 0 3I'm too busy 3 3 6 5 3
Someone else in my home would object * 1 3 5 4 0I don't want to spend the money 2 1 2 2 0 0
* 2 statistically significant, p<0.050 n= 1772 213 189 1265 104
Table 17.0 | Perceived Lifestyle Impacts from Personal Actions on Global Warming
If you were to change your lifestyle to reduce your personalcontribution to global warming, how do you think it wouldit affect your quality of life?
2Item wording: I could afford it, but don't want to spend the money.
National average
Hispanics(13%)
Blacks (11%)
Other race/ethnicity(6%
)
Whites(69%)
If you were to change your lifestyle to reduce your personalcontribution to global warming, how do you think it wouldit affect your quality of life?
Improve my quality of life a lot 12 24 20 15 8Improve my quality of life a little 19 15 25 18 19
Have no impact on my quality of life 32 28 19 37 34Decrease my quality of life a little 9 5 3 10 11Decrease my quality of life a lot 3 1 3 5 3
I don't know 25 27 31 15 25n=2,146; 2 , p<0.001
60

Table 18.0 |Interpersonal Communication
How often do you discuss global warming with your familyand friends?
National average
Hispanics(13%)
Blacks (11%)
Other race/ethnicity(6%
)
Whites(69%)How often do you discuss global warming with your family
and friends?
Very often 5 8 2 8 4Occasionally 36 36 28 46 36
Rarely 33 35 25 29 35Never 27 21 45 17 26
n=2,151; 2 , p<0.001
Table 19.0 |Political Affiliation and Ideology
Generally speaking, do you think of yourself as a ...
National average
Hispanics(13%)
Blacks (11%)
Other race/ethnicity(6%
)
Whites(69%)Generally speaking, do you think of yourself as a ...
Democrat 39 45 78 35 31Republican 27 18 5 23 33
Independent 21 12 13 31 23Other 13 25 4 12 13
n=2,151; 2 , p<0.001
How important will a candidate�’s views on global warmingbe in determining your vote for President this year? Will itbe the single most important issue, one of severalimportant issues, or not important in determining yourvote?
National average
Hispanics(13%)
Blacks (11%)
Other race/ethnicity(6%
)
Whites(69%)
The single most important issue
How important will a candidate�’s views on global warmingbe in determining your vote for President this year? Will itbe the single most important issue, one of severalimportant issues, or not important in determining yourvote?
2 8 5 0 1One of several important issues 60 68 68 69 57
Not an important issue 37 24 27 31 42
n=2,133; 2 , p<0.001
The single most important issue
61

Table 20.0 |Environmental Beliefs and Concerns: Identification as Environmentalist
"I consider myself an environmentalist."
National average
Hispanics(13%)
Blacks (11%)
Other race/ethnicity(6%
)
Whites(69%)"I consider myself an environmentalist."
Strongly Agree 7 5 2 9 9
Somewhat Agree 49 55 47 55 48
Somewhat Disagree 32 30 36 26 32
Strongly Disagree 11 11 14 10 11
n=2,122; 2 , p=0.006
Table 20.1 |Environmental Beliefs and Concerns: Concern for Other Species, Humans, Self
How concerned are you about the impact ofglobal warming on �…. [Average scores on a scalefrom 1=not at all concerned to 7=extremelyconcerned.]
National average
Hispanics(13%)
Blacks (11%)
Other race/ethnicity(6%
)
Whites(69%)
How concerned are you about the impact ofglobal warming on �…. [Average scores on a scalefrom 1=not at all concerned to 7=extremelyconcerned.]
Concern for other speciesPlants 4.82 5.29 5.49 5.14 4.59
Marine life 4.83 5.29 5.44 4.90 4.65Animals 4.84 5.36 5.38 5.10 4.63
Birds 4.71 5.17 5.36 4.95 4.51n=2,125
All people 4.79 5.17 5.65 5.17 4.55All children 5.01 5.64 5.88 5.29 4.73
Your children 4.78 5.36 5.65 5.33 4.48People in the U.S. 4.67 5.00 5.73 4.90 4.42
n=2,128
Concern for oneselfYou 4.53 5.05 5.68 4.81 4.23
Your health 4.67 5.42 5.80 4.80 4.34Your lifestyle 4.03 4.61 4.93 4.23 3.77Your future 4.60 5.26 5.63 5.11 4.27
n=2,127
Concern for humans
62

Table 21.0 |Information Seeking and Attention
On some issues people feel that they have all theinformation they need in order to form a firm opinion,while on other issues they would like more informationbefore making up their mind. For global warming,where would you place yourself?
National average
Hispanics(13%)
Blacks (11%)
Other race/ethnicity(6%
)
Whites(69%)
On some issues people feel that they have all theinformation they need in order to form a firm opinion,while on other issues they would like more informationbefore making up their mind. For global warming,where would you place yourself?
I need a lot more information 30 36 49 35 26I need some more information 29 29 25 30 30I need a little more information 22 22 18 16 23
I do not need any more information 18 13 8 19 21n=2,132; 2 , p<0.001
How much attention do you pay to information aboutglobal warming?
National average
Hispanics(13%)
Blacks (11%)
Other race/ethnicity(6%
)
Whites(69%)How much attention do you pay to information about
global warming?
A lot 12 17 8 16 12Some 30 32 31 38 28A little 40 33 45 31 41None 18 18 16 15 19
n=2,123; 2 , p=0.005
How much attention do you pay to information aboutconserving energy?
National average
Hispanics(13%)
Blacks (11%)
Other race/ethnicity(6%
)
Whites(69%)How much attention do you pay to information about
conserving energy?
A lot 18 17 12 17 19Some 39 36 42 48 38A little 34 33 36 28 34None 10 14 10 7 9
n=2,119; 2 , p=0.044
63

Table 21.0 continued |Information Seeking
In the past 30 days, how much have you actively lookedfor information about global warming?
National average
Hispanics(13%)
Blacks (11%)
Other race/ethnicity(6%
)
Whites(69%)In the past 30 days, how much have you actively looked
for information about global warming?
A lot 2 4 1 3 1Some 12 20 13 14 11A little 23 27 22 34 21None 63 49 64 49 67
n=2,121; 2 , p<0.001
In the past 30 days, how much have you actively lookedfor information about conserving energy?
National average
Hispanics(13%)
Blacks (11%)
Other race/ethnicity(6%
)
Whites(69%)In the past 30 days, how much have you actively looked
for information about conserving energy?
A lot 5 6 5 7 4Some 18 19 20 17 17A little 30 34 22 40 30None 48 42 53 36 49
n=2,119; 2 , p=0.006
64

Table 22.0 |Trust in Information Sources
How much do you trust or distrust the following as a sourceof information about global warming?
National average
Hispanics(13%)
Blacks (11%)
Other race/ethnicity(6%
)
Whites(69%)How much do you trust or distrust the following as a source
of information about global warming?
ScientistsStrongly trust 28 33 28 44 26
Somewhat trust 54 55 55 38 55Somewhat distrust 14 7 13 14 16Strongly distrust 4 5 4 3 4
n=2,109; 2 , p<0.001
Family & friendsStrongly trust 13 20 7 10 13
Somewhat trust 64 58 67 68 64Somewhat distrust 19 18 19 17 19Strongly distrust 4 4 7 6 4
n=2,101; 2 , p=0.003
Environmental organizationsStrongly trust 17 28 23 25 14
Somewhat trust 49 50 62 40 47Somewhat distrust 20 12 13 20 23Strongly distrust 14 10 3 15 16
n=2,107; 2 , p<0.001
Television weather reportersStrongly trust 6 8 11 11 4
Somewhat trust 60 64 76 53 58Somewhat distrust 25 21 11 24 27Strongly distrust 10 7 3 11 11
n=2,114; 2 , p<0.001
Religious leadersStrongly trust 5 4 8 4 5
Somewhat trust 42 50 61 38 38Somewhat distrust 30 34 16 27 32Strongly distrust 22 13 14 31 24
n=2,107; 2 , p<0.001
65

Table 22.0 continued |Trust in Information Sources
How much do you trust or distrust the following as a sourceof information about global warming?
National average
Hispanics(13%)
Blacks (11%)
Other race/ethnicity(6%
)
Whites(69%)How much do you trust or distrust the following as a source
of information about global warming?
The mainstream news mediaStrongly trust 4 5 5 9 2
Somewhat trust 43 53 63 37 39Somewhat distrust 33 27 26 32 35Strongly distrust 20 15 6 22 23
n=2,126; 2 , p<0.001
CorporationsStrongly trust 1 1 2 0 1
Somewhat trust 18 31 34 17 13Somewhat distrust 49 42 47 39 51Strongly distrust 33 26 17 44 35
n=2,110; 2 , p<0.001
66

Table 23.0 | Frequency of Media Use
How many days per week do you read a printednewspaper?
National average
Hispanics(13%)
Blacks (11%)
Other race/ethnicity(6%
)
Whites(69%)
How many days per week do you read a printednewspaper?
3.61 3.22 3.23 3.74 3.73n=2,137
How many days per week do you typically read newsstories online?
National average
Hispanics(13%)
Blacks (11%)
Other race/ethnicity(6%
)
Whites(69%)How many days per week do you typically read news
stories online?
3.66 3.13 3.29 4.22 3.77n=2,138
In a typical week, approximately how many hours totaldo you spend listening to the radio? Type the number ofhours in the space provided below. (If you didn�’t listento the radio in the past week, type in �“0�”.)
National average
Hispanics(13%)
Blacks (11%)
Other race/ethnicity(6%
)
Whites(69%)
In a typical week, approximately how many hours totaldo you spend listening to the radio? Type the number ofhours in the space provided below. (If you didn�’t listento the radio in the past week, type in �“0�”.)
8.82 8.98 11.06 7.31 8.58n=2,123
What is the total number of hours of broadcast and cabletelevision you watch �… during a typical week? (Add upMonday through Friday)
National average
Hispanics(13%)
Blacks (11%)
Other race/ethnicity(6%
)
Whites(69%)
What is the total number of hours of broadcast and cabletelevision you watch �… during a typical week? (Add upMonday through Friday)
16.97 16.78 21.66 14.39 16.51n=2,116
67

Table 23.0 continued | Frequency of Media Use
What is the total number of hours of broadcast and cabletelevision you watch �… during a typical weekend? (Addup Saturday and Sunday)
National average
Hispanics(13%)
Blacks (11%)
Other race/ethnicity(6%
)
Whites(69%)
What is the total number of hours of broadcast and cabletelevision you watch �… during a typical weekend? (Addup Saturday and Sunday)
8.97 9.53 13.21 6.77 8.41n=2,086
In a typical week, how many hours do you spend usingthe Internet for personal reasons (not for work)? Writein the number of hours in the space provided below. (Ifyou didn�’t use the Internet in the past week, type "0.�”)
National average
Hispanics(13%)
Blacks (11%)
Other race/ethnicity(6%
)
Whites(69%)
In a typical week, how many hours do you spend usingthe Internet for personal reasons (not for work)? Writein the number of hours in the space provided below. (Ifyou didn�’t use the Internet in the past week, type "0.�”)
8.76 7.80 10.55 10.94 8.46n=2,114
68

Table 24.0 | Preferred News Sources
How closely do you follow news about each of thefollowing?
National average
Hispanics(13%)
Blacks (11%)
Other race/ethnicity(6%
)
Whites(69%)How closely do you follow news about each of the
following?
The local weather forecastVery closely 30 24 41 26 30
Somewhat closely 40 41 35 28 42A little 21 28 18 25 20
Not at all 8 7 6 21 7
n=2,125; 2 , p<0.001
HealthVery closely 10 9 18 12 9
Somewhat closely 33 29 43 20 33A little 44 49 34 48 45
Not at all 13 13 6 19 13
n=2,122; 2 , p<0.001
National politicsVery closely 21 13 23 17 22
Somewhat closely 32 25 31 29 33A little 33 32 36 35 33
Not at all 14 29 10 20 12
n=2,126; 2 , p<0.001
World affairsVery closely 12 8 15 14 12
Somewhat closely 34 34 28 37 35A little 40 38 45 31 40
Not at all 14 21 12 17 12
n=2,117; 2 , p<0.001
The environmentVery closely 7 7 7 9 6
Somewhat closely 28 28 27 25 28A little 49 48 52 46 49
Not at all 17 16 14 21 17
n=2,112; 2 , p=0.811
69

20
environment.yale.edu/climate climatechange.gmu.edu


![Vulnerable Populations Perceive Their Health as at …...Vulnerable Populations Perceive Their Health as at Risk from Climate Change Karen L. Akerlof 1 , ... respectively) [11]. Moreover,](https://img.dokumen.tips/doc/110x75/5f06019b7e708231d415d293/vulnerable-populations-perceive-their-health-as-at-vulnerable-populations-perceive.jpg)