Embed Size (px)
Citation preview

UNITED ST A TES DEPARTMENT OF THE INTERIOR
BUREAU OF RECLAMATION
STUDIES OF ORIFICES FOR AUTOMATIC SPILLW+.\Y GATE CONTROLS
Report No. HYD-596
HYDRAULICS BRANCH DIVISION OF RESEARCH
OFFICE OF CHIEF ENGINEER DENVER, COLORADO
SEPTEMBER 1969
--- -----------~~--------- .____,~---------------------------
Where approximate or nominal English units are used to express a value or range of values, the converted metric units in parentheses are also approximate or nominal. Where precise English units are used, the converted metric units are expressed as equally significant values. A table of conversion factors- BRITISH TO METRIC UNITS OF MEASUREMENT -is provided at the end of this report.
•
Report No. HYD-596
STUDIES OF ORIFICES FOR AUTOMATIC SPILLWAY GATE CONTROLS
by
D. L. King
September 1969
HYDRAULICS BRANCH DIVISION OF RESEARCH
UNITED STATES DEPARTMENT OF THE INTERIOR • BUREAU OF RECLAMATION
Office of Chief Engineer • Denver, Colorado

ACKNOWLEDGMENTS
The planning and initial laboratory tests for this study were performed by Mr. Wayne F. Arris. The study was made with the cooperation and assistance of the Mechanical Branch, Division of Design. Mr. W. E. Wagner, Head, Applied Hydraulics Section, supervised the study and reviewed this report. Mr. H. M. Martin is Chief of the Hydraulics Branch.

ABSTRACT
Design of orifice filling systems for automatic spillway gate controls requires 3-place discharge coefficients. Limited tests were made on orifices having various unusual approach and exit configurations. Where appropriate, reference is made to results of previous research, indicating that further tests were unnecessary. Effects of unusual geometry are generally negligible. Guidelines are presented for correction of coefficients when such effects should be considered.
HYD-596 King, D L STUDIES OF ORIFICES FOR AUTOMATIC SPILLWAY GATE CONTROLS. Bur Reclam Lab Rep HYD-596, Hydraul Br, Sept 1969. Bureau of Reclamation, Denver, 3 p, 7 fig, 1 tab, 3 ref
DESCRIPTORS-/ *orifices/ *spillway gates/ *automatic control/ hydraulic models/ design/ hydraulics/ *discharge coefficients/ spillways/ research and development/ design criteria/ hydraulic structures/ spillway gates/ orifice flow/ hydraulic design IDENTIFIERS-/ spillway gate controls
iii

CONTENTS
Abstract . . . . . . . . . . . . . . . . . . . . . . . . . .............. . Purpose . . . . . . . . . . . . . . . . . . . . . . . ............ . Conclusions . . . . . . . . . . . . . . . . . . . . ..... . Applications . . . . . . . . . . . . . . . . . . . . . . . ..... . Introduction . . . . . . . . . . . . . . . . . ..... . Test Apparatus . . . . . . . . . . . . . . . . . . . ..... . Investigation . . . . . . . . . . . . . . . . . . . . . . . ..... .
Orifice in a vertical plane . . . . . . . . . . . . . . . . . . . . Orifice in a horizontal plane . . . . . . . . . . . . ....... . Orifice in a vertical plane approached by two inverted 90°, 6-inch elbows .. Orifices in wall of pipe .............................. . Opposing orifices . . . . . . . . . . . . . . . . . . . . . . . . . . . . . . . . . . . . . . . . . Orifice discharging against a flat plate . . . . . . . _ . . . . . . . . . . . . . . . . . . . . . . . Orifice located eccentrically in pipe with obstruction .................... . Orifices in a vertical line .................................... .
Page
iii 1 1 1 1 2 2 2 2 2 2 3 3 3 3
Table
Discharge coefficients with and without correction for change in effective area . . . . . 1
Test rigs for determination of effect of upstream approach configuration ..... . Effect of upstream approach ............................... . Full scale model of filling system for Norton Dam spillway gate control Discharge coefficients for orifices in wall of 10-inch-diameter pipe ... Correlation of discharge coefficient with angle of side contraction,
orifices in wall of 10-inch-diameter pipe ........... . Area correction for orifices in wairof pipe ............ . Effect of opposing orifices . . . . . . . . . . . . . . . . . . . . . . . . . . . . . . . . .
V
Figure
1 2 3 4
5 6 7
PURPOSE
The purpose of this study was to determine .discharge coefficients for orifices in unusual geometric configurations, to aid in the design of orifice filling systems for automatic spillway gate controls.
CONCLUSIONS
Based on present tests:
1. Upstream approach configurations were found to have negligible effect on discharge coefficients. The coefficients were within 1 percent of those determined for ideal approach conditions.
2. Coefficients for orifices in the wall of a pipe are affected by the wall curvature. The jet contraction is modified and the effective orifice area is increased over that for a corresponding plane orifice. The data did not reveal how these effects should be separated.
3. Opposing 1.9-inch orifices in a 10-inch pipe had no effect on the discharge coefficient.
Based on theory and tests performed by others:
1. The coefficient for orifice flow against a flat plate is unaffected unless the plate is within approximately one-half orifice diameter from the plane of the orifice. This conclusion is based on theory.
2. According to previous work by another experimenter, upward adjustment of discharge coefficients of about 3 percent could be expected with eccentric placement of the orifice in a pipe. The results were obtained with one edge of the orifice coincident with the pipe wall and with d/D ratios less than approximately 0.5.
3. The results of the present tests on unusual approach conditions and previous tests with eccentric orifice placement indicate that a cylindrical obstruction °in the approach pipe would have a negligible effect on the orifice discharge coefficient.
4. Orifices spaced 2 feet apart in a vertical line should not affect the discharge coefficient. Potential theory suggests that pressure distribution at the inlet to each orifice would be unaffected by another orifice 2 feet away.
APPLICATIONS
The results of these tests -are for the. use of Bureau of Reclamation designers in designing structures requiring specific types·of orifice controls. The criteria presented are generally applicable to any problem requiring knowledge of orifice discharge coefficients. However, the coefficients for the "less-than-ideal" configurations apply only to those particular configurations.
INTRODUCTION
Orifice controls have been used in connection with automatic spillway gates at several locations in the past few years. Use of such controls on future installations will depend upon the reliability of the computed flow rate through the orifices. The orifice discharge governs the relationship between spillway gate opening and reservoir elevation.
Accurate design requires 3-place discharge coefficients for 1- and 3-inch-diameter, square-edged, circular orifices in 10-gage plate, under heads up to 100 feet. Information on the following configurations was requested:
1. Orifice in a vertical plane
2. Orifice in a horizontal plane
3. Orifice in a vertical plane approached by two inverted 90° 6-inch elbows.
A determination of the effects, if any, of the following conditions on the discharge coefficients was also required:
1. Orifice discharging against a flat plate at various distances from the plane of the orifice
2. Three-inch orifice located eccentrically in the end of a 10-inch pipe, with a 4-inch-diameter cylindrical obstruction along the opposite wall of the pipe
3. One- and 2-inch-diameter orifices drilled normal to the wall of a 4-inch pipe, with flow into the pipe under heads of 3 to 15 feet
4. Two or three 2-inch orifices spaced 2 feet apart in a vertical line discharging into a 4-inch pipe
5. Two opposing orifices in the wall of a 4-inch pipe (unspecified orifice size)
Conclusions were reached by performing laboratory tests, through a library ~rch with quotation of appropriate findings, and by reference to theory. In order to expedite the laboratory work, some tests-were modified slightly from the requirements listed above.
TEST APPARATUS
The equipment used for investigating the effects of the three basic configurations listed above consisted of a 3-foot-diameter, 6-foot-long steel tank to which the orifices and approach piping were attached. Heads were measured at taps located at quarter-points on the periphery of the flange to which the orifice plates were attached. The taps were connected to open-tube water or mercury manometers, depending on the head. Discharges were measured with venturi meters which are a permanent part of the laboratory system.
The special conditions, also listed above, were investigated with a full scale model of the orifice control configuration for the spillway gates at Norton Dam. The system was enclosed in a 12-foot-high rectangular tank with a plexiglass viewing window on one side. Heads were measured with open-tube water manometers or with electronic pressure transducers. Discharges were measured with a v-notch weir located in a rectangular flume through which the discharge of the model passed. The weir was calibrated with the permanent venturi meters and checked by weighing the discharge.
INVESTIGATION
Orifice in a Vertical Plane
The test rig is shown in Figure 1A. Data points for a 3-inch orifice in a 10-gage plate, placed concentrically in the end of a 10-inch-diameter, 4-foot-long pipe are shown in Figure 2.
The coefficients have an average value of 0.607 for heads between 20 and 100 feet. Below 20 feet, the coefficients show quite a large scatter and general increase with decreasing head. These trends are caused by the jet clinging to the inner surface of the orifice, instead of springing clear at the upstream edge. The contraction of the jet is reduced, thus resulting in a corresponding increase in the discharge coefficient. The scatter results from the instability of this phenomenon.
Comparison of the coefficient curve with that obtained by Blackburn1 , shows slightly higher coefficients for the present data. However. the maximum difference is only about 1 percent. This difference could easily be due to experimental errors in either the present or previous tests, or. both.
Reliable data could not be obtained for the 1-inch orifice because of difficulties in accurately measuring the very low discharges. The coefficients should be the same as those indicated by Blackburn's curves.
Orifice in a Horizontal Plane
Because the tests on the orifice in the vertical plane resulted in coefficients nearly equal to previously accepted values, studies of an orifice in a horizontal plane were not made. Only for low heads, when the head and velocity exhibit an appreciable variation from top to bottom of the pipe, would the coefficients for the vertical plane be expected to differ from those for the horizontal plane.
Orifice in a Vertical Plane Approached by Two Inverted 90", 6-inch Elbows
The test rig is shown in Figure 1 B. Figure 2 shows that the coefficients for low heads follow a trend similar to that with a straight approach. For heads above approximately 20 feet the coefficients are less than 1 percent lower than the values from Blackburn's curves. Tests on a 1-inch orifice were therefore considered unnecessary.
Orifices in Wall of Pipe
The full-scale model of the Norton system, Figure 3, was used to study some of the remaining conditions. Several different size orifices in the side of a 10-inch-inside-diameter pipe with 1/4-inch wall thickness were studied, instead of 1- and 2-inch orifices in a 4-inch pipe as stated in the Introduction. Figure 4 summarizes experimental coefficients for orifice diameters of 4, 1.90, 1.72, 1.25, and 1.05 inches.
There appears to be no correlation between the discharge coefficient and orifice size. The author feels that the effect of wall thickness may have obscured the effect of orifice size. The orifices were cut so that the sides of the orifice were parallel. Therefore, the orifice size would affect the shape of the spring point of the
1 King, H. W., Wisler, C. 0., and Woodburn, J. G., "Hydraulics," Fifth Edition, John Wiley and Sons, Inc., New York, 1948, fig. 62, p 130.
2

flow. It is possible that the general form of the contracted jet was different for the various test orifices. Additional studies would be necessary to isolate the effect of pipe thickness.
To determine the relationship, if any, between the discharge coefficient and the angle of side contraction (/3), the data were plotted with the data of von Mises2
Figure 5. b/8 (or d/D) was taken as 0.0 because the flow through the orifice originates in a large body of water. Figure 5 fails to show any relationship between the contraction angle and the discharge coefficient, unless the points for the 1.25- and 1.72-inch orifices are disregarded.
Figure 6 gives the percentage correction that must be added to plane orifice area to obtain true area for various ratios of pipe diameter to orifice diameter. The correction is essentially negligible for all but the 4-inch orifice (D'/d = 2.62, correction= 2 percent). Corrected coefficients are summarized in Table 1.
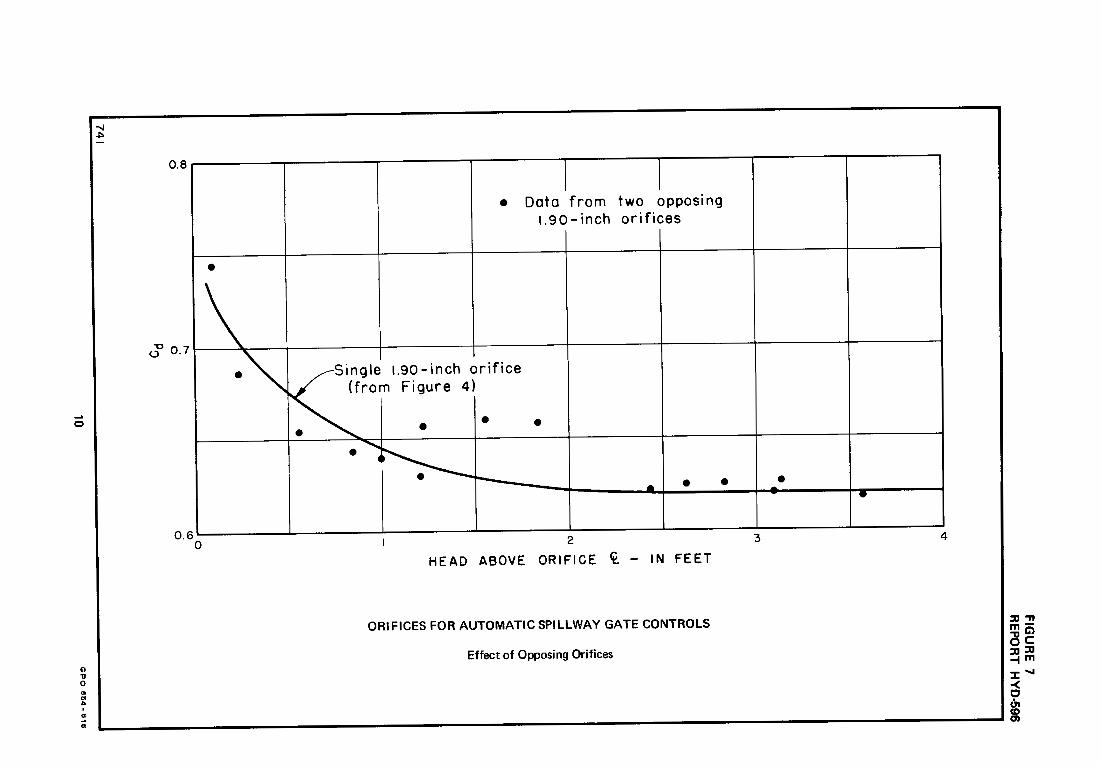
Opposing Orifices
Two 1.90-inch orifices were placed directly opposite each other in the wall of the 10-inch-inside-diameter pipe. Figure 7 shows that impingement of one jet on the other in this installation does not affect the orifice discharge coefficient. This condition is analogous to that of a single jet discharging against a flat plate (described below). Larger orifices might influence one another because of the increased distance between the plane of the orifice and the vena contracta. Assuming this length to be one-half orifice diameter, the required orifice diameter would be equal to the diameter of the pipe in which it is placed. This is, of course, an unrealistic condition.
Orifice Discharging Against A Flat Plate
An obstruction to a jet will have no effect if the obstruction is located downstream from the vena contracta. A generally accepted rule is that the vena contracta is located approximately one-half orifice diameter downstream from the plane of the orifice. It is doubtful that such restrictive conditions would ever be required in an orifice control system. No tests were performed.
Orifice Located Eccentrically in Pipe with Obstruction
No tests were made on this configuration. Beitler and Masson, in a 1949 paper3 , describe findings that for d/D ratios less than about 0.5, coefficients for orifices with one edge coincident to the side of the pipe were about 3 percent higher than for concentric orifices with equal d/D ratios. The effect of the cylindrical obstruction is unknown, but this effect would not be expected to be large, especially in view of the tests on unusual approach conditions described above.
Orifices in a Vertical Line
Orifices placed 2 feet apart in a vertical line would not be expected to influence the discharge coefficient. Potential theory suggests that the pressure distribution of one orifice would not be influenced by flow through the other. This condition was not investigated during these studies.
Table 1
DISCHARGE COEFFICIENTS WITH AND WITHOUT CORRECTION FOR
CHANGE IN EFFECTIVE AREA
Orifice size, Cd based on Cd based on inches plane area true area
4 0.601 0.589 1.9 .625 .622 1.72 .539 .539 1.25 .582 .582 1.05 .626 .626
2 Elementary Mechanics of Fluids, Hunter Rouse, John Wiley and Sons, Inc., New York, 1946, Table I, p 57. 3 Beitler, S. K. and Masson, D. J., "Calibration of Eccentric and Segmental Orifices in 4- and 6-inch Pipe Lines," Transactions of ASME, 1949, 71(7), pp 751-755.
3
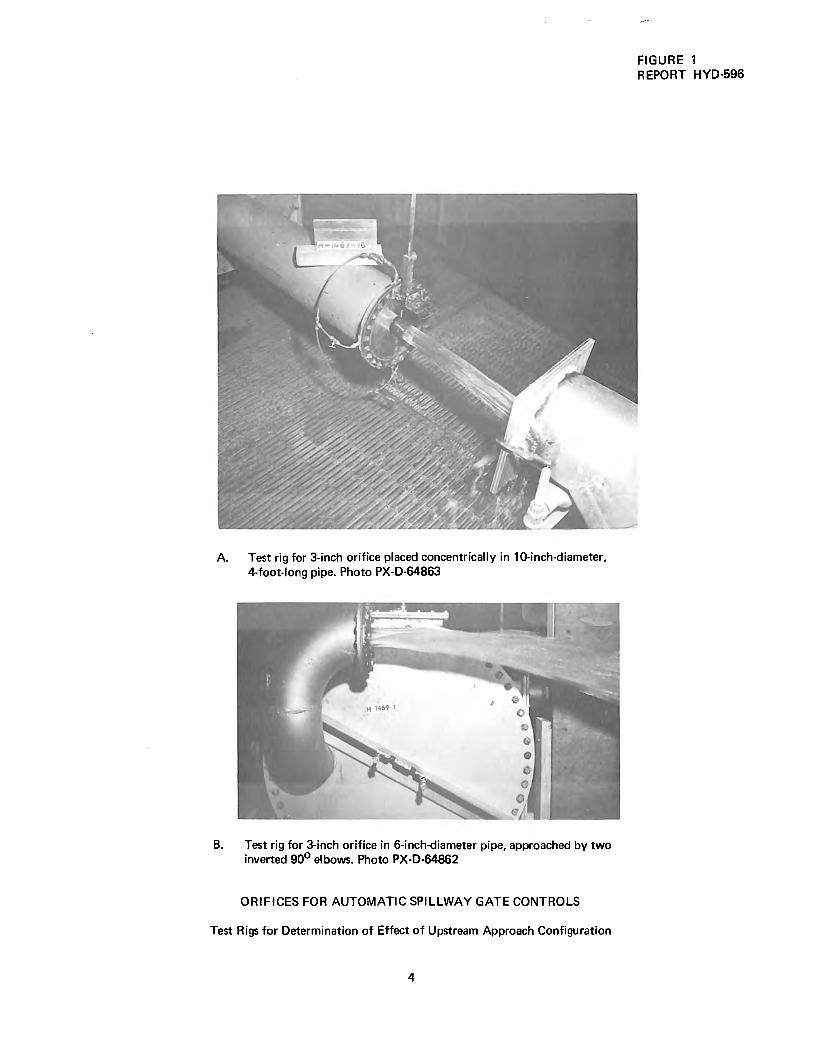
A. Test rig for 3-inch orifice placed concentrically in 10-inch-diameter, 4-foot-long pipe. Photo PX-0-64863
8. Test rig for 3-inch orifice in 6-inch-diameter pipe, approached by two inverted 90° elbows. Photo PX-0-64862
ORIFICES FOR AUTOMATIC SPILLWAY GATE CONTROLS
Test Rigs for Determination of Effect of Upstream Approach Configuration
4
FIGURE 1 REPORT HYD-596

U1
----------------------------------------------------~~~
d ~ <(
II
"O (.)
0.900
•
0.800 • • 3-inch orifice in 6-inch pipe with double
inverted 90-degree bend approach. 0 3-inch orifice in 10-inch pipe with
straight approach. --- From Fig; 62 King, Wisler, Woodburn.
• 0.700 • •
0 • 0 cs--- .. - r-.i ~ .. --.- .... -•-r· ,-- r -.
00..,..~ 0.600 ouu
p
0.500 0
0 .Q~ - 0 > ,0 rn 0 0 0 0 0 nhC ~,..oc I ~ 0 p - -
10 20 30 40 50 60 70 80 90 100
H = HEAD ABOVE ORIFICE ct. - IN FEET
ORIFICES FOR AUTOMATIC SPILLWAY GATE CONTROLS
Effect of Upstream Approach
110
qi ci cc ~~ -1m :::cN -< 0
~ C)

FIGURE 3 REPORT HYD-596
, - - __ Circular filling Weir
- - - --Filling orifice
--- _ - Control orifice To float_ well ------
Inflow to - -- --model
ORIFICES FOR AUTOMATIC SPILLWAY GATE CONTROLS
Full Scale Model of Filling System for Norton Dam Spillway Gate Control
6

-----------------------------------------------------------~::n~
0.7
0.6
0.5
0
\ 0~
0 1.90-inch Orifice [] 1.05
~ • 4.00
• 1.25 X I. 72
- u
~ 0
~ 0 IJ
~ [] [] __ o
n ~ n []
u n ~ -
....._v~ ~ --~ -- -. • 11 - • .... - • • X - • • • -X x, X
~x~ X ---~x X x_x X
_.--Weir - type flow, head referenced to bottom of orifice.
\ \
2 3
HEAD ABOVE ORIFICE 'i, - IN FEET
ORIFICES FOR AUTOMATIC SPILLWAY GATE CONTROLS
Discharge Coefficients for Orifices in Wall of 10-inch Diameter Pipe
n
- -
- - •
X x x-1<
4
q} C) oc ::n::XJ -I m J:.i:.
-< 0 CJ1 .-CD C)

180
170
160
150
140 0
~
130
120
110
100
9%.4
741
FIGURE 5 REPORT HYD-596
\ • From H = 4' (cd} \ Corresponding curve
on Figure 4 present data (cc> \ (3-dimensiona I}
von Mises' data (Cc) (2-dimensional) \
\ \
\ \
\ \ \
\ -- D - \ ( reservoir width) 1.7211
0.5 0.6
Cd AND Cc
ORIFICES FOR AUTOMATIC SPILLWAY GATE CONTROLS
Correlation of Discharge Coefficient with Angle of Side Contraction, Orifices in Wall of 10-inch Diameter Pipe
8
for
\ \

FIGURE 6 REPORT HYD-596
28
26
24
22
C( 20 l&J a:: C(
18 l&J z C( .J Cl. 16
0 1-
z 14 0 I-
C 12 C C(
1-z 10 l&J 0 a:: l&J Cl. 8
6
4
2
0
~ I I 1 -Maximum correction
is 27.33 percent
\
\ ,
' ' ~ ---I 2 3 4 5 6 7 8 9 10
RATIO OF PIPE DIAMETER (01) TO ORIFICE DIAMETER (d)
ORIFICES FOR AUTOMATIC SPILLWAY GATE CONTROLS
Area Correction for Orifices in Wall of Pipe
741
9
.... 0
Gl 1l 0
"' DI .. ' .. ..
0.8
J' 0.7
0.6 0
•
\ ·"'
I I • Data from two opposing
1.90- inch orifices
~gle 1.90-inch orifice from Figure 4)
• • • • . ....... ~ j
t--...... - • •
2
HEAD ABOVE ORIFICE i - IN FEET
ORIFICES FOR AUTOMATIC SPILLWAY GATE CONTROLS
Effect of Opposing Orifices
• -
•
3 4
:a, .,,
rg ci QC :a, :a, -4m ::c ....
~ ..._ _____________________________________________________ ..,i
7-1750 (2-67) Bureau or ReclamaUon
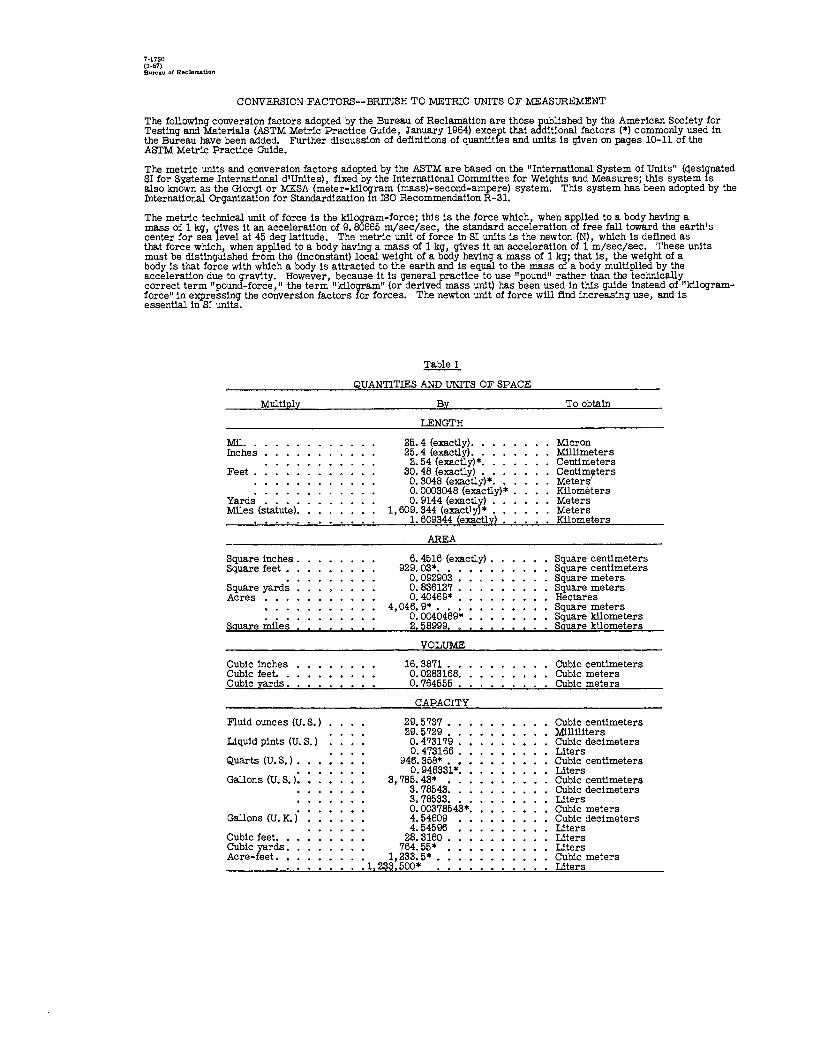
CONVERSION FACTORS--BRrrISH TO METRIC UNITS OF MEASUREMENT
The following conversion factors adopted by the Bureau of Reclamation are those published by the American Society for Testing and Materials (ASTM Metric Practice Guide, January 1964) except that additional factors (*) commonly used in the Bureau have been added. Further discussion of definitions of quantities and units is given on pages 10-11 of the ASTM Metric Practice Guide.
The metric units and conversion factors adopted by the ASTM are based on the "International System of Units" (designated SI for Systeme International d1Unites), fixed by the International Committee for Weights and Measures; this system is also known as the Giorgi or MKSA (meter-kilogram (mass)-second-ampere) system. This system has been adopted by the International Organization for Standardization in ISO Recommendation R-31.
The metric technical unit of force is the kilogram-force; this is the force which, when applied to a body having a mass of 1 kg, gives it an acceleration of 9. 80665 m/sec/sec, the standard acceleration of free fall toward the earth's center for sea level at 45 deg latitude. The metric unit of force in SI units is the newton (N), which is defined as that force which, when applied to a body having a mass of 1 kg, gives it an acceleration of 1 m/sec/sec. These units must be distinguished from the (inconstant) local weight of a body having a mass of 1 kg; that is, the weight of a body is that force with which a body is attracted to the earth and is equal to the mass of a body multiplied by the acceleration due to gravity. However, because it is general practice to use "pound" rather than the technically correct term "pound-force, 11 the term "kilogram" (or derived mass unit) has been used in this guide instead of "kilogramforce" in expressing the conversion factors for forces. The newton unit of force will find increasing use, and is essential in SI units.
Mil. Inches
Feet.
Multiply
Yards •..• Miles (statute).
Square inches • Square feet •
Square yards Acres •
Square miles
Cubic inches Cubic feet. Cubic yards •
Fluid ounces (U. s.)
Liquid pints (U.S.)
Quarts (U.S.).
Gallons (U. s. i:
Gallons (U. K. i Cubic feet. Cubic yards • Acre-feet.
~
QUANTITIES AND UNITS OF SPACE
By
LENGTH
25.. 4 (exactly). 25. 4 (exactly) .. 2. 54 (exactly)* ..
30. 48 (exactly) • • 0. 3048 (exactly)* ... 0. 0003048 (exactly)* • O. 9144 (exactly) •.•
1,609.344 (exact!:,)* • . . 1. 609344 (exactly) • •
AREA
6. 4516 (exactly) • 929. 03* .•••••
0.092903 • o. 836127 . 0.40469* •
4,046. 9* • 0. 0040469* • 2.58999 ••
VOLUME
16. 3871 • 0.0283168. o. 764555 •
CAPACITY
29.5737. 29. 5729 • 0.473179 . 0.473166.
946. 358* •• 0. 946331*.
3,785.43* 3. 78543. 3. 78533. o. 00378543*. 4.54609 4.54596
28.3160 • 764.55*
• 1,233.5*. .1,233,500*
To obtain
Micron Ml.llimeters Centimeters Centi~ters Meter Kilo ters Meters Meters Kilometers
Square centimeters Square centimeters Square meters Square meters Hectares Square meters Square kilometers Square kUometers
Cubic centimeters Cubic meters Cubic meters
Cubic centimeters Milliliters Cubic decimeters Liters Cubic centimeters Liters Cubic centimeters Cubic decimeters Liters Cubic meters Cubic decimeters Liters Liters Liters Cubic meters Liters

b!,ultiply
Grains (1/7, 000 lb) • . • Troy ounces (480 grains). Ounces (avdp). • • . • • Pounds (avdp). . . . Short tons (2,000 lb).
Long tons (2,240 lb):
Pounds per square inch
Pounds per square foot
Ounces per cubic inch . . . Pounds per cubic foot . . .
Tons Uong) per cubic Vaid :
Ounces per gallon (U. S. ) Ounces per gallon (U. K.) Pounds per gallon (U.S.) Pounds per gallon (U. K. )
Inch-pounds
Foot-pounds
Foot-pounds per !~ch Ounce-inches. . . .
Feet per second.
Feet per year. . Miles per hour .
Feet per second2
Cubic feet per second (secondfeet) ••••••....
Cubic feet per minute • • . Gallons (U.S. ) per minute •
Pounds.
By
MASS
64. 79891 (exactly) 31.1035 .•••• 28. 3495 ••••... 0. 46359237 (exactly).
907. 185 . • . . • • 0. 907185 ..•. . 1. 016. 05. • • • • •
FORCE AREA
0.070307. 0. 689476. 4. 88243 •
47. 8803 ••
MASS/VOLUME (DENSITY)
1. 72999 . 16. 0185 • 0. 0160185 1. 32894
MASS/CAP A CITY
7. 4893. 6. 2362.
119. 829 . 99. 779 .
BENDING MOMENT OR TORQUE
VELOCITY
30. 48 (exactly). • . 0. 3048 (exactly)* . 0. 965873 X 10-6* . 1. 609344 (exactly). O. 44704 (exactlYL.
ACCELERATION*
o. 3048* ••
FLOW
o. 028317* 0. 4719 . 0.06309 •
FORCE*
0. 453592* .••
tmrx10-5*:
Table II
QUANTITIES AND UNITS OF MECHANICS
Milligrams Grams Grams Kilograms Kilograms Metric tons Kilograms
To obtain
Kilograms per square centimeter Newtons per square centimeter Kilograms per square meter Newtons per square meter
Grams per cubic centimeter Kilograms per cubic meter Grams per cubic centimeter Grams per cubic centimeter
Grams per llter Grams per liter Grams per liter Grams per liter
Meter-kilograms Centlmeter-dynes Meter-kilograms Centimeter-dynes Centimeter-kllograms per centimeter Gram-centimeters
Centimeters per second Meters per second Centimeters per second Kilometers per hour Meters per second
Meters per second2
Cubic meters per second Liters per second Liters per second
Kilograms Newtons Dynes
Multiply
British thermal units (Btu) •
Btu per pound. Foot-pounds
Horsepower . . . , . . Btu per hour . . . , . . Foot-pounds per second .
Btu ln. /hr ft2 deg F (k, thermal conductivity)
Btu ft/hr ft2 deg F . . : : :
B~%%i~~~j F0 (~,. ~r-~.
Deg F hr ft2/Bt~ CR,° the;ma.l· resistance) • • • • • • • • •
Btu/lb deg F (c, heat capacity) • Btu/lb deg F . . . . . . . Ft6/hr (thermal diffusivity)
Grains/hr ft2 (water vapor transmission) • • • • • •
Perms (permeance) . . . . Perm-inches (permeability)
Multiply
Cubic feet per square foot per day (seepage) . • . • • . •
Pound-seconds per square foot (viscosity) • • • • . . . . . .
Square feet per second (viscosity). Fahrenheit degrees (change)*. • . Volts per mil . . • . • . • •
L~:n~!s)er_ s;~~ ~o~t ~o~t~ Ohm-circular mils per foot Mlllicurles per cubic foot Milllamps per square foot Gallons per square· yard . Pounds per inch.
By
WORK AND ENERGY*
. o. 252* ••• • 1,055.06 .••• • 2. 326 (exactly)
1. 35582*. •
POWER
745. 700 ••• 0. 293071. • 1. 35582 ••
HEAT TRANSFER
1. 442 . 0.1240. 1. 4880*
0. 568 4. 882
1. 761 4.1868 1. 000* 0. 2581 . 0. 09290*.
WATER VAPOR TRANSMISSION
16. 7 0. 659 1. 67
Table III
OTHER QUANTITIES AND UNITS
By
304. 0• •.•
4. 8824• .. o. 092903* •• 5/9 exactly • 0.03937.
10. 764 ••• 0.001662 • 35. 3147* . 10. 7639* .• 4. 527219* • 0. 17858* ••
To obtain
Kilogram calories Joules Joules per gram Joules
Watts Watts Watts
Milliwatts/cm deg C Kg cal/hr m deg C Kg cal m/hr mZ deg C
Mllllwatts/cJ;D.2 deg C Kg cal/hr m0 deg C
Deg C cm2 /milliwatt J/g deg C Cal/gram deg C Cm2/sec MO/hr
Grams/24 hr m2 Metric perms Metric perm-centimeters
To obtain
Liters per square meter per day
Kilogram second per square meter Square meters per second Celsius or Kelvin degrees (change)• Kilovolts per millimeter
Lumens per square meter Ohm-square millimeters per meter Mllllcurles per cubic meter Milliamps per square meter Liters per square meter Kilograms per centimeter
GPO 835-159

ABSTRACT
Design of orifice filling systems for automatic spillway gate controls requires 3-place discharge coefficients. Limited tests were made on orifices having various unusual approach and exit configurations_ Where appropriate, reference is made to results of previous research, indicating that further tests were unnecessary. Effects of unusual geometry are generally negligible. Guidelines are presented for correction of coefficients when such effects should be considered.
ABSTRACT
Design of orifice filling systems for automatic spillway gate controls requires 3-place discharge coefficients. Limited tests were made on orifices having various unusual approach and exit configurations. Where appropriate, reference is made to results of previous research, indicating that further tests were unnecessary. Effects of unusual 'geometry are generally negligible. Guidelines are presented for correction of coefficients when such effects should be considered.
ABSTRACT
Design of orifice filling systems for automatic spillway gate controls requires 3-place discharge coefficients. Limited tests were made on orifices having various unusual approach and exit configurations. Where appropriate, reference is made to results of previous research, indicating that further tests were unnecessary_ Effects of unusual geometry are generally negligible. Guidelines are presented for correction of coefficients when such effects should be considered_
"
ABSTRACT
Design of orifice filling systems for automatic spillway gate controls requires 3-place discharge coefficients. Limited tests were made on orifices having various unusual approach and exit configurations. Where appropriate, reference is made to results of previous research, indicating that further tests were unnecessary. Effects of unusual geometry are generally negligible. Guidelines are presented for correction of coefficients when such effects should be considered.

HYD-596 King, D L STUDIES OF ORIFICES FOR AUTOMATIC SPILLWAY GATE CONTROLS. Bur RP.Clam Lab Rep HYD-596, Hydraul Br, Sept 1969. Bureau of Reclamation, Denver, 3 p, 7 fig, 1 tab, 3 ref
DESCRIPTORS-/ *orifices/ *spillway gates/ *automatic control/ hydraulic models/ design/ hydraulics/ *discharge coefficients/ spillways/ research and development/ design criteria/ hydraulic structures/ spillway gates/ orifice flow/ hydraulic design IDENTIFIERS-/ spillway gate controls
HYD-596 King, D L STUDIES OF ORIFICES FOR AUTOMATIC SPILLWAY GATE CONTROLS. Bur Reclam Lab Rep HYD-596, Hydraul Br, Sept ·1969. Bureau of Reclamation, Denver, 3 p, 7 fig, 1 tab, 3 ref
DESCRIPTORS-/ *orifices/ *spillway gates/ *automatic control/ hydraulic models/ design/ hydraulics/ *discharge coefficients/ spillways/ research and development/ design criteria/ hydraulic structures/ spillway gates/ orifice flow/ hydraulic design IDENTIFIERS-/ spillway gate controls
HYD-596 King, D L STUDIES OF ORIFICES FOR AUTOMATIC SPILLWAY GATE CONTROLS. Bur Reclam Lab Rep HYD-596, Hydraul Br, Sept 1969. Bureau of Reclamation, Denver, 3 p, 7 fig, 1 tab, 3 ref
DESCRIPTORS-/ *orifices/ *spillway gates/ *automatic control/ hydraulic models/ design/ hydraulics/ *discharge coefficients/ spillways/ research and development/ design criteria/ hydraulic structures/ spillway gates/ orifice flow/ hydraulic design IDENTIFIERS-/ spillway gate controls
HYD-596 King, D L STUDIES OF ORIFICES FOR AUTOMATIC SPILLWAY GATE CONTROLS. Bur RP.Clam Lab Rep HYD-596, Hydraul Br, Sept 1969. Bureau of Reclamation, Denver, 3 p, 7 fig, 1 tab, 3 ref
DESCRIPTORS-/ *orifices/ *spillway gates/ *automatic control/ hydraulic models/ design/ hydraulics/ *discharge coefficients/ spillways/ research and development/ design criteria/ hydraulic structures/ spillway gates/ orifice flow/ hydraulic design IDENTIFIERS-/ spillway gate controls