Embed Size (px)
Citation preview

xxxxxxxxxxxxxxxxxxxxxxxxxxxxxxxxxxxxxxxxxxxxxxxxxxxxxxxxxxxxxxxxxxxxxxxxxxxxxxxxxxxxxxxxxxxxxxxxxxx
xxxxxxxxxxxxxxxxxxxxxxxxxxxxxxxxxxxxxxxxxxxxxxxxxxxxxxxxxxxxxxxxxxxxxxxxxxxxxxxxxxxxxxxxxxxxxxxxxxx
xxxxxxxxxxxxxxxxxxxxxxxxxxxxxxxxxxxxxxxxxxxxxxxxxxxxxxxxxxxxxxxxxxxxxxxxxxxxxxxxxxxxxxxxxxxxxxxxxxx
xxxxxxxxxxxxxxxxxxxxxxxxxxxxxxxxxxxxxxxxxxxxxxxxxxxxxxxxxxxxxxxxxxxxxxxxxxxxxxxxxxxxxxxxxxxxxxxxxxx
xxxxxxxxxxxxxxxxxxxxxxxxxxxxxxxxxxxxxxxxxxxxxxxxxxxxxxxxxxxxxxxxxxxxxxxxxxxxxxxxxxxxxxxxxxxxxxxxxxx
xxxxxxxxxxxxxxxxxxxxxxxxxxxxxxxxxxxxxxxxxxxxxxxxxxxxxxxxxxxxxxxxxxxxxxxxxxxxxxxxxxxxxxxxxxxxxxxxxxx
xxxxxxxxxxxxxxxxxxxxxxxxxxxxxxxxxxxxxxxxxxxxxxxxxxxxxxxxxxxxxxxxxxxxxxxxxxxxxxxxxxxxxxxxxxxxxxxxxxx
xxxxxxxxxxxxxxxxxxxxxxxxxxxxxxxxxxxxxxxxxxxxxxxxxxxxxxxxxxxxxxxxxxxxxxxxxxxxxxxxxxxxxxxxxxxxxxxxxxx
xxxxxxxxxxxxxxxxxxxxxxxxxxxxxxxxxxxxxxxxxxxxxxxxxxxxxxxxxxxxxxxxxxxxxxxxxxxxxxxxxxxxxxxxxxxxxxxxxxx
xxxxxxxxxxxxxxxxxxxxxxxxxxxxxxxxxxxxxxxxxxxxxxxxxxxxxxxxxxxxxxxxxxxxxxxxxxxxxxxxxxxxxxxxxxxxxxxxxxx
xxxxxxxxxxxxxxxxxxxxxxxxxxxxxxxxxxxxxxxxxxxxxxxxxxxxxxxxxxxxxxxxxxxxxxxxxxxxxxxxxxxxxxxxxxxxxxxxxxx
xxxxxxxxxxxxxxxxxxxxxxxxxxxxxxxxxxxxxxxxxxxxxxxxxxxxxxxxxxxxxxxxxxxxxxxxxxxxxxxxxxxxxxxxxxxxxxxxxxx
xxxxxxxxxxxxxxxxxxxxxxxxxxxxxxxxxxxxxxxxxxxxxxxxxxxxxxxxxxxxxxxxxxxxxxxxxxxxxxxxxxxxxxxxxxxxxxxxxxx
xxxxxxxxxxxxxxxxxxxxxxxxxxxxxxxxxxxxxxxxxxxxxxxxxxxxxxxxxxxxxxxxxxxxxxxxxxxxxxxxxxxxxxxxxxxxxxxxxxx
xxxxxxxxxxxxxxxxxxxxxxxxxxxxxxxxxxxxxxxxxxxxxxxxxxxxxxxxxxxxxxxxxxxxxxxxxxxxxxxxxxxxxxxxxxxxxxxxxxx
xxxxxxxxxxxxxxxxxxxxxxxxxxxxxxxxxxxxxxxxxxxxxxxxxxxxxxxxxxxxxxxxxxxxxxxxxxxxxxxxxxxxxxxxxxxxxxxxxxx
xxxxxxxxxxxxxxxxxxxxxxxxxxxxxxxxxxxxxxxxxxxxxxxxxxxxxxxxxxxxxxxxxxxxxxxxxxxxxxxxxxxxxxxxxxxxxxxxxxx
xxxxxxxxxxxxxxxxxxxxxxxxxxxxxxxxxxxxxxxxxxxxxxxxxxxxxxxxxxxxxxxxxxxxxxxxxxxxxxxxxxxxxxxxxxxxxxxxxxx
xxxxxxxxxxxxxxxxxxxxxxxxxxxxxxxxxxxxxxxxxxxxxxxxxxxxxxxxxxxxxxxxxxxxxxxxxxxxxxxxxxxxxxxxxxxxxxxxxxx
xxxxxxxxxxxxxxxxxxxxxxxxxxxxxxxxxxxxxxxxxxxxxxxxxxxxxxxxxxxxxxxxxxxxxxxxxxxxxxxxxxxxxxxxxxxxxxxxxxx
xxxxxxxxxxxxxxxxxxxxxxxxxxxxxxxxxxxxxxxxxxxxxxxxxxxxxxxxxxxxxxxxxxxxxxxxxxxxxxxxxxxxxxxxxxxxxxxxxxx
xxxxxxxxxxxxxxxxxxxxxxxxxxxxxxxxxxxxxxxxxxxxxxxxxxxxxxxxxxxxxxxxxxxxxxxxxxxxxxxxxxxxxxxxxxxxxxxxxxx
xxxxxxxxxxxxxxxxxxxxxxxxxxxxxxxxxxxxxxxxxxxxxxxxxxxxxxxxxxxxxxxxxxxxxxxxxxxxxxxxxxxxxxxxxxxxxxxxxxx
xxxxxxxxxxxxxxxxxxxxxxxxxxxxxxxxxxxxxxxxxxxxxxxxxxxxxxxxxxxxxxxxxxxxxxxxxxxxxxxxxxxxxxxxxxxxxxxxxxx
xxxxxxxxxxxxxxxxxxxxxxxxxxxxxxxxxxxxxxxxxxxxxxxxxxxxxxxxxxxxxxxxxxxxxxxxxxxxxxxxxxxxxxxxxxxxxxxxxxx
xxxxxxxxxxxxxxxxxxxxxxxxxxxxxxxxxxxxxxxxxxxxxxxxxxxxxxxxxxxxxxxxxxxxxxxxxxxxxxxxxxxxxxxxxxxxxxxxxxx
xxxxxxxxxxxxxxxxxxxxxxxxxxxxxxxxxxxxxxxxxxxxxxxxxxxxxxxxxxxxxxxxxxxxxxxxxxxxxxxxxxxxxxxxxxxxxxxxxxx
xxxxxxxxxxxxxxxxxxxxxxxxxxxxxxxxxxxxxxxxxxxxxxxxxxxxxxxxxxxxxxxxxxxxxxxxxxxxxxxxxxxxxxxxxxxxxxxxxxx
xxxxxxxxxxxxxxxxxxxxxxxxxxxxxxxxxxxxxxxxxxxxxxxxxxxxxxxxxxxxxxxxxxxxxxxxxxxxxxxxxxxxxxxxxxxxxxxxxxx
xxxxxxxxxxxxxxxxxxxxxxxxxxxxxxxxxxxxxxxxxxxxxxxxxxxxxxxxxxxxxxxxxxxxxxxxxxxxxxxxxxxxxxxxxxxxxxxxxxx
xxxxxxxxxxxxxxxxxxxxxxxxxxxxxxxxxxxxxxxxxxxxxxxxxxxxxxxxxxxxxxxxxxxxxxxxxxxxxxxxxxxxxxxxxxxxxxxxxxx
xxxxxxxxxxxxxxxxxxxxxxxxxxxxxxxxxxxxxxxxxxxxxxxxxxxxxxxxxxxxxxxxxxxxxxxxxxxxxxxxxxxxxxxxxxxxxxxxxxx
xxxxxxxxxxxxxxxxxxxxxxxxxxxxxxxxxxxxxxxxxxxxxxxxxxxxxxxxxxxxxxxxxxxxxxxxxxxxxxxxxxxxxxxxxxxxxxxxxxx
xxxxxxxxxxxxxxxxxxxxxxxxxxxxxxxxxxxxxxxxxxxxxxxxxxxxxxxxxxxxxxxxxxxxxxxxxxxxxxxxxxxxxxxxxxxxxxxxxxx
xxxxxxxxxxxxxxxxxxxxxxxxxxxxxxxxxxxxxxxxxxxxxxxxxxxxxxxxxxxxxxxxxxxxxxxxxxxxxxxxxxxxxxxxxxxxxxxxxxx
xxxxxxxxxxxxxxxxxxxxxxxxxxxxxxxxxxxxxxxxxxxxxxxxxxxxxxxxxxxxxxxxxxxxxxxxxxxxxxxxxxxxxxxxxxxxxxxxxxx
xxxxxxxxxxxxxxxxxxxxxxxxxxxxxxxxxxxxxxxxxxxxxxxxxxxxxxxxxxxxxxxxxxxxxxxxxxxxxxxxxxxxxxxxxxxxxxxxxxx
xxxxxxxxxxxxxxxxxxxxxxxxxxxxxxxxxxxxxxxxxxxxxxxxxxxxxxxxxxxxxxxxxxxxxxxxxxxxxxxxxxxxxxxxxxxxxxxxxxx
xxxxxxxxxxxxxxxxxxxxxxxxxxxxxxxxxxxxxxxxxxxxxxxxxxxxxxxxxxxxxxxxxxxxxxxxxxxxxxxxxxxxxxxxxxxxxxxxxxx
xxxxxxxxxxxxxxxxxxxxxxxxxxxxxxxxxxxxxxxxxxxxxxxxxxxxxxxxxxxxxxxxxxxxxxxxxxxxxxxxxxxxxxxxxxxxxxxxxxx
xxxxxxxxxxxxxxxxxxxxxxxxxxxxxxxxxxxxxxxxxxxxxxxxxxxxxxxxxxxxxxxxxxxxxxxxxxxxxxxxxxxxxxxxxxxxxxxxxxx
xxxxxxxxxxxxxxxxxxxxxxxxxxxxxxxxxxxxxxxxxxxxxxxxxxxxxxxxxxxxxxxxxxxxxxxxxxxxxxxxxxxxxxxxxxxxxxxxxxx
xxxxxxxxxxxxxxxxxxxxxxxxxxxxxxxxxxxxxxxxxxxxxxxxxxxxxxxxxxxxxxxxxxxxxxxxxxxxxxxxxxxxxxxxxxxxxxxxxxx
xxxxxxxxxxxxxxxxxxxxxxxxxxxxxxxxxxxxxxxxxxxxxxxxxxxxxxxxxxxxxxxxxxxxxxxxxxxxxxxxxxxxxxxxxxxxxxxxxxx
xxxxxxxxxxxxxxxxxxxxxxxxxxxxxxxxxxxxxxxxxxxxxxxxxxxxxxxxxxxxxxxxxxxxxxxxxxxxxxxxxxxxxxxxxxxxxxxxxxx
xxxxxxxxxxxxxxxxxxxxxxxxxxxxxxxxxxxxxxxxxxxxxxxxxxxxxxxxxxxxxxxxxxxxxxxxxxxxxxxxxxxxxxxxxxxxxxxxxxx
xxxxxxxxxxxxxxxxxxxxxxxxxxxxxxxxxxxxxxxxxxxxxxxxxxxxxxxxxxxxxxxxxxxxxxxxxxxxxxxxxxxxxxxxxxxxxxxxxxx
xxxxxxxxxxxxxxxxxxxxxxxxxxxxxxxxxxxxxxxxxxxxxxxxxxxxxxxxxxxxxxxxxxxxxxxxxxxxxxxxxxxxxxxxxxxxxxxxxxx
xxxxxxxxxxxxxxxxxxxxxxxxxxxxxxxxxxxxxxxxxxxxxxxxxxxxxxxxxxxxxxxxxxxxxxxxxxxxxxxxxxxxxxxxxxxxxxxxxxx
xxxxxxxxxxxxxxxxxxxxxxxxxxxxxxxxxxxxxxxxxxxxxxxxxxxxxxxxxxxxxxxxxxxxxxxxxxxxxxxxxxxxxxxxxxxxxxxxxxx
xxxxxxxxxxxxxxxxxxxxxxxxxxxxxxxxxxxxxxxxxxxxxxxxxxxxxxxxxxxxxxxxxxxxxxxxxxxxxxxxxxxxxxxxxxxxxxxxxxx
xxxxxxxxxxxxxxxxxxxxxxxxxxxxxxxxxxxxxxxxxxxxxxxxxxxxxxxxxxxxxxxxxxxxxxxxxxxxxxxxxxxxxxxxxxxxxxxxxxx
xxxxxxxxxxxxxxxxxxxxxxxxxxxxxxxxxxxxxxxxxxxxxxxxxxxxxxxxxxxxxxxxxxxxxxxxxxxxxxxxxxxxxxxxxxxxxxxxxxx
xxxxxxxxxxxxxxxxxxxxxxxxxxxxxxxxxxxxxxxxxxxxxxxxxxxxxxxxxxxxxxxxxxxxxxxxxxxxxxxxxxxxxxxxxxxxxxxxxxx
xxxxxxxxxxxxxxxxxxxxxxxxxxxxxxxxxxxxxxxxxxxxxxxxxxxxxxxxxxxxxxxxxxxxxxxxxxxxxxxxxxxxxxxxxxxxxxxxxxx
xxxxxxxxxxxxxxxxxxxxxxxxxxxxxxxxxxxxxxxxxxxxxxxxxxxxxxxxxxxxxxxxxxxxxxxxxxxxxxxxxxxxxxxxxxxxxxxxxxx
xxxxxxxxxxxxxxxxxxxxxxxxxxxxxxxxxxxxxxxxxxxxxxxxxxxxxxxxxxxxxxxxxxxxxxxxxxxxxxxxxxxxxxxxxxxxxxxxxxx
xxxxxxxxxxxxxxxxxxxxxxxxxxxxxxxxxxxxxxxxxxxxxxxxxxxxxxxxxxxxxxxxxxxxxxxxxxxxxxxxxxxxxxxxxxxxxxxxxxx
xxxxxxxxxxxxxxxxxxxxxxxxxxxxxxxxxxxxxxxxxxxxxxxxxxxxxxxxxxxxxxxxxxxxxxxxxxxxxxxxxxxxxxxxxxxxxxxxxxx
xxxxxxxxxxxxxxxxxxxxxxxxxxxxxxxxxxxxxxxxxxxxxxxxxxxxxxxxxxxxxxxxxxxxxxxxxxxxxxxxxxxxxxxxxxxxxxxxxxx
xxxxxxxxxxxxxxxxxxxxxxxxxxxxxxxxxxxxxxxxxxxxxxxxxxxxxxxxxxxxxxxxxxxxxxxxxxxxxxxxxxxxxxxxxxxxxxxxxxx
xxxxxxxxxxxxxxxxxxxxxxxxxxxxxxxxxxxxxxxxxxxxxxxxxxxxxxxxxxxxxxxxxxxxxxxxxxxxxxxxxxxxxxxxxxxxxxxxxxx
xxxxxxxxxxxxxxxxxxxxxxxxxxxxxxxxxxxxxxxxxxxxxxxxxxxxxxxxxxxxxxxxxxxxxxxxxxxxxxxxxxxxxxxxxxxxxxxxxxx
xxxxxxxxxxxxxxxxxxxxxxxxxxxxxxxxxxxxxxxxxxxxxxxxxxxxxxxxxxxxxxxxxxxxxxxxxxxxxxxxxxxxxxxxxxxxxxxxxxx
xxxxxxxxxxxxxxxxxxxxxxxxxxxxxxxxxxxxxxxxxxxxxxxxxxxxxxxxxxxxxxxxxxxxxxxxxxxxxxxxxxxxxxxxxxxxxxxxxxx
xxxxxxxxxxxxxxxxxxxxxxxxxxxxxxxxxxxxxxxxxxxxxxxxxxxxxxxxxxxxxxxxxxxxxxxxxxxxxxxxxxxxxxxxxxxxxxxxxxx
xxxxxxxxxxxxxxxxxxxxxxxxxxxxxxxxxxxxxxxxxxxxxxxxxxxxxxxxxxxxxxxxxxxxxxxxxxxxxxxxxxxxxxxxxxxxxxxxxxx
xxxxxxxxxxxxxxxxxxxxxxxxxxxxxxxxxxxxxxxxxxxxxxxxxxxxxxxxxxxxxxxxxxxxxxxxxxxxxxxxxxxxxxxxxxxxxxxxxxx
xxxxxxxxxxxxxxxxxxxxxxxxxxxxxxxxxxxxxxxxxxxxxxxxxxxxxxxxxxxxxxxxxxxxxxxxxxxxxxxxxxxxxxxxxxxxxxxxxxx
xxxxxxxxxxxxxxxxxxxxxxxxxxxxxxxxxxxxxxxxxxxxxxxxxxxxxxxxxxxxxxxxxxxxxxxxxxxxxxxxxxxxxxxxxxxxxxxxxxx
xxxxxxxxxxxxxxxxxxxxxxxxxxxxxxxxxxxxxxxxxxxxxxxxxxxxxxxxxxxxxxxxxxxxxxxxxxxxxxxxxxxxxxxxxxxxxxxxxxx
xxxxxxxxxxxxxxxxxxxxxxxxxxxxxxxxxxxxxxxxxxxxxxxxxxxxxxxxxxxxxxxxxxxxxxxxxxxxxxxxxxxxxxxxxxxxxxxxxxx
xxxxxxxxxxxxxxxxxxxxxxxxxxxxxxxxxxxxxxxxxxxxxxxxxxxxxxxxxxxxxxxxxxxxxxxxxxxxxxxxxxxxxxxxxxxxxxxxxxx
xxxxxxxxxxxxxxxxxxxxxxxxxxxxxxxxxxxxxxxxxxxxxxxxxxxxxxxxxxxxxxxxxxxxxxxxxxxxxxxxxxxxxxxxxxxxxxxxxxx
xxxxxxxxxxxxxxxxxxxxxxxxxxxxxxxxxxxxxxxxxxxxxxxxxxxxxxxxxxxxxxxxxxxxxxxxxxxxxxxxxxxxxxxxxxxxxxxxxxx
xxxxxxxxxxxxxxxxxxxxxxxxxxxxxxxxxxxxxxxxxxxxxxxxxxxxxxxxxxxxxxxxxxxxxxxxxxxxxxxxxxxxxxxxxxxxxxxxxxx
xxxxxxxxxxxxxxxxxxxxxxxxxxxxxxxxxxxxxxxxxxxxxxxxxxxxxxxxxxxxxxxxxxxxxxxxxxxxxxxxxxxxxxxxxxxxxxxxxxx
xxxxxxxxxxxxxxxxxxxxxxxxxxxxxxxxxxxxxxxxxxxxxxxxxxxxxxxxxxxxxxxxxxxxxxxxxxxxxxxxxxxxxxxxxxxxxxxxxxx
xxxxxxxxxxxxxxxxxxxxxxxxxxxxxxxxxxxxxxxxxxxxxxxxxxxxxxxxxxxxxxxxxxxxxxxxxxxxxxxxxxxxxxxxxxxxxxxxxxx
xxxxxxxxxxxxxxxxxxxxxxxxxxxxxxxxxxxxxxxxxxxxxxxxxxxxxxxxxxxxxxxxxxxxxxxxxxxxxxxxxxxxxxxxxxxxxxxxxxx
xxxxxxxxxxxxxxxxxxxxxxxxxxxxxxxxxxxxxxxxxxxxxxxxxxxxxxxxxxxxxxxxxxxxxxxxxxxxxxxxxxxxxxxxxxxxxxxxxxx
xxxxxxxxxxxxxxxxxxxxxxxxxxxxxxxxxxxxxxxxxxxxxxxxxxxxxxxxxxxxxxxxxxxxxxxxxxxxxxxxxxxxxxxxxxxxxxxxxxx
xxxxxxxxxxxxxxxxxxxxxxxxxxxxxxxxxxxxxxxxxxxxxxxxxxxxxxxxxxxxxxxxxxxxxxxxxxxxxxxxxxxxxxxxxxxxxxxxxxx
xxxxxxxxxxxxxxxxxxxxxxxxxxxxxxxxxxxxxxxxxxxxxxxxxxxxxxxxxxxxxxxxxxxxxxxxxxxxxxxxxxxxxxxxxxxxxxxxxxx
xxxxxxxxxxxxxxxxxxxxxxxxxxxxxxxxxxxxxxxxxxxxxxxxxxxxxxxxxxxxxxxxxxxxxxxxxxxxxxxxxxxxxxxxxxxxxxxxxxx
xxxxxxxxxxxxxxxxxxxxxxxxxxxxxxxxxxxxxxxxxxxxxxxxxxxxxxxxxxxxxxxxxxxxxxxxxxxxxxxxxxxxxxxxxxxxxxxxxxx
xxxxxxxxxxxxxxxxxxxxxxxxxxxxxxxxxxxxxxxxxxxxxxxxxxxxxxxxxxxxxxxxxxxxxxxxxxxxxxxxxxxxxxxxxxxxxxxxxxx
xxxxxxxxxxxxxxxxxxxxxxxxxxxxxxxxxxxxxxxxxxxxxxxxxxxxxxxxxxxxxxxxxxxxxxxxxxxxxxxxxxxxxxxxxxxxxxxxxxx
The Cost of Federal
Regulation to the U.S.
Economy, Manufacturing
and SmallBusiness
A Report for the National Association of Manufacturers
By W. Mark Crain and Nicole V. Crain

The Cost of Federal Regulation to the
U.S. Economy, Manufacturing and Small
Business
A Report for the National Association of Manufacturers
By W. Mark Crain and Nicole V. Crain
Released September 10, 2014
Table of Contents I. Purpose and Highlights ....................................................................................................... 1
II. Survey of Manufacturers ..................................................................................................... 7
III. Estimating the Total Cost of Regulations ...........................................................................27
IV. Incidence of Regulatory Costs ...........................................................................................41
V. Summary Comments .........................................................................................................54
References ...............................................................................................................................57
Appendix A. Estimating In-House FTE Costs ...........................................................................62
Appendix B. Alternative Use of Funds Presently Allocated to Regulatory Compliance .............65
Appendix C. Estimating the Cost of Economic Regulation........................................................68
Appendix D. Regulatory Costs by Firm Size Using Alternative Firm-Size Categories ...............72

1
I. Purpose and Highlights
This study estimates the costs of U.S. federal government regulations as of 2012. The
paltry amount of public information on regulatory costs may astonish entrepreneurs and job
creators who navigate a complex web of regulations on a daily basis—including uncertainty
about what the rules are and how they might change from one year to the next. The purpose of
this study is to fill in some of that information gap by quantifying the costs of regulatory
compliance on firms, particularly manufacturers in the United States, and to extend some of the
previous efforts to measure the aggregate regulatory costs. The goal is to provide an estimate
of the total cost of federal regulations analogous to the taxes raised to finance the federal
budget.
Some Key Findings: The Cost of Federal Regulation
U.S. federal government regulations cost an estimated $2.028 trillion in 2012 (in 2014
dollars), an amount equal to 12 percent of GDP. Regulatory costs are distributed across major
business types and among firms of different sizes; the findings of this report indicate that
compliance costs fall disproportionately on small businesses. Table 1 summarizes the incidence
of costs by firm size based on aggregate data for all sectors of the U.S. economy.
Considering all federal regulations, all sectors of the U.S. economy and all firm sizes,
federal regulations cost just less than $10,000 per employee per year in 2012 (in 2014 dollars).
Small firms with fewer than 50 employees incur regulatory costs ($11,724 per employee per
year) that are 17 percent greater than the average firm. The cost per employee is $10,664 for
medium-sized firms and $9,083 for large firms. These estimates are consistent with prior studies
completed during the past 25 years,1 which have shown that the cost of regulatory compliance
disproportionately affects small firms.
1 Studies on the incidence of regulatory costs among firms of different sizes include Cole and Sommers
(1980), Gaston and Carroll (1984), Hopkins (1995a), Beale and Lin (1998), Crain and Hopkins (2001), Crain (2005) and Crain and Crain (2010).

2
Table 1. Regulatory Costs in Small, Medium-Sized and Large Firms, 2012* (Cost per Employee per Year in 2014 Dollars)
Type of Regulation Cost per Employee for All Business Types
All Firms < 50
Employees 50–99
Employees 100+
Employees All Federal Regulations $ 9,991 $ 11,724 $ 10,664 $ 9,083 Economic $ 6,381 $ 5,662 $ 7,464 $ 6,728 Environmental $ 1,889 $ 3,574 $ 1,338 $ 1,014 Tax Compliance $ 960 $ 1,518 $ 1,053 $ 694 OSHHS** $ 761 $ 970 $ 809 $ 647
Notes to Table 1:
* The cost per employee for each firm-size category uses employment shares for the respective business sectors to compute the weighted averages.
** OSHHS stands for occupational safety and health and homeland security regulations.
Table 2. Regulatory Costs in the Manufacturing Sector by Firm Size, 2012* (Cost per Employee per Year in 2014 Dollars)
Type of Regulation Cost per Employee for Manufacturing
All Firms < 50
Employees 50–99
Employees 100+
Employees All Federal Regulations $ 19,564 $ 34,671 $ 18,243 $ 13,750 Economic $ 7,958 $ 12,885 $ 9,399 $ 6,544 Environmental $ 10,497 $ 20,361 $ 7,625 $ 6,239 Tax Compliance $ 295 $ 378 $ 346 $ 269 OSHHS** $ 813 $ 1,048 $ 873 $ 698
Notes to Table 2:
* The cost per employee for each firm-size category uses employment shares for the respective business sectors to compute the weighted averages.
** OSHHS stands for occupational safety and health and homeland security regulations.
Columns might not total due to rounding.
Table 2 summarizes the costs of federal regulations for the manufacturing sector. The
regulatory cost disadvantage facing small firms is greatly amplified in the manufacturing sector,
with small manufacturing firms bearing more than two-and-a-half times (152 percent) the cost
per employee of large manufacturing firms. Overall, small manufacturers incur regulatory costs
that are more than three times (247 percent) the cost borne by the average U.S. company.
Medium-sized manufacturers in the United States face regulatory costs that are 33 percent
greater than large manufacturers and 83 percent greater than the average U.S. firm.
Chart 1 illustrates the distribution of regulatory costs on firms in the manufacturing sector
relative to all U.S. firms and firms of different sizes. Manufacturing firms overall incurred an

3
average cost of $19,564 per employee in 2012, roughly double the cost on businesses
economy-wide. Small manufacturing firms incurred an average cost of almost $35,000 per
employee—about three times the cost incurred by small businesses economy-wide.
Chart 1. Regulatory Cost per Employee, 2012 (in 2014 Dollars)
The underlying force driving this differential cost burden is easy to understand. Some of
the costs associated with regulatory compliance are fixed costs, so a firm with 20 employees
incurs roughly the same expense as a firm with 500 employees. Large firms spread these fixed
costs over larger revenues, or output, and larger employee base, resulting in lower costs per
unit of output as the firm size increases. This familiar empirical phenomenon, known as
economies of scale, provides a comparative cost advantage to large firms over small firms.2
Comparison to Prior Studies of the Aggregate Cost of Federal Regulation
Since 1997, the U.S. Office of Management and Budget (OMB) has authored the Report
to Congress on the Benefits and Costs of Federal Regulations and Unfunded Mandates on
2 For a theoretical discussion, see Brock and Evans (1986), particularly chapters four and five. A survey
and extension of this literature is provided by Bradford (2004).
$9,991 $11,724 $10,664
$9,083
$19,564
$34,671
$18,243
$13,750
$0
$10,000
$20,000
$30,000
$40,000
Average < 50 Employees 50–99 Employees
100+Employees
All Firms Manufacturing

4
State, Local and Tribal Entities (Report to Congress). The May 2014 Draft Report to Congress
notes that during fiscal years (FY) 2004 to 2013, agencies published 37,022 rules, including 569
major rules,3 which include regulations that have an anticipated annual economic impact of at
least $100 million. The 2014 Draft Report to Congress includes cost estimates for only 116 of
these rules, or 0.3 percent of the regulations published during the 10-year period.4
In its report, OMB only includes information on major, significant or economically
significant rules, which make up a small fraction of the total number of rules in the pipeline or
finalized. The number of regulations with cost-benefit analysis represents an even smaller
proportion of total regulations. OMB estimates the total costs of the 116 rules to range between
$68.5 billion and $101.8 billion in 2010 dollars, or $74 billion to $110 billion when converted to
2014 dollars.
In summary, the constraints under which OMB operates yield cost estimates for only a
small proportion of regulations. For this subset of regulations, the highest estimate of regulatory
costs is less than 1 percent of GDP. As OMB notes in the Draft Report to Congress:
[B]ecause these estimates exclude non-major rules and rules adopted more than ten years ago, the total benefits and costs of all federal rules now in effect are likely to be significantly larger than the sum of the benefits and costs reported . . . . More research would be necessary to produce comprehensive current estimates of total benefits and costs for all agencies and programs, though some agencies have developed valuable comprehensive assessments of the benefits and costs of their programs.
5
3 The Congressional Review Act (5 U.S.C. § 804(2)) defines a “major rule” as any rule that would have an
annual effect on the economy of $100 million or more; result in a major increase in costs or prices for consumers, individual industries, federal, state or local government agencies, or geographic regions; or would result in significant adverse effects on competition, employment, investment, productivity, innovation or on the ability of U.S.-based enterprises to compete with foreign-based enterprises in domestic and export markets. The term does not include any rule promulgated under the Telecommunications Act of 1996 and the amendments made by that Act.
4 OMB openly describes the limited scope of its 2014 Draft Report to Congress, stating (p. 8): “From fiscal
year 2004 (FY 2004) through FY 2013, federal agencies published 37,022 final rules in the Federal Register. OMB reviewed 3,040 of these final rules under Executive Orders 12866 and 13563. Of these OMB-reviewed rules, 569 are considered major rules, primarily as a result of their anticipated impact on the economy (i.e., an impact of $100 million in at least one year). . . . The estimates are therefore not a complete accounting of all the benefits and costs of all regulations issued by the federal government during this period.” The 116 regulations included in the OMB’s report is thus a fraction of the 37,022 published over this 10-year period.
5 OMB, Office of Information and Regulatory Affairs (2014), 2014 Draft Report to Congress on the
Benefits and Costs of Federal Regulations and Unfunded Mandates on State, Local and Tribal Entities, p. 18.

5
This study seeks to update previous estimates of the comprehensive cost of federal
regulation. Since 1992, the U.S. Small Business Administration’s (SBA) Office of Advocacy has
commissioned four studies to examine the impact of federal regulations on small firms.6 As part
of the analysis required to estimate this impact, total regulatory costs were estimated. The most
recent study issued in 2010 estimated the total costs at $1.91 trillion in 2008 (in 2014 dollars).7
In this updated study, the estimate for 2012 is 6 percent higher than the SBA-commissioned
study figure for 2008, adjusted for inflation. To put this 6 percent increase in perspective, we
note that the OMB estimate of the costs of regulations in FY 2012 increased 27 percent from its
FY 2008 estimate for the regulations on which it reports.8
OMB emphasizes that deriving a cost estimate for regulations presents a host of
challenges, stating in its 2014 Draft Report to Congress: “While the estimates in this report
provide valuable information about the effects of regulations, they should not be taken to be
either precise or complete.”9 Such a caveat obviously applies to this study as well.
In part, the sheer volume and complexity of federal regulations and the rate at which
they proliferate makes estimation daunting. Comprehensive cost accounting to analyze
regulations one by one would require vast resources. Even the relatively few major rules often
elude the analytical capacity of agency specialists who monetize costs and benefits. For the
most part, the volume of regulations and their complexity have discouraged attempts by
6 The SBA commissioned four studies to examine the distribution of federal regulatory costs in small
versus larger firms: Hopkins (1995b); Crain and Hopkins (2001); Crain (2005); and Crain and Crain (2010). Following the initial Hopkins (1995a) methodology, the subsequent reports approached this task by first estimating a total cost and then allocating the cost among small, medium-sized and large firms and across major business sectors. Direct comparisons between this estimate for 2012 and other studies must be cautiously made because new estimation methodologies introduced in this study were not possible previously, and the data sources vary over time.
7 Crain and Crain (2010). The 2010 study estimated total regulatory costs to be $1.75 trillion in 2008
(denominated in 2009 dollars). This number has been converted to 2014 dollars for comparative purposes.
8 Derived from the OMB 2009 Report to Congress, p. 2, and the OMB 2013 Report to Congress, pp. 2–3.
9 OMB, Office of Information and Regulatory Affairs (2014), 2014 Draft Report to Congress on the
Benefits and Costs of Federal Regulations and Unfunded Mandates on State, Local and Tribal Entities, p. 3.

6
government agencies and private researchers to generate a comprehensive estimate of
regulatory costs.
The measurement challenges lead us to adopt techniques in this study that facilitate
reasonable approximations of regulatory costs that have been omitted in estimates by OMB and
other studies. We rely on OMB-provided estimates for regulations when possible. As discussed
in Section III, for other regulations, we rely on techniques from the expanding volume of
literature on institutional quality and economic performance to gather evidence on the
macroeconomic consequences of economic regulations. The results from an extensive new
survey of manufacturing firms’ regulatory compliance activities supplement and complement
these estimating approaches.
As a final introductory perspective, we stress that the study is unconcerned about a
benefit-cost calculus for any specific regulation or regulations as a whole. We make no claims
about whether regulations are good or bad, desirable or undesirable. Rather, we attempt to
produce an aggregate cost estimate and apportion these costs across sectors and firm sizes.
The remainder of the report proceeds as follows. Section II presents the findings from an
extensive survey of manufacturing firms in the United States on regulatory compliance activities
and costs. Section III describes our procedures for estimating the total cost of federal
regulations. Section IV provides a snapshot of the distribution of these costs. Section V offers
concluding comments.

7
II. Survey of Manufacturers
A survey of National Association of Manufacturers (NAM) members was conducted
between March 24, 2014, and April 7, 2014, with the purpose of evaluating the effect of
regulations on manufacturing in the United States. According to the Census Bureau,
manufacturing accounts for 11 percent of all U.S. industry payroll expenses (see Table 8c).
Cost estimates calculated from survey data only include the direct cost of federal
government regulations. Based on responses to open-ended questions, we can infer other real
costs that are inestimable based on the survey data. For example, responses indicate that if the
cost of federal regulation was reduced, funds presently allocated toward compliance would
become expenditures for employee compensation and hiring, capital, research and
development (R&D), sales and marketing, enhancing price competitiveness, debt reduction or
improving return on investment (ROI). The motivation for reallocation to these areas is to
enhance competitiveness relative to other domestic and international producers.
Businesses bear other indirect costs as well. Respondents noted that regulations
introduce uncertainty into planning and affect business operations, the consequences of which
include delaying employment and investment decisions, moving operations off-shore and stifling
growth opportunities to avoid regulations that apply to larger firm sizes.
The OMB 2014 Draft Report to Congress discusses the consequences of regulation on
the labor market. Regulations may cause businesses to shut down or stifle their plans for
growth, although other sectors of the economy may benefit. In the long run, the employment
effect of a single regulation may not cause great concern in terms of the unemployment rate
because employment may shift between sectors. This shifting is likely to slow down during
recessions and may disproportionately harm less educated and younger workers who, for
example, experienced a higher rate of unemployment (than the national average) during the

8
past recession.10 The cumulative cost of regulations over time may include sectoral distortions in
employment and reducing innovation and competitiveness for the regulated firms.
Business Challenges
Respondents were asked to identify the challenges affecting their businesses and could
choose more than one. Chart 2 shows the results of this question. Nearly 90 percent of
respondents identified federal government regulations as a challenge that affected their
business in the prior year or that their business will face in the future. Attracting and retaining
productive employees (58 percent) and attracting and retaining customers (42 percent) were a
distant second and third challenge. Only 15 percent of respondents selected access to finance
and cash flow generation. Challenges in the “other” category included federal and state taxes,
state and local regulations, health care costs, lawsuit management, competition and the state of
the economy.
Chart 2. Survey Respondents: Recent and Future Challenges Affecting Business
10
OMB, Office of Information and Regulatory Affairs (2014), 2014 Draft Report to Congress on the Benefits and Costs of Federal Regulations and Unfunded Mandates on State, Local and Tribal Entities, pp. 40–43. The literature suggests that there can be some negative labor market outcomes, including implications for wages and employment, particularly in the short run.
8%
15%
20%
24%
42%
58%
88%
0% 20% 40% 60% 80% 100%
Other
Finance/Cash Flow
Construction or Maintenance
R&D or Production
Attract/Retain Customers
Employee Issues
Federal Regulations

9
Federal Government Requirements
Use of Outside Advisers
Respondents were asked whether they hired outside advisers to assist their business
with complying with federal regulations. A large majority of respondents (72 percent) indicated
that their organization employed outside advisers to ensure that operations complied with
federal rules. Larger firms are more likely to seek outside assistance than small or medium-
sized firms. In addition, respondents indicated that firms of any size are more likely than not to
incur compliance-related costs for outside assistance.11 Chart 3 shows the breakdown by firm
size.
Chart 3. Survey Respondents: Firms That Employed Outside Advisers to Comply with Federal Regulations
If a respondent indicated that his or her business employed an outside adviser, follow-up
questions were asked to identify the type of outside expertise required and the cost of the
11
Some firms did not seek outside assistance, and others sought outside assistance but did not report a cost. The average figures that follow represent those for firms that sought outside assistance. The actual spending reported was between zero dollars and $25,000,000 (one firm).
58% 70%
82%
42% 30%
18%
0%
20%
40%
60%
80%
100%
Small (0–50 Employees)
Medium (51–100 Employees)
Large(101+ Employees)
Employed Outside Advisers Did Not Employ Outside Advisers

10
assistance received. Chart 4 shows the types of outside assistance required by firms. The most
frequently consulted advisers were attorneys (84 percent), accountants (70 percent),
consultants (65 percent), human resources or labor regulations advisers (45 percent) and
OSHA [the Occupational Safety and Health Administration]/permitting assistance and
development advisers (34 percent).
Chart 4. Type of Outside Adviser Employed to Comply with Federal Law
For respondents who indicated that their organization used outside advisers in the 12
months preceding the survey, services cost on average $43,641 for each small firm, $80,681 for
each medium-sized firm and $447,245 for each large firm.
4%
11%
13%
14%
27%
34%
45%
65%
70%
84%
0% 20% 40% 60% 80% 100%
Other
Remediation Contractors
Government Affairs Professionals
Regulatory Assessors
Outside Analytical andMonitoring Service Providers
OSHA/Permitting Assistance andDevelopment Advisers
Human Resources or LaborRegulations Advisers
Consultants
Accountants
Attorneys

11
Using the data as the basis for estimating the cost for manufacturing in the United States
as a whole indicates that outside assistance to fulfill federal government requirements cost
$12.1 billion during the 12 months preceding the survey.12
Subject of Federal Government Enforcement or Compliance Activities
Respondents were asked whether their company had been the subject of federal
government compliance activity during the 12 months preceding the survey. Note that just
because a firm was the subject of government activity does not mean that the firm was found to
be noncompliant. If respondents answered affirmatively, follow-up questions were asked to
determine whether their company paid an administrative or judicial penalty, fines or restitution or
undertook activities to return to compliance. Respondents were asked to provide the cost
associated with these actions.
The vast majority of respondents indicated that their organization was not the subject of
federal government enforcement or compliance activity in the previous 12 months. Overall, 21
percent of respondents incurred a cost as the result of federal government compliance activity.
The average cost for these firms was $83,077.
Using these findings to estimate the cost to manufacturing in the United States as a
whole indicates that federal government compliance activity imposed a total cost of
approximately $2.4 billion in the 12 months preceding the survey. This figure is likely a
conservative estimate because it does not include the cost of Supplemental Environmentally
Beneficial Projects (SEPs), which impose costs on participating firms. Relatively few survey
respondents indicated that their firm negotiated and was approved to complete an SEP.13
12
Extrapolating costs provided by survey respondents (n = 577) to the population of manufacturers in the United States provides estimates that are significant for a 95 percent confidence interval (α = 0.05); the margin of error is +/- 5 percent. Responses came from all parts of the country, in a wide variety of manufacturing sectors and in varying size classifications, and, as such, they likely are fairly representative of the overall manufacturing population.
13 An ECHO search (echo.epa.gov) yielded about the same figure, although that search did not yield
recent settlements.

12
Capital Equipment or Tangible Item Purchases and Emission Offsets
Respondents were asked whether their company purchased new capital equipment or
other tangible items to comply with federal government data, reporting requirements, regulatory
constraints or mandates. If a respondent answered affirmatively, he or she was asked the cost
of the tangible item(s) purchased to comply with federal government requirements. The cost to
firms whose respondents indicated that tangible items purchased in the 12 months preceding
the survey averaged $39,069 for small firms, $75,528 for medium-sized firms and $2,354,720
for large firms.
Thirty-eight percent of respondents indicated that their organization purchased new
capital equipment or other tangible items to comply with federal government requirements. The
majority of respondents representing large firms (58 percent) invested in tangible items to
satisfy federal government requirements. Forty-four percent of medium-sized firms and 35
percent of small firms incurred these costs. Large firms were more likely to incur tangible costs,
and their per-firm cost was higher than smaller firms.
Respondents also provided information on the cost of emission credit allowances or
offsets in the 12 months preceding the survey. Only respondents from large firms reported
incurring these costs. Relatively speaking, these costs were minor, although recent rulings may
impose higher costs not included in the data.14 Relatively few respondents’ firms purchased
emission credit allowances or offsets; the median reported cost was $24,217. There was no
extrapolation to manufacturing as a whole for emission credit or offsets purchase data; only
reported figures were included, so the figure may be low.
14
The data from this survey is for the 12-month period preceding the survey and does not include EPA rules issued after early April 2014, including rules concerning carbon dioxide emissions.

13
Chart 5. Survey Respondents: Firms That Purchased Tangible Items to Comply with Federal Government Requirements
Chart 6. Survey Respondents: Firms That Purchased Emission Credit Allowances or Offsets During Preceding 12 Months
Using the data to estimate the cost to manufacturing as a whole indicates that purchases
of capital equipment or other tangible items and emission credit allowances to comply with
federal government data, reporting requirements, regulatory constraints or mandates required
35% 44%
58%
65% 56%
42%
0%
20%
40%
60%
80%
100%
Small (0–50 Employees)
Medium (51–100 Employees)
Large(101+ Employees)
Purchased Item to Comply Did Not Purchase Item to Comply
4%
96%
Purchased Credits Did Not Purchase Credits

14
expenditures of approximately $18.6 billion by the manufacturing sector during the 12 months
preceding the survey.
Operations and Maintenance for Capital Equipment or Other Tangible Items
Respondents were asked whether their company had operations and maintenance
(O&M) expenses for capital equipment and other tangible items purchased to comply with
federal government requirements during the previous 12 months. If a respondent answered
affirmatively, that respondent was asked to provide that cost. The survey revealed that roughly
half (48 percent) of manufacturing firms incurred O&M expenses for tangible compliance-related
purchases, at an average of $17,306 for small firms, $58,413 for medium-sized firms and
$1,023,251 for large firms during the 12 months prior.
O&M expenses for compliance-related purchases vary by firm size. While 48 percent of
overall respondents reported having these expenditures, the percentage varies when separating
responses by firm size. Large firms are more likely to have O&M expenses than medium-sized
firms, and their expenses are on average higher. Medium-sized firms are more likely to have
O&M expenses for tangible compliance-related purchases than small firms, and they are on
average higher.
Using the data to estimate the cost to manufacturing as a whole indicates that O&M of
capital equipment or other tangible items to comply with federal government requirements
motivated expenditures of approximately $10.7 billion by the manufacturing sector during the 12
months preceding the survey.

15
Chart 7. Survey Respondents: Firms That Incurred O&M Expenses to Comply with Federal Regulations
Full-Time Equivalents Devoted to Regulatory Compliance
Respondents were asked how many in-house full-time equivalents (FTEs) by occupation
were devoted to federal regulatory compliance activities in their firm. On average, respondents
estimated 10.2 FTEs. As Chart 8 shows, respondents indicated that skilled and unskilled labor
combined made up 43 percent of the time spent on compliance activities, administrative staff
made up 21 percent of the FTEs, and accounting followed at a distant third with 16 percent.
Nine percent and 5 percent of the total compliance-allocated FTEs devoting time to regulatory
compliance are executives and attorneys, respectively.
The cost of in-house FTEs devoted to compliance varies depending on the distribution of
the occupations of the employees. The categories of FTEs, in descending order of cost,
included attorneys, executives, administrative personnel, accounting, other, skilled labor and
unskilled labor (see Appendix A for details and sources). The survey reveals that as a firm’s size
increases, the number of on-staff FTEs devoted to regulatory compliance activities expectedly
increases as well. Average FTEs allocated to compliance as reported by respondents from
35% 44%
58%
65% 56%
42%
0%
20%
40%
60%
80%
100%
Small (0–50 Employees)
Medium (51–100 Employees)
Large(101+ Employees)
Incurred O&M Expenses Did Not Incur O&M Expenses

16
small firms was 2.5. Medium-sized and large firm FTEs were 4.3 and 17.0 FTEs, respectively.
Firms with fewer employees have fewer FTEs devoted to compliance, and they have lower
compliance-related total compensation costs. Small and medium-sized firms’ employee benefit
costs are typically lower than large firms’ cost (see Appendix A), so it is likely that FTEs tasked
with federal regulatory compliance activities cost less for small and medium-sized firms (relative
to large firms) on a per-firm basis for the same category of employee type.
Chart 8. Survey Respondents: FTEs Devoted to Compliance by Occupation
Note to Chart 8:
Due to rounding, percentage totals sum to 99 percent.
Chart 9 shows the distribution of in-house employees devoted to regulatory compliance
by firm size. Administration as a percentage of compliance FTEs is the greatest single category
for firms of all sizes. However, small firms rely more heavily on in-house administrative
personnel for compliance than medium-sized or large firms, at 35 percent, 24 percent and 20
percent, respectively. Large firms use fewer executives (7 percent) than small and medium-
sized firms (22 percent and 18 percent), but more skilled labor (27 percent versus 11 percent for
small firms and 22 percent for medium-sized firms). The percentage of in-house FTE accounting
professionals remains about the same across firm sizes, in the 16 to 17 percent range.
Other, 5% Attorney, 5%
Executive, 9%
Accounting, 16%
Administrative, 21%
Unskilled Labor, 18%
Skilled Labor, 25%

17
Chart 9. Survey Respondents: Compliance FTEs by Employee Category Across Firm Size
Estimated costs of FTEs devoted to federal regulatory compliance are the highest single
cost estimate discussed in this section. To estimate the cost, responses regarding FTEs
devoted to compliance were initially sorted by firm size. In each case, the cost of reported FTEs
by employment category were calculated and then summed to create a total FTEs’ cost by firm-
size grouping. This figure was then converted to a per-firm figure. (Appendix A provides a
discussion on how wage costs were adjusted to include benefits to arrive at average total
compensation paid per firm by firm-size category.)
Using total compensation per firm by firm size and Census Bureau data for the number
of firms by firm-size group, we estimated for small, medium-sized and large firms the total cost
of FTEs devoted to federal regulatory compliance activities in the manufacturing sector. Finally,
we added up the results from small, medium-sized and large firms. Chart 10 shows the
distribution of these costs between smaller and larger firms. The resulting estimated cost for the
12 months preceding the survey is $94.8 billion.
0%
5%
10%
15%
20%
25%
30%
35%
40%
Small Firms Medium Firms Large Firms

18
Chart 10. Survey Respondents: Estimated Total Cost of FTEs Devoted to Federal Regulatory Compliance (in Billions of Dollars)
Small firms bear a disproportionate burden of the in-house costs of FTEs devoted to
compliance, on a per-employee basis and relative to medium-sized and large firms. Chart 11
illustrates the difference in costs by firm size. The costs borne by small firms, on a per-
employee basis, are about 10 times that of large firms.
Chart 11. Survey Respondents: Per-Employee Cost of FTEs Devoted to Federal Regulatory Compliance (Including Benefits)
$70.576 $24.184
$0 $25 $50 $75 $100
Total Cost = $94.760 Billion
Number of Firms = 254,941
Small/Medium Manufacturers Large Manufacturers
$31,580
$6,656
$3,008
$20,231
$0
$5,000
$10,000
$15,000
$20,000
$25,000
$30,000
$35,000
Small Firms Medium Firms Large Firms All Firms

19
Total Direct Cost of Federal Government Regulations
Taking each of the previously discussed components for which we estimated regulation-
related outlays from survey responses and aggregating them provides an overall estimate of
much of the direct costs of regulations for the manufacturing sector. However, the component
(or cost estimate by type of cost) information does not indicate the relative costs of different
categories of federal regulations.
Chart 12 shows respondents’ perspective on various types of regulations, based on their
ranking of categories of federal government regulations in terms of costs of compliance. In their
ranking, they were asked to consider staff time, the employment of outside advisers and
changes to operating procedures or plans.15
Respondents ranked labor and environmental regulations as the highest cost regulations
(labor at 33 percent and environmental at 29 percent). Furthermore, more than half of the
respondents ranked labor regulations as either the most costly or the second most costly
regulations, and the same is true for environmental regulations. Food and Drug Administration
(FDA) regulations were most often ranked last, in ninth place, in terms of cost.16 Charts 13 and
14 show the breakdown of labor and environmental regulations selected by respondents by firm
size.
15
There are nine categories: Labor, Environmental, Other (e.g., Tax Compliance), Consumer Product Safety, Financial, Energy, FDA, Product Licensing and Transportation. Each respondent ranked the categories from most costly to least costly. Each category (e.g., Labor) was ranked by each respondent, so each category sums to 100 percent. Also, since each respondent ranked all nine categories, each ranking (e.g., fifth most costly) sums to 100 percent. 16
OMB reports that the rules with the highest estimated cost, by far, come from the EPA. (2014 Draft Report to Congress, p. 13.) However, cost data are not available for the vast majority of regulations.

20
Chart 12. Survey Respondents: Regulatory Compliance by Category and Cost
These two types of regulations, therefore, likely contribute the most to the total direct
cost of regulation. They include hiring employees and consultants; purchasing and maintaining
tangible items; and other compliance-related costs. As illustrated in Chart 15, the five categories
included in the estimate are outside advisers, federal compliance/enforcement activity, capital
equipment/tangible items and offsets, O&M of tangible items and FTEs devoted to compliance.
Of these, the largest cost is the in-house FTEs devoted to compliance.
0% 20% 40% 60% 80% 100%
Transportation
Product Licensing
FDA
Energy
Financial
Consumer Product Safety
Other (e.g., Tax Compliance)
Environmental
Labor
Ranked as Most Costly Ranked as Second Most Costly Ranked as Third Most Costly
Ranked as Fourth Most Costly Ranked as Fifth Most Costly Ranked as Sixth Most Costly
Ranked as Seventh Most Costly Ranked as Eighth Most Costly Ranked as Least Costly

21
Chart 13. Survey Respondents: Labor Regulations—Ranking by Firm Size (1 = Most Costly; 9 = Least Costly)
Chart 14. Survey Respondents: Environmental Regulations—Ranking by Firm Size (1 = Most Costly; 9 = Least Costly)
0%
10%
20%
30%
40%
1Most
Costly
2 3 4 5 6 7 8 9LeastCostly
Small (0–50 Employees) Medium (51–100 Employees) Large (100+ Employees)
0%
10%
20%
30%
40%
1Most
Costly
2 3 4 5 6 7 8 9LeastCostly
Small (0–50 Employees) Medium (51–100 Employees) Large (100+ Employees)

22
Chart 15. Estimates of Direct Regulatory Costs on Manufacturers (in Billions of 2014 Dollars)
The survey results suggest that in the year prior to the survey, outlays required by
federal government regulation for the manufacturing sector as a whole was $138.6 billion.
These outlays should not be assumed to equal the total cost of regulation for manufacturing
because firms bear additional costs not included in this estimate. The following section
discusses the additional costs in more detail.
Open-Ended Questions
The previous discussion centered on information about outlays, or accounting costs, by
firms in the manufacturing sector and identified those regulations that are perceived as most
costly. Respondents were also asked two open-ended questions, and their comments provide
some insights into regulatory costs not reported as direct expenditures. These costs can be
borne by firms and/or by society at large.
Additional regulatory costs may include supply chain disruptions, increasing
unemployment, contracting or re-locating production and altering behavior. Respondents
identified all of these in their open responses. They also reported, along with other emotionally
charged comments, that regulators seem adversarial and impeded their abilities to run their
O&M, $10.7
Capital Equipment/ Tangibles/Offsets,
$18.6
Outside Advisers, $12.1
Subject of Federal Compliance Activity, $2.4 FTEs Devoted to
Compliance, $94.8
Compliance Expenditures: $138.6 Billion

23
businesses efficiently. According to survey respondents, regulation increases uncertainty, stifles
hiring and expansion and takes funds away from capital expenditures and R&D.
Alternative Use of Funds Presently Allocated to Regulatory Compliance
Respondents were asked how their company might reallocate funds if the cost of
regulatory compliance were reduced. The reported most likely alternative use of funds fell within
one or more of five general categories: investment, employee initiatives, sales, ROI or debt
reduction and other. Chart 16 shows the distribution of responses across possible expenditure
categories, with investment as the largest alternative use of funds at 63 percent.
Chart 16. Survey Respondents: Alternative Use of Funds Allocated to Federal Regulatory Compliance
Respondents answered the open-ended question by writing comments. The following
discussion includes examples of responses to this question, sorted by category. Appendix B
provides additional responses by survey respondents.
Investment
Respondents identified four areas of investment spending that likely would increase if
regulatory compliance costs decreased: capital investment and expenditures, growth and
acquisition, R&D and general (unspecified) investment.
Employee Initiatives,
22%
Other, 2%
ROI/Debt Reduction, 4%
Sales, 9%
Investment, 63%

24
Capital Investment/Expenditures; Growth and Acquisition
“Capital improvements to improve viability.” “Grow the business and increase employment.” “Purchase more raw goods for production purposes.”
R&D; General (Unspecified) Investment
“Develop energy-efficient products.” “Research, develop and introduce new products.”
Employee Initiatives
Respondents identified three areas related to employment that likely would increase if
regulatory compliance costs decreased: creating or preserving jobs, employee training and
wages and/or benefits.
“Add another employee.” “Invest in employee training.” “We would love to improve our employees’ wages.”
Sales
Respondents identified three areas related to sales that likely would increase if
regulatory compliance costs decreased: marketing and sales efforts, competitiveness and
customer satisfaction.
“Focus on global sales.” “Lower pricing to compete with [foreign manufacturers].” “Creating value that customers are willing to pay for.”
ROI or Debt Reduction
Respondents identified three areas related to ROI or debt reduction that likely would be
affected if regulatory compliance costs decreased: shareholders’ returns, the bottom line and
reducing debt.
“Increase profits or returns to shareholders.” “Pay the bills.” “Debt reduction.”

25
Comments on Federal Regulation and Business Operations
Respondents were asked whether they had any additional comments on federal
government regulation. Several themes came through from the comments submitted. In
general, respondents expressed frustration with the timing, complexity and administrative
requirements of regulation. The regulatory landscape also introduces uncertainty and reduces
the global competitiveness of manufacturers in the United States. The reported effects of
regulations according to respondents are reducing payroll, discouraging growth and adding
inefficiencies. Respondents identified health care, the Environmental Protection Agency (EPA),
OSHA and the FDA as specific areas of concern.
Respondents also noted morale, well-being and work environment consequences of
regulation. They reported an adversarial perspective by regulators toward businesses, where a
firm “is approached as an evil entity” populated by “bad guys.” In most cases, respondents’
comments reflect the perspective that regulators fail to understand the circumstances of the
businesses they are regulating and create greater uncertainties.17 As a result of these and other
factors related to regulation, some respondents experience increased levels of stress, reduced
enjoyment and/or less motivation at work.
Respondents’ Comments
This section includes selected comments from respondents to provide an understanding
of their perspective on regulation. A number of respondents made comments reflecting a
commitment to responsible corporate behavior but had concerns about the complexity and
administrative burden of regulations. One commenter stated the following:
“Regulations serve an important purpose in terms of ensuring responsible corporate operations and protection of investors/employees/communities/
17
Pande, et al. describe (p. 10) how regulations may be structured and created in developing nations: “In creating an enabling environment for business while retaining environmental goals, it is important to remember that industry’s primary focus is on managing the bottom line and maintaining a client base. . . . An enabling environment is a stable one, providing firms with certainty about future regulatory requirements and uniformity, reducing free-riding.” The responses to the open-ended questions suggest these insights may hold true for developed nations as well. That is, that an enabling, stable environment may not reflect the current situation of manufacturing and those who regulate it within the United States.

26
environment; and they help to maintain a level playing field with regard to competition and markets. It is the unnecessary complexity and administrative burden that often [accompany] these regulations, which result in excessive costs to corporations. In addition, the pace of regulatory review and permitting processes can often slow down the pursuit of new business to a pace, which results in missed opportunities.”
Many respondents expressed frustration or resignation with the current state of
regulation and how it is implemented. Recurring themes were that the perspective of regulators
was adversarial toward business, that there were too many regulations and that the regulations
reduce job satisfaction.
“The regulators generally approach business as an evil entity, which they are empowered to change and fix and fine for bad behavior.”
“Too many, too complex, and many are unnecessary.”
Respondents expressed concern regarding the negative effects of regulatory uncertainty
on business operations and planning. In short, the cost of regulation is not just in terms of direct
compliance outlays, but also in diverting resources and constraining actions with respect to
growth and employment.
“Great uncertainty for the past six years on EPA regulations, including [National Emissions Standards for Hazardous Air Pollutants], [the Prevention of Significant Deterioration] and [carbon dioxide], has paralyzed the industry.”
“For a small manufacturer, any additional compliance obligation reduces resources that would otherwise be dedicated to R&D, growth, profitability/efficiency studies, etc. As the owner of this very small business, I am the leader of any change that the business undertakes. . . .”
“We also have offshore operations. The impact is to move more of our business offshore in order to average down our costs.”
“Trickle-down effect of laws ‘that only affect big business’; [government] policy in general seems aimed at squeezing smaller business out of existence.”
One commenter stated:
“We are a business that averages 48 to 52 employees. The definition of a small business as 50 or more employees is costing us money and forcing us to keep our employment number under 50, which is prohibiting our growth.”

27
III. Estimating the Total Cost of Regulations
In this section, we turn to an estimate of the costs of regulations on all businesses and
individuals in the United States. We divide federal regulations into four categories: economic;
environmental; occupational safety and health and homeland security; and tax compliance. A
description of these categories follows, along with an explanation of the primary sources and
methods used to derive the cost estimates.
Methodological Perspectives and the Scope of Regulatory Costs
As a broad perspective, the estimate of the total cost of regulations takes into account
both direct and indirect costs. These are examples of direct compliance costs: investments in
capital equipment, expenditures on O&M, payments to outside consultants, in-house employees
devoted to compliance activities and so forth. These costs require direct outlays by firms and
generally include direct costs in the cost estimates tallied in OMB’s annual Report to Congress.
However, even if all the direct costs for every federal regulation were measured and included in
the OMB report, direct costs would understate the full and real costs of regulations.
Direct compliance costs add to the cost of doing business, which means that economic
output is curtailed. The reduction in economic output caused by regulation is an indirect cost of
compliance, and we include these within the scope of our analysis. Our methodology that
includes the indirect costs is perhaps the main reason that the total costs of federal regulations
in this report are much larger than those suggested in the OMB Report to Congress.
A second methodological comment relates to our approach to the distribution of
regulatory costs between businesses and individuals, among sectors of the U.S. economy and
among businesses of different sizes. The approach to cost incidence tends to reflect the initial
or statutory burden of regulations—that is, based on who bears the initial compliance costs. It
needs to be acknowledged that this initial compliance burden can be shifted, and the final
incidence of regulations may differ from this initial or statutory assignment of the regulatory

28
costs. The difference between the initial incidence and how costs are ultimately divided depends
on the demand and supply elasticities in the respective product and input markets. The final
incidence of the federal regulatory burden is likely to differ from the initial incidence. Of course,
the forward and backward shifting of regulatory costs is exactly analogous to the distinction
between how a government collects a tax versus who ultimately pays for the tax. Collecting 100
percent of the retail sales tax from a business owner does not necessarily mean that the owner
bears the full burden of the sales tax. Rather, the tax is passed on to consumers willing to pay a
higher price at the store. This methodological issue is raised again in Section IV.
While acknowledging that shifts in the cost burdens will occur, this report does not
attempt to model these changes beyond some assumptions about the initial burden. We turn to
a discussion of the four categories of regulations and the estimation procedures.
Major Categories of Federal Regulations: Sources and Methods
Economic Regulations
Economic regulations are rules that govern decision-making in market transactions.
These include markets for final goods and services; markets for physical and human resources;
credit markets; and markets for the transport and delivery of products and factors of production.
Economic regulations affect who can produce; what can (or cannot) be produced; how to
produce; where to produce; where to sell; input and product pricing; and what product
information must be or cannot be provided. Obviously, the reach of economic regulations is
vast. This means that an encompassing methodology is required to derive an estimate of these
costs.
The methodology and scope we employ to capture the cost of economic regulations is
why our estimate of the total costs of regulations is substantially higher than the total costs in
OMB’s annual Report to Congress. We emphasize three reasons for this difference. First,
OMB’s annual estimate of the total costs includes only a tiny fraction of the universe of

29
economic regulations. In part, this is because regulations issued by independent (nonexecutive
branch) agencies are not subject to OMB review under Executive Orders 12866 and 13563.
Independent agencies, such as the Federal Trade Commission, the Federal Communications
Commission, the Commodity Futures Trading Commission, the newly created Consumer
Financial Protection Bureau and the Securities and Exchange Commission, promulgate a vast
number of economic regulations that are necessarily omitted in the OMB annual cost figures.
Second, the OMB aggregate estimate only includes major rules,18 meaning that the
costs of thousands of non-major regulations—even those promulgated by executive branch
agencies—are not included. While the costs of any single non-major rule may be small in
relation to the U.S. economy, non-major rules in the aggregate may add substantially to
compliance costs. The Code of Federal Regulations in 2013 contained 175,496 pages19; it is
easy to imagine the large cumulative impact that non-major rules would have.
A third reason that an alternative estimate of the cost of economic regulations is required
is that most of the government agency estimates include direct costs, but not the costs tied to
the impact of regulations on the U.S. economy. We consider indirect costs—the impact on
aggregate economic output—to be relevant and real costs of economic regulation. Finally, in
compiling its annual accounting statement, OMB includes only those regulations that went into
effect during the previous 10 years. This 10-year look-back limitation means that OMB’s total
cost estimate excludes the compliance costs associated with major regulations, such as several
18
The OMB Report to Congress defines a major rule as one promulgated by an executive branch agency that meets any of the following three conditions: (1) rules designated as major under the Congressional Review Act (5 U.S.C. § 804(2)); (2) rules designated as meeting the analysis threshold under the Unfunded Mandates Reform Act of 1995 (UMRA); or (3) rules designated as “economically significant” under section 3(f)(1) of Executive Order 12866.
19 See Crews (2014).

30
Clean Air Act rules.20 For these reasons, relying on the OMB Reports for Congress would
dramatically understate the costs of economic regulations.
In view of these limitations, we derive an estimate of the cost of economic regulations
using a top-down approach, a methodology designed to capture the complex and cumulative
consequences of tens of thousands of federal rules that affect market transactions. The basic
approach is to examine systematically the aggregate impact of economic regulations on the
U.S. economy. This involves specifying a model that estimates the impact of regulations on
country-level economic performance using panel data (that is, observations across countries
and over time) for countries that are members of the Organisation of Economic Co-operation
and Development (OECD), which includes the United States.21
This methodology is straightforward and builds on an extensive academic literature
finding that macroeconomic performance and living standards are systematically linked to
regulatory policies. This literature informs practical policy applications. For example, empirical
research sponsored by the OECD leads them to conclude:
Pro-competition regulation in product markets can help boost living standards. Many empirical studies have shown that competition can overall raise output per capita by increasing investment and employment as well as by encouraging companies to be more innovative and efficient, thereby lifting productivity . . . . [C]ountries have, step by step, removed obsolete or badly designed regulations in product markets over the past decades, reducing state involvement in business sectors, making it easier for entrepreneurs to create firms and to expand them, and facilitating the entry of foreign products and firms.
Going for Growth (OECD, 2014, p. 66)
20
42 U.S.C. §7401 et seq. (1970). In earlier Reports to Congress, OMB used a variety of methods to estimate these costs. The 2000 Report, for example, puts the total cost for “EPA Air Rules” at $96 billion in 1996 dollars (see OMB 2000, Table 3). By comparison, the 2014 Draft Report puts the total cost of all EPA rules between 2003 and 2013 at between $38.2 billion and $46.1 billion in 2010 dollars.
21 We rely on the sample of OECD countries for this analysis rather than a sample that includes a wider
range of countries to eliminate for a variety of factors that might cause differences in economic output. For example, OECD countries tend to have similar political regimes, legal protections, monetary regimes, operative credit markets and so forth.

31
The OECD elevated regulatory reform to a central role of its multiyear strategic initiative, called
“Going for Growth,” following nearly two decades of study and applied research.22
Estimating the impact of economic regulations on living standards requires a reliable
measure of regulation across countries and over time. For this purpose, we rely on data from
the World Economic Forum’s annual Global Competitiveness Report. Beginning in 2005, the
World Economic Forum has constructed a Global Competitiveness Index (GCI) that includes
multiple indicators to capture “institutions, policies and factors that determine the level of
productivity of a country.” Many of the indicators used to construct the GCI—including those we
use in our analysis to measure economic regulation—are obtained through its annual Executive
Opinion Survey.23 We include three components of the GCI to construct a measure tailored
specifically to reflect economic regulation. Appendix C provides a description of the components
used from the GCI report. Alternative measures of economic regulations across nations are
available from several sources. Appendix C provides results when these alternative measures
are used instead of the Economic Regulation Index computed using the GCI indicators. We
emphasize that the empirical relationship between economic regulations and macroeconomic
performance remains robust and statistically significant using measures from the alternative
sources.
The regression model used to examine the impact of economic regulations on GDP is
specified in Equation (1):
(Eq. 1) GDP per Capita i,t = (Economic Regulation Index) i,t-1 + () i,t-1 + i + i,t-1
22
This OECD-sponsored research includes Bouis and Duval (2011); Bourlès, et al. (2010); Conway, et al. (2006); and Nicoletti and Scarpetta (2005). The OECD began to release its own index of Product Market Regulations (PMR) in 1998, which has become another widely used metric in the empirical literature. The PMR indicators are constructed from responses of national governments to the OECD Regulatory Indicator Questionnaires. For example, see the 2013 questionnaire at www.oecd.org/eco/reform/PMR-Questionnaire-2013.pdf.
23 The Executive Opinion Survey “captures information on a broad range of factors that are critical for a
country’s competitiveness and sustainable development, and for which data sources are scarce or, frequently, nonexistent on a global scale” (Global Competitiveness Report, 2013, p. 83).

32
The sample used to estimate Equation (1) consists of OECD countries for which data on
all of the relevant variables are available. For most specifications, this yields a sample size of 34
countries (listed in Appendix C). The variable subscript i in Equation (1) denotes an observation
in a particular country i. The variable subscript t denotes an observation in a particular year,
where t = 2006 through 2013.
The dependent variable, GDP per capita in Equation (1) is denominated in constant
2005 U.S. dollars.24 The main explanatory variable of interest in Equation (1) is the Economic
Regulation Index.25 We use the GCI scale for the Economic Regulation Index, and the values
range from one to seven, where higher values correspond to improvements in regulatory
quality—that is, reductions in the regulatory burden on product, factor and credit markets.
The model includes a number of economic and demographic variables to control for
other factors that may affect economic performance, represented by the vector in Equation
(1). These control variables are drawn from the empirical literature that examines differences in
economic levels across countries and over time.26 The control variables we include are foreign
trade as a share of GDP, the dependency ratio (population over 65 relative to population aged
19 to 65), new capital investment as a share of GDP, size of the labor force, tax revenues as a
share of GDP and tax revenues as a share of GDP squared to allow for a nonlinear effect of tax
policy.27 GDP per capita and the size of the labor force are entered into the regression models
as natural logarithmic transformations. Appendix C provides summary statistics for the variables
24
The GDP data from the OECD are reported in 2005 dollars and come from the 2014 online database, StatExtracts. In deriving the final estimates for the cost of federal regulation, we convert the estimates into 2014 dollars.
25 Source: Global Competitiveness Report, online data platform, 2014.
26 Early surveys of this literature are Hall and Jones (1997), Barro and Sala-i-Martin (1995) and Barro
(1997). Later contributions to the literature with specific reference to the impact of regulation on country-level economic performance are surveyed in Loayza, et al. (2004), Gwartney, et al. (2004), Sala-i-Martin, et al. (2004), Schiantarelli (2008) and Rode, et al. (2013).
27 Sources: OECD, StatExtracts, online database, and World Bank, World Development Indicators, online
database.

33
used in the analysis. Finally, the dataset of OECD countries is organized as a panel, and
Equation (1) is estimated using a GLS [generalized least squares] random effects model.28
The results are shown in Table 3. Two variations of the model are presented, one of
which includes an adjustment for first-order autocorrelation (Column 1) and the other does not
(Column 2). In both models, the coefficient on the Economic Regulation Index is positive and
statistically significant at the 5 percent confidence level. A positive sign on the coefficient
indicates that a reduction in the burden of economic regulations has a positive impact on a
nation’s GDP per capita. We use the coefficient in Column (1) (0.081) to calibrate the cost of
economic regulations and point out that the cost estimate would be larger if we used the
coefficient in Column (2) (0.116).
The next step is to project the reduction in U.S. GDP that is tied to the costs of
complying with economic regulations. As a benchmark, we compute the mean value of the
Economic Regulation Index for the five highest-ranked OECD countries. The difference between
the mean value of these five countries and the value of the U.S. Economic Regulation Index is
26 percent. Using the parameter value in Table 3, Column (1), and this 26 percent difference in
the Economic Regulation Index implies an impact on GDP equal to $1.439 trillion. In other
words, if the burden of economic regulations in the United States matched the benchmark
countries, U.S. GDP would be $1.439 trillion higher than it was in 2012 (denominated in 2014
dollars). This is the estimated cost of economic regulations we apply in Section IV. Finally, we
add to this cost the estimated cost of import restrictions from the U.S. International Trade
Commission (ITC) (2013), which was $8.3 billion (in 2014 dollars).
28
Because the number of years in the sample period is somewhat modest (2006 to 2013), we do not include country fixed-effects variables in the models.

34
Table 3. The Impact of Economic Regulation on GDP per Capita
Dependent Variable:
GDP per Capitaa
(in 2005 Dollars) (1) (2) Economic Regulation Index 0.081 0.116 (2.46)* (3.07)** Trade / GDP 0.002 0.002 (3.60)* (3.44)** Dependency Ratio 0.007 0.013 (1.12) (1.92) Tax Revenue / GDP 0.061 0.043 (1.84) (1.30) (Tax Revenue / GDP) Squared -0.0007 -0.0005 (-1.58) (-1.08) Capital Investment / GDP 0.025 0.012 (5.76)** (2.86)** Labor Force
a 0.075 0.059
(2.57)** (1.88) Year = 2008 -0.100 -0.130 (-2.38)** (-2.67)** Year = 2009 -0.132 -0.140 (-3.52)** (-3.35)** Trend -0.030 (-2.87)** Constant 7.15 67.89 (10.35)* (3.24)** R-sq: Within 0.01 0.02 Between 0.74 0.60 Overall 0.58 0.50 Number of Observations 219 219
Notes to Table 3:
a Indicates a variable is entered into the regression as a natural logarithmic
transformation.
The models are estimated using panel data for all OECD countries for which the data are available for the years 2006–2013. Each independent variable is lagged one year.
z-statistics are shown in parentheses, where ** indicates significance at the 1 percent level and * indicates significance at the 5 percent level.
Column (1) is a random-effects model with an AR(1) disturbance. Column (2) is a random-effects model without an AR(1) correction.
Environmental Regulations
The estimated cost of environmental regulations is derived from two sources: OMB’s
annual Report to Congress and Hahn and Hird (1991). OMB has reviewed the regulatory impact
analyses (RIAs) for the most costly regulations promulgated by the EPA back through the late
1980s. In its early Reports to Congress, OMB relied on the cost estimates in Hahn and Hird

35
(1991) to gauge the costs of environmental regulations prior to 1988, and we follow that
procedure in this study.29
OMB discusses the shortcomings in these estimates, including the basic fact that cost
estimates do not exist for all environmental regulations, and the inherent difficulties in
performing the RIAs. Beginning in its 2003 report, OMB began the practice of limiting its cost
summaries to regulations promulgated over the preceding 10 years, which in that report
included 1992 through mid-2002.30 For this reason, this report begins with the OMB report for
2001, which includes its earliest cost accounting and takes the Hahn and Hird (1991) as its
beginning estimate of the costs prior to 1988. To account for environmental regulations
promulgated since then, the costs of newly reviewed regulations are taken from OMB’s annual
reports for 2002 through 2014.
29
It is worth reiterating that OMB only includes the costs of economically significant regulations subject to EO 12866 review. These are less than 1 percent of the EPA’s rulemaking. Moreover, as noted earlier, the OMB’s annual reports now only encompass regulations issued in the prior 10 years. This was not always the case, and data on the earlier environmental regulations are summarized in the OMB’s past annual reports.
30 OMB, Office of Information and Regulatory Affairs (2003), Informing Regulatory Decisions: Report to
Congress on the Costs and Benefits of Federal Regulations, Table 2. The OMB’s cost estimates rely on RIAs issued mainly by the EPA.

36
Using the combination of Hahn and Hird (1991) and OMB estimates puts the cost of
environmental regulations in a range between $208.1 billion and $329.6 billion (in 2014 dollars).
This report uses the high end of the cost range provided in the OMB reports and Hahn and Hird
(1991). This reflects a judgment that cost estimates are absent for important environmental
regulations and that government agencies may be conservative in estimating regulatory costs.31
For comparison, if the midpoint of the high and low estimates were used, the cost of
environmental regulations in this report would decline by roughly $58 billion.
Occupational Safety and Health and Homeland Security Regulations
Under this category, we include regulations reviewed by OMB and promulgated by the
Department of Homeland Security and OSHA. We define this category somewhat narrowly in an
effort not to duplicate costs that might well fall under the costs estimate for economic
regulations.
This report relies on three sources to estimate the costs of occupational safety and
health and homeland security regulations, which are summarized in Table 4.
31
Several regulatory experts draw a similar conclusion about the OMB environmental cost estimates, but considerable debate continues. For example, Johnson concludes that “the costs of water quality regulation totaled $93.1 billion in 2001. While this figure is based on conservative estimates of regulatory costs, it is significantly larger than the cost and benefit estimates produced by the EPA” (Johnson, 2004). In contrast, in 1999, the EPA estimated the costs of the 1972 Clean Water Act at $15.8 billion per year. (“A Retrospective Assessment of the Costs of the Clean Water Act: 1972 to 1997,” EPA, October 2000.) The discussion in Hahn (1996) is also informative. Hahn makes a strong case that government agencies overestimate benefits and underestimate costs systematically. In addition, the review article by Jaffe, et al. (1995) suggests that environmental costs in the long run have exceeded compliance cost estimates. Finally, the study by Harrington, et al. (2000) examines the estimates for 28 particular rules promulgated by the EPA and OSHA and finds, in contrast, that overestimation of unit costs occurs about as often as underestimation. Most recently, see Gayer and Viscusi (2014). OMB and federal agencies have started to undertake retrospective reviews of the costs and benefits of regulations. These reviews have been completed for only a small number of regulations. Over time, we expect this initiative to make an important contribution to the analysis of the cost of major regulations.

37
Table 4. Sources and Estimated Costs of Occupational Safety and Health and Homeland Security Regulations
Category Cost Estimate
(in Millions of 2014 Dollars) Source
Occupational Safety and Health (For Those Issued Before 2001)
$ 70,337 Johnson (2005)
Occupational Safety and Health (For Those Issued 2001–2012)
$ 733 OMB Reports to Congress (2009–2014)
Homeland Security (All Through 2012)
$ 13,973 OMB Reports to Congress (2009–2014)
Homeland Security (2012) $ 7,289 Authors’ Estimate
Total $ 92,332
The cost calculations from the Johnson (2005) study are used where possible—that is,
until 2001—and adjusted for inflation as shown in Table 4. The costs provided by OMB on
OSHA regulations are used for those regulations issued subsequent to the Johnson study. The
cost of homeland security regulations also uses OMB-reviewed estimates of rules concerned
with transportation facilities security; chemical plant security; electronic availability of passenger
manifest lists; cargo security; notice of imported food and registration of food facilities that might
be vulnerable to bioterrorism; and air cargo security.
We supplement the homeland security–related costs with an estimate of the costs
associated with passenger delays tied to Transportation Security Administration (TSA) airport
screening. This estimate follows the methodology in Hobijn (2002). The number of passengers
boarding planes in 2012 was 815 million, and we use an added wait time of 15 minutes per
passenger.32 This yields a total wait time of 204 million hours. We allocate 30 percent of these
hours to business travelers and 70 percent to leisure travelers based on survey data from
Results Travel.33 Using survey data from the U.S. Travel Association, we use an average hourly
32
Source: Bureau of Transportation Statistics, DOT, online. A TSA estimate for 2008 states that “83 percent of passengers waiting 10 minutes or less nationwide" (Hawley, 2008, p. 2). However, changes in airline policies since 2008 that charge for checked bags has increased the number of carry-on bags by about 50 percent, which increases passenger wait time.
33 Sources: Certify, www.certify.com/2013-09-12-Business-travel-accounting-for-large-percentage-of-
flights and Hobijn (2002).

38
value of time for business travelers of $43.75 and $31.25 for leisure travelers.34 This yields a
total cost of $7.29 billion, or $2.73 billion in cost delays on business travelers and $4.56 billion
on leisure travelers. This estimate is likely on the low side because it ignores the number of trips
that are not taken because of the wait times associated with security screening.
Cost of Compliance with the Federal Tax Code
Another cost of regulation is the time and resources required for monitoring,
recordkeeping, reporting and complying with regulations. Of this “paperwork” burden, the time
required to comply with the federal tax code accounts for the lion’s share. Of course, the federal
government requires a host of additional forms that also impose recordkeeping and reporting
burdens. OMB estimates this total paperwork burden to have been 9.14 billion hours in FY
2011. However, these non-tax-related reporting and compliance requirements are largely tied to
the types of regulation examined in the other three categories: economic, environmental or
occupational safety and health and homeland security regulations. This means that the cost
estimates for the other regulations should account for most of the non-tax-related compliance
and reporting burden. In that sense, a separate estimate would be double-counting
recordkeeping and form-filing costs. However, the cost of federal tax compliance would not be
included. While tax compliance differs in some respects, it has much in common with other
forms of regulation, and for that reason, we examine it as a separate category and include the
costs in this study. We estimate these costs using data reported by the U.S. Internal Revenue
Service (IRS).
34
Source: U.S. Travel Association, Travel Facts and Statistics. Available online at www.ustravel.org/news/press-kit/travel-facts-and-statistics.

39
Table 5. Estimated Costs of Compliance with the Federal Tax Code, 2012
Businesses Individuals and
Nonprofits Total
Number of Hours Required to Comply
2,636,682,453 1,575,928,830 4,212,611,282
Compliance Cost per Hour in 2014 Dollars
$ 48.80 $ 31.51
Total Compliance Cost in 2014 Dollars
$ 108,843,695,183 $ 49,656,827,903 $ 158,500,523,085
Share of Total Compliance Cost
69% 31%
Note to Table 5:
Columns might not total due to rounding.
The estimate of tax compliance costs in 2012 follows the methodology in past studies of
tax code compliance. The first step compiles data from the IRS on the amount of time required
to complete each type of tax form and the number of filings for each type of form. The number of
compliance hours is shown in the first row of Table 5 broken down by businesses, individuals
and nonprofits and a total for these two categories. The total number of hours required for
compliance is 4.2 billion in 2012, with businesses devoting 2.6 billion hours and individuals and
nonprofits devoting nearly 1.6 billion hours.
The second step is to multiply the hours spent on compliance by an hourly wage rate
that reflects the value of the preparer’s time. We apply the average hourly wage rate for
accountants and auditors in the case of individuals and nonprofits and the hourly wage rate for
human resources professionals in the case of businesses.35 This procedure yields an estimated
cost of nearly $159 billion (in 2014 dollars) of federal tax compliance. This estimate includes the
combined costs on individual filers, nonprofit organizations and business filers. The estimated
cost of compliance for businesses is $109 billion, which accounts for 69 percent of the total cost.
35
Source: Bureau of Labor Statistics, online database.

40
Summary of Total Regulatory Costs
Table 6 summarizes the cost estimates described in this section by category and
highlights the basic sources and procedures behind the estimates.
Table 6. The Cost of Federal Regulation, 2012 (in Billions of 2014 Dollars)
Type of Regulation Cost
Estimate Sources
All Federal Regulations $ 2,028 Summation of costs by type
Economic $ 1,448 Authors’ empirical analysis using index of regulatory burden; ITC (2014)
Environmental $ 330 Hahn and Hird (1991); OMB (2004–2013)
Tax Compliance $ 159 IRS and Bureau of Labor Statistics
OSHHS* $ 92 Johnson (2005); OMB (2009–2014); authors’ estimate of cost of screening wait times
Note to Table 6:
* OSHHS stands for occupational safety and health and homeland security regulations.

41
IV. Incidence of Regulatory Costs
This section examines the incidence of federal regulatory costs, among major business
sectors of the American economy, and, within sectors, the incidence across firms of different
sizes. The underlying composition of economic activity in America provides the basis for this
cost allocation.
A Snapshot of American Enterprise
The report uses a three-part firm-size classification, relying on data available from the
Census Bureau. For purposes of this study, we define small firms as those with fewer than 50
employees; medium-sized firms have 50 to 99 employees; and large firms have 100 or more
employees. Small, medium-sized and large firms are sometimes defined differently, and in
Appendix D, we provide an alternative breakdown of the results. There we define small firms as
those with fewer than 20 employees, medium-sized firms as those with between 20 and 499
employees and large firms as those with 500 or more employees.
The North American Industry Classification System (NAICS) devised by the Census
Bureau divides American businesses into 2,000 distinct industry types. To make the results
tractable, we aggregate these classifications down to five broad business categories:
Manufacturing
Trade (wholesale and retail)
Services
Health Care
Other (a residual containing almost all other nonfarm employers)36
36
The firm-level data are provided in the “Statistics of U.S. Businesses” and cover almost all nonfarm employer businesses. It omits farms; railroads; most government-owned establishments; the U.S. Postal Service; large pension, health and welfare funds (more than 100 employees); and nonincorporated firms with no paid employees. According to the Census Bureau, nonemployers account for roughly 3 percent of all business activity (see Census Bureau, “Nonemployer Statistics,” www.census.gov/epcd/nonemployer).

42
The “other” category includes forestry, fishing, hunting and agriculture; mining; utilities;
construction; and transportation and warehousing.
Table 7. Size Distribution of American Business in 2011*
Size Measure All Firms**
Firm Size < 50
Employees 50–99
Employees 100+
Employees All Sectors Firms 5,684,424 5,470,398 115,112 98,914 Employment 113,425,965 31,253,896 7,876,979 74,295,090 Payroll (in Thousands) $ 5,386,535,861 $ 1,204,323,659 $ 337,981,464 $ 3,844,230,737 Manufacturing Firms 248,694 224,858 12,739 11,097 Employment 10,984,361 2,045,099 900,272 8,038,990 Payroll (in Thousands) $ 599,483,787 $ 87,522,567 $ 42,476,923 $ 469,484,296 Trade Firms 951,881 921,329 18,455 12,097 Employment 20,324,891 5,398,243 1,238,546 13,688,102 Payroll (in Thousands) $ 759,156,344 $ 196,675,074 $ 56,211,566 $ 506,269,704 Services Firms 2,991,384 2,882,489 56,533 52,362 Employment 53,294,350 15,705,166 3,764,456 33,824,728 Payroll (in Thousands) $ 2,630,132,453 $ 556,895,154 $ 149,804,026 $ 1,923,433,272 Health Care Firms 623,308 594,264 14,685 14,359 Employment 18,059,112 4,024,533 1,102,301 12,932,278 Payroll (in Thousands) $ 813,608,600 $ 180,422,935 $ 42,698,980 $ 590,486,684 Other Firms 869,169 847,461 12,701 9,008 Employment 10,741,997 4,062,706 871,404 5,807,887 Payroll (in Thousands) $ 584,150,910 $ 182,804,163 $ 46,789,968 $ 354,556,780
Notes to Table 7:
* Source: SBA’s Office of Advocacy, “Statistics of U.S. Businesses: Firm Size Data,” www.sba.gov/advo/stats/data.html. The data for 2011 are the most recently available. The payroll data are converted into 2014 dollars.
** The data cover almost all nonfarm employer businesses. Omitted are farms; railroads; most government-owned establishments; the U.S. Postal Service; large pension, health and welfare funds (more than 100 employees); and unincorporated firms with no paid employees.
Columns might not total due to rounding.
Table 7 shows the distribution of American industry by sector and firm size using the
most recently available data (for 2011).37 Table 7 presents three relevant size indicators: the
37
American industry is obviously not static, and the 2011 data on the distribution of business activity do not match up exactly with the years for the regulatory cost estimates (2012). However, changes in the basic structure of American industry generally occur only incrementally. The data provide a close approximation for the relevant years of the proportions of firms, employees and payroll across the three firm-size categories and the five sector classifications.

43
number of firms, the number of employees and payroll expenditures.38 Overall, the data indicate
some 5.7 million firms in the United States—nearly 5.5 million of which are in the small size
category (fewer than 50 employees).
Tables 8a, 8b and 8c report these business-size indicators in a slightly different format,
as shares of all U.S. industry, which are used to allocate compliance costs. It converts the raw
data shown in Table 7 into percentage terms. For example, consider the data in Tables 8a, 8b
and 8c that describe the manufacturing sector. Manufacturing accounts for 4 percent of all U.S.
firms, 10 percent of all U.S. employment and 11 percent of all U.S. business payroll
expenditures. Within the manufacturing sector, 90 percent of the firms are classified as small
businesses (fewer than 50 employees), 5 percent have between 50 and 99 employees, and 5
percent have 100 or more employees. Twenty-nine percent of manufacturing employees work in
small firms, 7 percent work in medium-sized firms, and 63 percent work in large firms. Finally,
regarding the distribution of payroll expenditures, small firms account for 31 percent, medium-
sized firms account for 8 percent, and large firms account for 61 percent.
38
The SBA’s Office of Advocacy contracts with the Census Bureau to collect the employer firm-size data (see www.sba.gov/advo/stats/data.html). When the Census Bureau compiles its “Statistics of U.S. Businesses,” it relies on survey questionnaires filled out by firms. Occasionally, firms classify themselves under more than one industry type (or NAICS classification). This means that when summed by sector, the number of firms is greater than the actual number of firms. The data used in this report corrects for this over-count. In brief, the correction relies on the fact that the number of employees in each industry is accurately reported to the Census Bureau, and the share of employees by sector is used to eliminate the redundancy and scale back over counts of firms.

44
Table 8a. Distribution of American Businesses by Firm Size and Sector
Size Measure All
Sectors Manufacturing Trade Services
Health Care
Other
All Firms 4% 17% 53% 11% 15% By Firm Size < 50 Employees 96% 90% 97% 96% 95% 98% 50–99 Employees 2% 5% 2% 2% 2% 1% 100+ Employees 2% 5% 1% 2% 2% 1%
Table 8b. Distribution of Employees at American Businesses by Firm Size and Sector
Size Measure All
Sectors Manufacturing Trade Services
Health Care
Other
All Firms 10% 18% 47% 16% 9% By Firm Size < 50 Employees 29% 29% 22% 38% 22% 38%
50–99 Employees 7% 7% 6% 8% 6% 8% 100+ Employees 63% 63% 72% 54% 72% 54%
Table 8c. Distribution of Payroll at American Businesses by Firm Size and Sector
Size Measure All
Sectors Manufacturing Trade Services
Health Care
Other
All Firms 11% 14% 49% 15% 11% By Firm Size < 50 Employees 22% 31% 26% 96% 22% 31% 50–99 Employees 6% 8% 7% 2% 5% 8% 100+ Employees 71% 61% 67% 2% 73% 61%
Notes to Tables 8a, 8b and 8c:
Source: See Table 7.
Columns might not total due to rounding.
The percentages displayed in Tables 8a, 8b and 8c provide a snapshot of the
distribution of productive activity and resources among broad sectors of American industry. The
incidence of regulatory compliance costs naturally follows this allocation of the workforce and
business activity. These costs are allocated across the sectors and firm sizes shown in Tables 7
and 8 using the procedures described in the remainder of this section.

45
Assumptions and Procedures Underlying the Cost Allocations: Business Portion of the Regulatory Burden
Before costs can be allocated across these five business sectors, a more general cost
allocation is necessary, specifically to determine how much of the regulatory burden falls in the
aggregate on businesses. This task requires a delineation of the regulatory burden that falls
initially on business from the burden that falls initially on individuals and state and local
governments. As discussed in Section I, the report does not attempt to map out the subsequent
shifting of this burden from businesses to individuals (e.g., in the form of higher retail prices) or
from one business sector to another (e.g., in the form of higher energy prices or health
insurance premiums). It is worth emphasizing that all regulatory costs are—and can only be—
borne by individuals, as consumers, as workers, as stockholders, as owners or as taxpayers.39
In other words, the distinction between “business” and “individuals” focuses on the compliance
responsibility, fully recognizing that ultimately all costs must fall on individuals. Moreover, the
degree to which businesses are able to shift compliance costs forward onto consumers can only
be determined with specific information about elasticities of supply and demand in specific
sectors. We note that some of the costs of federal regulations fall on state and local
governments, and these are bundled with those borne by individuals to keep a relatively
tractable division in business versus nonbusiness costs.
The cost allocations for each type of regulation are shown in Chart 17. These allocations
generally employ the same methodology used in prior studies: Hopkins (1995a), Crain and
Hopkins (2001), Crain (2005) and Crain and Crain (2010). The allocation of environmental
regulations is based on the compliance data reported by the EPA.40 In the absence of allocation
data for economic regulation, a default judgment of 50/50 is applied. The allocation of tax
compliance costs is based on the distribution of tax forms filed by individuals, businesses and
39
The responses to the open-ended questions presented in Section II provide an intuitive sense of the distribution of these costs on manufacturers. See the chart “Alternative Uses of Funds Allocated to Regulatory Compliance.” 40
EPA, “Environmental Investments: The Cost of a Clean Environment,” EPA 230-11-90-083, November 1990, pp. 2–5.

46
exempt organizations. The occupational safety and health and homeland security regulations
are allocated 94 percent to businesses and 6 percent to other entities. This assumption is
consistent with the empirical evidence that the labor supply function is relatively inelastic, and
therefore, safety and health costs are not immediately shifted onto consumers.41 The
assumption is that a small share (6 percent) of estimated homeland security costs is borne by
state and local governments and individuals.
Chart 17. Allocation of Compliance Cost Incidence to Business (Percentage of Category Costs)
Note to Chart 17:
* OSHHS stands for occupational safety and health and homeland security regulations.
Allocation of Regulatory Costs Across Business Sectors
The second task is to allocate the business portion of regulatory costs among the five
major sectors. The sectors are based on the NAICS, in some cases aggregating categories.42
41
Moreover, this assumption is similar to that used by the Congressional Budget Office that payroll taxes are borne fully by workers (and, therefore, not shifted forward onto consumers through price increases). See the discussion in Jonathan Gruber, Public Finance and Public Policy, New York: Worth Publishers, 2004, pp. 539–540.
42 The NAICS data are from the Census Bureau (see www.census.gov/cgi-
bin/sssd/naics/naicsrch?chart=2012).
50% 65% 69%
94%
50% 35% 31%
6%
0%
20%
40%
60%
80%
100%
Economic Environmental Tax Compliance OSHHS*
Business Incidence Other Incidence

47
For example, the NAICS separates both wholesale and retail trade, and we combine these as
the “trade” sector. Table 9 lists these allocations by sector and sources. A more complete
description of the allocation basis for each type of regulation is described in turn.
Table 9. Allocation of Business Regulatory Costs to Sectors (Percentages)
Type of Regulation
Sectoral Allocations Sources and Summary of
Methods Manufacturing Trade Services Health Care
Other
Economic 13% 14% 50% 8% 14%
Bureau of Economic Analysis (BEA) (value-added share of private GDP); SBA (employment share of private workforce)
Environmental 54% 0% 0.3% 0.7% 45% Hazilla and Kopp, 1991 (compliance costs by sector)
Tax Compliance
3% 13% 62% 7% 15% IRS data on the number of returns and forms by each industry category
OSHHS* 10% 17% 48% 15% 10%
SBA (employment share of private workforce); BEA (value-added share of private GDP)
Notes to Table 9:
* OSHHS stands for occupational safety and health and homeland security regulations.
Columns might not total due to rounding.
Economic Regulations
Regarding economic regulations, the cost allocations are based on a weighted average
of two components: (1) the sector’s value added to GDP divided by total private-sector GDP and
(2) the number of employees on the sector divided by total private-sector employment.43 The
average for each sector is weighted by the share of non-OSHA workplace regulations on the
sector—that is, a sector’s employment share gets a slightly higher weight where regulations,
such as labor standards or labor management relations, are likely to have a larger impact.
43 The source of the value added to GDP by sector and the private-sector GDP data is the BEA’s Industry
Economics Division online database. The data used were released on April 28, 2009. The source for the employment data is the SBA’s Office of Advocacy, “Statistics of U.S. Businesses: Firm Size Data,” website: www.sba.gov/advo/stats/data.html.

48
Environmental Regulations
The sector allocations for environmental regulations are taken from Hazilla and Kopp
(1990). Almost all of these costs fall on the manufacturing sector (54 percent) and the “other”
sector (45 percent). The “other” sector includes such businesses as coal mining, ore mining, oil
and gas extraction, coal gasification and electric utilities, all of which are heavily affected by
regulations promulgated under the Clean Air Act and the Clean Water Act. The remaining costs
of environmental regulation fall on the health care and service sectors.
Allocation of Regulatory Costs by Firm Size
We allocate the costs across three categories of firm sizes: those with fewer than 50
employees (small), firms with 50 to 99 employees (medium-sized) and firms with 100 or more
employees (large). To facilitate comparisons with other studies, Appendix D provides the
allocation of costs using slightly different firm-size categories: those with fewer than 20
employees (small), firms with 20 to 499 employees (medium-sized) and firms with 500 or more
employees (large). The specific allocation procedure differs for each type of regulation, and the
procedures are described below.
Starting with economic regulations, the cost allocation among the three firm-size groups
uses a two-step procedure. We take into consideration the fact that some regulations explicitly
exempt small firms (those with fewer than 50 employees, for example). The portion of economic
regulations from which small firms are exempt is approximated using the share of costs that
were exempt in the Johnson (2005) study. This share is multiplied by the currently estimated
cost of economic regulations to estimate exempted costs. In other words, the aggregate costs of
economic regulations include some that exempt small firms. These exempted costs are then
reapportioned to medium-sized and large firms. The reapportioned costs are sector-specific and
based on the relative employment shares by firm size in each sector.

49
The methodology used to allocate the cost of environmental regulations by firm size is
easily summarized. The procedure uses multiple regression analysis to estimate the relationship
between pollution abatement costs per employee and firm size, measured by the number of
employees per firm. The model estimates the relationship of firm compliance costs per
employee to the number of employees, controlling for other factors. The regression results
indicate that a 1 percent increase in firm size (measured in terms of the number of employees)
corresponds to a 0.43 percent decrease in pollution abatement costs per employee. In essence,
this parameter estimates the degree of economies of scale in compliance costs.
This “economies of scale” factor is used to solve for the median cost per employee
within each firm-size category for each business sector. Other studies are consistent with this
finding of economies of scale in environmental regulatory compliance, although Becker (2005)
finds that economies of scale differ depending on the type of pollutant.44
Distribution of Federal Regulatory Costs: Businesses and Others
Table 10 shows the estimated costs of all federal regulations, broken down by type, and
the distribution of the burden between business and others (i.e., individuals and state and local
government).
44
See, for examples, Dean (1994) and Dean, et al. (2000). These two studies suggest that regulatory
costs lower the startup rate for new firms, especially in the manufacturing sector, because of its higher capital requirements from environmental and other types of regulations. They also indicate that environmental regulations increase the minimum efficient scale of production. See also the related study by Staley, et al. (2001). As noted in the text, a recent study finds that relative costs of pollution abatement by firm size vary depending on the type of regulated pollutant (Becker, 2005).

50
Table 10. Cost of Federal Regulation by Type and Business Share (in Billions of 2014 Dollars)
Total Costs Business Portion Others
Share (Percentage)
Amount Share
(Percentage) Amount
All Federal Regulations
$ 2,028 56% $ 1,133 44% $ 895
Economic $ 1,448 50% $ 724 50% $ 724 Environmental $ 330 65% $ 214 35% $ 115 Tax Compliance $ 159 69% $ 109 31% $ 50 OSHHS* $ 92 94% $ 86 6% $ 6
Note to Table 10:
* OSHHS stands for occupational safety and health and homeland security regulations.
The estimates in Table 10 indicate that the annual total cost of all federal regulations in
2012 was $2.028 trillion. We estimate the portion falling on business to be $1.133 trillion. The
most costly are economic regulations at an estimated cost of $1.448 trillion, with $724 billion
falling initially on business. Environmental regulations represent the second-most costly
category ($330 billion), and the cost apportioned to business is $214 billion. The estimated cost
of tax compliance is $159 billion, and the estimated cost of occupational safety and health and
homeland security regulations is $92 billion.
Distribution of the Regulatory Burden Across Business Sectors
Table 11 presents the allocation of the business portion of regulatory costs by sector and
for the four categories of regulations.

51
Table 11. Average Sectoral Regulatory Costs, 2012 (in 2014 Dollars)
Type of Regulation
Total Costs (Billions of
Dollars)
Cost per Firm (Dollars)
Cost per Employee (Dollars)
Cost as a Share of Payroll
(Percentage)
Manufacturing
Total $ 215 $ 864,125 $ 19,564 36%
Economic $ 87 $ 351,511 $ 7,958 15%
Environmental $ 115 $ 463,646 $ 10,497 19%
Tax Compliance $ 3 $ 13,045 $ 295 1%
OSHHS* $ 9 $ 35,924 $ 813 1%
Trade
Total $ 143 $ 150,065 $ 7,028 19%
Economic $ 114 $ 119,259 $ 5,585 15%
Environmental $ - $ - $ - 0%
Tax Compliance $ 14 $ 15,164 $ 710 2%
OSHHS* $ 15 $ 15,642 $ 733 2%
Services
Total $ 459 $ 153,567 $ 8,620 17%
Economic $ 351 $ 117,236 $ 6,580 13%
Environmental $ 1 $ 213 $ 12 0%
Tax Compliance $ 67 $ 22,388 $ 1,257 3%
OSHHS* $ 41 $ 13,729 $ 771 2%
Health Care
Total $ 109 $ 175,382 $ 6,053 13%
Economic $ 87 $ 140,248 $ 4,841 11%
Environmental $ 1 $ 2,310 $ 80 0%
Tax Compliance $ 8 $ 12,721 $ 439 1%
OSHHS* $ 13 $ 20,103 $ 694 2%
Other
Total $ 207 $ 237,898 $ 19,249 35%
Economic $ 85 $ 97,446 $ 7,885 14%
Environmental $ 97 $ 111,454 $ 9,018 17%
Tax Compliance $ 16 $ 18,712 $ 1,514 3%
OSHHS* $ 9 $ 10,287 $ 832 2%
Totals (All U.S. Businesses)
Total $ 1,133 $ 233,182 $ 9,991 21%
Economic $ 724 $ 142,054 $ 6,381 13%
Environmental $ 214 $ 55,923 $ 1,889 4%
Tax Compliance $ 109 $ 18,297 $ 960 2%
OSHHS* $ 86 $ 16,908 $ 761 2%
Notes to Table 11:
* OSHHS stands for occupational safety and health and homeland security regulations.
Columns might not total due to rounding.
As shown in Table 11, considering all U.S. businesses and all federal regulations, the
annual cost burden on the typical U.S. firm is $233,182. The cost per employee for the typical

52
U.S. firm is almost $10,000. This cost of federal regulation in the typical U.S. firm equals 21
percent of payroll expenditures.
These allocations indicate that the manufacturing sector and the “other” sector bear the
largest regulatory shares of total regulatory costs. For example, using the cost per firm metric as
a gauge, the manufacturing sector in particular bears the highest total regulatory burden in
terms of the average cost per firm: $864,125 annually per firm and more than three times the
cost in the “other” category.
The cost estimate for manufacturing in Table 11 is broadly consistent with the survey
results. The survey cost estimate for the manufacturing sector is $138.6 billion. Table 11 reports
a manufacturing sector regulatory cost estimate of $215 billion. The relevant figure for
comparing Table 11 to the survey estimate is to net out economic regulations. (One would not
include the primarily indirect costs of the economic figure because those are inestimable from
the survey results—the survey only informs that they exist.) Taking the sum of direct costs,
environmental, tax compliance and occupational safety and health and homeland security
regulations for manufacturing yield a total of $127 billion. This figure is 8 percent lower than the
survey estimate.
There are several deliberate ways in which the estimates differ. First, the survey
includes federal enforcement or compliance activity for which firms shouldered costs, while the
aggregate estimates do not include them in the three categories summed. Enforcement activity
costs may be included in the estimated cost of economic regulations in Table 11, but there is no
way to reasonably separate them out. Second, the survey did not separate out the cost of tax
compliance, so all tax compliance costs likely were not included. Third, the aggregate figure for
environment includes only estimates for major rules insofar as OMB provides those estimates,
not for all of the environmental rules affecting manufacturing firms. The survey data include all
environmental regulations.

53
Table 12. Regulatory Costs in Small, Medium-Sized and Large Firms, 2012 (Cost per Employee per year in 2014 Dollars)
Type of Regulation
All Firms Firm Size
< 50 Employees
50–99 Employees
100+ Employees
Manufacturing
Total $ 19,564 $ 34,671 $ 18,243 $ 13,750
Economic $ 7,958 $ 12,885 $ 9,399 $ 6,544
Environmental $ 10,497 $ 20,361 $ 7,625 $ 6,239
Tax Compliance $ 295 $ 378 $ 346 $ 269
OSHHS* $ 813 $ 1,048 $ 873 $ 698
Trade
Total $ 7,028 $ 7,174 $ 10,345 $ 6,691
Economic $ 5,585 $ 5,248 $ 8,572 $ 5,448
Environmental $ - $ - $ - $ -
Tax Compliance $ 710 $ 950 $ 961 $ 593
OSHHS* $ 733 $ 976 $ 813 $ 650
Services
Total $ 8,620 $ 7,574 $ 9,099 $ 9,007
Economic $ 6,580 $ 4,554 $ 6,888 $ 7,487
Environmental $ 12 $ 21 $ 8 $ 7
Tax Compliance $ 1,257 $ 2,042 $ 1,406 $ 876
OSHHS* $ 771 $ 956 $ 797 $ 638
Health Care
Total $ 6,053 $ 6,690 $ 6,648 $ 5,805
Economic $ 4,841 $ 4,640 $ 5,482 $ 4,848
Environmental $ 80 $ 187 $ 70 $ 48
Tax Compliance $ 439 $ 939 $ 325 $ 293
OSHHS* $ 694 $ 924 $ 770 $ 616
Other
Total $ 19,249 $ 25,948 $ 18,052 $ 14,745
Economic $ 7,885 $ 6,284 $ 9,589 $ 8,748
Environmental $ 9,018 $ 16,497 $ 6,178 $ 4,215
Tax Compliance $ 1,514 $ 2,135 $ 1,426 $ 1,093
OSHHS* $ 832 $ 1,032 $ 860 $ 688
Totals (All U.S. Businesses)**
Total $ 9,991 $ 11,724 $ 10,664 $ 9,083
Economic $ 6,381 $ 5,662 $ 7,464 $ 6,728
Environmental $ 1,889 $ 3,574 $ 1,338 $ 1,014
Tax Compliance $ 960 $ 1,518 $ 1,053 $ 694
OSHHS* $ 761 $ 970 $ 809 $ 647 Notes to Table 12:
* OSHHS stands for occupational safety and health and homeland security regulations.
** The costs per employee for all U.S. businesses are computed using the employment shares to weight the costs in each of the five respective sectors.
Columns might not total due to rounding.

54
The top-down and bottom-up approaches are very different in terms of methodology and
data sources. That they yield consistent estimates of the direct cost of regulation for the
manufacturing sector supports the strength of each approach individually.
The Distribution of Regulatory Costs by Firm Size
The distribution of regulatory costs among different firm-size categories is presented in
Table 12.
Considering first the aggregate costs for all federal regulations and all business sectors
(displayed as the last category in Table 12), the estimated cost for small firms is $11,724 per
employee.45 Regulations cost medium-sized firms $10,664 per employee and large firms $9,083
per employee. The disproportionate cost burden on small firms is quite dramatic for the
manufacturing sector. In the manufacturing sector, the estimated cost per employee for small
firms ($34,671) is more than two-and-a-half times the cost for large firms ($13,750).
45
The U.S. total figures are based on a weighted average of the costs in the five business categories. The weights for each average use the share for the respective category. For example, for the “cost per firm” value, the cost per firm in each sector is weighted by the share of all U.S. firms in that sector. For the “cost as a percent of payroll” value, the sector values are weighted by the share of all U.S. payroll expenditures in that sector, and so on.

55
V. Summary Comments
By far the most frequently identified business challenge in our survey was federal
government regulation. Eighty-eight percent of survey respondents indicated that federal
government regulation was a challenge that had recently affected their firm or that they
expected their business to face in the future. Further responses provided regulatory cost
information for specific expenditures. Estimating the cost of outlays for manufacturing as a
whole from the respondents’ data indicates that direct expenditures related to regulation in the
past year were $138.6 billion. To put this figure in perspective, it is larger than the economies of
19 U.S. states.
The costs reported in the survey do not capture the total cost of regulations on a sector,
or on the economy as a whole. The survey specifically asked for information regarding federal
regulation and how it related to the distribution of employees’ time; the cost of outside advisers;
purchasing and maintaining tangible items; emissions credits or offsets; and costs resulting from
federal government compliance-related activities. Respondents discussed other costs of
regulations in their open-ended responses. Inefficient planning as a consequence of uncertainty,
including federal regulation in the production location calculus, R&D and capital investment
consequences, and reductions in employment and in competitiveness are among the other
federal regulation consequences respondents identified.
Our economy-wide analysis buttresses and extends the survey estimate. The combined
direct and indirect costs of federal regulations borne by the manufacturing sector are estimated
to be $215 billion. Considering this figure and the survey results together implies that direct
costs make up two-thirds of the total costs of federal government regulations. Put another way,
the total cost of regulation with respect to manufacturers exceeds direct expenditures by 37
percent.
This study provides new estimates of the total costs of federal regulations and the
incidence of these costs across business sectors and firm sizes. The findings suggest that the

56
costs of federal regulations continued to rise to an estimated $2.028 trillion in 2012. Both the
survey and the broader empirical work indicate that small manufacturing firms bear a higher
share of this cost than larger firms.

57
References
Ahmad, Eatzaz, Muhammad Aman Ullah and Muhammad Irfanullah Arfeen (2012), “Does Corruption Affect Economic Growth?” Latin American Journal of Economics, Vol. 49, No. 2, pp. 277–305.
Barro, Robert J., Determinants of Economic Growth: A Cross-Country Empirical Study
(1997), Cambridge, MA: MIT Press. Barro, Robert J. and X. Sala-i-Martin (1995), Economic Growth. New York: McGraw-Hill. Beale, Henry B. R. and King Lin (1998), Impacts of Federal Regulations, Paperwork, and Tax
Requirements on Small Business, SBAHQ-95-C-0023; Microeconomic Applications, Inc., prepared for the Office of Advocacy, U.S. Small Business Administration.
Becker, Randy A. (2005), “Air Pollution Abatement Costs under the Clean Air Act: Evidence
from the PACE Survey,” Journal of Environmental Economics and Management, (5), pp. 144–169.
Bouis, R. and R. Duval (2011), “Raising Potential Growth After the Crisis: A Quantitative
Assessment of the Potential Gains from Various Structural Reforms in the OECD Area and Beyond,” OECD Economics Department Working Papers, No. 835, OECD Publishing, Paris.
Bourlès, R., G. Cette, J. Lopez, J. Mairesse and G. Nicoletti (2010), “Do Product Market
Regulations in Upstream Sectors Curb Productivity Growth: Panel Data Evidence for OECD Countries,” OECD Economics Department Working Papers, No. 791, OECD Publishing, Paris.
Bradford, Steven C. (2004), “Does Size Matter? An Economic Analysis of Small Business
Exemptions from Regulation,” The Journal of Small and Emerging Business Law, 8 (1), pp. 1–37.
Brock, William A. and David S. Evans (1986), The Economics of Small Businesses: Their Role
and Regulation in the U.S. Economy, Holmes & Meier, New York, NY. Cole, Roland J. and Paul Sommers (1980), Costs of Compliance in Small and Moderate-Sized
Businesses, SBA-79-2668, Battelle Human Affairs Research Centers, Seattle, WA, February.
Conway, P., D. de Rosa, G. Nicoletti and F. Steiner (2006), “Regulation, Competition and
Productivity Convergence,” OECD Economics Department Working Papers, No. 509, OECD Publishing, Paris.
Crain, W. Mark (2005), The Impact of Regulatory Costs on Small Firms, Washington, D.C.:
Office of Advocacy, U.S. Small Business Administration. (Available online at archive.sba.gov/advo/research/rs264tot.pdf.)
Crain, W. Mark and Thomas D. Hopkins (2001), The Impact of Regulatory Costs on Small
Firms, U.S. Small Business Administration. (Available online at archive.sba.gov/advo/research/rs207tot.pdf.)

58
Crain, W. Mark and Nicole V. Crain (2010), The Impact of Regulatory Costs on Small Firms,
Washington, D.C.: Office of Advocacy, U.S. Small Business Administration. (Available online at www.sba.gov/sites/default/files/advocacy/The%20Impact%20of%20Regulatory%20Costs%20on%20Small%20Firms%20(Full)_0.pdf.)
Crews, Clyde Wayne Jr., annual editions, 1996 through 2014, Ten Thousand Commandments,
Washington, D.C.: Competitive Enterprise Institute. (Available online at cei.org/10KC.) Dean, Thomas J. (1994), “Pollution Regulations as a Barrier to the Formation of Small
Manufacturing Establishments: A Longitudinal Analysis,” Office of Advocacy, U.S. Small Business Administration: Washington, D.C.
Dean, Thomas J., et al. (2000), “Environmental Regulation as a Barrier to the Formation of
Small Manufacturing Establishments: A Longitudinal Analysis,” Journal of Environmental Economics and Management 40, pp. 56–75.
Farrow, Scott and W. Kip Viscusi (2011), “Towards Principles and Standards for the Benefit-
Cost Analysis of Safety,” Journal of Benefit-Cost Analysis, Vol. 2, Issue 3, Article 5. Gaston, Robert J. and Sidney L. Carroll (1984), State and Local Regulatory Restrictions as
Fixed Cost Barriers to Small Business Enterprise, SBA-7167-AER-83, Applied Economics Group, Inc., Knoxville, TN.
Gayer, Ted and W. Kip Viscusi (2014), “Determining the Proper Scope of Climate Change
Benefits,” Washington, D.C.: GWU Center for Regulatory Studies. Global Competitiveness Report, 2013–2014 (2013), Klaus Schwab, editor, Geneva: World
Economic Forum. Gwartney, James, Robert Lawson and Joshua Hall (2013), Economic Freedom of the World:
2013 Annual Report, Fraser Institute. (Available online at www.fraserinstitute.org and www.freetheworld.com.)
Gwartney, James D., Randall G. Holcombe and Robert A. Lawson (2004), “Economic Freedom,
Institutional Quality, and Cross-Country Differences in Income and Growth,” Cato Journal. 24: pp. 205–233.
Hahn, Robert W. (1996), “Regulatory Reform: What Do the Government’s Numbers Tell Us?” in
Robert W. Hahn (ed.) Risks, Costs, and Lives Saved: Getting Better Results from Regulation, New York: Oxford University Press and AEI Press: pp. 208–253.
Hahn, Robert W. and John A. Hird (1991), “The Costs and Benefits of Regulation: Review and
Synthesis,” Yale Journal of Regulation 8 (1), Vol. 8 (1): pp. 233–278. Hall, Joshua and Robert Lawson (2013), “Economic Freedom of the World: An Accounting of
the Literature,” Contemporary Economic Policy. (Available online at onlinelibrary.wiley.com/doi/10.1111/coep.12010/abstract.)
Hall, Robert E. and Charles I. Jones (1999), “Why Do Some Countries Produce So Much More
Output Per Worker than Others?” Quarterly Journal of Economics, 114: pp. 83–116.

59
Harrington, Winston, Richard D. Morgenstern and Peter Nelson (2000), “On the Accuracy of Regulatory Costs Estimates,” Journal of Policy Analysis and Management, Vol. 19 (2): pp. 297–322.
Hawley, Kip (2008), Testimony before the U.S. House of Representatives, Committee on
Transportation and Infrastructure Subcommittee on Aviation, July 24, 2008. Hazilla, Michael and Raymond J. Kopp (1990), “The Social Cost of Environmental Quality
Regulations: A General Equilibrium Analysis,” Journal of Political Economy, Vol. 98 (4), p. 858.
Hobijn, Bart (2002), “What Will Homeland Security Cost?” FRBNY Economic Policy Review. Hopkins, Thomas D. (1992), Costs of Regulation: Filling the Gaps, report prepared for the
Regulatory Information Service Center, Washington, D.C., August 1992. (Available online at www.thecre.com/pdf/COST%20OF%20REGULATION%20FILLING%20THE%20GAPS.pdf.)
Hopkins, Thomas D. (1995a), “A Survey of Regulatory Burdens,” U.S. Small Business
Administration, Report Number SBA-8029-OA-93. (Available online at www.sba.gov/advo/research/rs163.html.)
Hopkins, Thomas (1995b), Profiles of Regulatory Costs: Report to the U.S. Small Business
Administration, U.S. Department of Commerce, National Technical Information Service #PB96 128038, November 1995. (Available online at www.sba.gov/advo/.)
International Monetary Fund (2004), World Economic Outlook, Ch. III “Fostering Structural
Reforms in Industrial Countries,” International Monetary Fund, April: pp. 103–146. Jack Faucett Associates (1984), Economies of Scale in Regulatory Compliance: Evidence of the
Differential Impacts of Regulation by Firm Size, SBA-7188-OA-83, Jack Faucett Associates, Chevy Chase, MD, December.
Jaffe, Adam B., Steven R. Peterson, Paul R. Portney and Robert Stavins (1995),
“Environmental Regulation and the Competitiveness of U.S. Manufacturing,” Journal of Economic Literature, Vol. 33 (1): pp. 132–163.
Johnson, Joseph M. (2004), The Cost of Regulations Implementing the Clean Water Act,
Arlington, VA: Mercatus Center Regulatory Studies Program Working Paper. Johnson, Joseph M. (2005), “A Review and Synthesis of the Cost of Workplace Regulations,” in
Cross-Border Human Resources, Labor and Employment Issues, Andrew P. Morriss and Samuel Estreicher (eds.), Kluwer Law International: Netherlands, 433-67.
Koske, I., I. Wanner, R. Bitetti and O. Barbiero (2014), “The 2013 Update of the OECD Product
Market Regulation Indicators: Policy Insights for OECD and Non-OECD Countries,” OECD Economics Department Working Papers, forthcoming.
Laband, David and John P. Sophocleus (1988), “The Social Cost of Rent-Seeking: First
Estimates,” Pubic Choice, 58, pp. 269–275.

60
Loayza, Norman V., Ana María Oviedo and Luis Servén (2004), “Regulation and Macroeconomic Performance,” September, World Bank. (Available online at www-wds.worldbank.org/external/default/WDSContentServer/IW3P/IB/2005/02/07/000090341_20050207082757/Rendered/PDF/wps3469.pdf.)
Lopez, Rigoberto A. and Emilio Pagoulatos (1994), “Rent Seeking and the Welfare Cost of
Trade Barriers,” Public Choice, Vol. 79, No. 1/2 (1994), pp. 149–160. Mitchell, Mathew (2012), “The Pathology of Privilege: Economic Consequences of Government
Favoritism,” Arlington, VA: Mercatus Center at George Mason University. Murphy, Kevin M., Andrei Shleifer and Robert W. Vishny, “The Allocation of Talent: Implications
for Growth,” The Quarterly Journal of Economics, Vol. 106, No. 2 (May 1991), pp. 503–530.
Nicoletti, G. and S. Scarpetta (2005), “Product Market Reforms and Employment in OECD
Countries,” OECD Economics Department Working Papers, No. 472, OECD Publishing, Paris.
Organisation for Economic Co-operation and Development (2013), Product Market Regulation
Database. (Available online at www.oecd.org/economy/pmr.) Pande, Rohini, Deanna Ford, Nick Ryan and Anant Sudarshan (2012), “Industrial Pollution,
Regulation and Growth: Governance Challenges and Innovations,” The 2012 San Servolo Workshop on Grand Challenges of Sustainability, Sustainability Science Program Working Paper No. 2012–02, Cambridge, MA: Sustainability Science Program, Harvard University. (Available online at www.hks.harvard.edu/centers/mrcbg/programs/sustsci/documents/papers/2012-02.)
Rode, Martin, Bodo Knoll and Hans Pitlik (2013), in James Gwartney, Robert Lawson and
Joshua Hall, Economic Freedom of the World: 2013 Annual Report, Fraser Institute. (Available online at www.freetheworld.com/datasets_efw.html.)
Sala-i-Martín, X., G. Doppelhoffer and R. Miller (2004), “Cross-Sectional Growth Regressions:
Robustness and Bayesian Model Averaging,” American Economic Review 94 (4), September.
Schiantarelli, Fabio (2008), “Product Market Regulation and Macroeconomic Performance: A
Review of Cross-Country Evidence,” Boston College. (Available online at fmwww.bc.edu/ec-p/wp623.pdf.)
Staley, Samuel R., Howard Husock, David J. Bobb, Sterling Burnett, Laura Crasy and Wade
Hudson (2001), Giving a Leg Up to Bootstrap Entrepreneurship: Expanding Economic Opportunity in America’s Urban Centers, Los Angeles, California: Reason Public Policy Institute.
U.S. Environmental Protection Agency (2013), Fiscal Year 2013 EPA Enforcement and
Compliance Annual Results, prepared by the Office of Enforcement and Compliance Assurance.
U.S. General Accounting Office (1995), “Briefing Report to the Ranking Minority Member,
Committee on Governmental Affairs, U.S. Senate, Regulatory Reform: Information on

61
Costs, Cost Effectiveness and Mandated Deadlines for Regulations, (GAO/PEMD 95 18BR). (Available online at archive.gao.gov/t2pbat1/153774.pdf.)
U.S. International Trade Commission (2013), The Economic Effects of Significant U.S. Import
Restraints, Eighth Update, Investigation No. 332-325, Publication 4440. Xing, Yuqing and Charles D. Kolstad, “Do Lax Environmental Regulations Attract Foreign
Investment?” Environment and Resource Economics, 2002, 21, pp. 1–22.

62
Appendix A. Estimating In-House FTE Costs
The Society for Human Resource Management reports that an average of 19 percent of
an employee’s annual salary is spent on government-mandated benefits (e.g., unemployment,
workers’ compensation and Social Security). Another 19 percent is spent on voluntary benefits,
and 11 percent is spent on pay-for-time-not-worked benefits (regular rate of pay for a
nonworking period of time, such as vacations, holidays, personal, bereavement and sick leave),
for a total of 49 percent of salary. Furthermore, its analysis by organization size “revealed that
large-staff-sized organizations spent more on voluntary benefits when compared with small-
staff-sized organizations.”46
For the purposes of this study, 30 percent of wages was the benefit adjustment for firms
with 100 or fewer employees, and 49 percent was used for larger firms (i.e., those having more
than 100 employees). This adjustment was made because the cost of an FTE to a firm is more
than simply the wage cost; benefits are a cost as well. These calculations result in an average
total FTE cost of $270,972 for firms with 100 or fewer employees; compensation cost rises to
$1,591,679 for large firms.
We also use Census Bureau data in our calculations. The Census Bureau data for
manufacturing, NAICS codes 31–33 (shown in Table A-1), do not reflect exactly the same
categories used in the survey.
46
See www.shrm.org/research/surveyfindings/articles/documents/2011_emp_benefits_report.pdf (p.12).

63
Table A-1. Census Bureau Data on the Manufacturing Sector
All Firms
Firm Size
Small (< 50 Employees)
Medium (50–99
Employees)
Large (100+ Employees)
Number of Firms 254,941 226,207 13,540 15,194
Employment 10,984,361 2,045,099 900,272 8,038,990
Annual Payroll (in Thousands of Dollars)
$ 574,817,032 $ 83,921,306 $ 40,729,140 $ 450,166,586
Average Wage $ 52,330 $ 41,035 $ 45,241 $ 55,998
For example, the survey used 0 to 50 employees for small firms, while the Census uses
0 to 49. Using the survey categories, which closely match the Census boundaries, provides a
better estimate than using the figures for all firms not broken down by firm size because large
firms have disproportionally higher per-firm costs but are a relatively small share of total firms.
However, if we had elected to use this method, the first steps would have been to calculate all of
the FTEs’ costs (calculated by occupation and using Bureau of Labor Statistics data); then sum
them up; and then divide by the total number of firms. That would yield a per-firm salary cost of
$670,527. Multiplying this figure by the total number of manufacturing firms leads to a total
manufacturing regulatory compliance FTE salary cost of $170,944,853,784. This figure would
then be adjusted for benefits to determine total costs, but the adjustment factor is indeterminate
given that small firms provide fewer benefits (as a share of income) compared to large firms.
Bureau of Labor Statistics data was also used to estimate annual wages. Reported
“lawyers” annual wages were used for the attorney category reported here. Similarly, “top
executives” was used for executives; “administrative service managers” was used for
administrative; “accountants and auditors” was used for accounting; an average of broad
“production occupations” was used to estimate the $36,831 wage for skilled labor; unskilled

64
labor’s wage was an average of “production occupations,” “helpers—production workers” and
“production workers, all other,” and was $30,327; and “all occupations” was used for “other.”47
47
The exact occupation code is “occ_code” 51-xxxx. See www.bls.gov/oes/current/oes_nat.htm#00-0000.

65
Appendix B. Alternative Use of Funds Presently Allocated to Regulatory Compliance
In spring 2013, NAM members were surveyed (discussed in Section II) for the purpose
of evaluating the effect of regulations on manufacturing in the United States. Respondents were
asked how their company might reallocate funds if the cost of regulatory compliance was
reduced and answered the open-ended question in writing. A sample of responses was
provided in Section II. Additional responses are provided below.
Investment
Respondents identified four areas of investment spending that likely would increase if
regulatory compliance costs decreased: capital investment and expenditures, growth and
acquisition, R&D and general (unspecified) investment.
Capital Investment and Expenditures
“New or improved facilities.” “New or upgraded equipment.” “Capital improvements to improve viability.” “Reinvest in manufacturing technology and general plant improvements to benefit
the workers’ quality of life at work.” “Plant expansion.”
Growth and Acquisition
“Additional growth resulting from re-investment in our businesses with the corresponding potential for increased jobs.”
“Invest in growth initiatives.” “Expand business.” “Grow the business and increase employment.” “Purchase more raw goods for production purposes.”
R&D
“Develop energy-efficient products.” “Invest in new product development.” “Research, develop and introduce new products.” “Invest in new products and innovation.”

66
“Product and process development.” “Invest in product development to allow us to better compete.” “We would use all of the funds for developing new products.” “Product development and waste reduction.”
General (Unspecified) Investment
“Reinvestment.” “Improvements.”
Employee Initiatives
Respondents identified three areas related to employment that likely would increase if
regulatory compliance costs decreased: creating or preserving jobs, employee training and
wages and/or benefits.
Creating or Preserving Jobs
“Hire more employees.” “Job preservation.” “Add another employee.” “Invest in product development, production and personnel.”
Employee Training
“Hire and train more employees.” “Fund apprenticeship and training programs internally.” “Invest in employee training.”
Wages and/or Benefits
“Share profits with employees/give them a raise.” “Profit sharing, bonuses, pay raises and improved benefits.” “Wage hikes.” “Higher salaries.” “We would love to improve our employees’ wages.”

67
Sales
Respondents identified three areas related to sales that likely would increase if
regulatory compliance costs decreased: marketing and sales efforts, competitiveness and
customer satisfaction.
Marketing and Sales Efforts
“Enhance sales efforts.” “Increase marketing.” “Focus on global sales.” “Advertising for new customers.” “Increase product development and sales resources.”
Competitiveness
“Be more price competitive with global competitors.” “Investment and becoming more price competitive.” “Reduce selling price to improve competitiveness.” “Lower pricing to compete with those foreign sourcing their manufacturing.” “Reduce prices to customers.” “Price reductions to grow the business.” “Reduce selling price to improve competitiveness.”
Customer Satisfaction
“Creating value that customers are willing to pay for.”
ROI or Debt Reduction
Respondents identified areas related to ROI or debt reduction that likely would be
affected if regulatory compliance costs decreased.
ROI or Debt Reduction
“Increase profits or returns to shareholders.” “Pay the bills.” “Debt reduction.” “Pay down debt.”

68
Appendix C. Estimating the Cost of Economic Regulation
The Economic Regulation Index
The cost of economic regulation is measured in terms of the impact on U.S. GDP in
2012—that is, the market value of final goods and services produced in the United States in that
year. To accomplish this, we estimate the relationship between GDP and the Economic
Regulation Index constructed from indicators used in the World Economic Forum’s GCI. We
construct this Economic Regulation Index using the mean value for the following three
components of the GCI:
Burden of government regulation (GCI Variable No. 1.09)
Efficiency of legal framework in challenging regulation (GCI Variable No. 1.11)
Regulation of securities exchanges (GCI Variable No. 8.07)
Other variables may also reflect regulation, but rather than pick and choose arbitrarily,
we simply selected all the variables that included a reference to regulation. These three GCI
components are not available for every year. For the years not available, we computed the
mean using the components that are available.
Sample of Countries Used in the Estimation and Summary Statistics
Table C-1 lists the countries used to estimate the parameters in Equation (1), and Table
C-2 provides summary statistics for the variables used in the analysis.
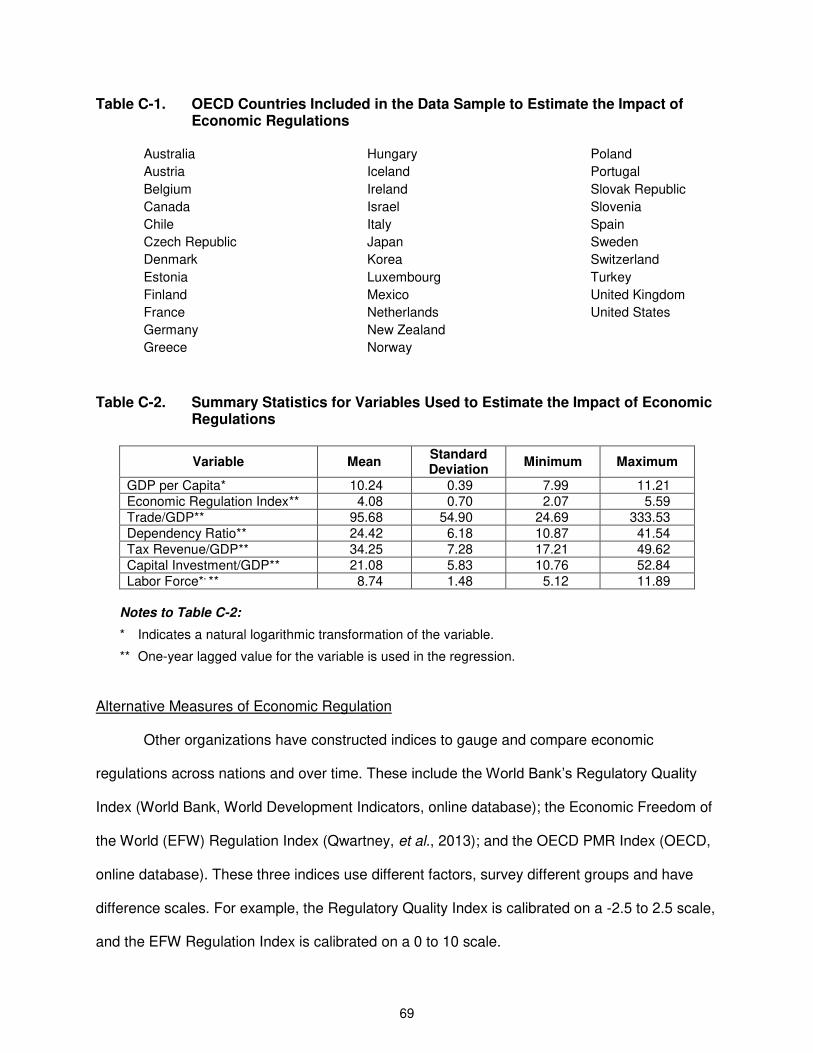
69
Table C-1. OECD Countries Included in the Data Sample to Estimate the Impact of Economic Regulations
Australia
Austria
Belgium
Canada
Chile
Czech Republic
Denmark
Estonia
Finland
France
Germany
Greece
Hungary
Iceland
Ireland
Israel
Italy
Japan
Korea
Luxembourg
Mexico
Netherlands
New Zealand
Norway
Poland
Portugal
Slovak Republic
Slovenia
Spain
Sweden
Switzerland
Turkey
United Kingdom
United States
Table C-2. Summary Statistics for Variables Used to Estimate the Impact of Economic Regulations
Variable Mean Standard Deviation
Minimum Maximum
GDP per Capita* 10.24 0.39 7.99 11.21 Economic Regulation Index** 4.08 0.70 2.07 5.59 Trade/GDP** 95.68 54.90 24.69 333.53 Dependency Ratio** 24.42 6.18 10.87 41.54 Tax Revenue/GDP** 34.25 7.28 17.21 49.62 Capital Investment/GDP** 21.08 5.83 10.76 52.84 Labor Force*
, ** 8.74 1.48 5.12 11.89
Notes to Table C-2:
* Indicates a natural logarithmic transformation of the variable.
** One-year lagged value for the variable is used in the regression.
Alternative Measures of Economic Regulation
Other organizations have constructed indices to gauge and compare economic
regulations across nations and over time. These include the World Bank’s Regulatory Quality
Index (World Bank, World Development Indicators, online database); the Economic Freedom of
the World (EFW) Regulation Index (Qwartney, et al., 2013); and the OECD PMR Index (OECD,
online database). These three indices use different factors, survey different groups and have
difference scales. For example, the Regulatory Quality Index is calibrated on a -2.5 to 2.5 scale,
and the EFW Regulation Index is calibrated on a 0 to 10 scale.

70
Table C-3. The Impact of the World Bank Regulatory Quality Index on Economic Performance
Dependent Variable:
GDP per Capitaa
(in 2005 Dollars)
(1) (2) Regulatory Quality Index—World Bank 0.253 0.178 (4.14)** (3.79)** Trade / GDP 0.002 0.002 (3.31)** (2.69)** Dependency Ratio 0.011 0.003 (1.97)* (0.58) Tax Revenue / GDP 0.030 0.025 (1.17) (1.30) (Tax Revenue / GDP) Squared -0.0003 -0.0002 (-0.84) (-0.78) Capital Investment / GDP 0.0134 0.008 (3.64)** (3.03)** Labor Force
a 0.052 0.027
(1.96)* (0.96) Year = 2008 -0.017 0.018 (-0.69) (0.73) Year = 2009 -0.069 -0.036 (-2.75)** (-1.45) Trend 0.010 (4.69)** Constant 8.06 -12.40 (15.51)** (-2.76)** R-sq: Within 0.04 0.18 Between 0.66 0.61 Overall 0.59 0.55 Number of Observations 355 423
Notes to Table C-3:
a Indicates a variable is entered into the regression as a natural logarithmic
transformation.
The models are estimated using panel data for all OECD countries for which the data are available for the years 1996, 1998, 2000 and 2002–2013. Each independent variable is lagged one year.
z-statistics are shown in parentheses, where ** indicates significance at the 1 percent level and * indicates significance at the 5 percent level.
For comparison, we estimate Equation (1) using the World Bank’s Regulatory Quality
Index. These results are shown in Table C-3. We note that estimating Equation (1) using the
EFW Regulation Index also yields a statistically significant coefficient. Unfortunately, data for the
United States are not included in the most recent (2013) edition of the OECD PMR Index.

71
Because the most recently available PMR Index value for the United States is for 2008, we do
not perform the analysis using that index.
The estimated coefficients on the Regulatory Quality Index in Table C-3 are statistically
significant at the 1 percent confidence level. These results provide additional evidence that
complying with economic regulations systematic affects a nation’s overall production.
As a further comparison, we apply the methodology described in the text to estimate the
cost of economic regulations based on these two alternative indices. For the World Bank’s
Regulatory Quality Index, using the coefficient in Column (1) of Table C-3 and applying the 26
percent difference to the benchmark yields an estimated cost in terms of reduced GDP of $1.41
trillion (denominated in 2014 dollars). We note that applying a different benchmark—the mean
value of the Regulatory Quality Index for the five highest-ranked countries—yields an estimated
cost of $2.2 trillion. This is because the difference between the mean value for the five OECD
countries with the least regulatory burden and the value of the Regulatory Quality Index is about
42 percent.
As a final comparison, we used a slightly different procedure to estimate the cost of
economic regulation using the results for the EFW Regulation Index. This is because the EFW
Index is calibrated such that the maximum value of 10 corresponds to “an effort to identify how
closely the institutions and policies of a country correspond with the ideal of a limited
government” (Gwartney, et al., 2014, p. 2). In other words, a “10” does not imply the absence of
regulation, so we use that as the benchmark for comparison. Based on the EFW Index, the
estimated cost of economic regulation in 2012 is $1.64 trillion (denominated in 2014 dollars).

72
Appendix D. Regulatory Costs by Firm Size Using Alternative Firm-Size Categories
Some past studies, including several for the SBA, have classified small, medium-sized
and large firms in the following way: firms with fewer than 20 employees (small), firms with 20–
499 employees (medium-sized) and firms with 500 or more employees (large). To facilitate
comparisons to these studies, we allocate regulatory costs using these alternative firm-size
categories. The allocations are presented in Table D-1.

73
Table D-1. Breakdown of Costs Using Alternative Firm-Size Categories, 2012 (Cost per Employee in 2014 Dollars)
Type of Regulation
All Firms Firm Size
< 20 Employees
20–499 Employees
500+ Employees
Manufacturing
Total $ 19,564 $ 48,827 $ 16,512 $ 12,047
Economic $ 7,958 $ 15,948 $ 7,968 $ 6,569
Environmental $ 10,497 $ 31,265 $ 7,400 $ 4,526
Tax Compliance $ 295 $ 573 $ 278 $ 259
OSHHS* $ 813 $ 1,040 $ 867 $ 694
Trade
Total $ 7,028 $ 7,070 $ 8,922 $ 6,198
Economic $ 5,585 $ 4,868 $ 7,320 $ 5,065
Environmental $ - $ - $ - $ -
Tax Compliance $ 710 $ 1,249 $ 808 $ 499
OSHHS* $ 733 $ 953 $ 794 $ 635
Services
Total $ 8,620 $ 8,130 $ 7,932 $ 9,174
Economic $ 6,580 $ 4,590 $ 5,999 $ 7,693
Environmental $ 12 $ 30 $ 7 $ 4
Tax Compliance $ 1,257 $ 2,556 $ 1,132 $ 841
OSHHS* $ 771 $ 954 $ 795 $ 636
Health Care
Total $ 6,053 $ 7,244 $ 5,522 $ 6,042
Economic $ 4,841 $ 4,728 $ 4,437 $ 5,112
Environmental $ 80 $ 266 $ 63 $ 39
Tax Compliance $ 439 $ 1,348 $ 270 $ 290
OSHHS* $ 694 $ 902 $ 752 $ 602
Other
Total $ 19,249 $ 32,676 $ 15,841 $ 13,681
Economic $ 7,885 $ 5,878 $ 8,386 $ 8,723
Environmental $ 9,018 $ 22,908 $ 5,422 $ 3,316
Tax Compliance $ 1,514 $ 2,860 $ 1,173 $ 955
OSHHS* $ 832 $ 1,031 $ 859 $ 687
Totals (All U.S. Businesses)**
Total $ 9,991 $ 4,063 $ 9,304 $ 8,845
Economic $ 6,381 $ 5,883 $ 6,402 $ 6,798
Environmental $ 1,889 $ 5,254 $ 1,243 $ 760
Tax Compliance $ 960 $ 1,966 $ 857 $ 646
OSHHS* $ 761 $ 961 $ 801 $ 641
Notes to Table D-1:
* OSHHS stands for occupational safety and health and homeland security regulations.
** The costs per employee for all U.S. businesses are computed using the employment shares to weight the costs in each of the five respective sectors.
Columns might not total due to rounding.

xxxxxxxxxxxxxxxxxxxxxxxxxxxxxxxxxxxxxxxxxxxxxxxxxxxxxxxxxxxxxxxxxxxxxxxxxxxxxxxxxxxxxxxxxxxxxxxxxxx
xxxxxxxxxxxxxxxxxxxxxxxxxxxxxxxxxxxxxxxxxxxxxxxxxxxxxxxxxxxxxxxxxxxxxxxxxxxxxxxxxxxxxxxxxxxxxxxxxxx
xxxxxxxxxxxxxxxxxxxxxxxxxxxxxxxxxxxxxxxxxxxxxxxxxxxxxxxxxxxxxxxxxxxxxxxxxxxxxxxxxxxxxxxxxxxxxxxxxxx
xxxxxxxxxxxxxxxxxxxxxxxxxxxxxxxxxxxxxxxxxxxxxxxxxxxxxxxxxxxxxxxxxxxxxxxxxxxxxxxxxxxxxxxxxxxxxxxxxxx
xxxxxxxxxxxxxxxxxxxxxxxxxxxxxxxxxxxxxxxxxxxxxxxxxxxxxxxxxxxxxxxxxxxxxxxxxxxxxxxxxxxxxxxxxxxxxxxxxxx
xxxxxxxxxxxxxxxxxxxxxxxxxxxxxxxxxxxxxxxxxxxxxxxxxxxxxxxxxxxxxxxxxxxxxxxxxxxxxxxxxxxxxxxxxxxxxxxxxxx
xxxxxxxxxxxxxxxxxxxxxxxxxxxxxxxxxxxxxxxxxxxxxxxxxxxxxxxxxxxxxxxxxxxxxxxxxxxxxxxxxxxxxxxxxxxxxxxxxxx
xxxxxxxxxxxxxxxxxxxxxxxxxxxxxxxxxxxxxxxxxxxxxxxxxxxxxxxxxxxxxxxxxxxxxxxxxxxxxxxxxxxxxxxxxxxxxxxxxxx
xxxxxxxxxxxxxxxxxxxxxxxxxxxxxxxxxxxxxxxxxxxxxxxxxxxxxxxxxxxxxxxxxxxxxxxxxxxxxxxxxxxxxxxxxxxxxxxxxxx
xxxxxxxxxxxxxxxxxxxxxxxxxxxxxxxxxxxxxxxxxxxxxxxxxxxxxxxxxxxxxxxxxxxxxxxxxxxxxxxxxxxxxxxxxxxxxxxxxxx
xxxxxxxxxxxxxxxxxxxxxxxxxxxxxxxxxxxxxxxxxxxxxxxxxxxxxxxxxxxxxxxxxxxxxxxxxxxxxxxxxxxxxxxxxxxxxxxxxxx
xxxxxxxxxxxxxxxxxxxxxxxxxxxxxxxxxxxxxxxxxxxxxxxxxxxxxxxxxxxxxxxxxxxxxxxxxxxxxxxxxxxxxxxxxxxxxxxxxxx
xxxxxxxxxxxxxxxxxxxxxxxxxxxxxxxxxxxxxxxxxxxxxxxxxxxxxxxxxxxxxxxxxxxxxxxxxxxxxxxxxxxxxxxxxxxxxxxxxxx
xxxxxxxxxxxxxxxxxxxxxxxxxxxxxxxxxxxxxxxxxxxxxxxxxxxxxxxxxxxxxxxxxxxxxxxxxxxxxxxxxxxxxxxxxxxxxxxxxxx
xxxxxxxxxxxxxxxxxxxxxxxxxxxxxxxxxxxxxxxxxxxxxxxxxxxxxxxxxxxxxxxxxxxxxxxxxxxxxxxxxxxxxxxxxxxxxxxxxxx
xxxxxxxxxxxxxxxxxxxxxxxxxxxxxxxxxxxxxxxxxxxxxxxxxxxxxxxxxxxxxxxxxxxxxxxxxxxxxxxxxxxxxxxxxxxxxxxxxxx
xxxxxxxxxxxxxxxxxxxxxxxxxxxxxxxxxxxxxxxxxxxxxxxxxxxxxxxxxxxxxxxxxxxxxxxxxxxxxxxxxxxxxxxxxxxxxxxxxxx
xxxxxxxxxxxxxxxxxxxxxxxxxxxxxxxxxxxxxxxxxxxxxxxxxxxxxxxxxxxxxxxxxxxxxxxxxxxxxxxxxxxxxxxxxxxxxxxxxxx
xxxxxxxxxxxxxxxxxxxxxxxxxxxxxxxxxxxxxxxxxxxxxxxxxxxxxxxxxxxxxxxxxxxxxxxxxxxxxxxxxxxxxxxxxxxxxxxxxxx
xxxxxxxxxxxxxxxxxxxxxxxxxxxxxxxxxxxxxxxxxxxxxxxxxxxxxxxxxxxxxxxxxxxxxxxxxxxxxxxxxxxxxxxxxxxxxxxxxxx
xxxxxxxxxxxxxxxxxxxxxxxxxxxxxxxxxxxxxxxxxxxxxxxxxxxxxxxxxxxxxxxxxxxxxxxxxxxxxxxxxxxxxxxxxxxxxxxxxxx
xxxxxxxxxxxxxxxxxxxxxxxxxxxxxxxxxxxxxxxxxxxxxxxxxxxxxxxxxxxxxxxxxxxxxxxxxxxxxxxxxxxxxxxxxxxxxxxxxxx
xxxxxxxxxxxxxxxxxxxxxxxxxxxxxxxxxxxxxxxxxxxxxxxxxxxxxxxxxxxxxxxxxxxxxxxxxxxxxxxxxxxxxxxxxxxxxxxxxxx
xxxxxxxxxxxxxxxxxxxxxxxxxxxxxxxxxxxxxxxxxxxxxxxxxxxxxxxxxxxxxxxxxxxxxxxxxxxxxxxxxxxxxxxxxxxxxxxxxxx
xxxxxxxxxxxxxxxxxxxxxxxxxxxxxxxxxxxxxxxxxxxxxxxxxxxxxxxxxxxxxxxxxxxxxxxxxxxxxxxxxxxxxxxxxxxxxxxxxxx
xxxxxxxxxxxxxxxxxxxxxxxxxxxxxxxxxxxxxxxxxxxxxxxxxxxxxxxxxxxxxxxxxxxxxxxxxxxxxxxxxxxxxxxxxxxxxxxxxxx
xxxxxxxxxxxxxxxxxxxxxxxxxxxxxxxxxxxxxxxxxxxxxxxxxxxxxxxxxxxxxxxxxxxxxxxxxxxxxxxxxxxxxxxxxxxxxxxxxxx
xxxxxxxxxxxxxxxxxxxxxxxxxxxxxxxxxxxxxxxxxxxxxxxxxxxxxxxxxxxxxxxxxxxxxxxxxxxxxxxxxxxxxxxxxxxxxxxxxxx
xxxxxxxxxxxxxxxxxxxxxxxxxxxxxxxxxxxxxxxxxxxxxxxxxxxxxxxxxxxxxxxxxxxxxxxxxxxxxxxxxxxxxxxxxxxxxxxxxxx
xxxxxxxxxxxxxxxxxxxxxxxxxxxxxxxxxxxxxxxxxxxxxxxxxxxxxxxxxxxxxxxxxxxxxxxxxxxxxxxxxxxxxxxxxxxxxxxxxxx
xxxxxxxxxxxxxxxxxxxxxxxxxxxxxxxxxxxxxxxxxxxxxxxxxxxxxxxxxxxxxxxxxxxxxxxxxxxxxxxxxxxxxxxxxxxxxxxxxxx
xxxxxxxxxxxxxxxxxxxxxxxxxxxxxxxxxxxxxxxxxxxxxxxxxxxxxxxxxxxxxxxxxxxxxxxxxxxxxxxxxxxxxxxxxxxxxxxxxxx
xxxxxxxxxxxxxxxxxxxxxxxxxxxxxxxxxxxxxxxxxxxxxxxxxxxxxxxxxxxxxxxxxxxxxxxxxxxxxxxxxxxxxxxxxxxxxxxxxxx
xxxxxxxxxxxxxxxxxxxxxxxxxxxxxxxxxxxxxxxxxxxxxxxxxxxxxxxxxxxxxxxxxxxxxxxxxxxxxxxxxxxxxxxxxxxxxxxxxxx
xxxxxxxxxxxxxxxxxxxxxxxxxxxxxxxxxxxxxxxxxxxxxxxxxxxxxxxxxxxxxxxxxxxxxxxxxxxxxxxxxxxxxxxxxxxxxxxxxxx
xxxxxxxxxxxxxxxxxxxxxxxxxxxxxxxxxxxxxxxxxxxxxxxxxxxxxxxxxxxxxxxxxxxxxxxxxxxxxxxxxxxxxxxxxxxxxxxxxxx
xxxxxxxxxxxxxxxxxxxxxxxxxxxxxxxxxxxxxxxxxxxxxxxxxxxxxxxxxxxxxxxxxxxxxxxxxxxxxxxxxxxxxxxxxxxxxxxxxxx
xxxxxxxxxxxxxxxxxxxxxxxxxxxxxxxxxxxxxxxxxxxxxxxxxxxxxxxxxxxxxxxxxxxxxxxxxxxxxxxxxxxxxxxxxxxxxxxxxxx
xxxxxxxxxxxxxxxxxxxxxxxxxxxxxxxxxxxxxxxxxxxxxxxxxxxxxxxxxxxxxxxxxxxxxxxxxxxxxxxxxxxxxxxxxxxxxxxxxxx
xxxxxxxxxxxxxxxxxxxxxxxxxxxxxxxxxxxxxxxxxxxxxxxxxxxxxxxxxxxxxxxxxxxxxxxxxxxxxxxxxxxxxxxxxxxxxxxxxxx
xxxxxxxxxxxxxxxxxxxxxxxxxxxxxxxxxxxxxxxxxxxxxxxxxxxxxxxxxxxxxxxxxxxxxxxxxxxxxxxxxxxxxxxxxxxxxxxxxxx
xxxxxxxxxxxxxxxxxxxxxxxxxxxxxxxxxxxxxxxxxxxxxxxxxxxxxxxxxxxxxxxxxxxxxxxxxxxxxxxxxxxxxxxxxxxxxxxxxxx
xxxxxxxxxxxxxxxxxxxxxxxxxxxxxxxxxxxxxxxxxxxxxxxxxxxxxxxxxxxxxxxxxxxxxxxxxxxxxxxxxxxxxxxxxxxxxxxxxxx
xxxxxxxxxxxxxxxxxxxxxxxxxxxxxxxxxxxxxxxxxxxxxxxxxxxxxxxxxxxxxxxxxxxxxxxxxxxxxxxxxxxxxxxxxxxxxxxxxxx
xxxxxxxxxxxxxxxxxxxxxxxxxxxxxxxxxxxxxxxxxxxxxxxxxxxxxxxxxxxxxxxxxxxxxxxxxxxxxxxxxxxxxxxxxxxxxxxxxxx
xxxxxxxxxxxxxxxxxxxxxxxxxxxxxxxxxxxxxxxxxxxxxxxxxxxxxxxxxxxxxxxxxxxxxxxxxxxxxxxxxxxxxxxxxxxxxxxxxxx
xxxxxxxxxxxxxxxxxxxxxxxxxxxxxxxxxxxxxxxxxxxxxxxxxxxxxxxxxxxxxxxxxxxxxxxxxxxxxxxxxxxxxxxxxxxxxxxxxxx
xxxxxxxxxxxxxxxxxxxxxxxxxxxxxxxxxxxxxxxxxxxxxxxxxxxxxxxxxxxxxxxxxxxxxxxxxxxxxxxxxxxxxxxxxxxxxxxxxxx
xxxxxxxxxxxxxxxxxxxxxxxxxxxxxxxxxxxxxxxxxxxxxxxxxxxxxxxxxxxxxxxxxxxxxxxxxxxxxxxxxxxxxxxxxxxxxxxxxxx
xxxxxxxxxxxxxxxxxxxxxxxxxxxxxxxxxxxxxxxxxxxxxxxxxxxxxxxxxxxxxxxxxxxxxxxxxxxxxxxxxxxxxxxxxxxxxxxxxxx
xxxxxxxxxxxxxxxxxxxxxxxxxxxxxxxxxxxxxxxxxxxxxxxxxxxxxxxxxxxxxxxxxxxxxxxxxxxxxxxxxxxxxxxxxxxxxxxxxxx
xxxxxxxxxxxxxxxxxxxxxxxxxxxxxxxxxxxxxxxxxxxxxxxxxxxxxxxxxxxxxxxxxxxxxxxxxxxxxxxxxxxxxxxxxxxxxxxxxxx
xxxxxxxxxxxxxxxxxxxxxxxxxxxxxxxxxxxxxxxxxxxxxxxxxxxxxxxxxxxxxxxxxxxxxxxxxxxxxxxxxxxxxxxxxxxxxxxxxxx
xxxxxxxxxxxxxxxxxxxxxxxxxxxxxxxxxxxxxxxxxxxxxxxxxxxxxxxxxxxxxxxxxxxxxxxxxxxxxxxxxxxxxxxxxxxxxxxxxxx
xxxxxxxxxxxxxxxxxxxxxxxxxxxxxxxxxxxxxxxxxxxxxxxxxxxxxxxxxxxxxxxxxxxxxxxxxxxxxxxxxxxxxxxxxxxxxxxxxxx
xxxxxxxxxxxxxxxxxxxxxxxxxxxxxxxxxxxxxxxxxxxxxxxxxxxxxxxxxxxxxxxxxxxxxxxxxxxxxxxxxxxxxxxxxxxxxxxxxxx
xxxxxxxxxxxxxxxxxxxxxxxxxxxxxxxxxxxxxxxxxxxxxxxxxxxxxxxxxxxxxxxxxxxxxxxxxxxxxxxxxxxxxxxxxxxxxxxxxxx
xxxxxxxxxxxxxxxxxxxxxxxxxxxxxxxxxxxxxxxxxxxxxxxxxxxxxxxxxxxxxxxxxxxxxxxxxxxxxxxxxxxxxxxxxxxxxxxxxxx
xxxxxxxxxxxxxxxxxxxxxxxxxxxxxxxxxxxxxxxxxxxxxxxxxxxxxxxxxxxxxxxxxxxxxxxxxxxxxxxxxxxxxxxxxxxxxxxxxxx
xxxxxxxxxxxxxxxxxxxxxxxxxxxxxxxxxxxxxxxxxxxxxxxxxxxxxxxxxxxxxxxxxxxxxxxxxxxxxxxxxxxxxxxxxxxxxxxxxxx
xxxxxxxxxxxxxxxxxxxxxxxxxxxxxxxxxxxxxxxxxxxxxxxxxxxxxxxxxxxxxxxxxxxxxxxxxxxxxxxxxxxxxxxxxxxxxxxxxxx
xxxxxxxxxxxxxxxxxxxxxxxxxxxxxxxxxxxxxxxxxxxxxxxxxxxxxxxxxxxxxxxxxxxxxxxxxxxxxxxxxxxxxxxxxxxxxxxxxxx
xxxxxxxxxxxxxxxxxxxxxxxxxxxxxxxxxxxxxxxxxxxxxxxxxxxxxxxxxxxxxxxxxxxxxxxxxxxxxxxxxxxxxxxxxxxxxxxxxxx
xxxxxxxxxxxxxxxxxxxxxxxxxxxxxxxxxxxxxxxxxxxxxxxxxxxxxxxxxxxxxxxxxxxxxxxxxxxxxxxxxxxxxxxxxxxxxxxxxxx
xxxxxxxxxxxxxxxxxxxxxxxxxxxxxxxxxxxxxxxxxxxxxxxxxxxxxxxxxxxxxxxxxxxxxxxxxxxxxxxxxxxxxxxxxxxxxxxxxxx
xxxxxxxxxxxxxxxxxxxxxxxxxxxxxxxxxxxxxxxxxxxxxxxxxxxxxxxxxxxxxxxxxxxxxxxxxxxxxxxxxxxxxxxxxxxxxxxxxxx
xxxxxxxxxxxxxxxxxxxxxxxxxxxxxxxxxxxxxxxxxxxxxxxxxxxxxxxxxxxxxxxxxxxxxxxxxxxxxxxxxxxxxxxxxxxxxxxxxxx
xxxxxxxxxxxxxxxxxxxxxxxxxxxxxxxxxxxxxxxxxxxxxxxxxxxxxxxxxxxxxxxxxxxxxxxxxxxxxxxxxxxxxxxxxxxxxxxxxxx
xxxxxxxxxxxxxxxxxxxxxxxxxxxxxxxxxxxxxxxxxxxxxxxxxxxxxxxxxxxxxxxxxxxxxxxxxxxxxxxxxxxxxxxxxxxxxxxxxxx
xxxxxxxxxxxxxxxxxxxxxxxxxxxxxxxxxxxxxxxxxxxxxxxxxxxxxxxxxxxxxxxxxxxxxxxxxxxxxxxxxxxxxxxxxxxxxxxxxxx
xxxxxxxxxxxxxxxxxxxxxxxxxxxxxxxxxxxxxxxxxxxxxxxxxxxxxxxxxxxxxxxxxxxxxxxxxxxxxxxxxxxxxxxxxxxxxxxxxxx
xxxxxxxxxxxxxxxxxxxxxxxxxxxxxxxxxxxxxxxxxxxxxxxxxxxxxxxxxxxxxxxxxxxxxxxxxxxxxxxxxxxxxxxxxxxxxxxxxxx
xxxxxxxxxxxxxxxxxxxxxxxxxxxxxxxxxxxxxxxxxxxxxxxxxxxxxxxxxxxxxxxxxxxxxxxxxxxxxxxxxxxxxxxxxxxxxxxxxxx
xxxxxxxxxxxxxxxxxxxxxxxxxxxxxxxxxxxxxxxxxxxxxxxxxxxxxxxxxxxxxxxxxxxxxxxxxxxxxxxxxxxxxxxxxxxxxxxxxxx
xxxxxxxxxxxxxxxxxxxxxxxxxxxxxxxxxxxxxxxxxxxxxxxxxxxxxxxxxxxxxxxxxxxxxxxxxxxxxxxxxxxxxxxxxxxxxxxxxxx
xxxxxxxxxxxxxxxxxxxxxxxxxxxxxxxxxxxxxxxxxxxxxxxxxxxxxxxxxxxxxxxxxxxxxxxxxxxxxxxxxxxxxxxxxxxxxxxxxxx
xxxxxxxxxxxxxxxxxxxxxxxxxxxxxxxxxxxxxxxxxxxxxxxxxxxxxxxxxxxxxxxxxxxxxxxxxxxxxxxxxxxxxxxxxxxxxxxxxxx
xxxxxxxxxxxxxxxxxxxxxxxxxxxxxxxxxxxxxxxxxxxxxxxxxxxxxxxxxxxxxxxxxxxxxxxxxxxxxxxxxxxxxxxxxxxxxxxxxxx
xxxxxxxxxxxxxxxxxxxxxxxxxxxxxxxxxxxxxxxxxxxxxxxxxxxxxxxxxxxxxxxxxxxxxxxxxxxxxxxxxxxxxxxxxxxxxxxxxxx
xxxxxxxxxxxxxxxxxxxxxxxxxxxxxxxxxxxxxxxxxxxxxxxxxxxxxxxxxxxxxxxxxxxxxxxxxxxxxxxxxxxxxxxxxxxxxxxxxxx
xxxxxxxxxxxxxxxxxxxxxxxxxxxxxxxxxxxxxxxxxxxxxxxxxxxxxxxxxxxxxxxxxxxxxxxxxxxxxxxxxxxxxxxxxxxxxxxxxxx
xxxxxxxxxxxxxxxxxxxxxxxxxxxxxxxxxxxxxxxxxxxxxxxxxxxxxxxxxxxxxxxxxxxxxxxxxxxxxxxxxxxxxxxxxxxxxxxxxxx
xxxxxxxxxxxxxxxxxxxxxxxxxxxxxxxxxxxxxxxxxxxxxxxxxxxxxxxxxxxxxxxxxxxxxxxxxxxxxxxxxxxxxxxxxxxxxxxxxxx
xxxxxxxxxxxxxxxxxxxxxxxxxxxxxxxxxxxxxxxxxxxxxxxxxxxxxxxxxxxxxxxxxxxxxxxxxxxxxxxxxxxxxxxxxxxxxxxxxxx
xxxxxxxxxxxxxxxxxxxxxxxxxxxxxxxxxxxxxxxxxxxxxxxxxxxxxxxxxxxxxxxxxxxxxxxxxxxxxxxxxxxxxxxxxxxxxxxxxxx
xxxxxxxxxxxxxxxxxxxxxxxxxxxxxxxxxxxxxxxxxxxxxxxxxxxxxxxxxxxxxxxxxxxxxxxxxxxxxxxxxxxxxxxxxxxxxxxxxxx
xxxxxxxxxxxxxxxxxxxxxxxxxxxxxxxxxxxxxxxxxxxxxxxxxxxxxxxxxxxxxxxxxxxxxxxxxxxxxxxxxxxxxxxxxxxxxxxxxxx
xxxxxxxxxxxxxxxxxxxxxxxxxxxxxxxxxxxxxxxxxxxxxxxxxxxxxxxxxxxxxxxxxxxxxxxxxxxxxxxxxxxxxxxxxxxxxxxxxxx
www.nam.org
Connect with Us