Embed Size (px)
Citation preview

Copyright 2016. This document may not be reproduced without the express written consent of Marc E. Herniter or Rose-Hulman Institute of Technology.
XV. Veh icle Improvements
Lesson XV: Vehicle Improvements In this lesson we will suggest various improvements that you could make to the vehicle in an attempt to
increase its performance. We will not discuss in detail how to make those improvements. The implementation is an assignment for the student. Hopefully you can use all of the knowledge you have gained in the previous lessons to implement your own solution to the suggested improvement. Also note that this list is not exhaustive. You may have your own ideas that you may want to attempt. It is never wrong to come up with an idea. It is only wrong to not separate the good ideas from the bad ideas. Always think your ideas through before testing them, and discuss them with your peers. There may be an obvious flaw that you or someone else can identify. If the ideas still sound feasible, give it a try.
Note that this section could take several weeks as the process is to try ideas that may or may not improve the vehicles performance. The amount of time depends on the number of ideas you want to test and the amount of time left until the competition. You do not need to try all of the ideas in this section, and you can come up with your own ideas. Not all of the ideas listed in this section will yield performance improvements.
Before choosing a method to implement, you should read this entire chapter and decide which methods you want to investigate. There is no specific order in which you should proceed. You can test as few or as many as you wish. However, you should read this entire lesson to see which methods interest you.
A. Metrics, Testing, and Evaluation In order to evaluate your ideas and their implementation, we need to come up with metrics to gauge our
performance. You will need to come up with a number of performance metrics, figure out how to test those metrics, record the results, and then compare those results.
First we must come up with some performance metrics. Some examples are given below. You should come up with additional metrics as well:
• Time for your vehicle to complete 10 laps around the oval. • Minimum distance from the inside edge. • Minimum distance from the outside edge. • Does the vehicle drive straight? • How deep into the corner does the vehicle travel before it starts a turn? • What is the turning radius of your vehicle? • What is the top speed of your vehicle in a straightaway? • What is the minimum speed of your vehicle in a curve?
You will probably add metrics as you find that unwanted things and/or good things happen when you make changes, and you decided that those things are important. The more you work with your vehicle, the more things you will notice. If these things are important, you will come up with a metric for that thing and figure out how to test and measure it.
In order to test our ideas, we need to benchmark our original vehicle. Create a set of performance metrics, design a set of tests, and record those results for the vehicle that you completed at the conclusion of the last lesson. This is our baseline. We can then compare this baseline to the ideas we try in this section.
Lesson XV: Vehicle Improvements 199
Copyright 2016. This document may not be reproduced without the express written consent of Marc E. Herniter or Rose-Hulman Institute of Technology.
Also note that we are suggesting several new methods in this section. In addition to testing and varying these methods, you will also need to test the steering gain, vehicle speed, and camera angle in conjunction with these new methods. Although the exercises may not mention this testing, many of these new methods will affect how you set these parameters, and variations in the steering gain, vehicle speed, and camera settings should be tested in conjunction with the new methods mentioned.
Exercise XV-1: Create a list of metrics that you wish to use to evaluate the Performance of your vehicle. This should be a bulleted list. Specify how you would test and measure each metric.
Exercise XV-2: Create a table in which to record the performance metrics listed in Exercise XV-1.
Exercise XV-3: Measure the performance of your baseline vehicle. Record the information in your table. Keep the table in a safe location such as a notebook or file folder. You will need to compare the baseline results to all of the ideas you attempt in this section.
B. Basic Adjustments In pervious lessons, we have discussed the steering gain, camera adjustments, and vehicle speed. The
team that understands these basic adjustments will achieve the greatest performance improvements without making any additional changes when compared to a team that takes these items lightly and focuses only on the improvements suggested in this lesson. Steering gain, camera adjustments, and vehicle speed are the fundamentals of the vehicle operation. Finding the best combination of these items will yield the greatest performance benefits.
Come up with a logical way to vary each item (steering gain, camera settings, and vehicle speed) and then measure the performance. Note that they are interdependent, but if you vary one at a time and carefully observe the vehicle’s operation, you can determine its affect. Vary these three, record the performance, and attempt to achieve the best vehicle performance before attempting the items below. Document and record all changes and results. (Fill out a lot of tables and make notes of what you have changed.)
C. Cleaning the Tires You may have noticed that as you use the vehicle, the track and the vehicle become covered with dust.
This layer of dust reduces the coefficient of static friction between the tires and the track, which can greatly reduce how fast you can navigate a turn and how fast you can accelerate. The suggested method for cleaning the tires is to use isopropyl alcohol and a paper shop towel. You might come up with another method.
Exercise XV-4: Measure the performance of your vehicle before you clean the tires.
Exercise XV-5: Come up with a procedure for cleaning your vehicle tires. Document this procedure so that it will be repeated whenever the vehicle is used for testing or competition. Your procedure should include the materials used, any special methods that you employ, and how often the tires should be cleaned.
Exercise XV-6: After cleaning the tires, measure the vehicle’s performance and compare to that measured in Exercise XV-4.
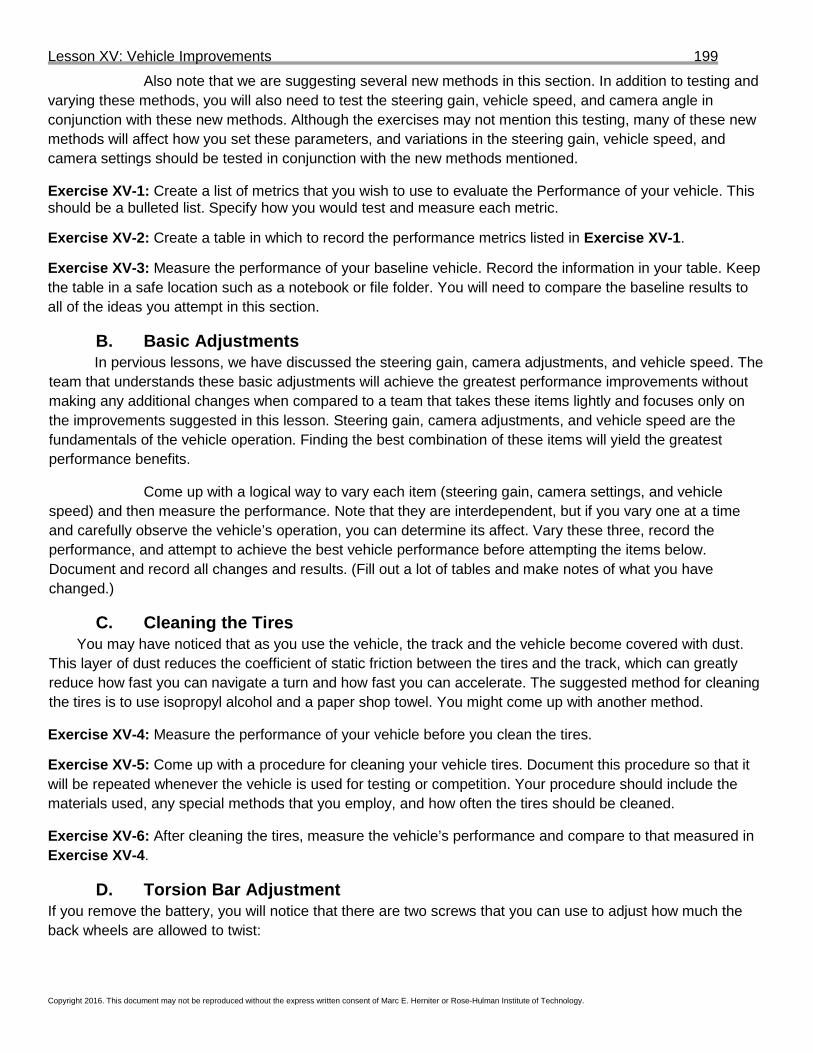
D. Torsion Bar Adjustment If you remove the battery, you will notice that there are two screws that you can use to adjust how much the back wheels are allowed to twist:

200 Autonomous Vheicle Control, Modeling, and Design
Copyright 2016. This document may not be reproduced without the express written consent of Marc E. Herniter or Rose-Hulman Institute of Technology.
These two screws can be tightened or loosened to make twisting the back end harder or easier. This type of spring or bar is referred to as a torsion bar or torsion spring and adjusts how much something can twist or resist twisting. In our case, the torsion bar adjusts how much the back end can twist relative to the front of the vehicle. Tightening or loosening the screws adjusts the stiffness of the torsion bar. Also note that there are two screws on the bottom of the vehicle that secure the bar to the vehicle. These two screws must be tight, and are not for adjustment:
Adjustment screw.
Adjustment screw.
Torsion bar.

Lesson XV: Vehicle Improvements 201
Copyright 2016. This document may not be reproduced without the express written consent of Marc E. Herniter or Rose-Hulman Institute of Technology.
Actually, all of the underside screws should be tight. Now is a good time to check off of the screws.
Adjust the two topside screws on the torsion bar. Grasp the front of the vehicle with your left hand and the rear of the vehicle with your right hand. Twist the vehicle gently. Make an adjustment to the vehicle and notice that the stiffness changes.
Exercise XV-7: Adjust the torsion bar to minimum stiffness. This means that you can twist it with very little force. Measure your vehicle’s performance.
Exercise XV-8: Adjust the torsion bar to maximum stiffness. Measure your vehicle’s performance and compare to Exercise XV-7.
Exercise XV-9: Adjust the torsion for maximum performance. This may take several adjustments and several measurements. Make sure that you record a table of data for every adjustment that you make. Also make sure that you have a way of knowing the position of the adjustment screws.
E. Compression Spring Adjustment The compression spring and adjustment post are shown below:
This screw must be tight. This screw must be tight.

202 Autonomous Vheicle Control, Modeling, and Design
Copyright 2016. This document may not be reproduced without the express written consent of Marc E. Herniter or Rose-Hulman Institute of Technology.
This spring adjusts how much the vehicle flexes in the center. (Flexes, not twists.) The compression can be changed by rotating the post by 180 degrees or moving the post forwards or backwards. As shown above, the spring is compressed the maximum amount. Yours will be set differently. The post is moved using the screw on the bottom side of the vehicle:
Compression spring. Compression spring adjustment post.
Compression spring adjustment screw. You can use this hole.
You can use this hole.

Lesson XV: Vehicle Improvements 203
Copyright 2016. This document may not be reproduced without the express written consent of Marc E. Herniter or Rose-Hulman Institute of Technology.
There are six positions you can use. The three holes that are lined up can be used to move the post forward or backward. You can also rotate the post by 180 degrees to make further adjustments.
Exercise XV-10: Adjust the compression spring to minimum compression. (It will be completely uncompressed with no hope of actually ever being compressed. Thus, it will do nothing.) Measure your vehicle’s performance.
Exercise XV-11: Adjust the compression spring to maximum compression. Measure your vehicle’s performance and compare to Exercise XV-10.
Exercise XV-12: Adjust the compression spring for maximum performance. This may take several adjustments and several measurements. Make sure that you record a table of data for every adjustment that you make. Also make sure that you have a way of knowing the position of the adjustment post.
F. Front-Rear Weight Distributions and Adjustment Right now the weight on each tire is unknown and was not really a design concern. The camera was mounted on the front and the hardware was mounted on the rear. It appears that we have placed more weight on the rear of the vehicle. This might increase the traction on the rear wheels but also might decrease the traction of the front wheels, and therefore affect the steering. You can change the weight distribution of the car by adding steel weights at various locations in the vehicle in an attempt to increase or decrease the traction of specific wheels. As always, document any changes you make and record performance changes in your standard table.
Exercise XV-13: Before adding weights, measure your vehicle’s performance to obtain a baseline.
Exercise XV-14: Add weights to specific locations on your vehicle. Document where you place the weights, why you placed them in their specific locations, and what you expect to happen. Measure your vehicle’s performance and compare to the baseline and any previous weight trials you may have made. It may take several trials to see an effect or to achieve the desired result. Make separate trials and document each trial separately so that you can compare all of the trials and have a history of all of the variations that you made.
G. Dead Spot Steering You may have noticed that when you increase the steering gain to a high value, the vehicle might weave back and forth down a straightaway even though it should travel straight. This is because our steering system only outputs a zero steering signal when the camera returns an index of 64. If the camera returns a 63 or 65, a non-zero steering signal will occur causing the vehicle to move to the right or left. In control systems, this weaving is referred to as an oscillation. If the oscillations get to big, the system can go out of control. Thus, for high gain, our method might be too sensitive. Fix this, we will add a dead spot to the steering where the steering signal will be zero unless the steering signal is greater than some threshold. We can easily implement this dead spot with a lookup table.
An example is shown below. Note that before we make the changes, our steering signal was originally limited to +/- 30. We will keep these same limits but add a dead spot to the steering. We will modify the blocks inside the steering subsystem:

204 Autonomous Vheicle Control, Modeling, and Design
Copyright 2016. This document may not be reproduced without the express written consent of Marc E. Herniter or Rose-Hulman Institute of Technology.
Opening my lookup table, we see that it has a dead spot between -2 and +2:
Remember that the Breakpoints are the values of the input signal and the Table data are the values of the output. For these settings, when the input is between -2 and +2, the output steering signal is zero. A more detailed plot of this function is show below:
You can choose a different width dead spot if you wish by changing the breakpoints. Also not that in the Algorithm tab of the dialog box, you need to specify the options below:
Added lookup table.

Lesson XV: Vehicle Improvements 205
Copyright 2016. This document may not be reproduced without the express written consent of Marc E. Herniter or Rose-Hulman Institute of Technology.
Exercise XV-15: Before adding the dead spot lookup table, measure your vehicle’s performance to obtain a baseline performance.
Exercise XV-16: Add the dead spot lookup table to your control model. Document your changes and what you expect to happen. Measure your vehicle’s performance and compare to the baseline and any other trials that you have made. It may take several trials with different variations in the dead spot to achieve the desired effect. Make separate trials and document each trial separately so that you can compare all of the trials and have a history of all of the variations that you made.
H. Steering Angle Based Speed Table Adjustment In Section XIV.F we added a lookup table that made the vehicle speed a function of the steering angle. The
basic idea was that when the vehicle is turning hard, we should slow down. The plot and data for the lookup table that we used is shown below:
Adding this feature greatly improved the performance of our vehicle. However, we can do better. As shown, the table has no affect for the rather large steering signals of up to 10. Only after a steering signal of 10 is the vehicle speed affected. This has the result that the vehicle goes deep into a curve before the speed is modified. Then, once it is modified, the vehicle speed is drastically reduced. We can probably do better. It would be good to slow down once we detect the slightest hint of a curve, and we probably want to go faster while executing a continuous curve. The present method does not work well in a continuous curve or a curve after a long straightaway where we have built up a lot of speed. Below are some suggestions, but feel free to try your own.
The first method is the same as before, but the speed reduction starts at a steering angle of 2. This will cause the speed reduction to start earlier in a curve:
Option selected. Clip selected.
Algorithm tab selected.

206 Autonomous Vheicle Control, Modeling, and Design
Copyright 2016. This document may not be reproduced without the express written consent of Marc E. Herniter or Rose-Hulman Institute of Technology.
Next, we will try reducing the speed gradually at the start, then sharper as the steering angle increases:
Another possibility would be a two speed control with a sloped change:
A variation of the method above would be a two speed stepped control:

Lesson XV: Vehicle Improvements 207
Copyright 2016. This document may not be reproduced without the express written consent of Marc E. Herniter or Rose-Hulman Institute of Technology.
The above method seems a bit drastic. Maybe a 3-step speed control with a slope:
The above examples are only suggestions. You may want to try some of them and then come up with your own method. As always, propose ideas, document those ideas, and then record performance results. For all of the lookup tables, make sure that the options on the Algorithm tab are selected as shown below:
Exercise XV-17: Before implementing the steering angle based vehicle speed lookup table, measure your vehicle’s performance to obtain a baseline.
Exercise XV-18: Modify the steering angle-vehicle speed lookup table in your control model. Document your changes and what you expect to happen. Measure your vehicle’s performance and compare to the baseline and any other trials that you have made. It may take several trials with different variations in the table to achieve the desired effect. Make separate trials and document each trial separately so that you can compare all of the trials and have a history of all of the variations that you have made.
Option selected. Clip selected.
Algorithm tab selected.

208 Autonomous Vheicle Control, Modeling, and Design
Copyright 2016. This document may not be reproduced without the express written consent of Marc E. Herniter or Rose-Hulman Institute of Technology.
I. Steering Offset One thing that you may have noticed is that the front wheels don’t quite point straight even though you zeroed the servo motor before building the steering. Luckily this is a constant error and is the same every time you use your vehicle. (Unless you have smashed the front end of your vehicle several times and damaged the servo motor.) The result is that the vehicle doesn’t drive straight with zero steering angle and a right turn is not quite the same as a left turn. We can correct this problem by adding a constant offset to the steering. Before you test the offset, disable the steering and the motor with the DIP switches. Next, add a constant to the steering signal as shown:
With the steering disabled, this offset is the only input to the servo motor. Build and download the model to your vehicle. Make sure that the steering is disabled. When you turn on the power to your vehicle, the steering will respond to the constant only. Find a value for the constant so that the wheels point straight when the steering is disabled. Every time you change the constant, you will need to build and download the model to the vehicle and test it again. The constant may need to be positive or negative, and is usually small. (Unless you forgot to zero your servo before building the steering.)
Exercise XV-19: Determine the value of the steering offset constant necessary to make your wheels point straight when the steering is disabled and the vehicle is powered.
J. Rear-Wheel Steering One of the greatest improvements that we can make is rear-wheel steering control. If we apply the
same torque to each of the rear wheels, the vehicle will tend to drive straight. However, if we apply full torque to the right rear wheel and no torque to the left rear tire, the vehicle will want to turn to the left. And, if we apply full torque to the left rear wheel and no torque to the right rear tire, the vehicle will want to turn to the right. We can use this property to help the vehicle turn with less steering angle and more control.
Right now the torque to each wheel is the same no matter what the vehicle is doing. We will modify the control so that the torque to each wheel is based on the steering angle. When the vehicle is turning, we can make the vehicle turn faster and with more control by applying more torque to the outside wheel or less torque to the inside wheel. The implementation below removes torque from the inside wheel:
Steering offset.
Lesson XV: Vehicle Improvements 209
Copyright 2016. This document may not be reproduced without the express written consent of Marc E. Herniter or Rose-Hulman Institute of Technology.
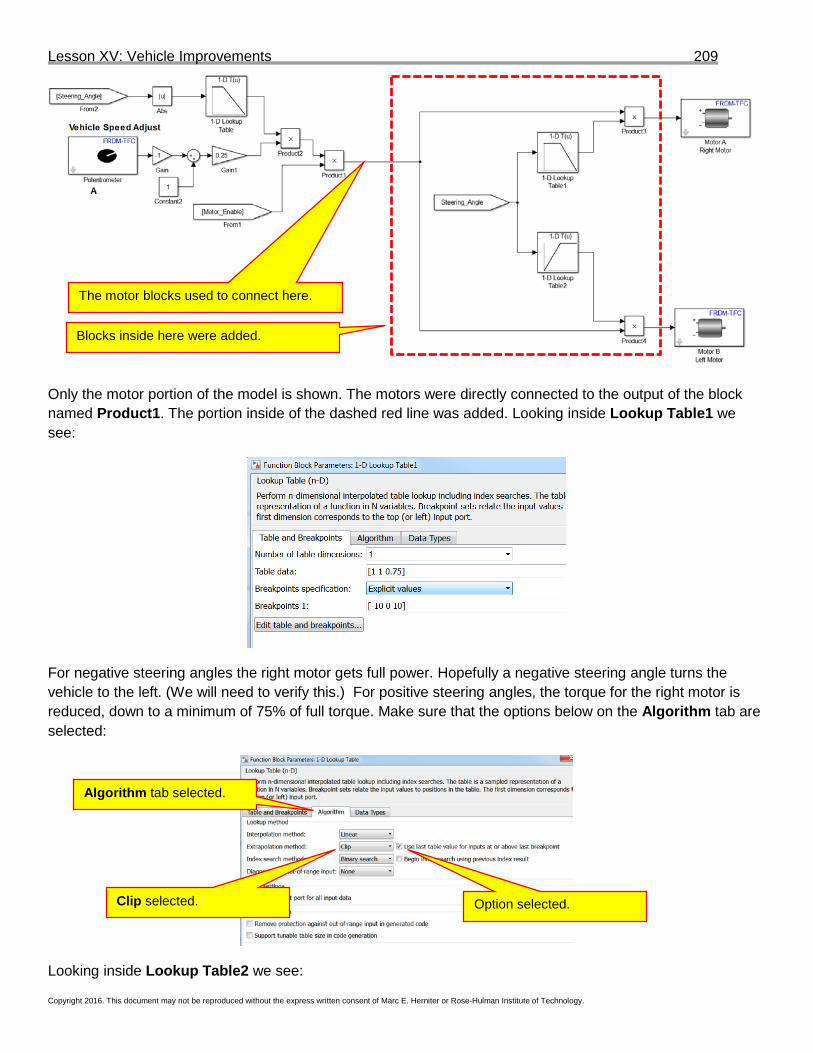
Only the motor portion of the model is shown. The motors were directly connected to the output of the block named Product1. The portion inside of the dashed red line was added. Looking inside Lookup Table1 we see:
For negative steering angles the right motor gets full power. Hopefully a negative steering angle turns the vehicle to the left. (We will need to verify this.) For positive steering angles, the torque for the right motor is reduced, down to a minimum of 75% of full torque. Make sure that the options below on the Algorithm tab are selected:
Looking inside Lookup Table2 we see:
The motor blocks used to connect here.
Blocks inside here were added.
Option selected. Clip selected.
Algorithm tab selected.

210 Autonomous Vheicle Control, Modeling, and Design
Copyright 2016. This document may not be reproduced without the express written consent of Marc E. Herniter or Rose-Hulman Institute of Technology.
For positive steering angles the left motor gets full power. Hopefully a positive steering angle turns the vehicle to the right. (We will need to verify this.) For negative steering angles, the torque for the right motor is reduced, down to a minimum of 75% of full torque. Make sure that the options below on the Algorithm tab are selected:
Exercise XV-20: Before implementing rear-wheel steering, measure your vehicle’s performance to obtain a baseline.
Demo XV-1: When you first test this method, hold the vehicle above a straight piece of track. Turn on and enable your vehicle, both the steering and the motors. When you move the vehicle near the line on the right side, the right tire should spin more than the left tire and the front wheels should turn to the left. When you move the vehicle near the line on the left side, the left tire should spin more than the right tire and the front wheels should turn to the right.
Exercise XV-21: Implement rear-wheel steering. Document your changes and what you expect to happen. Measure your vehicle’s performance and compare to the baseline and any other trials that you have made. It may take several trials with different variations in the tables to achieve the desired effect. Make separate trials and document each trial separately so that you can compare all of the trials and have a history of all of the variations that you have made.
K. Camera Index Memory You may have noticed that even with rear-wheel steering and steering-based speed control, both of which help us
improve vehicle speed, we still have an upper speed limit after a long straight-away heading into a sharp curve. When we gain a lot of speed in a straightaway, the car travels deep into the curve and comes close to the outside line. As you increase the speed, the car comes closer to the outside line. If the car comes close enough to the outside line, the camera loses the line and the resulting error causes the steering to go straight. This results in the vehicle driving straight rather than follow the curve. (And, if you are using steering based speed control, the car accelerates to top speed as it is driving straight.) The result can be some spectacular crashes.
Option selected. Clip selected.
Algorithm tab selected.

Lesson XV: Vehicle Improvements 211
Copyright 2016. This document may not be reproduced without the express written consent of Marc E. Herniter or Rose-Hulman Institute of Technology.
Luckily, we have a way of determining when this error occurs. When our system is working correctly and following the lines, whether on a curve or on a straight-away, the Vehicle Index output by the block Detect Path and Emit Index is near 64 and is fairly consistent. No matter how fast the car is moving, the values output by this block do not change much from one reading to the next. (Remember, we get a new reading every 0.02 seconds.) So, the difference between two readings is small when everything is working well. When the camera loses the line, we will have one valid value followed by a value that is very different and is invalid. If this happens, we should ignore the invalid value and use the old value. We will use the old value until a new valid value is obtained.
We can implement this algorithm with memory. We can save the last value of the Vehicle Index and compare it to the present value. If the difference between these two values is small, then we will assume that the present value is valid and use it for steering. However, if the difference between the present value and the last value is large, we will assume that there is an error and we will ignore the present value and use the value saved in memory.
Imagine that we are travelling fast around a curve, the wheels are turned as much as possible so the vehicle is trying to make the turn. However, the car is travelling too fast and comes so close to the outside line that the camera loses the line. When the camera loses the line, the value of the signal Vehicle Index makes a big jump. The algorithm we are implementing will ignore this erroneous value and use the last value. The result will be that the vehicle will continue to turn until it reacquires the line, at which point the Steering Index will once again change slowly and produce valid values. The car may come close or go over the outside line, but it will continue to turn and stay on the track.
We can implement this algorithm with a memory block. The output of a memory block is the input from the last time step. Thus, the memory block can be used to remember the last valid value. The memory block is located in library Simulink / Discrete. Create the system below:
The output of the memory block is the value of the last valid value of the signal Vehicle Index. Note that this value is fed back to the difference block. Therefore, the output of the Abs block is the difference between the present value of the Vehicle Index and the last valid value of the Vehicle Index:
We see that the output of the Abs block measures how much the index changes between two consecutive samples. If the index changes by more than10, we will say that the most recent index is invalid and we will keep the old value. If the difference is less than or equal to 10, we will say that the most recent index is valid and pass it on to the memory block. We will use this to control a switch.
Last valid value.
Present value of Vehicle Index.
Present value of Vehicle Index.
Last valid value.
This is how much the index changed.

212 Autonomous Vheicle Control, Modeling, and Design
Copyright 2016. This document may not be reproduced without the express written consent of Marc E. Herniter or Rose-Hulman Institute of Technology.
Looking at the switch, if the difference greater than 10, the output of the switch will be equal to the top input. This is shown below. Read the call outs in order of (1), (2) and then (3):
Another way to look at it, when the difference is greater than 10, the above system is equivalent to the one below:
The input of the memory block is equal to its output. This means that the Memory block just holds it value. In this case, it holds the last value that it had. For us, this is the last valid value of the Vehicle Index signal.
Looking at the Switch again, if the difference less than or equal to 10, the output of the switch will be equal to the bottom input. This is shown below. Read the call outs in order of (1), (2) and then (3):
Another way to look at it, when the difference is less than or equal to 10, the above system is equivalent to the one below:
(1) If this signal is greater than 10,
(2) 2his output is equal to
(3) this input.
(1) If this signal is less than or equal to 10, (2) this output is equal to
(3) this input.

Lesson XV: Vehicle Improvements 213
Copyright 2016. This document may not be reproduced without the express written consent of Marc E. Herniter or Rose-Hulman Institute of Technology.
The input of the Memory block is now the Vehicle Index which means that the memory block stores the present value of the index. Thus, when the difference between the last value of the index and the present value of the index is less than or equal to 10, we consider it to be a valid value and that value is saved and passed along to our steering subsystem. In this way, we can compare the last value of the index to the present value. If they are not that different then we use the present value. If they are very different, we ignore the most recent value and use the one saved in memory. Note that our definition of “very different” is 10. You can change this threshold if you wish.
The complete steering system is repeated below:
One last thing we need to do is to set the initial condition. When the vehicle starts on a straight track, the Vehicle Index is typically close to 64. By default, when we power up the vehicle, the initial value of the memory block is zero. Since 64-0 is greater than 10, the above system will treat 0 as the last valid value of the index and remember that value forever. An index of 0 will lock the steering maximum right or maximum left. To avoid this problem, we need to change the initial condition of the memory block. Double-click on the memory block as shown above and then change the initial condition to 64:
To use this model, turn the car off, place the car on a straight section of track, and then turn on the power. You always have to cycle the power because the memory block remembers the last “valid” value of the Vehicle Index. If you leave the vehicle on and carry it around, you have no idea what the last “valid” value was. Thus, cycle the power to reinitialize the memory block to 64.
Exercise XV-22: Before implementing camera index memory, measure your vehicle’s performance to obtain a baseline.
Demo XV-2: When you first test this method, start at slow speed and make sure everything works. Then slowly increase the speed and see how it does. You should be able to achieve much higher speeds around the corners.
Exercise XV-23: Test this method for different values of the switch threshold. (We set it to 10 in the above example.) Lowering the value means that it will throw out many more values of the index that would otherwise be valid. Making it higher means that more signals that would otherwise be invalid are used. (Lowering the threshold means that it holds more. Raising the threshold makes the system act more like it did before we added the memory.)
Double-click here.
Change this to 64.

214 Autonomous Vheicle Control, Modeling, and Design
Copyright 2016. This document may not be reproduced without the express written consent of Marc E. Herniter or Rose-Hulman Institute of Technology.
L. Crash Detection The KL25Z has an on-board accelerometer. We can use this sensor to measure changes in
acceleration and detect a crash. When your vehicle crashes it will have a large negative acceleration. This is easy to detect. One problem is that the accelerometer will measure large accelerations around a curve (centrifugal forces) and when the vehicle bumps up and down on the track as it is moving.
The accelerometer measures acceleration in three dimensions. The z-axis is up and down and only measures vibration in our case. The x- and y-axes are in the same plane as the vehicle’s motion. To verify this, rerun the accelerometer model that we tested in Section II.B starting on page 28. We are interested in large decelerations in the x- and y-directions.
The outputs of the accelerometer is a signal between +/- 2 corresponding to +/- 2g of acceleration. If the car was not moving, the output of the x- and y-signals would be zero. (The z output would either be +1 or -1 depending on the orientation of the board.) When the vehicle crashes, the vehicle will decelerate rapidly. Since we do not know the orientation of the crash nor the orientation of the accelerometer (we could figure it out if we tried!), we do not know exactly what to expect from the accelerometer. However, we do know that we will read a large negative signal or a large positive signal on the x-axis accelerometer signal and/or a large negative signal or a large positive signal on the y-axis accelerometer signal. Since we don’t know which signal will see the largest acceleration (we don’t know the direction of the crash) and we don’t know if the signal will be positive or negative (we don’t know the orientation of the accelerometer), we will take the absolute value of the signals and add them together:
The output of the sum block will be non-zero if we experience a large deceleration in x-y plane.
In the normal operation of the car, it bounces around a lot and we expect the x-axis and y-axis signals to be non-zero just due to bumps on the track. To reduce the risk of a false trigger due to a bump on the track, we will take the average of the last 10 values output by the accelerometer. This way we can say that we have a crash if the last 10 values were high rather than a single value was high. A single value being high could be an error. 10 values in a row being high is probably not an error.
The Memory block is a one-step memory. The output of the block is the value of the input from the previous time step. Thus, the memory block remembers the last value of a signal. In the block diagram below, we have 10 Memory blocks which remember the last 10 values of output signal of the sum block. If we add these values up and divide by 10, we have a signal that is the average of the last 10 values:

Lesson XV: Vehicle Improvements 215
Copyright 2016. This document may not be reproduced without the express written consent of Marc E. Herniter or Rose-Hulman Institute of Technology.
We will zoom in a little further for clarity:
Next, we need to detect if the deceleration is above a threshold. If the output signal of the gain block goes above a specific threshold, we want the vehicle to stop moving, and we want it to remain stopped until we reset the vehicle. This requires us to detect that the signal is above a certain threshold and remember that we went above that threshold. The Switch block below detects when the signal goes above a threshold of 1.5.
When the output signal of the Gain block goes above a threshold of 1.5, the switch will output a 1, indicating a crash. When the output signal is less than 1.5, the switch block will output a zero.
Note that the threshold in this example is 1.5. You can change the value of the threshold.

216 Autonomous Vheicle Control, Modeling, and Design
Copyright 2016. This document may not be reproduced without the express written consent of Marc E. Herniter or Rose-Hulman Institute of Technology.
If you make the value of the threshold larger than 1.5, a more severe crash is needed to trigger the crash detection algorithm. If you make the threshold too small, the algorithm will erroneously trigger due to bumps and vehicle turns, and the vehicle may stop when it should not. You will need to experiment with the threshold.
Next, once we detect a crash, we need to remember that a crash occurred. The vehicle should stop and stay stopped. Thus we need a memory. We will do this with the memory block and feedback below:
The output of a memory block is the input from the previous time step. When the input to the Sum block is a 1, this set of blocks counts up. This is easiest to see with some numbers shown. Suppose the memory block starts at zero (which it does because the default initial condition is 0) and the input to the Sum block is a 1. We have the situation below:
The input to the Memory block will be a 1. So, after the next time step, the output of the memory block will be a 1:
This 1.5 is the value of the crash threshold.
0
0
1 1

Lesson XV: Vehicle Improvements 217
Copyright 2016. This document may not be reproduced without the express written consent of Marc E. Herniter or Rose-Hulman Institute of Technology.
Now, the input to the memory block is a 2. After the next time step, the output of the memory block will be a 2:
Now, the input to the memory block is a 3. After the next time step, the output of the memory block will be a 3:
Thus, we see that if the input to the Sum block is a 1, this set of blocks counts up.
Next, suppose the memory block is at 3 and then the input to the Sum block changes to 0. We have the situation below:
The input to the Memory block will be a 3. So, after the next time step, the output of the memory block remain at 3:
1
1
2 1
2
2
3 1
3
2
3 1
3
3
3 0

218 Autonomous Vheicle Control, Modeling, and Design
Copyright 2016. This document may not be reproduced without the express written consent of Marc E. Herniter or Rose-Hulman Institute of Technology.
We see that when the input to the Sum block is zero, the count holds at its previous value.
Finally, suppose the memory block starts at zero (which it does when we cycle the power) and the input to the Sum block is a 0. We have the situation below:
The input to the Memory block will be a 0. So, after the next time step, the output of the memory block remains at zero:
So we see that if the input is a 0 and the Memory block output is zero, the counter holds at zero.
The input to the Sum block comes from switch that detects a crash. When we detect a crash, the switch output is a 1. When there is no crash, the switch output is a zero:
0
0
0 0
0
0
0 0
3
3
3 0

Lesson XV: Vehicle Improvements 219
Copyright 2016. This document may not be reproduced without the express written consent of Marc E. Herniter or Rose-Hulman Institute of Technology.
Altogether, the blocks function as follows. After power up and when there is no crash, the memory output is 0 indicating no crash. When a crash occurs, the counter counts up for as long as the crash takes to occur. When the vehicle finally stops, the counter holds at the last value of the count. The memory holds this value until we cycle the power. Thus, the counter indicates no crash when the count is zero. The memory indicates a crash when the count is greater than or equal to1.
When we have a crash we want to do two things. (1) Light up an LED when a crash is detected so that we know the vehicle is not moving due to a perceived crash. (2) We want the drive wheels to stop. In the blocks below, LED D4 will illuminate when the count is greater than 0:
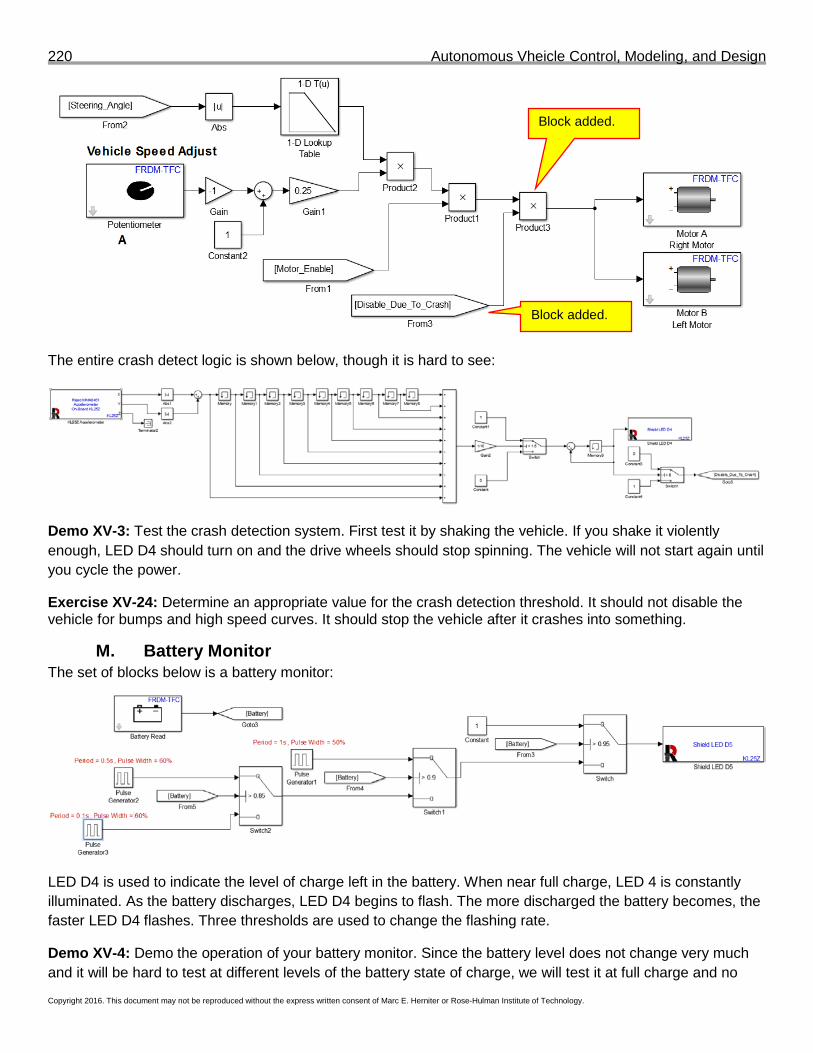
We have also used a switch to create a signal to disable the motors. When the count is zero (indicating no crash) the output of the switch is 1 which will enable the motors. When the count is greater than 0, the switch output will be 0 which will disable the drive motors. We used a Goto tag to rout the switch signal to the motors as shown below:
220 Autonomous Vheicle Control, Modeling, and Design
Copyright 2016. This document may not be reproduced without the express written consent of Marc E. Herniter or Rose-Hulman Institute of Technology.
The entire crash detect logic is shown below, though it is hard to see:
Demo XV-3: Test the crash detection system. First test it by shaking the vehicle. If you shake it violently enough, LED D4 should turn on and the drive wheels should stop spinning. The vehicle will not start again until you cycle the power.
Exercise XV-24: Determine an appropriate value for the crash detection threshold. It should not disable the vehicle for bumps and high speed curves. It should stop the vehicle after it crashes into something.
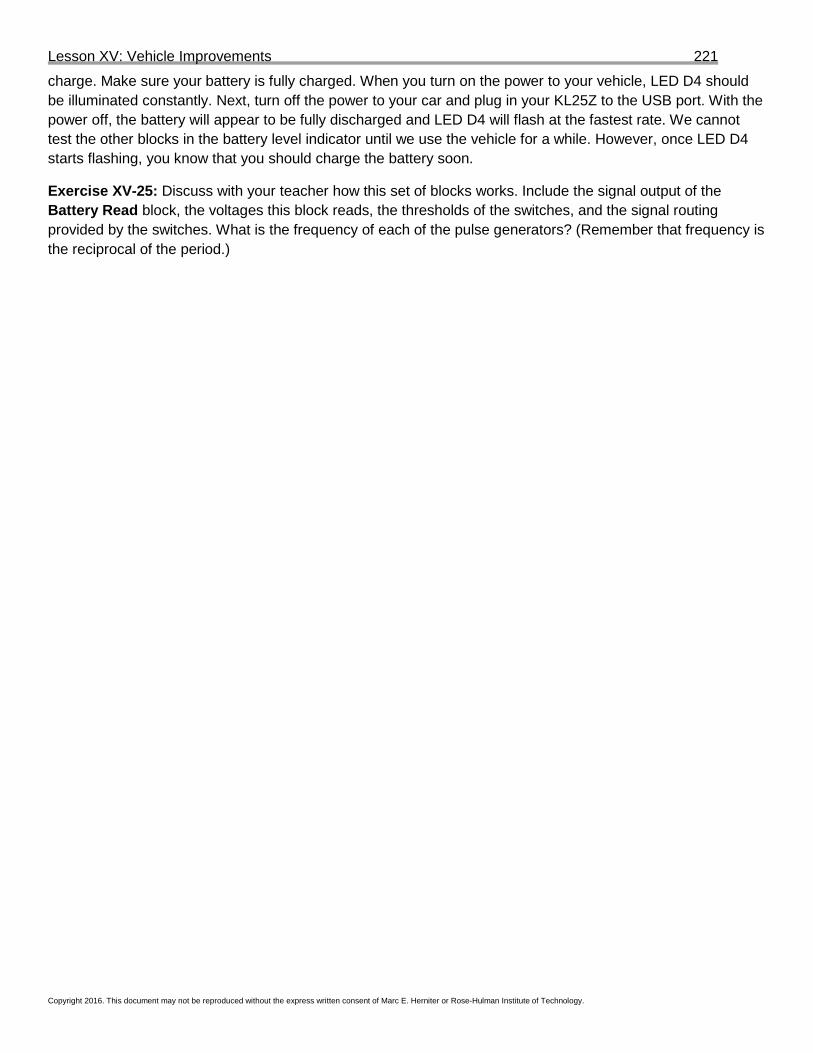
M. Battery Monitor The set of blocks below is a battery monitor:
LED D4 is used to indicate the level of charge left in the battery. When near full charge, LED 4 is constantly illuminated. As the battery discharges, LED D4 begins to flash. The more discharged the battery becomes, the faster LED D4 flashes. Three thresholds are used to change the flashing rate.
Demo XV-4: Demo the operation of your battery monitor. Since the battery level does not change very much and it will be hard to test at different levels of the battery state of charge, we will test it at full charge and no
Block added.
Block added.
Lesson XV: Vehicle Improvements 221
Copyright 2016. This document may not be reproduced without the express written consent of Marc E. Herniter or Rose-Hulman Institute of Technology.
charge. Make sure your battery is fully charged. When you turn on the power to your vehicle, LED D4 should be illuminated constantly. Next, turn off the power to your car and plug in your KL25Z to the USB port. With the power off, the battery will appear to be fully discharged and LED D4 will flash at the fastest rate. We cannot test the other blocks in the battery level indicator until we use the vehicle for a while. However, once LED D4 starts flashing, you know that you should charge the battery soon.
Exercise XV-25: Discuss with your teacher how this set of blocks works. Include the signal output of the Battery Read block, the voltages this block reads, the thresholds of the switches, and the signal routing provided by the switches. What is the frequency of each of the pulse generators? (Remember that frequency is the reciprocal of the period.)