Embed Size (px)
Citation preview

DATA REPORTQuarterly
S E C O N D Q U A R T E R 2 0 1 7W W W . C P W R . C O M
Struck-by Injuries and Prevention in the Construction Industry
Xuanwen Wang, PhD, Rebecca Katz, MPH, Scott Schneider, CIH, Babak Memarian, PhD, Xiuwen Sue Dong, DrPH*
KEY FINDINGS
• From 2011 to 2015, 804 construction workers died from struck-by injuries, more than any other major industry; 52% were struck by an object or equipment, and the rest were struck by a vehicle.
Struck-by hazards are a leading cause of fatal and nonfatal injuries in construction, and have been defined as one of the Focus Four hazards identified by the U.S. Occupational Safety and Health Administration (OSHA) (the other hazards are falls, caught-in-between, and electrocution; OSHA 2011). Struck-by injuries can occur in many different ways. To prevent construction workers from struck-by injuries, specific hazards and working environments should be taken into account for safety and health intervention programs. This Quarterly Data Report includes data on deaths and injuries from being struck by vehicles, objects, and equipment. Primary sources of struck-by injuries and vulnerable worker groups for such injuries were also analyzed and are presented in the report. Numbers of fatal and nonfatal injuries were obtained from the Census of Fatal Occupational Injuries (CFOI) and the Survey of Occupational Injuries and Illnesses (SOII), respectively. Both the CFOI and SOII are data collections of the U.S. Bureau of Labor Statistics (BLS). In addition to the BLS data, this report introduces solutions to prevent struck-by injuries selected from a variety of sources, including OSHA, the National Institute for Occupational Safety and Health (NIOSH), and CPWR.
• More than half (51%) of fatalities involving being struck by an object or equipment were caused by falling objects or equipment.
• Construction workers 65 years or older experienced the highest rate of struck-by fatalities, whereas workers under 20 years had the highest rate of nonfatal struck-by injuries.
• The risk of nonfatal struck-by injuries in construction is nearly double the risk of all industries combined.
• The majority (57%) of struck-by vehicle deaths in construction occurred in work zones.
• Most (96%) nonfatal struck-by injuries were from being struck by an object or equipment.
* Correspondence to: Xiuwen Sue Dong, [email protected].
• Highway maintenance workers had the highest rate of struck-by fatalities, while helpers had the highest rate of nonfatal struck-by injuries.

2
www.cpwr.com
DATA REPORT 2
SECTION 1: TRENDS OF FATAL STRUCK-BY INJURIES IN
The general trends of struck-by fatalities1 followed the overall fatality trend in construction (Dong et al., 2017), falling during the recession and increasing afterwards. In 2015, 162 construction workers died from struck-by injuries, a 2.5% (4 deaths) increase from 2011 and 34% higher than the low point (121 deaths) in 2010 (chart 1). Although the number of struck-by fatalities slightly increased from 2011 to 2015, its share of the overall fatal injuries in construction dropped from 20% to 16% during this time period. On average, nearly one in five (18%) construction workers who died did so as a result of being struck by an object/equipment or a vehicle.
1Struck-by fatalities in this study include struck by object or equipment (Event codes 62xxxx in OIICS 2.01 and Event codes 02xxxx in OIICS 1.01) and struck by a vehicle (Event codes 24xxxx in OIICS 2.01 and Event codes 43xxxx in OIICS 1.01). * Other fatalities are fatalities from all causes except struck-by. Note: In 2011, the injury coding was switched from OIICS version 1.01 to OIICS version 2.01, therefore the numbers before and after 2011 are not directly comparable. Source: Fatal injury data were generated by the CPWR Data Center with restricted access to BLS CFOI micro data. The views expressed here do not necessarily reflect the views of the BLS.
1. Number of fatalities in construction, struck-by and other fatalities*, 2003-2015
www.cpwr.com
Second Quarter 2017
Struck-by Injuries and Prevention
218 246 249 235 195 195 158 121 158 169 164 151 162
1,1711,278 1,243
1,2971,239
1,016
879802 781
849 856933
985
0
300
600
900
1,200
1,500
2003 2004 2005 2006 2007 2008 2009 2010 2011 2012 2013 2014 2015
Num
ber o
f dea
ths
Year
Other fatalities*
Revised OIICS
Struck-by
CONSTRUCTION

DATA REPORT 3
Section 1: Trends of Fatal Struck-by Injuries in Construction Second Quarter 2017
www.cpwr.com
When stratified into more detailed categories, more than half (52.2%) of struck-by fatalities that occurred from 2011 to 2015 were due to being struck by an object or equipment (chart 2). The number of deaths due to being struck by an object or equipment increased 20%, from 80 in 2011 to 96 in 20152, while deaths due to being struck by a vehicle fell 15% during the same period.
2In 2011, the injury coding was switched from OIICS version 1.01 to OIICS version 2.01, therefore the numbers before and after 2011 are not directly comparable. Source: Fatal injury data were generated by the CPWR Data Center with restricted access to BLS CFOI micro data. The views expressed here do not necessarily reflect the views of the BLS.
Struck-by Injuries and Prevention
2. Number of fatal struck-by injuries in construction, 2003-2015
104 91 116 112
85 83 75 55 78 87 78 75 66
114 155 133 123
110 112 83
66
80 82 86 76 96
218
246 249 235
195 195
158
121
158 169 164
151 162
0
50
100
150
200
250
300
2003 2004 2005 2006 2007 2008 2009 2010 2011 2012 2013 2014 2015
Num
ber o
f dea
ths
Year
Struck by vehicle Struck by object or equipment
Revised OIICS
.

DATA REPORT 4
Section 1: Trends of Fatal Struck-by Injuries in Construction Second Quarter 2017
www.cpwr.com
From 2011 to 2015, 804 construction workers died from struck-by injuries, more than any other major industry (chart 3). Specifically, the construction industry had the highest number of fatalities due to being struck by a vehicle and the second highest number of deaths due to being struck by an object or equipment among all major industries.
3. Number of fatal struck-by injuries, by major industry, sum of 2011-2015 (All employment)
98
43
60
89
143
363
97
384
19
83
147
139
255
291
260
630
420
Utilities
Public admin.
Retail
Mining
Wholesale
Manufacturing
Waste management
Transportation
Agricultrue
ConstructionNumber of deaths
Struck by vehicle
Struck by object orequipment
126
804
176
199
434
344
623
727
30
117
*
29
*Eleven deaths were from being struck by vehicle, and 19 deaths were from being struck by object or equipment. Source: Fatal injury data were generated by the CPWR Data Center with restricted access to BLS CFOI micro data. The views expressed here do not necessarily reflect the views of the BLS.
Struck-by Injuries and Prevention
DATA REPORT 5
Section 1: Trends of Fatal Struck-by Injuries in Construction Second Quarter 2017
www.cpwr.com
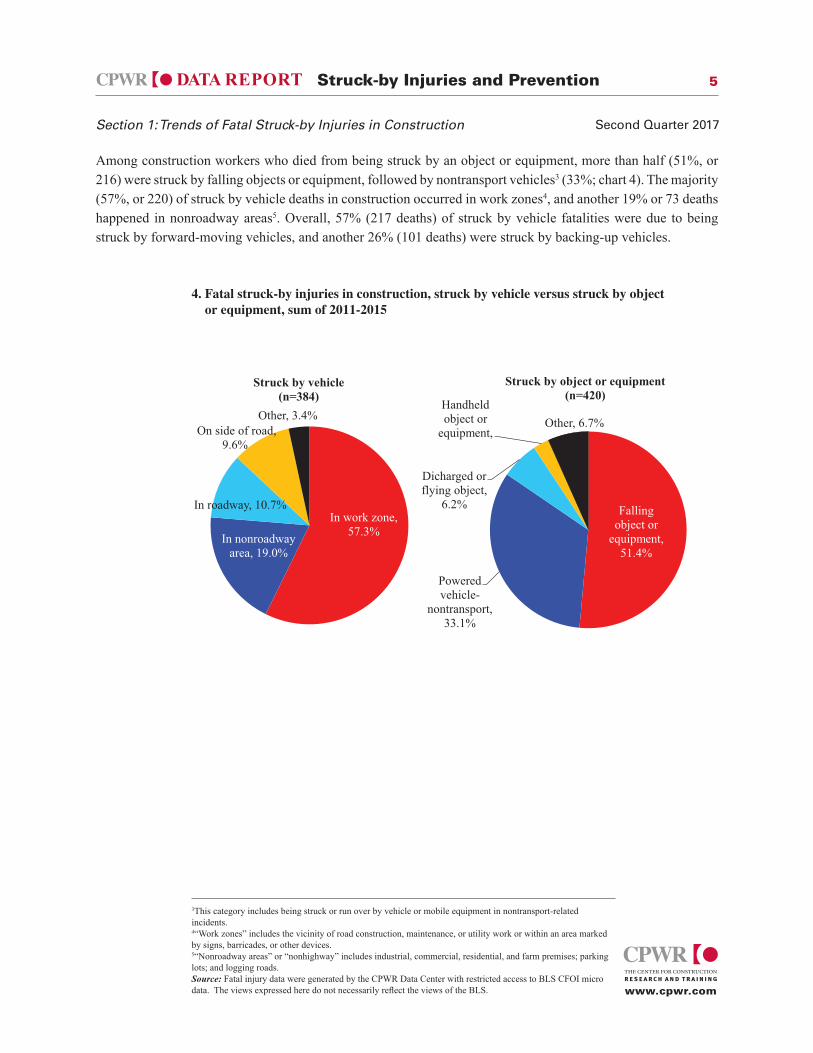
Among construction workers who died from being struck by an object or equipment, more than half (51%, or 216) were struck by falling objects or equipment, followed by nontransport vehicles3 (33%; chart 4). The majority (57%, or 220) of struck by vehicle deaths in construction occurred in work zones4, and another 19% or 73 deaths happened in nonroadway areas5. Overall, 57% (217 deaths) of struck by vehicle fatalities were due to being struck by forward-moving vehicles, and another 26% (101 deaths) were struck by backing-up vehicles.
4. Fatal struck-by injuries in construction, struck by vehicle versus struck by object or equipment, sum of 2011-2015
In work zone, 57.3% In nonroadway
area, 19.0%
In roadway, 10.7%
On side of road, 9.6%
Other, 3.4%
Struck by vehicle (n=384)
.
Falling object or
equipment, 51.4%
Powered vehicle-
nontransport, 33.1%
Dicharged or flying object,
6.2%
Handheld object or
equipment, Other, 6.7%
Struck by object or equipment (n=420)
3This category includes being struck or run over by vehicle or mobile equipment in nontransport-related incidents. 4“Work zones” includes the vicinity of road construction, maintenance, or utility work or within an area marked by signs, barricades, or other devices. 5“Nonroadway areas” or “nonhighway” includes industrial, commercial, residential, and farm premises; parking lots; and logging roads. Source: Fatal injury data were generated by the CPWR Data Center with restricted access to BLS CFOI micro data. The views expressed here do not necessarily reflect the views of the BLS.
Struck-by Injuries and Prevention
DATA REPORT 6
Section 1: Trends of Fatal Struck-by Injuries in Construction Second Quarter 2017
www.cpwr.com
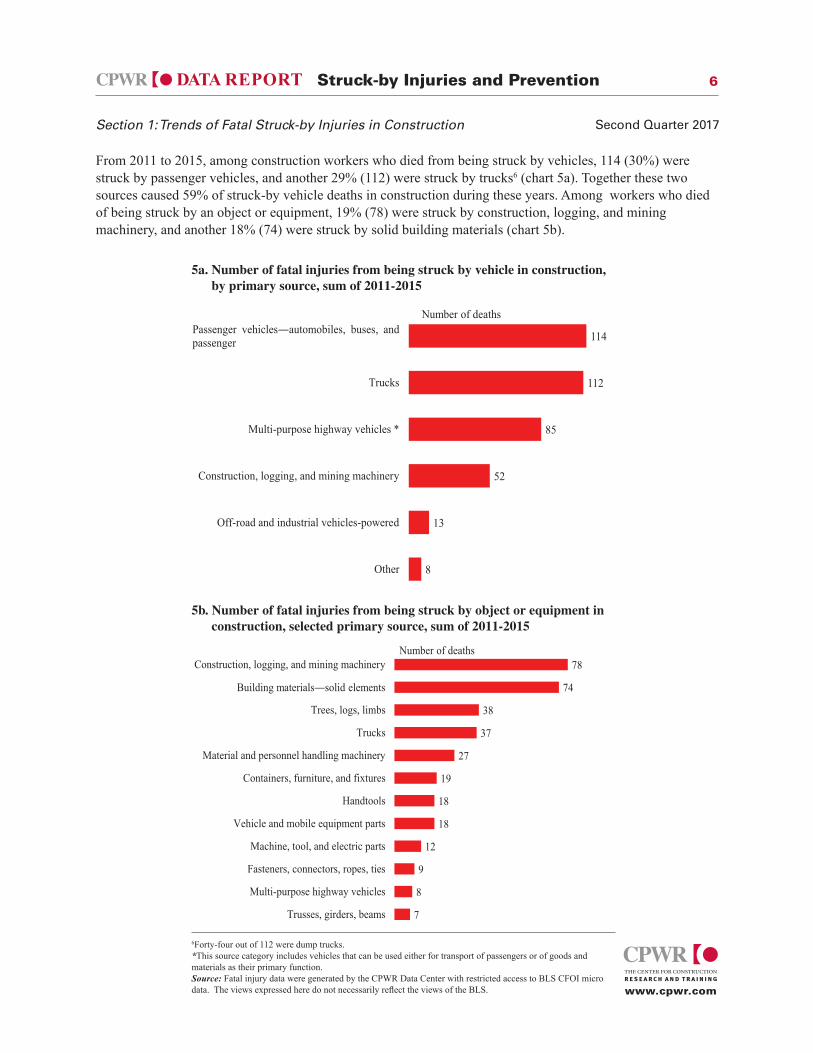
From 2011 to 2015, among construction workers who died from being struck by vehicles, 114 (30%) were struck by passenger vehicles, and another 29% (112) were struck by trucks6 (chart 5a). Together these two sources caused 59% of struck-by vehicle deaths in construction during these years. Among workers who died of being struck by an object or equipment, 19% (78) were struck by construction, logging, and mining machinery, and another 18% (74) were struck by solid building materials (chart 5b).
5a. Number of fatal injuries from being struck by vehicle in construction, by primary source, sum of 2011-2015
8
13
52
85
112
114
Other
Off-road and industrial vehicles-powered
Construction, logging, and mining machinery
Multi-purpose highway vehicles *
Trucks
Passenger vehicles—automobiles, buses, and passenger
Number of deaths
6Forty-four out of 112 were dump trucks. *This source category includes vehicles that can be used either for transport of passengers or of goods and materials as their primary function. Source: Fatal injury data were generated by the CPWR Data Center with restricted access to BLS CFOI micro data. The views expressed here do not necessarily reflect the views of the BLS.
Struck-by Injuries and Prevention
5b. Number of fatal injuries from being struck by object or equipment in construction, selected primary source, sum of 2011-2015
7
8
9
12
18
18
19
27
37
38
74
78
Trusses, girders, beams
Multi-purpose highway vehicles
Fasteners, connectors, ropes, ties
Machine, tool, and electric parts
Vehicle and mobile equipment parts
Handtools
Containers, furniture, and fixtures
Material and personnel handling machinery
Trucks
Trees, logs, limbs
Building materials—solid elements
Construction, logging, and mining machineryNumber of deaths

DATA REPORT 7
Section 1: Trends of Fatal Struck-by Injuries in Construction Second Quarter 2017
www.cpwr.com
Struck-by fatalities were more likely to occur among larger establishments. From 2011 to 2015, 34.4% of struck-by fatalities occurred in establishments with 50 or more employees, compared to 22.1% for all construction fatalities (chart 6).
6. Fatal injuries in construction, by establishment size, sum of 2011-2015 (Wage-and-salary workers)
29.0%
9.6%
15.0%
34.4%
12.0%
Fatal struck-by(n=718)
1-10 employees 11-19 employees 20-49 employees 50+ employees Not reported
38.4%
9.8%12.6%
22.1%
17.1%
All fatalities(n=3,495)
.
Note: Self-employed workers were excluded. Source: Fatal injury data were generated by the CPWR Data Center with restricted access to BLS CFOI micro data. The views expressed here do not necessarily reflect the views of the BLS.
Struck-by Injuries and Prevention
8
www.cpwr.com
DATA REPORT 8
SECTION 2: FATAL STRUCK-BY INJURIES AMONG
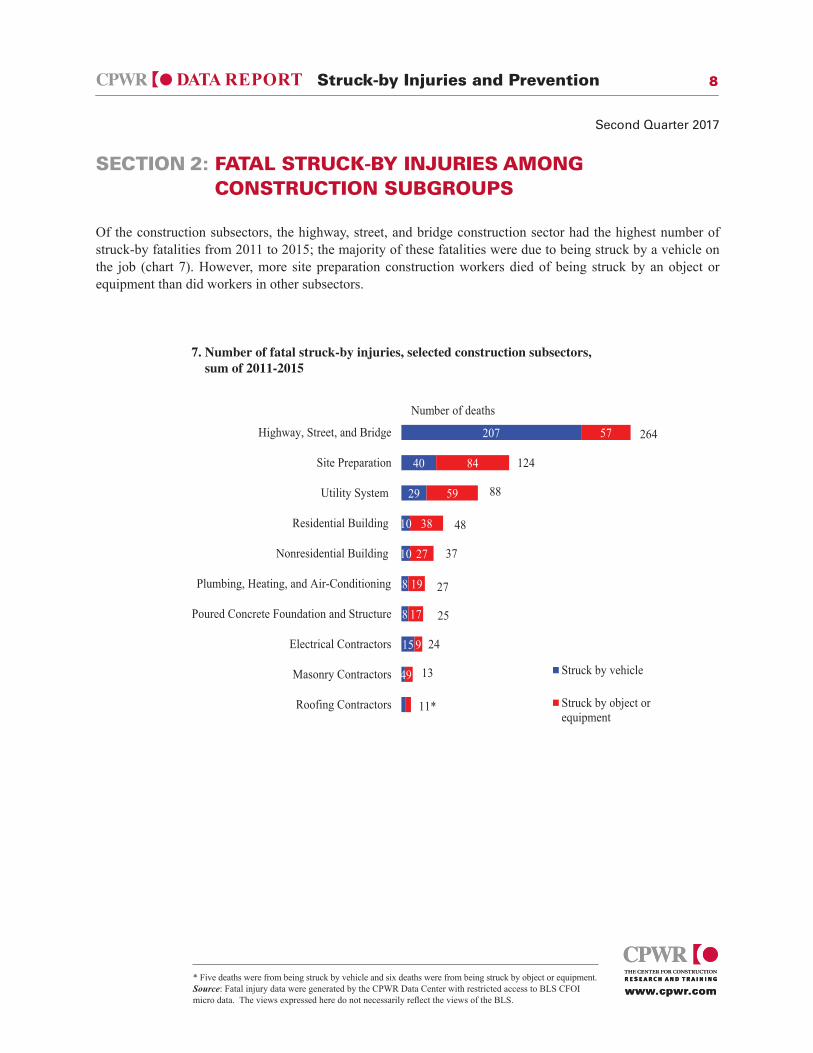
Of the construction subsectors, the highway, street, and bridge construction sector had the highest number of struck-by fatalities from 2011 to 2015; the majority of these fatalities were due to being struck by a vehicle on the job (chart 7). However, more site preparation construction workers died of being struck by an object or equipment than did workers in other subsectors.
* Five deaths were from being struck by vehicle and six deaths were from being struck by object or equipment. Source: Fatal injury data were generated by the CPWR Data Center with restricted access to BLS CFOI micro data. The views expressed here do not necessarily reflect the views of the BLS.
7. Number of fatal struck-by injuries, selected construction subsectors, sum of 2011-2015
www.cpwr.com
Second Quarter 2017
4
15
8
8
10
10
29
40
207
9
9
17
19
27
38
59
84
57
Roofing Contractors
Masonry Contractors
Electrical Contractors
Poured Concrete Foundation and Structure
Plumbing, Heating, and Air-Conditioning
Nonresidential Building
Residential Building
Utility System
Site Preparation
Highway, Street, and Bridge
Struck by vehicle
Struck by object orequipment
Number of deaths
264
11*
13
24
25
27
37
48
88
124
Struck-by Injuries and Prevention
CONSTRUCTION SUBGROUPS
DATA REPORT 9
Second Quarter 2017
www.cpwr.com
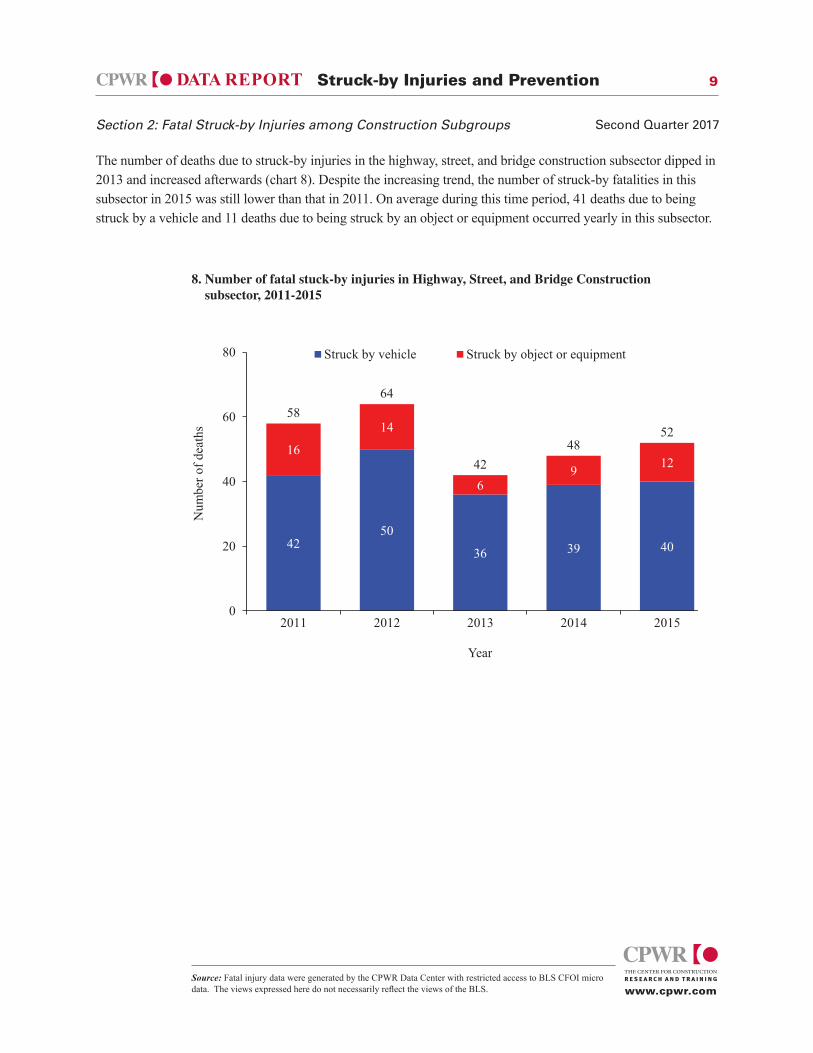
The number of deaths due to struck-by injuries in the highway, street, and bridge construction subsector dipped in 2013 and increased afterwards (chart 8). Despite the increasing trend, the number of struck-by fatalities in this subsector in 2015 was still lower than that in 2011. On average during this time period, 41 deaths due to being struck by a vehicle and 11 deaths due to being struck by an object or equipment occurred yearly in this subsector.
8. Number of fatal stuck-by injuries in Highway, Street, and Bridge Construction subsector, 2011-2015
42 50
36 39 40
16
14
6 9 12
58 64
42 48
52
0
20
40
60
80
2011 2012 2013 2014 2015
Num
ber o
f dea
ths
Year
Struck by vehicle Struck by object or equipment
Source: Fatal injury data were generated by the CPWR Data Center with restricted access to BLS CFOI micro data. The views expressed here do not necessarily reflect the views of the BLS.
Struck-by Injuries and Prevention
Section 2: Fatal Struck-by Injuries among Construction Subgroups
10
www.cpwr.com
DATA REPORT 10
Section 2: Fatal Struck-by Injuries among Construction Subgroups Second Quarter 2017
www.cpwr.com
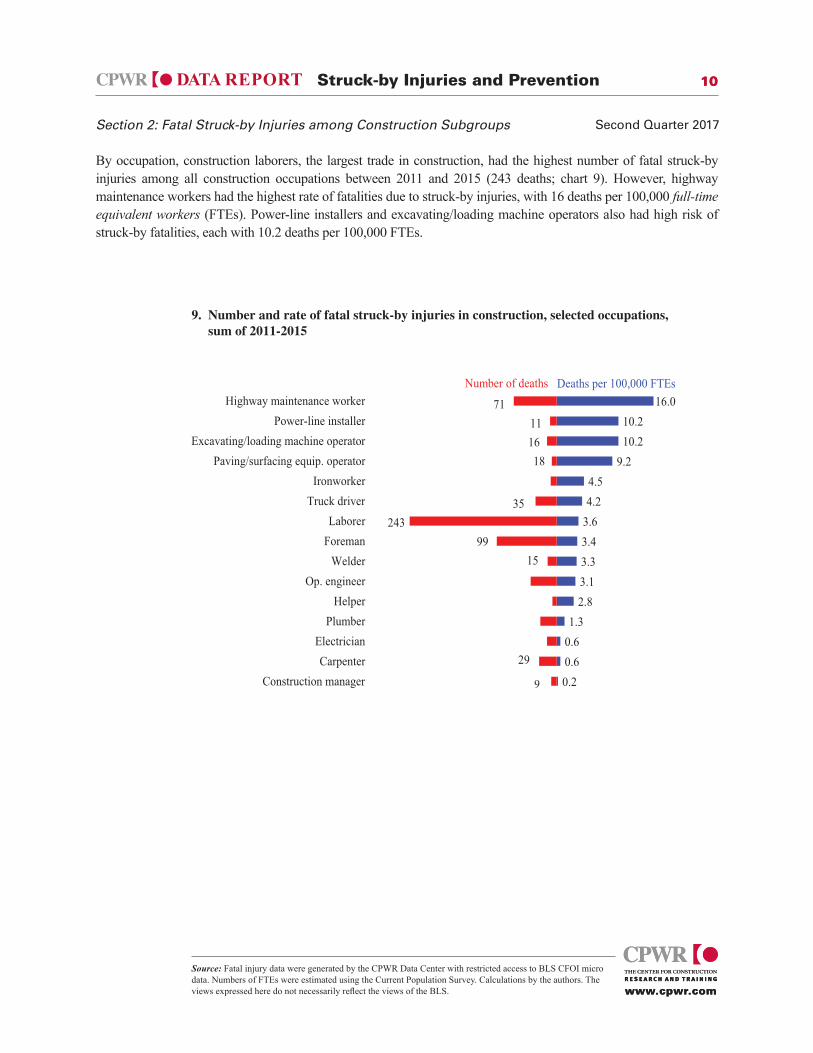
By occupation, construction laborers, the largest trade in construction, had the highest number of fatal struck-by injuries among all construction occupations between 2011 and 2015 (243 deaths; chart 9). However, highway maintenance workers had the highest rate of fatalities due to struck-by injuries, with 16 deaths per 100,000 full-time equivalent workers (FTEs). Power-line installers and excavating/loading machine operators also had high risk of struck-by fatalities, each with 10.2 deaths per 100,000 FTEs.
Source: Fatal injury data were generated by the CPWR Data Center with restricted access to BLS CFOI micro data. Numbers of FTEs were estimated using the Current Population Survey. Calculations by the authors. The views expressed here do not necessarily reflect the views of the BLS.
9. Number and rate of fatal struck-by injuries in construction, selected occupations, sum of 2011-2015
0.2 0.6 0.6 1.3
2.8 3.1 3.3 3.4 3.6 4.2 4.5
9.2 10.2 10.2
16.0
Construction managerCarpenter
ElectricianPlumber
HelperOp. engineer
WelderForemanLaborer
Truck driverIronworker
Paving/surfacing equip. operatorExcavating/loading machine operator
Power-line installerHighway maintenance worker
Deaths per 100,000 FTEs
16 11
71
15
18
99 243
35
10
16 27
7 43
9
29
Number of deaths
Struck-by Injuries and Prevention
11
www.cpwr.com
DATA REPORT 11
Section 2: Fatal Struck-by Injuries among Construction Subgroups Second Quarter 2017
www.cpwr.com
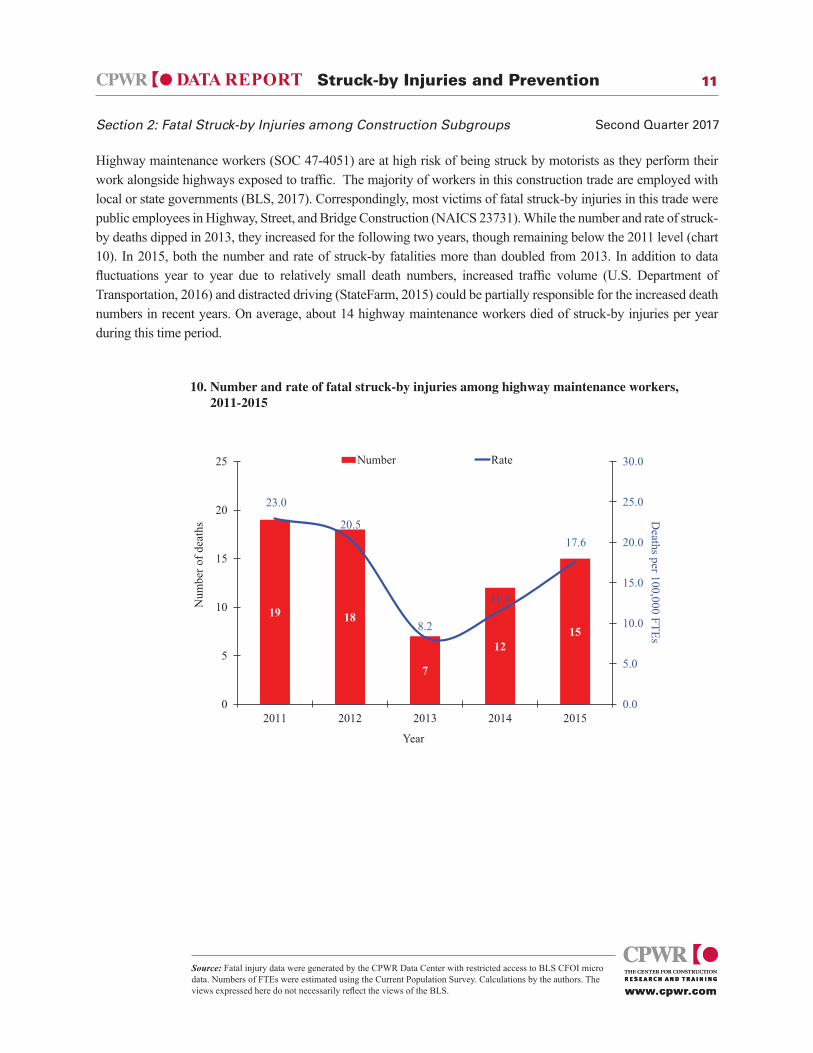
Highway maintenance workers (SOC 47-4051) are at high risk of being struck by motorists as they perform their work alongside highways exposed to traffic. The majority of workers in this construction trade are employed with local or state governments (BLS, 2017). Correspondingly, most victims of fatal struck-by injuries in this trade were public employees in Highway, Street, and Bridge Construction (NAICS 23731). While the number and rate of struck-by deaths dipped in 2013, they increased for the following two years, though remaining below the 2011 level (chart 10). In 2015, both the number and rate of struck-by fatalities more than doubled from 2013. In addition to data fluctuations year to year due to relatively small death numbers, increased traffic volume (U.S. Department of Transportation, 2016) and distracted driving (StateFarm, 2015) could be partially responsible for the increased death numbers in recent years. On average, about 14 highway maintenance workers died of struck-by injuries per year during this time period.
Source: Fatal injury data were generated by the CPWR Data Center with restricted access to BLS CFOI micro data. Numbers of FTEs were estimated using the Current Population Survey. Calculations by the authors. The views expressed here do not necessarily reflect the views of the BLS.
10. Number and rate of fatal struck-by injuries among highway maintenance workers, 2011-2015
19 18
7
12 15
23.0
20.5
8.2
11.6
17.6
0.0
5.0
10.0
15.0
20.0
25.0
30.0
0
5
10
15
20
25
2011 2012 2013 2014 2015
Deaths per 100,000 FTEs
Num
ber o
f dea
ths
Year
Number Rate
Struck-by Injuries and Prevention
12
www.cpwr.com
DATA REPORT 12
Section 2: Fatal Struck-by Injuries among Construction Subgroups Second Quarter 2017
www.cpwr.com
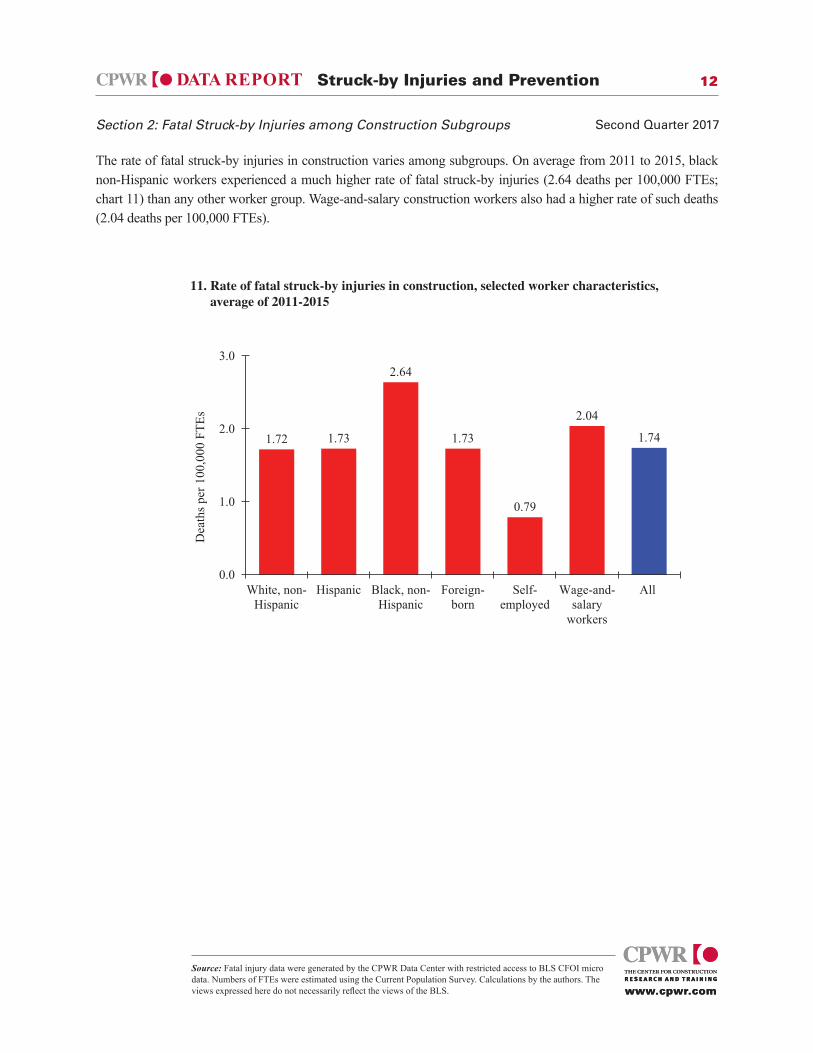
The rate of fatal struck-by injuries in construction varies among subgroups. On average from 2011 to 2015, black non-Hispanic workers experienced a much higher rate of fatal struck-by injuries (2.64 deaths per 100,000 FTEs; chart 11) than any other worker group. Wage-and-salary construction workers also had a higher rate of such deaths (2.04 deaths per 100,000 FTEs).
Source: Fatal injury data were generated by the CPWR Data Center with restricted access to BLS CFOI micro data. Numbers of FTEs were estimated using the Current Population Survey. Calculations by the authors. The views expressed here do not necessarily reflect the views of the BLS.
11. Rate of fatal struck-by injuries in construction, selected worker characteristics, average of 2011-2015
1.72 1.73
2.64
1.73
0.79
2.04
1.74
0.0
1.0
2.0
3.0
White, non-Hispanic
Hispanic Black, non-Hispanic
Foreign-born
Self-employed
Wage-and-salary
workers
All
Dea
ths p
er 1
00,0
00 F
TEs
Struck-by Injuries and Prevention
13
www.cpwr.com
DATA REPORT 13
Section 2: Fatal Struck-by Injuries among Construction Subgroups Second Quarter 2017
www.cpwr.com
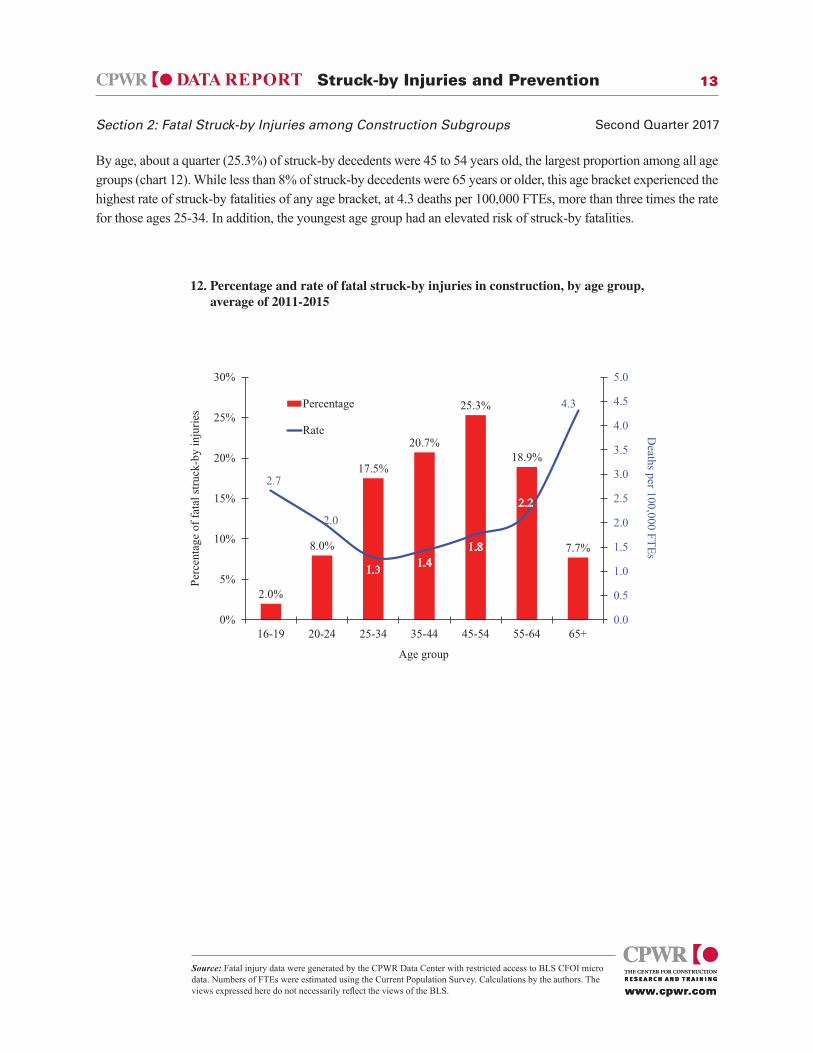
By age, about a quarter (25.3%) of struck-by decedents were 45 to 54 years old, the largest proportion among all age groups (chart 12). While less than 8% of struck-by decedents were 65 years or older, this age bracket experienced the highest rate of struck-by fatalities of any age bracket, at 4.3 deaths per 100,000 FTEs, more than three times the rate for those ages 25-34. In addition, the youngest age group had an elevated risk of struck-by fatalities.
Source: Fatal injury data were generated by the CPWR Data Center with restricted access to BLS CFOI micro data. Numbers of FTEs were estimated using the Current Population Survey. Calculations by the authors. The views expressed here do not necessarily reflect the views of the BLS.
12. Percentage and rate of fatal struck-by injuries in construction, by age group, average of 2011-2015
2.0%
8.0%
17.5%
20.7%
25.3%
18.9%
7.7%
2.7
2.0
4.3
0.0
0.5
1.0
1.5
2.0
2.5
3.0
3.5
4.0
4.5
5.0
0%
5%
10%
15%
20%
25%
30%
16-19 20-24 25-34 35-44 45-54 55-64 65+
Deaths per 100,000 FTEs
Perc
enta
ge o
f fat
al st
ruck
-by
inju
ries
Age group
Percentage
Rate
Struck-by Injuries and Prevention

DATA REPORT 14
SECTION 3: TRENDS OF NONFATAL STRUCK-BY INJURIES IN
Coinciding with the fatal struck-by injury trend, both the number and rate of struck-by injuries resulting in days away from work (DAFW) in construction hit a low in 2010 and increased afterward. In 2015, 17,050 struck-by injuries occurred in construction, 2,430 more than in 20117, about a 17% increase (chart 13). The rate however slightly decreased, from 29.3 in 2011 to 28.7 injuries per 10,000 FTEs in 2015. All nonfatal injury numbers in this report refer to those resulting in DAFW.
7In 2011, the injury coding was switched from OIICS version 1.01 to OIICS version 2.01, therefore the numbers before and after 2011 are not directly comparable. Source: 2003-2015 Survey of Occupational Injuries and Illnesses.
13. Number and rate of nonfatal struck-by injuries in construction, 2003-2015 (Private wage-and-salary workers)
www.cpwr.com
Second Quarter 2017
30.0 29.1 32.1 31.6
27.9 26.1
16.2 12.6
14.6 15.2 17.5 16.6 17.1
50.1
28.7
0
10
20
30
40
50
60
0
5
10
15
20
25
30
35
2003 2004 2005 2006 2007 2008 2009 2010 2011 2012 2013 2014 2015
Injuries per 10,000 FTEs
Num
ber o
f inj
urie
s (in
thou
sand
s)
Year
NumberRate
Revised OIICS
CONSTRUCTION
Struck-by Injuries and Prevention

15DATA REPORT 15
www.cpwr.com
Section 3: Trends of Nonfatal Struck-by Injuries in Construction Second Quarter 2017
www.cpwr.com
By more detailed categories, about 96% of all nonfatal struck-by injuries in construction from 2011 to 2015 were caused by an object or equipment (chart 14). The increase (2,430) between 2011 and 2015 can be attributed to such equipment and object injuries, given that the number of struck-by vehicle injuries was approximately the same in both 2011 and 2015.
14. Number of nonfatal struck-by injuries in construction, by vehicle versus by object or equipment, 2003-2015 (Private wage-and-salary workers)
28.9 28.0 30.6 30.2
27.0 25.3
15.6 11.9 13.8 14.8 17.2 15.9 16.3
30.0 29.1 32.1 31.6
27.9 26.1
16.2
12.6 14.6 15.2
17.5 16.6 17.1
0
5
10
15
20
25
30
35
40
2003 2004 2005 2006 2007 2008 2009 2010 2011 2012 2013 2014 2015
Num
ber o
f inj
urie
s (in
thou
sand
s)
Year
Struck by vehicle Struck by object or equipment
Note: In 2011, the injury coding was switched from OIICS version 1.01 to OIICS version 2.01, therefore the numbers before and after 2011 are not directly comparable. Source: 2003-2015 Survey of Occupational Injuries and Illnesses.
Struck-by Injuries and Prevention

16DATA REPORT 16
Second Quarter 2017
www.cpwr.comwww.cpwr.com
In 2015, construction had the third-highest number of overall struck-by injuries after manufacturing and retail (chart 15a). Construction was also ranked third in injuries due to being struck by a vehicle, after transportation and retail. Moreover, construction had the highest risk of being struck by an object or equipment among all industries, at 27.4 injuries per 10,000 FTES, nearly twice the risk of all industries combined (chart 15b).
Source: 2015 Survey of Occupational Injuries and Illnesses
Section 3: Trends of Nonfatal Struck-by Injuries in Construction
15a. Number of nonfatal struck-by injuries, by major industry, 2015 (Private wage-and-salary workers)
2,450
6,460
10,260
10,390
16,260
21,270
24,330
Utilities
Mining
Agriculture
Waste management
Wholesale
Transportation
Construction
Manufacturing
RetailNumber of injuries
Struck by vehicle
Struck by object orequipment
2,630
25,250
6,940
11,500
10,760
17,050
22,000
370
1,040
15b. Rate of nonfatal injuries from being struck by object or equipment, by major industry, 2015 (Private wage-and-salary workers)
14.1
6.4
11.4
12.7
17.2
18.1
20.7
23.3
24.8
27.4
All industries
Utilities
Mining
Waste management
Manufacturing
Wholesale
Retail
Transportation
Agriculture
ConstructionInjuries per 10,000 FTEs
Struck-by Injuries and Prevention

17DATA REPORT 17
www.cpwr.com
Section 3: Trends of Nonfatal Struck-by Injuries in Construction Second Quarter 2017
www.cpwr.com
Solid building materials were the most common source of nonfatal struck-by injuries in 2015, accounting for about 3,500 injuries (chart 16). Other common sources were hand tools (both nonpowered and powered), and scraps, waste, and debris. Together these four sources caused 64% of nonfatal struck-by object injuries.
16. Number of nonfatal injuries from being struck by object or equipment in construction, selected primary sources, 2015 (Private wage-and-salary workers)
240
390
480
490
520
600
890
1,100
2,530
3,260
3,500
Material and personnel handling machinery
Structures other than buildings
Other structural elements
Containers
Highway vehicles- motorized
Fasteners- connectors- ropes- ties
Furniture and fixtures
Scrap- waste- debris
Handtools--powered
Handtools--nonpowered
Building materials--solid elementsNumber of injuries
Source: Numbers were obtained from the BLS through special requests. The views expressed here do not necessarily reflect the views of the BLS.
Struck-by Injuries and Prevention
18DATA REPORT 18
SECTION 4: NONFATAL STRUCK-BY INJURIES AMONG
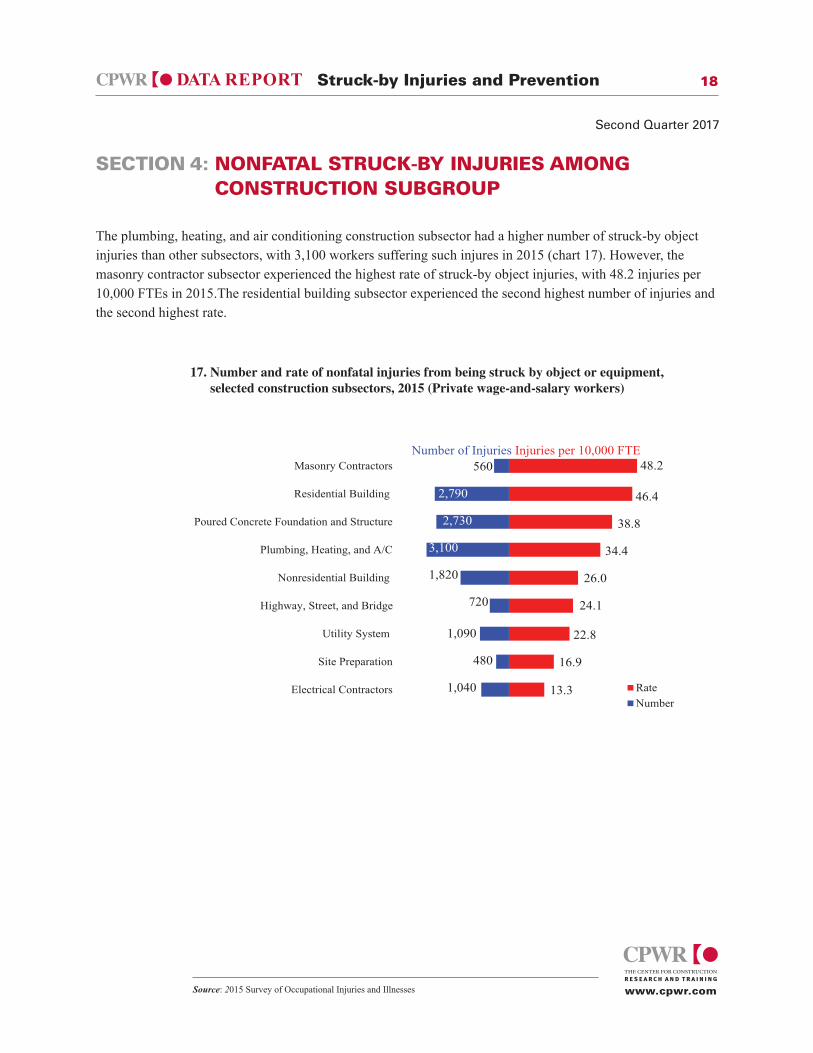
The plumbing, heating, and air conditioning construction subsector had a higher number of struck-by object injuries than other subsectors, with 3,100 workers suffering such injures in 2015 (chart 17). However, the masonry contractor subsector experienced the highest rate of struck-by object injuries, with 48.2 injuries per 10,000 FTEs in 2015.The residential building subsector experienced the second highest number of injuries and the second highest rate.
Source: 2015 Survey of Occupational Injuries and Illnesses www.cpwr.com
Second Quarter 2017
17. Number and rate of nonfatal injuries from being struck by object or equipment, selected construction subsectors, 2015 (Private wage-and-salary workers)
13.3
16.9
22.8
24.1
26.0
34.4
38.8
46.4
48.2
Electrical Contractors
Site Preparation
Utility System
Highway, Street, and Bridge
Nonresidential Building
Plumbing, Heating, and A/C
Poured Concrete Foundation and Structure
Residential Building
Masonry ContractorsNumber of Injuries Injuries per 10,000 FTE
RateNumber
3,100
560
2,790
2,730
1,820
1,090
1,040
720
480
Struck-by Injuries and Prevention
CONSTRUCTION SUBGROUP
19DATA REPORT 19
www.cpwr.com
Section 4: Nonfatal Struck-by Injuries among Construction Subgroup Second Quarter 2017
www.cpwr.com
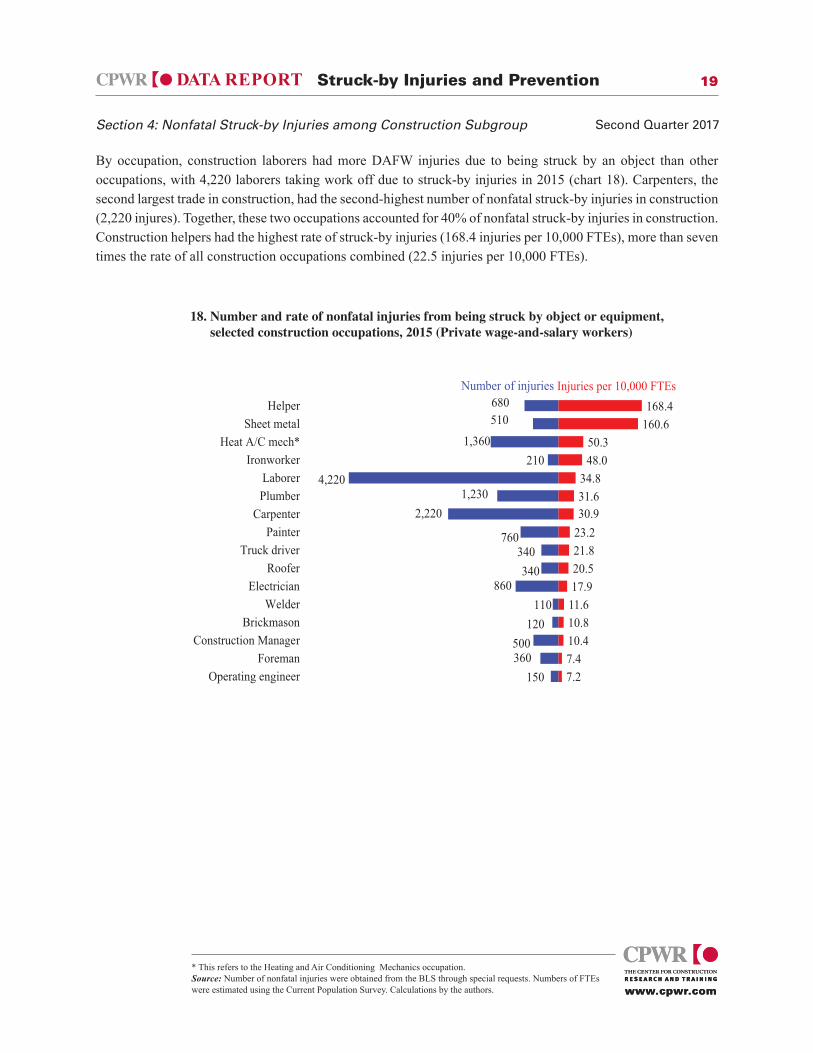
By occupation, construction laborers had more DAFW injuries due to being struck by an object than other occupations, with 4,220 laborers taking work off due to struck-by injuries in 2015 (chart 18). Carpenters, the second largest trade in construction, had the second-highest number of nonfatal struck-by injuries in construction (2,220 injures). Together, these two occupations accounted for 40% of nonfatal struck-by injuries in construction. Construction helpers had the highest rate of struck-by injuries (168.4 injuries per 10,000 FTEs), more than seven times the rate of all construction occupations combined (22.5 injuries per 10,000 FTEs).
18. Number and rate of nonfatal injuries from being struck by object or equipment, selected construction occupations, 2015 (Private wage-and-salary workers)
7.27.410.410.811.617.920.521.823.230.931.634.8
48.050.3
160.6168.4
Operating engineerForeman
Construction ManagerBrickmason
WelderElectrician
RooferTruck driver
PainterCarpenter
PlumberLaborer
IronworkerHeat A/C mech*
Sheet metalHelper
Injuries per 10,000 FTEsNumber of injuries
760
2,220
4,220
1,360
1,230
680
860340
340
150360500
120
510
110
210
* This refers to the Heating and Air Conditioning Mechanics occupation. Source: Number of nonfatal injuries were obtained from the BLS through special requests. Numbers of FTEs were estimated using the Current Population Survey. Calculations by the authors.
Struck-by Injuries and Prevention
20DATA REPORT 20
www.cpwr.com
Section 4: Nonfatal Struck-by Injuries among Construction Subgroup Second Quarter 2017
www.cpwr.com
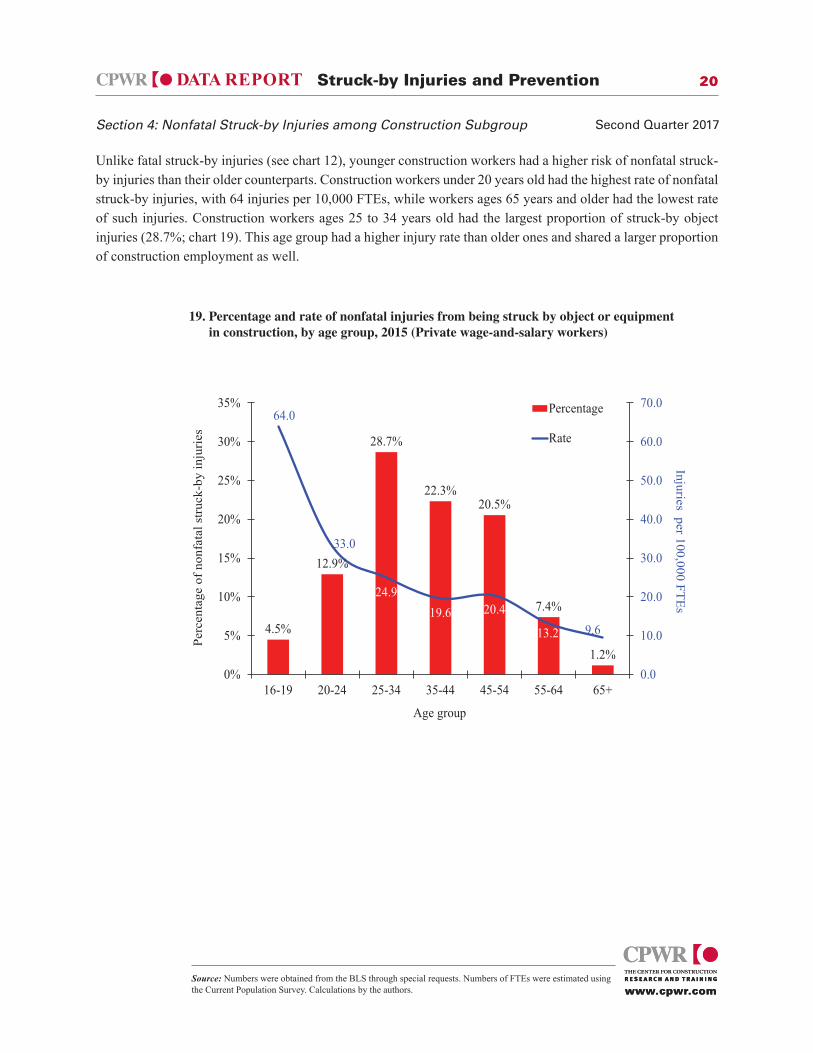
Unlike fatal struck-by injuries (see chart 12), younger construction workers had a higher risk of nonfatal struck-by injuries than their older counterparts. Construction workers under 20 years old had the highest rate of nonfatal struck-by injuries, with 64 injuries per 10,000 FTEs, while workers ages 65 years and older had the lowest rate of such injuries. Construction workers ages 25 to 34 years old had the largest proportion of struck-by object injuries (28.7%; chart 19). This age group had a higher injury rate than older ones and shared a larger proportion of construction employment as well.
19. Percentage and rate of nonfatal injuries from being struck by object or equipment in construction, by age group, 2015 (Private wage-and-salary workers)
4.5%
12.9%
28.7%
22.3%20.5%
7.4%
1.2%
64.0
33.0
24.919.6 20.4
13.2 9.6
0.0
10.0
20.0
30.0
40.0
50.0
60.0
70.0
0%
5%
10%
15%
20%
25%
30%
35%
16-19 20-24 25-34 35-44 45-54 55-64 65+
Injuries per 100,000 FTEs
Perc
enta
ge o
f non
fata
l stru
ck-b
y in
jurie
s
Age group
Percentage
Rate
.
Source: Numbers were obtained from the BLS through special requests. Numbers of FTEs were estimated using the Current Population Survey. Calculations by the authors.
Struck-by Injuries and Prevention

DATA REPORT 21
SECTION 5: PREVENTING STRUCK-BY INJURIES IN CONSTRUCTION
Struck-by injuries and deaths are preventable. Training (OSHA, 2011), personal protective equipment, engineering controls, safety protocols, and other solutions may be implemented to prevent struck-by injuries among construction workers. For example, many struck-by vehicle injuries can be prevented by back-up cameras, highly visible clothing, barriers and enforcement in road construction zones, and internal traffic control plans (Table 1). The implementation of safety solutions such as the ones listed in the table below can greatly reduce unnecessary deaths due to struck-by injuries.
Source: For sources cited in the table, please see the attached supplement.
Table 1: Solutions to Prevent Struck-By Injuries
www.cpwr.com
Second Quarter 2017
noituloS drazaH tnevEStruck-by vehicles Backover Back-up cameras1a, 6a
Back-up alarms radar systems1a,6a
Backover prevention standards 7, 10, 11
Broad spectrum alarms2
Blind Spot Diagrams6b
Internal Traffic Control Plan1b
Runover and backover during night work
Hardhats with active illumination3a
Hardhat mounted mirrors 12
High visibility clothing4b,5a
Work zone lighting systems3b,5a
Work zone intrusions from passenger vehicles in highway maintenance and road construction
Concrete/water filled barriers5b,8c
Mobile/Movable longitudinal barriers1a,1d,3d
Temporary-barriers1c
Intrusion alarms1e
Use of advance traffic signs8e
Gradual tapering of any lane closure8e
Police traffic enforcement in work zone 8e
Injuries among flaggers Automated Flagging Assistant Devices (AFAD)3c
Struck-by falling objects
Injuries from falling objects when working or walking below elevated work surfaces Injuries from falling objects when materials are being moved overhead Injuries from falling objects when carrying / lifting heavy loads
Hand tools tethered to worker’s belt by lanyard9
Hardhats4c
Pedestrian walkways8c or sidewalk sheds8c
Toe-boards, screens, debris nets, and guardrails on scaffolding8a, 8e
Workers remain a safe distance from suspended loads 8d
Proper storage of materials 8d
Workers don’t exceed the equipment’s load or lift capacity8e
Barricades for all dangerous areas and posted warning signs 8e
Struck-by flying objects
Injuries from flying objects created by power tools (such as pneumatic nail gun) and activities such as pushing, pulling, or prying Injuries from flying objects caused by grinding or striking materials
Workers trained on safe operation of power tools8e
All tools inspected before use8e
Sequential triggers for nail guns8b
Protective gear (Safety glasses4c, Hardhats4c,Face Shields 8d)
Struck-by swinging or slipping object
Injuries from swinging or slipping objects
No one working under loads as they are being lifted 8d
All loads secured and lifted evenly to prevent them from slipping.8d
Struck-by equipment Injuries due to being struck by heavy equipment or machinery
All equipment inspected before use8e
Operators trained and certified to operate equipment safely8e
Extreme caution used when approaching heavy equipment 8d
A highly visible reflective vest 8d
Struck-by Injuries and Prevention
DATA REPORT 22
Conclusion
Struck-by hazards are a major cause of fatal and nonfatal injuries in construction. During the period of 2011 to 2015, 804 construction workers died from struck-by injuries, more than any other major industry. Construction also had the highest rate of nonfatal struck-by injuries among all industries.
Hazards leading to fatal and nonfatal struck-by injuries in construction were quite different. About half (52.2%) of struck-by fatalities were caused by an object or equipment, while about 96% of nonfatal struck-by injuries were due to the same cause. The risk of struck-by injuries varied by occupation. The highway maintenance worker, power-line installer, and excavating or loading machine operator occupations were the most dangerous in terms of struck-by fatalities, whereas helpers and sheet metal workers had the highest risk of nonfatal struck-by injuries. In general, older construction workers had a higher risk of struck-by fatalities, while younger workers had a higher risk of nonfatal struck-by injuries.
Struck-by injuries and fatalities are preventable. The select solutions presented in this report summarizes struck-by prevention methods in construction, including safety standards and regulations, engineering controls, proper personal protective equipment (PPE), and safety and health training. These methods may be applied separately or together based on specific circumstances in order to prevent construction workers from struck-by injuries.
References• Dong XS, Wang X, Katz R, West G, Bunting J. 2017. Fall Injuries and Prevention in the Construction
Industry http://www.cpwr.com/sites/default/files/publications/Quarter1-QDR-2017.pdf (Accessed June 2017).
• OSHA. 2011. Construction Focus Four: Outreach Training Packet https://www.osha.gov/dte/outreach/construction/focus_four/constrfocusfour_introduction.pdf (Accessed June 2017).
• StateFarm. 2015. Distracted Driving Trends: Use of Hand-Held Cellphones for Talking Decreasing, Increasing for Internet and Social Media. https://newsroom.statefarm.com/20151207distracted-driving-trends/#wWsXBYB0sJRcebKt.99 (Accessed June 2017).
• U.S. Department of Transportation, 2016. Traffic volume trends. https://www.fhwa.dot.gov/policyinformation/travel_monitoring/tvt.cfm (Accessed June 2017).
• U.S. Bureau of Labor Statistics. 2017. Occupational Employment and Wages. 47-4051 Highway Maintenance Workers. https://www.bls.gov/oes/current/oes474051.htm (Accessed June 2017).
www.cpwr.com
Second Quarter 2017

DATA REPORT 23
Supplement: Sources of Table 1 (accessed June 2017)
1. American Road & Transportation Builders Association (ARTBA). National Work Zone Safety Clearinghouse https://www.workzonesafety.org/data-resources/ a. Back-up cameras and radar systems https://www.workzonesafety.org/data-resources/other- resources/runover-backover-manufacturers/ b. Internal Traffic Control Plans https://www.workzonesafety.org/data-resources/runover-backover/itcp/ c. Temporary-barriers https://www.workzonesafety.org/work_zone_topics/temporary-barriers/ d. Mobile barrier: https://www.workzonesafety.org/data-resources/mobile-barriers/ e. Intrusion alarms https://www.workzonesafety.org/work_zone_topics/intrusion-alarms/
2. Australian Acoustical Society. Broad spectrum alarms https://www.acoustics.asn.au/conference_proceedings/AAS2012/papers/p126.pdf
3. CPWR-The Center for Construction Research and Training. CPWR Solution Database a. Hardhats http://www.cpwrconstructionsolutions.org/heavy_equipment/solution/933/illumination- ring-for-hard-hats.html b. Work-zone-lighting http://www.cpwrconstructionsolutions.org/solution/875/work-zone-lighting. html?sess_id=eb42ff866b43cc308b05fcbb546e69a1 c. Automated Flagging Assistant Devices (AFAD) http://www.cpwrconstructionsolutions.org/ solution/934/automated-flagging-assistant-devices-afad.html?sess_id=1c647558a27fc3f5f5112469 8c6402d2
d. Movable Longitudinal Barriers http://www.cpwrconstructionsolutions.org/solution/967/movable- longitudinal-barriers.html?sess_id=f46f66515d612df29cdf458e1c7b930a
4. International Safety Equipment Association (ISEA). a. ANSI/ISEA Standard Z87 https://safetyequipment.org/isea-standards/ansiisea-z87-accredited- standards-committee/ansiisea-z87-1-2015-standard/ b. ANSI/ISEA standard 107 https://safetyequipment.org/ansiisea-107-2015/ c. ANSI/ISEA Standard Z89 https://safetyequipment.org/standard/ansiisea-z89-1-2014/
5. Laborers’ Health & Safety Fund of North America. a. Visibility in Work Zones at Night https://www.lhsfna.org/index.cfm/lifelines/april-2014/can-you- see-me-now-visibility-in-work-zones-at-night/ b. Work-zone-intrusion https://www.lhsfna.org/index.cfm/lifelines/april-2016/solving-the-work- zone-intrusion-problem/
6. National Institute for Occupational Safety and Health (NIOSH). a. Preventing Worker Injuries and Deaths from Backing Construction Vehicles and Equipment at Roadway Construction Worksites https://www.cdc.gov/niosh/docs/wp-solutions/2014-125/ pdfs/2014-125.pdf b. Blind Spot Diagrams https://www.cdc.gov/niosh/topics/highwayworkzones/BAD/imagelookup.html
www.cpwr.com
Second Quarter 2017
DATA REPORT 24
Supplement continued...
7. Office of Information and Regulatory Affairs/Office of Management and Budget https://www.reginfo. gov/public/do/eAgendaViewRule?pubId=201610&RIN=1218-AC51
8. Occupational Safety and Health Administration (OSHA). a. Standard 29 CFR 1926.451(h)(2): Toe-boards on scaffolding https://www.osha.gov/pls/oshaweb/owadisp.show_document?p_table=standards&p_id=10752 b. Nail Gun Safety https://www.osha.gov/Publications/NailgunFinal_508_02_optimized.pdf c. Concrete and Masonry Construction https://www.osha.gov/Publications/3106.html d. Big four construction hazards: struck-by hazards https://www.osha.gov/dte/grant_materials/fy08/ sh-17792-08/struck_by_english_r6.pdf e. ‘Struck-By’ Hazards Trainer Guide https://www.osha.gov/dte/grant_materials/fy07/sh-16586- 07/2_struckby_hazards_trainer_guide.pdf
9. PROTO® Industrial Tools. http://www.protoindustrial.com/en/Pages/Tethered-Tools.aspx#
10. Virginia Department of Labor and Industry. Backover prevention standards http://www.doli.virginia.gov vosh_enforcement/reverse_signal.html
11. Washington State. Backover prevention standards http://apps.leg.wa.gov/WAC/default.aspx?cite=296- 155&full=true#296-155-610
12. Wikipedia. Hardhat Mounted Mirror https://en.wikipedia.org/wiki/Hardhat_mounted_mirror
www.cpwr.com
Second Quarter 2017

DATA REPORT 25
Data Sources:
• Bureau of Labor Statistics, 2003-2015 Census of Fatal Occupational Injuries• Bureau of Labor Statistics, 2003-2015 Survey of Occupational Injuries and Illnesses • Bureau of Labor Statistics, 2011-2015 Current Population Survey
Second Quarter 2017
© 2017, CPWR – The Center for Construction Research and Training. All rights reserved.
CPWR is the research and training arm of North America’s Building Trades Unions. Production of this document was supported by cooperative agreement OH 009762 from the National Institute for Occupational Safety and Health (NIOSH). The contents are solely the responsibility of the authors and do not necessarily represent the official views of NIOSH.
8484 Georgia AvenueSuite 1000Silver Spring, MD 20910www.cpwr.com
Please visit CPWR’s other resources to help reduce construction safety and health hazards:
Construction Solutions http://www.cpwrconstructionsolutions.org/ Construction Solutions ROI Calculator http://www.safecalc.org/ The Electronic Library of Construction OSH http://www.elcosh.org/index.php Falls Campaign http://stopconstructionfalls.com/ Hand Safety http://choosehandsafety.org/ Work Safely with Silica http://www.silica-safe.org/
About the CPWR Data Center
The CPWR Data Center is part of CPWR – The Center for Construction Research and Training. CPWR is a 501(c)(3) nonprofit research and training institution created by North America’s Building Trades Unions, and serves as its research arm. CPWR has focused on construction safety and health research since 1990. The Quarterly Data Reports – a series of publications analyzing construction-related data, is part of our ongoing surveillance project funded by the National Institute for Occupational Safety and Health (NIOSH).