Embed Size (px)
Citation preview

New Perspectives on MicrosoftExcel 2002 Tutorial 1
1
XP
Microsoft Excel
New Perspectives on MicrosoftExcel 2002 Tutorial 1
2
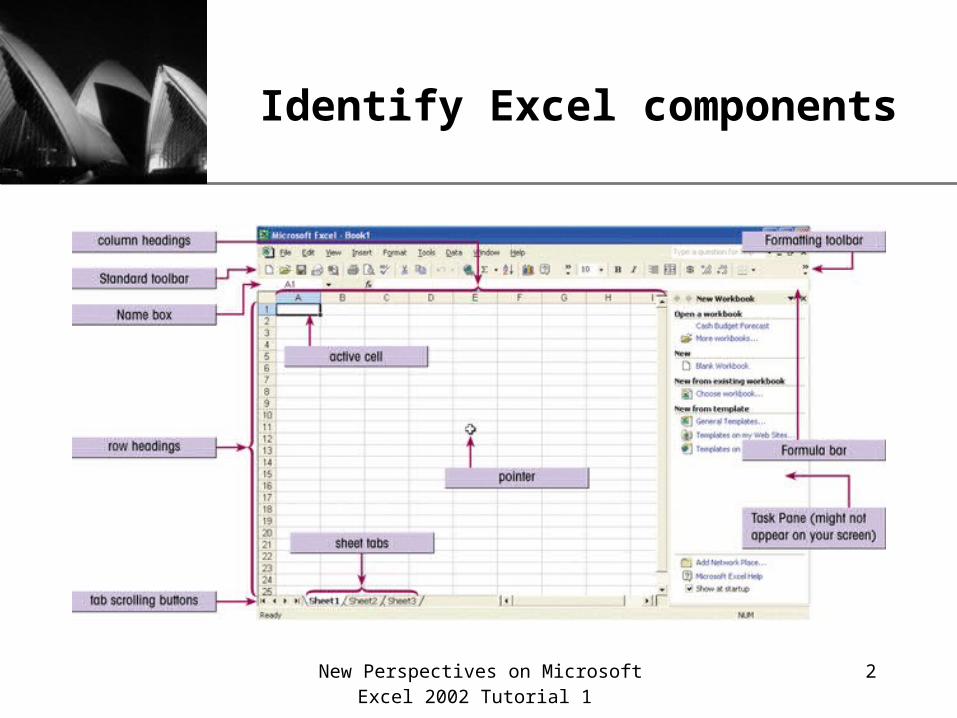
XPIdentify Excel components

New Perspectives on MicrosoftExcel 2002 Tutorial 1
3
XPDescriptions of Excel components

New Perspectives on MicrosoftExcel 2002 Tutorial 1
4
XPExcel’s arithmetic operators
Arithmetic operations, symbols and description of their use.

New Perspectives on MicrosoftExcel 2002 Tutorial 1
5
XPKnow the order of precedence
The order of precedence rules must be considered when creating expressions. The chart below illustrates Excel’s order of precedence and shows sample expressions and the result of each expression.

New Perspectives on MicrosoftExcel 2002 Tutorial 1
6
XPWork with the Insert Function button
• Excel supplies more than 350 functions organized into 10 categories:– Database, Date and Time, Engineering, Financial,
Information, Logical, Lookup, Math, Text and Data, and Statistical functions
• You can use the Insert Function button on the Formula bar to select from a list of functions.
• A series of dialog boxes will assist you in filling in the arguments of the function and this process also enforces the use of proper syntax.

New Perspectives on MicrosoftExcel 2002 Tutorial 1
7
XPMath and Statistical functions
This chart shows some commonly used math and statistical functions and a description of what they do.

New Perspectives on MicrosoftExcel 2002 Tutorial 1
8
XPDefine functions, and functions within functions
• The SUM function is a very commonly used math function in Excel.
• A basic formula example to add up a small number of cells is =A1+A2+A3+A4, but that method would be cumbersome if there were 100 cells to add up.
• Use Excel's SUM function to total the values in a range of cells like this: SUM(A1:A100).
• You can also use functions within functions. Consider the expression =ROUND(AVERAGE(A1:A100),1).– This expression would first compute the average of all the values
from cell A1 through A100 and then round that result to 1 digit to the right of the decimal point

New Perspectives on MicrosoftExcel 2002 Tutorial 1
9
XPExamine the Insert Function dialog box
This dialog box appears when you click the Insert Function button. It can assist you in defining your function.

New Perspectives on MicrosoftExcel 2002 Tutorial 1
10
XPCreate column and pie charts in Excel
• Charts, or graphs, provide visual representations of the workbook data.
• A chart may be embedded in an existing worksheet, or can be created on a separate chart sheet, with its own tab in the workbook.
• You can use Excel’s Chart Wizard to quickly and easily create charts.
• The Chart Wizard is a series of dialog boxes that prompt you for information about the chart you want to generate

New Perspectives on MicrosoftExcel 2002 Tutorial 1
11
XPCreate a chart usingthe Chart Wizard
• To create a chart with the Chart Wizard:– Select the data you want to chart, which will be your data source
– Click the Chart Wizard button on the standard toolbar
– In the first step of the chart wizard, select the chart type and sub-type
– In the second step of the Chart Wizard, make any additions or modifications to the chart's data source
– In the third step, make any modifications to the chart's appearance
– In the fourth and final step, specify the location for the chart, then click the OK button

New Perspectives on MicrosoftExcel 2002 Tutorial 1
12
XPChart Wizard dialog box 1
Choose a chart type and view examples of that type in dialog box 1.
Choose which type of chart you want in this pane.
Select a sub-type of that chart in this pane.
Click and hold this button down to see a preview of your chart.

New Perspectives on MicrosoftExcel 2002 Tutorial 1
13
XPChoosing a data series
• You can alter the data source during step 2 of the Chart Wizard and also choose whether to organize the data source by rows or by columns.
• The data source is organized into a collection of data series. – A data series consists of data values, which are plotted on the
chart's vertical, or Y-axis – The data series’ category values, or X values, are on the horizontal
axis, called the X-axis
• A chart can have several data series all plotted against a common set of category values.

New Perspectives on MicrosoftExcel 2002 Tutorial 1
14
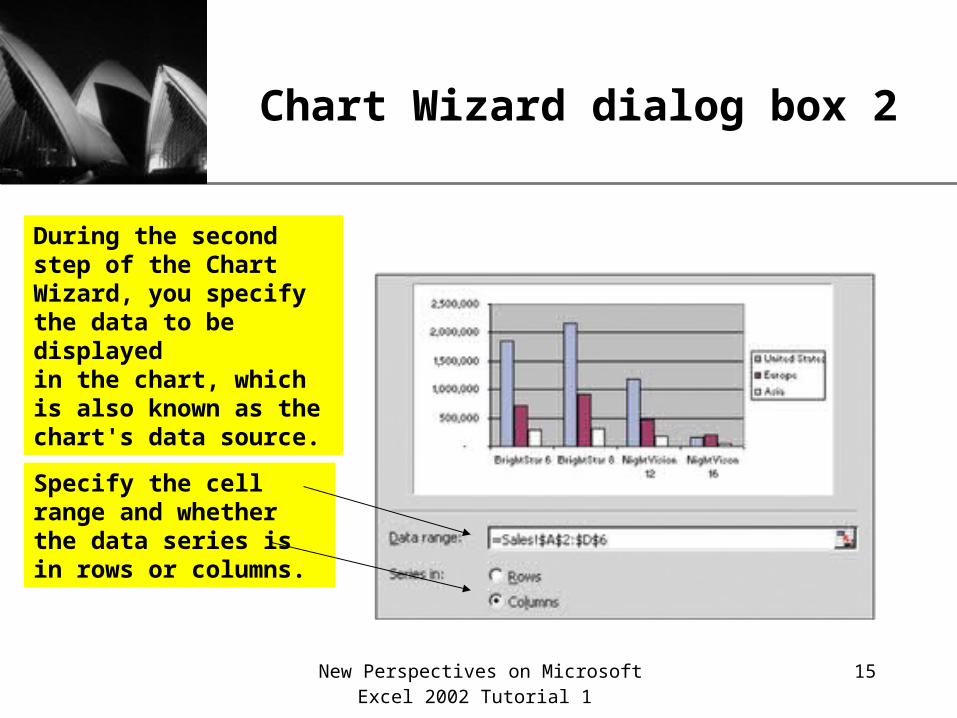
XPChart Wizard dialog box 2
During the second step of the Chart Wizard, you specify the data to be displayedin the chart, which is also known as the chart's data source.
Specify the cell range and whether the data series is in rows or columns.
New Perspectives on MicrosoftExcel 2002 Tutorial 1
15
XPChart Wizard dialog box 2
During the second step of the Chart Wizard, you specify the data to be displayedin the chart, which is also known as the chart's data source.
Specify the cell range and whether the data series is in rows or columns.

New Perspectives on MicrosoftExcel 2002 Tutorial 1
16
XPChart Wizard dialog box 2
During the second step of the Chart Wizard, you specify the data to be displayedin the chart, which is also known as the chart's data source.
Specify the cell range and whether the data series is in rows or columns.

New Perspectives on MicrosoftExcel 2002 Tutorial 1
17
XPChart Wizard dialog box 2
During the second step of the Chart Wizard, you specify the data to be displayedin the chart, which is also known as the chart's data source.
Specify the cell range and whether the data series is in rows or columns.