Embed Size (px)
Citation preview

1
XII
External trade sector
by Charan d. Wadhva∗∗
I. Introduction
A very large number of external economic factors influence the performance of
India’s economic transactions with the rest of the world. Internal economic and non-
economic factors also undoubtedly influence the changing dynamics of India’s
external trade in an increasingly competitive and inter-dependent and more open
global economy. In this book on projecting the shape of things to come for India in
the year 2025, other chapters have at length dealt with the impact of several internal
economic and non-economic factors.
I.1: Focus Areas:
This chapter deals with India’s foreign trade and excludes other elements of its
external economic relations in the global context. It surveys trends in India’s exports
and imports during 1970-2000 and examines its positioning in world trade. It builds
alternative scenarios for India’s foreign trade for the period 2000-2025 in the global
context. To sharpen the focus on the comparative positioning of India in global trade,
we have selected thirty countries (including India) for indepth analysis. These
includes countries from both the developed world and the developing world -
especially those developing countries which are India’s competitors.
We would like to mention at the outset that due to lack of systematic data on trade in
services, our analysis and projections are restricted to India’s merchandise trade
(exports; and imports).
∗ I Thank Dr. Nawal K. Paswan for the painstaking statistical help and bibliographical references provided by him for writing this chapter.
2
I.2: The Country Coverage:
The Thirty countries selected by us (see Tables 1 to 4) include 17 major trading
nations from the developed world constituting nearly 60.0 percent of world trade in
the baseline scenario of the year 1999. These 17 countries are: 1. Australia; 2.
Austria; 3. Canada; 4. Denmark; 5. Finland; 6. France; 7. Germany; 8. Greece; 9.
Ireland; 10. Italy; 11. Japan; 12. Spain; 13. Sweden; 14. New Zealand; 15.
Netherlands; 16. United Kingdom; and 17. U.S.A. The developing 13 countries
(including India) have been somewhat arbitrarily chosen so that we can include India
and its major competitor developing countries in our calculations. To be sure, these
13 developing countries include major developing trading nations of the world in the
year 1999. The 13 developing countries selected by us are : 1. China; 2. India; 3.
Indonesia; 4. Malaysia; 5. Mauritius; 6. Pakistan; 7. Peru; 8. Philippines; 9. South
Korea; 10. Singapore; 11. South Africa; 12. Sri Lanka; and 13. Thailand.
I.3: The Coverage of Regional Trading Blocs (RTBs):
In view of the growing importance of the regionalisation of the world trade in recent
years through the various Regional Trading Blocs (RTBs) organisations, we have
included selected major trading blocs organizations relevant to India’s interest.
These include: 1. Asia Pacific Economic Cooperation (APEC) Forum (currently with
21 member countries); 2. The European Union (EU - currently with 15 member
countries); 3. North American Free Trade Area (NAFTA - currently with 3 member
countries); and 4. The Association of South East Asian Nations (ASEAN - currently
with 10 member countries); 5. Bangladesh-India-Myanmar-Sri Lanka-Thailand
Economic Cooperation (BIMSTEC) forum with five members; and 6. South Asian
Association for Regional Cooperation (SAARC). India is a member of only one
regional grouping (SAARC). SAARC currently operates scheme of preferential
trading arrangement among its members. It is looking forward to the establishment
of a full fledged free trade area in the coming decade among its 7 member countries.
3
I.4: Building Alternative Scenarios:
Three alternative scenarios viz, Optimistic, pessimistic; and realistic are built for our
projections presented in this chapter. The methodology employed for this purpose is
explained at relevant places.
For global projections of key economic parameters like Gross Domestic Output; we
have relied on the World Scan Model (Core Version) produced by the CPB
Netherlands Bureau for Economic Policy Analsis.1
I.5 : The Scheme of this Chapter:
Besides this introductory section (Section-I), the rest of this chapter is organized
around the following other six sections:
II. Some Major Global Economic and Financial Developments
III. Highlights of the World Scan Model for Global Projections
IV. Trends and Projections for Global Trade and India’s Exports and Imports
V. Trends in the Commodity Composition of India’s Trade and Projections
VI. Trends and Projections in India’s Direction of Trade
VII. Formulation of Strategic Trade Policy for India upto 2025.
We now precede to deal with each of the above-mentioned six new sections.
4
II
Some Major Global Economic and Financial Developments
Before getting into the tricky and hazardous issue of building futuristic scenarios of
growth of India’s trade with the world and India’s likely market shares in world trade
vis-à-vis leading competitor nations, it would be useful to provide a short
backgrounder on the recent economic difficulties experienced by the world and the
regional economies. Some of these developments came as a complete surprise to the
international community. It would, therefore, be important to bear these negative
developments in mind so that a more moderate and more realistic future scenario of
growth of world trade can be prepared.
The following major setbacks to the global, regional and individual economies
(belonging to both the developed and developing countries) need to be recounted in
the above context:
• Longer than expected slowing down of the global economy especially the growth in the developed OCED countries throughout the 1990’s leading to slower growth rate of world trade in volume terms in the 1990’s compared to the 1980’s and the 1970’s. The world economy faced recession in 1999 and recovery did not continue beyond 2000 with 2001 also being a relatively depressed year for the growth of the world economy and world trade. What is worse is that the periods of recession in the economies of several developed countries coincided at the same time leaving little scope for offsetting growth in other developed economies.2
• Totally unpredicted economic and financial crisis (including
unprecedented fall in the exchange value of the currencies) in East Asia and Southeast Asia with contagion effect during 1997-1998. This crisis is still lingering on in some of these countries due to the weak world demand for imports led by the slowing down of the US economy since
1 CPB Netherlands Bureau for Economic Policy Analysis, World Scan: the Core Version, Netherlands, December 1999 (ISBN 90 5833 020 6) 2 For documentary evidence of the contents of these observations, see International Monetary Fund, World Economic Outlook, May 2000; and the World Bank, Annual Report 2000, Washington D.C. predicting lowest growth rates for developing countries since the debt crisis of Latin American Countries of the 1980’s.
5
1999.3 The group of 8 (G-8) developed countries are yet to jointly evolve policies to prevent a deeper global downtown and the most affected countries of East Asia (including Japan and South Korea) and the South East Asia (especially Indonesia) are yet to effectively restructure their financial sectors so as to substantially reduce the size of their Non-Performing Assets (NPAs).
• Japan, one of the earlier leading engines of growth in the world economy
and most certainly of the economies of Southeast Asia has been in the throes of its worst ever decade long recession. What is worse, this downturn seems to be structural in nature and is refusing to respond to the medicine of fiscal stimuli.
• Despite faster pace of trade liberalization through cuts in tariff on and
progressive opening up of the markets of both the developed and more so of the developing countries, the gains from trade liberalization envisaged in both the Uruguay Round and the World Trade order being evolved since 1995 under the auspices of the World Trade Organization have in reality been vastly over-estimated. In several cases, new Non-Tariff Barriers (in the forms of physio-sanitary standards; environmental standards; restrictions on the imports of carpets produced by child labour in the developing countries and frequent resort to anti-dumping duties by several developed countries on the manufactured products originating from the developing countries and increase (rather than cuts) in subsidies by the developed countries for their agricultural products have belied the hopes of many developing countries (including India) regarding the actual increase in market access by the developing countries in the markets of the developed countries. The Political Economy factors are unlikely to allow many countries (developed and developing) to pursue the path of trade liberalization across the board.
• In the relatively gloomy global scenario (despite recent clear pick-up in
the economic activity after overcoming the adverse economic effects of the terrorist attacks on USA of September 11, 2001, China and India are emerging as the high growth countries. However, the growth rate (and growth of exports) in the Indian economy has slowed down during the last three years. The much hoped for strong economic recovery by India is yet to fructify.
• The environment for the flows of Foreign Investment both of Foreign
Direct Investment (FDI) and more so of the Foreign Portfolio Investment Variety in post-1997 (post Southeast Asian Crisis) period has been relatively volatile and full of uncertainties. While China has been
3 See World Bank’s Report: Global Economic Prospects and the Developing Countries 1998/99.
6
solid gainer in attracting much larger inflows of FDI, other Asian countries (including India) have not reaped adequate dividends from the slowing down of FDI inflows into some of the most affected countries of Southeast Asia from the 1997-98 economic and financial crisis.
• Energy Security is becoming an urgent policy imperative for most Asian
Countries (including India) which are highly dependent on oil supplies from the middle east Asia and the Gulf countries. The importance of tapping vast energy (including gas) reserves of the countries based around the Caspian Sea will generate competitive pressures among several developed and developing countries. The uncertainty regarding international oil prices would grow if USA after is anti-terrorist attacks on Afghanistan decides to again attack Iraq.
III
Highlights of the World Scan Model for Global Projections
Amongst many economic and econometric models available in the literature
projecting behaviour of the world economy and regions in the next ten to twenty
years (i.e. by 2010 and 2020), we have preferred the World Scan Model (referred to
earlier) formulated by the CPB Netherlands Bureau of Economic Policy Analysis.
This model appears to be most relevant for the policy makers in the developing
countries (like India) since it emphasizes that the rate of economic growth in the
developing countries can be definitely accelerated by intensifying capital
accumulation; technological progress; skill formation among labour abundant
economies; and reallocation of labour from less skilled to higher skilled and higher
value added economic activities raising real wages of more skilled labour in a
sustainable manner. Due to these features of substantial relevance to the developing
countries like India, we believe that the World Scan Model provides more realistic
projections of world-wide economic growth and its sectoral composition among
agricultural sector; industrial sector; and the services sector as well as of world trade
in goods and services originating from specified regions and specified developed and
developing economies.
7
We highlight here the main characterists of the World Scan Model which forms the
basis of our vision of the global economy and world trade and provides an analytical
framework for our policy recommendations modified by us, where necessary, to suit
Indian conditions.4
At the heart of the World Scan Model lie the modern version of the neo-classical
theories of economic growth and international trade. The main characteristics of this
techno-economic model can be summarized as follows:
(i) An ‘Armington trade specification’5 allowing market power to determine trade
patterns in the medium run, while allowing Hecksher-Ohlin mechanisms in the
long run for explaining the pattern of two-way trade;
(ii) Assumption of imperfect financial capital mobility;
(iii) Consumption patterns determined by per capita income and developing
towards a universal pattern;
(iv) The existence of Lewis 6 type low-productivity sector(s) in developing regions
from which the high-productivity (higher value added) economy (sector(s))
may draw labour by offering higher real wages enabling high(er) growth in the
concerned economy for a long period;
(v) The availability of two types of labour in the economy: low skilled and high
skilled. This enables the policy makers to devote economic resources for
improving skills; knowledge; and productivity of labour (human resources) and
for capital accumulation and technological progress so that more skilled labour
4 This description of the World Scan Model, of necessity, is sketchy. For further details, see the full text of the publication : World Scan: The Core Version, op. cit. 5 P.S. Armington, “A Theory of Demand for Products distinguished by place of Production”, IMF Staff Papers, Vol. 16 (1969), pp. 159-177.
8
can be shifted to higher productivity sector(s) thus raising (real) per capita
income in the concerned economy in a sustained manner. This view appears to
fit Indian conditions well.
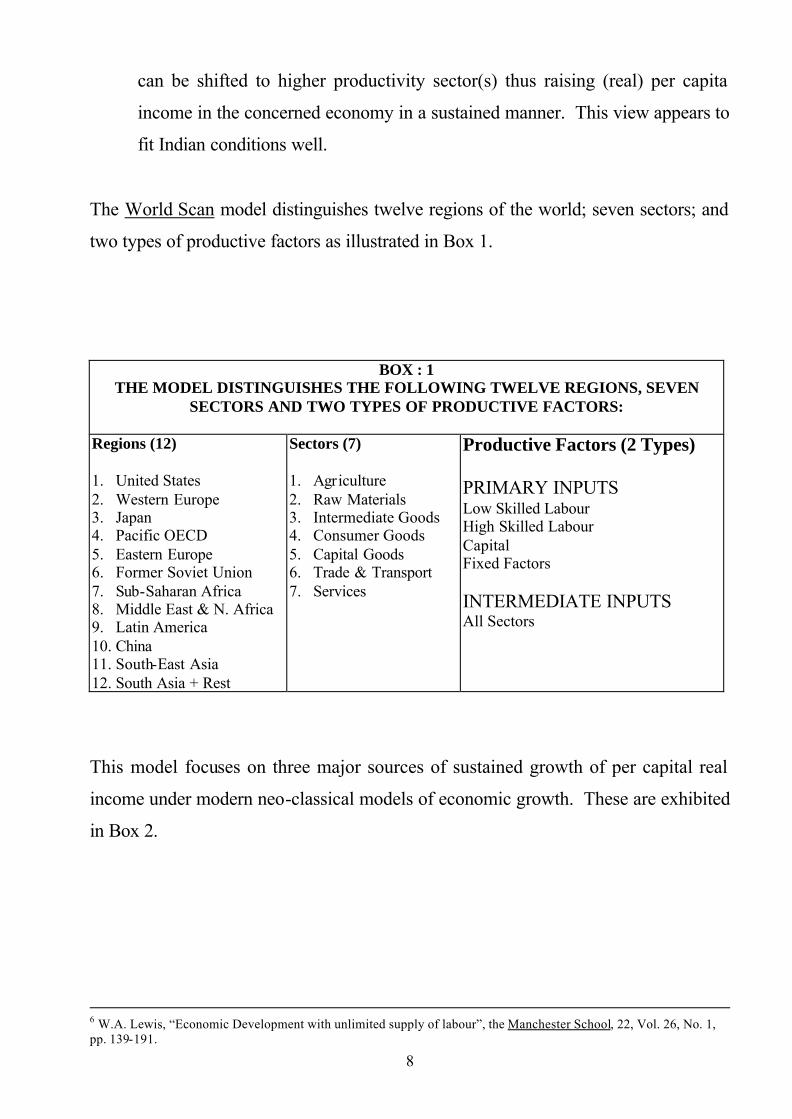
The World Scan model distinguishes twelve regions of the world; seven sectors; and
two types of productive factors as illustrated in Box 1.
BOX : 1 THE MODEL DISTINGUISHES THE FOLLOWING TWELVE REGIONS, SEVEN
SECTORS AND TWO TYPES OF PRODUCTIVE FACTORS:
Regions (12) 1. United States 2. Western Europe 3. Japan 4. Pacific OECD 5. Eastern Europe 6. Former Soviet Union 7. Sub-Saharan Africa 8. Middle East & N. Africa 9. Latin America 10. China 11. South-East Asia 12. South Asia + Rest
Sectors (7) 1. Agriculture 2. Raw Materials 3. Intermediate Goods 4. Consumer Goods 5. Capital Goods 6. Trade & Transport 7. Services
Productive Factors (2 Types) PRIMARY INPUTS Low Skilled Labour High Skilled Labour Capital Fixed Factors INTERMEDIATE INPUTS All Sectors
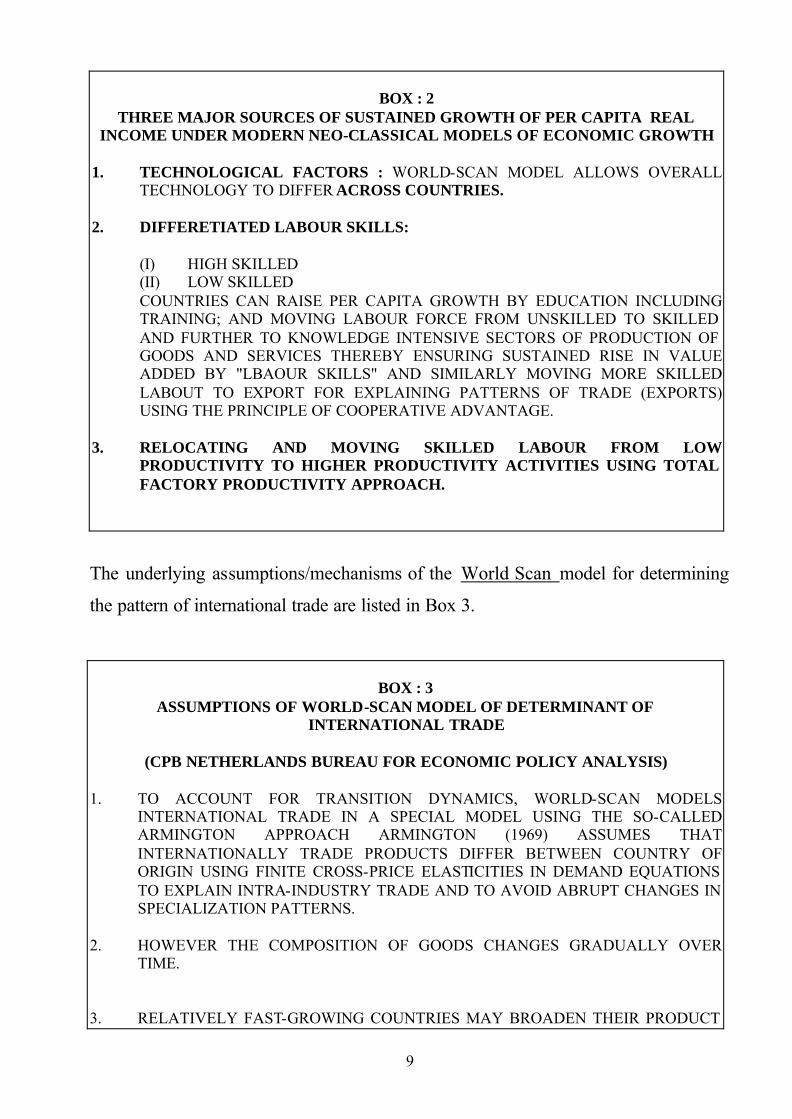
This model focuses on three major sources of sustained growth of per capital real
income under modern neo-classical models of economic growth. These are exhibited
in Box 2.
6 W.A. Lewis, “Economic Development with unlimited supply of labour”, the Manchester School, 22, Vol. 26, No. 1, pp. 139-191.
9
BOX : 2
THREE MAJOR SOURCES OF SUSTAINED GROWTH OF PER CAPITA REAL INCOME UNDER MODERN NEO-CLASSICAL MODELS OF ECONOMIC GROWTH
1. TECHNOLOGICAL FACTORS : WORLD-SCAN MODEL ALLOWS OVERALL
TECHNOLOGY TO DIFFER ACROSS COUNTRIES. 2. DIFFERETIATED LABOUR SKILLS: (I) HIGH SKILLED (II) LOW SKILLED
COUNTRIES CAN RAISE PER CAPITA GROWTH BY EDUCATION INCLUDING TRAINING; AND MOVING LABOUR FORCE FROM UNSKILLED TO SKILLED AND FURTHER TO KNOWLEDGE INTENSIVE SECTORS OF PRODUCTION OF GOODS AND SERVICES THEREBY ENSURING SUSTAINED RISE IN VALUE ADDED BY "LBAOUR SKILLS" AND SIMILARLY MOVING MORE SKILLED LABOUT TO EXPORT FOR EXPLAINING PATTERNS OF TRADE (EXPORTS) USING THE PRINCIPLE OF COOPERATIVE ADVANTAGE.
3. RELOCATING AND MOVING SKILLED LABOUR FROM LOW
PRODUCTIVITY TO HIGHER PRODUCTIVITY ACTIVITIES USING TOTAL FACTORY PRODUCTIVITY APPROACH.
The underlying assumptions/mechanisms of the World Scan model for determining
the pattern of international trade are listed in Box 3.
BOX : 3
ASSUMPTIONS OF WORLD-SCAN MODEL OF DETERMINANT OF INTERNATIONAL TRADE
(CPB NETHERLANDS BUREAU FOR ECONOMIC POLICY ANALYSIS)
1. TO ACCOUNT FOR TRANSITION DYNAMICS, WORLD-SCAN MODELS
INTERNATIONAL TRADE IN A SPECIAL MODEL USING THE SO-CALLED ARMINGTON APPROACH ARMINGTON (1969) ASSUMES THAT INTERNATIONALLY TRADE PRODUCTS DIFFER BETWEEN COUNTRY OF ORIGIN USING FINITE CROSS-PRICE ELASTICITIES IN DEMAND EQUATIONS TO EXPLAIN INTRA-INDUSTRY TRADE AND TO AVOID ABRUPT CHANGES IN SPECIALIZATION PATTERNS.
2. HOWEVER THE COMPOSITION OF GOODS CHANGES GRADUALLY OVER
TIME. 3. RELATIVELY FAST-GROWING COUNTRIES MAY BROADEN THEIR PRODUCT

10
MIX WHILE CONQUERING WORLD MARKETS WITHOUT BEING FORCED TO LOWER THE RELATIVE PRICE OF THEIR PRODUCTS (QUALITY; BRANDING; CREDIT LINES; ETC.).
4. COUNTRIES CAN GAIN MARKET SHARE BY TEMPORARILY OFFERING THEIR
PRODUCTS AT LOWER PRICE THAN COMPETITORS. ONCE THE MARKET SHARE ARE CONQUERED, BRAND LOYALTY FOR THE NEW PRODUCTS IS ESTABLISHED GRADUALLY, AND PRICES CAN RETTURN TO THE LEVEL OF COMPETITORS PRICES.
5. THIS GIVES THE MODEL HECKSCHER-OHLIN LIKE LONG-TERM PROPERTIES.
The Political Economy framework underlying the World Scan model’s
characterization of the ongoing globalization scenario is stated in Box 4.
BOX : 4
WORLD-SCAN MODEL'S CHARACTERISATION OF GLOBALIZATION SCENARIO
1 ECONOMY HIGH ECONOMIC GROWTH RATES
2 POLITICS INCREASING MARKET-ORIENTED POLICIES TRADE LIBERALIZATION
3 TECHNOLOGY STRONG TECHNOLOGICAL DEVELOPMENT CONVERGENCE OF THE NON-OECD
4 LABOUR MORE EDUCATION REALLOCATION FROM LOW-PRODUCTIVITY SECTORS IN THE NON-OECD
5 CONSUMER PREFERENCES
CONVERGENCE OF CONSUMER PATTERNS
The World Scan model’s projections of differences of in the values of the selected
macro-economic variables in the year 2020 (compared to the situation prevailing in
the year 1995) for the world’s 12 specified regions are presented in Box 5. Clearly,
the developing Asian countries are seen to be dynamic economies and today’s
developed OECD countries the declining power centers for economic growth by the
year 2020.

11
BOX : 5
WORLD-SCAN MODEL'S PROJECTIONS OF DIFFERENCES OF MACROECONOMIC VARIABLES IN 2020 COMPARED TO 1995*
INVES -
TMENT RATIO
SAVINGS RATIO
SHARE OF WORLD
GDP
CONS. SHARE
SERVICES
INFORMAL SECTOR
RELATIVE WAGE RATIO
GDP CAPITA
UNITED STATES
-1.7 -1.8 -4.8 0.0 0.0 -0.3 2.0
JAPAN
-5.5 -6.0 -4.2 2.6 0.0 -3.8 2.5
WESTERN EUROPE
-2.7 -5.3 -6.7 4.0 0.0 -2.2 2.6
PACIFIC OECD
-2.1 -5.0 -0.8 -1.1 0.0 -0.5 1.4
EASTERN EUROPE
-0.9 2.1 0.3 27.4 0.0 -10.6 4.9
FORMER SOVIET UNION
-0.9 -3.5 1.0 5.5 0.0 -3.0 5.4
MIDDLE EAST AND N.A.
-2.7 -1.0 1.8 13.0 -15.0 14.2 4.0
SUB-SAHARAN AFRICA
-2.4 -4.5 0.5 15.8 -10.1 8.4 2.7
LATIN AMERICA
-3.6 -4.2 2.3 15.2 -15.3 16.7 4.1
CHINA
1.0 4.3 4.1 27.8 -28.2 -60.1 7.5
SOUTH -EAST ASIA
-2.2 1.5 4.7 16.4 -22.3 19.4 5.9
SOUTH ASIA & REST (INCLUDING INDIA)
1.4 5.0 1.7 29.8 -20.5 -14.3 5.5
* All variables are ratios, except GDP per capita (measured at reference point as average growth from 1995 to 2000).
The summary view of the World Scan model’s projections of the relative contribution
of five specified sources of economic growth (real GDP) in each of the world’s 12
specified regions for the period from 1995 to 2020 can be seen from Box 6.

12
BOX : 6
WORLD-SCAN MODEL'S PROJECTIONS OF SOURCES OF ECONOMIC GROWTH FROM 1995 TO 2020
Country Western Europe
United States
Japan Pacific OECD
Eastern Europe
Former Soviet Union
Employment High-Skilled 0.0 0.3 -0.1 0.3 0.0 0.1
Employment Low-Skilled 0.0 0.1 -0.1 0.1 0.0 0.1
Labour Reallocation 0.0 0.0 0.0 0.0 0.0 0.0
Capital Accumulation 1.1 1.2 1.0 1.1 2.0 2.3
Total Factor Productivity 1.6 1.2 1.5 0.9 3.0 3.0
Gross Domestic Product 2.6 2.8 2.4 2.4 4.9 5.6
Country Middle East & N.A.
Sub-Saharan Africa
Latin America
China South- East Asia
South Asia & Rest
Employment High-Skilled 1.7 1.9 1.3 0.5 1.3 1.1
Employment Low-Skilled 0.5 0.7 0.2 0.1 0.1 0.4
Labour Reallocation 0.2 0.2 0.2 0.8 0.3 0.6
Capital Accumulation 2.5 2.2 2.3 3.2 2.8 2.7
Total Factor Productivity 1.0 0.3 1.4 3.5 2.3 2.0
Gross Domestic Product
5.9 5.4 5.4 8.0 7.0 6.8
IV
Trends and Projections for Global Trade and India’s Exports and Imports
In this section, we survey the trends for global trade (exports and imports) for three
decades (1970-79; 1980-89; and 1990-1999). We have selected 30 trading nations of
the world for this study. These include 17 developed countries and 13 developing
countries listed in Section I. These 17 developed countries had accounted for around
60.0 percent of global trade turnover for the year 2000. Together these 13
developing countries had accounted for around 15.0 percent share in global trade in
the year 2000. Altogether, the 30 countries included in our study had accounted for
around 75.0 percent share of global trade turnover in the year 2000.
Our projections of world trade and selected 30 countries are based upon the decadal
annual trend rates of growth of trade in volume (real) terms. We have computed the
decadal trend rates of growth of rates of exports and imports in volume terms for the
13
world and selected countries for three decades specified earlier. 7 We explain below
the methodology adopted by us for making projections for exports and imports under
these alternative scenarios.
Methodology of Scenario Building for Projections
In projecting external trade for the thirty selected countries including India (exports
and imports of goods) upto the year 2025, we have used the baseline scenario of the
actual situation in the year 2000 and reviewed the annual average decadal growth rate
(in volume terms to the maximum extent possible) of each country’s global exports
and imports for the three decades of 1970-79; and 1980-89; and 1990-1999 which
have led to the actual scenario in the year 2000 as already known to us. We have
constructed three scenarios for the period 2000 to 2025. These include (i) Optimistic
scenario; (ii) pessimistic scenario; and (iii) realistic scenario.
For simplifying projections, we have extrapolated the growth of each country’s
exports and imports during the period 2000 to 2025 by using an average trend growth
rate of exports (or imports as the case may be) relevant to the assumptions made
(weightages given) in the optimistic; the pessimistic; and the realistic scenario.
We have separately calculated average annual decadal trend rate of growth of exports
and imports for each of the three decades mentioned above (namely: 1970-79; 1980-
89; and 1990-1999). For projecting optimistic scenario, we have uniformly selected
the highest average annual trend growth rate among the three decades of our study
period. Conversely, for building the pessimistic scenario for our projections, we have
uniformly used the lowest average annual growth rate of our three decades. For
projecting realistic scenario, we have attached equal weights of 0.33, 0.33 and 0.33
for each of the three decades.
7 We have been constrained in the choice of the 30 countries by the availability of data which could provide us the readily available or calculable rates of growth of exports and imports in volume terms. We have excluded all countries for which it was not possible to calculate growth in trade in volume terms.
14
It may be mentioned here that most studies available today in the literature converge
on the fact that most of the growth of output and trade in the world will come from
emerging developing country markets (including the Newly Industrialising countries
of Asia despite South East Asian crisis of 1997-98) and not from the mature
developed countries of the world.8
Projections for Global Exports and Imports and Market Shares of Our Selected
30 Countries: 2002 to 2025
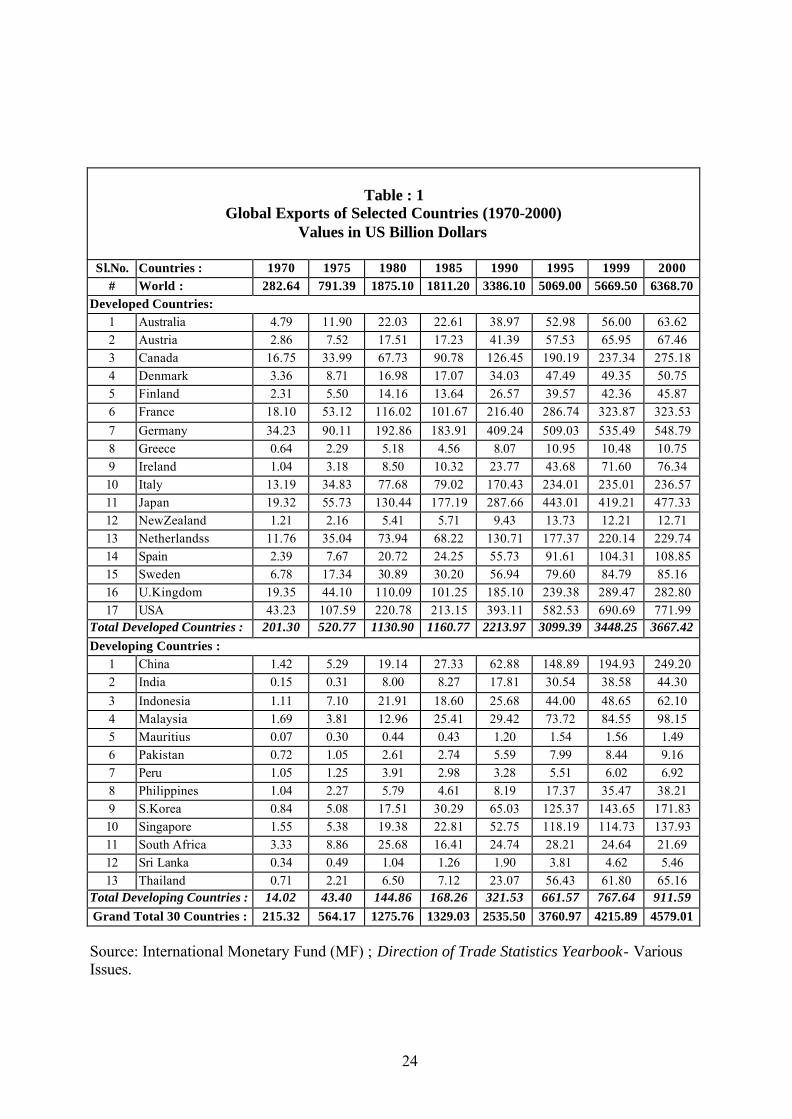
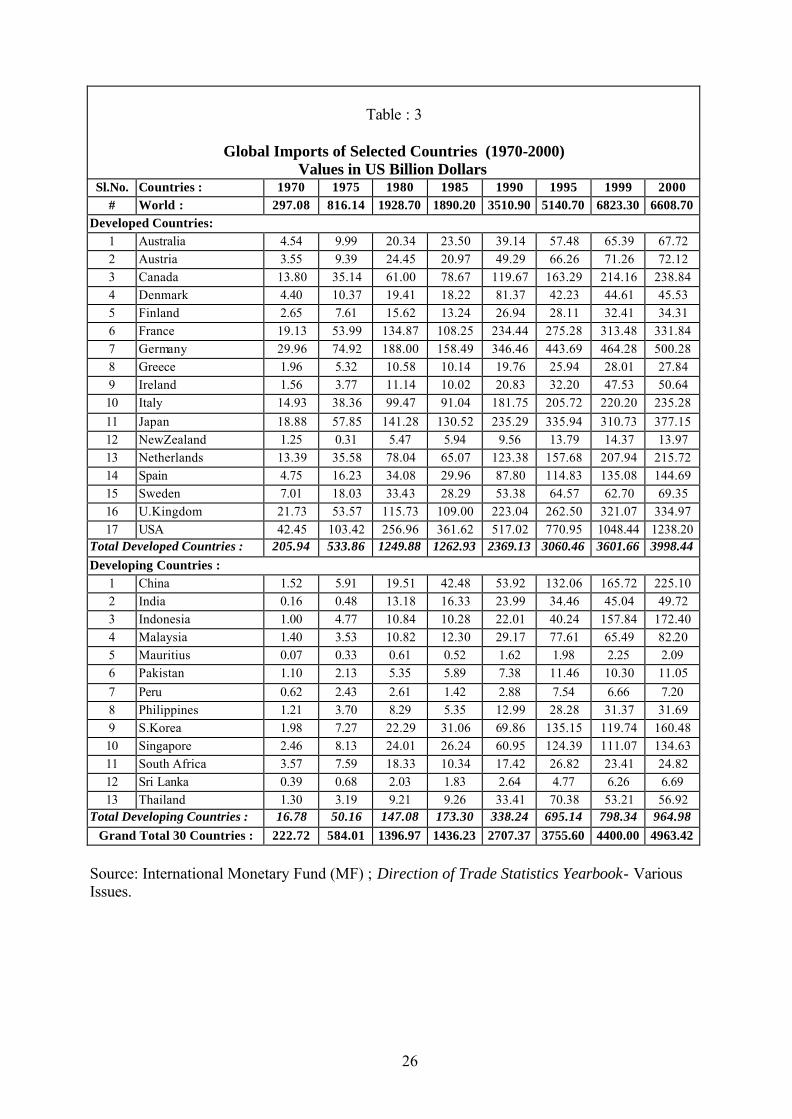
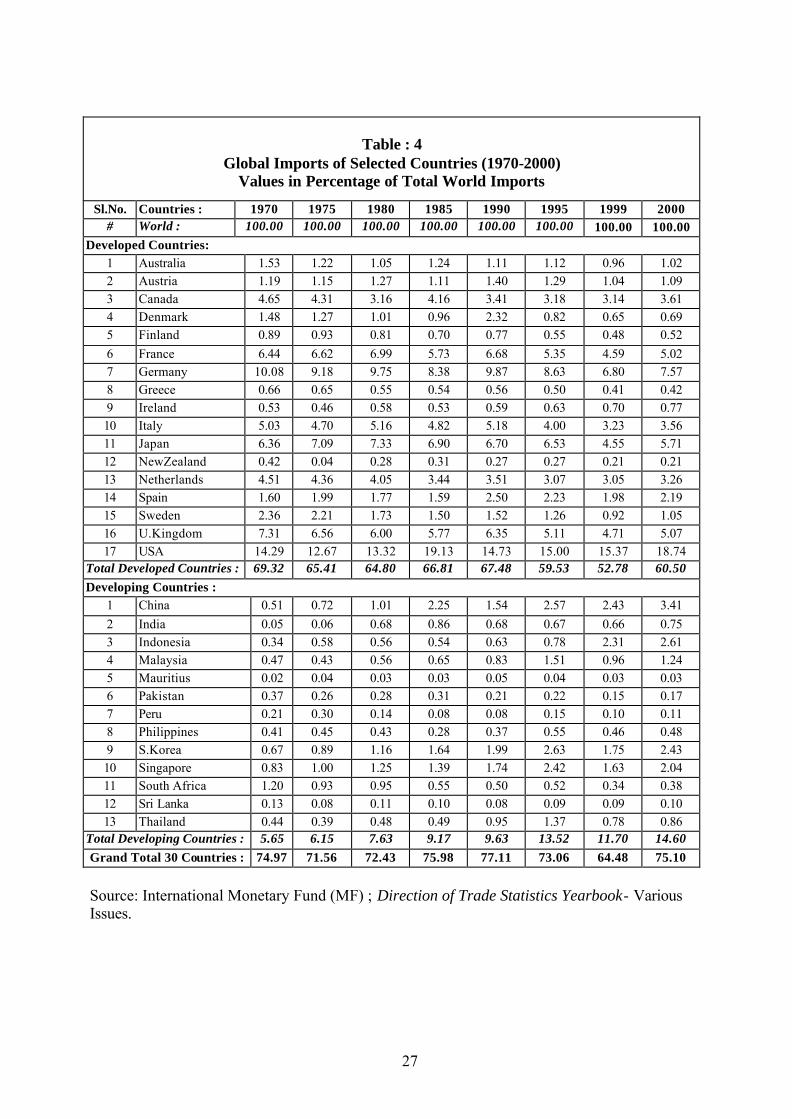
The trends in the actual global exports and imports (in US$ billion) for the world
(including India) during the period 1970 to 2000 can be reviewed with the help of
Tables 1 to 4. Our projections for global exports and imports and for 30 selected
countries (including India appearing under Serial No. 2 in the group of Developing
Countries) in US$ million (in real terms) for the period 2000-2025 under three
alternative scenarios are presented in Tables 5 to 16. These tables are self-
explanatory. However, some of the findings from the selected Tables are highlighted
below:
Table 2 shows the declining trend in the share of our 17 selected developed countries
in world exports (down from 71.2 percent in 1970 to 57.6 percent in the year 2000).
In contrast, the 13 developing countries including India (notably China, Singapore
and Malaysia) have experienced steeply rising trend in their market share of global
exports collectively rising from 5.0 percent in 1970 to 14.3 percent in 2000.
Roughly similar (though a little less dramatic) picture appears from the trends and
respective market shares for imports of selected 17 developed and 13 developing
countries (Table 4).
8 See the example, Jeffrey E. Garten, The Big Ten: The Big Emerging Markets and How They will change our Lives, New York: Basic Books, 1997.
15
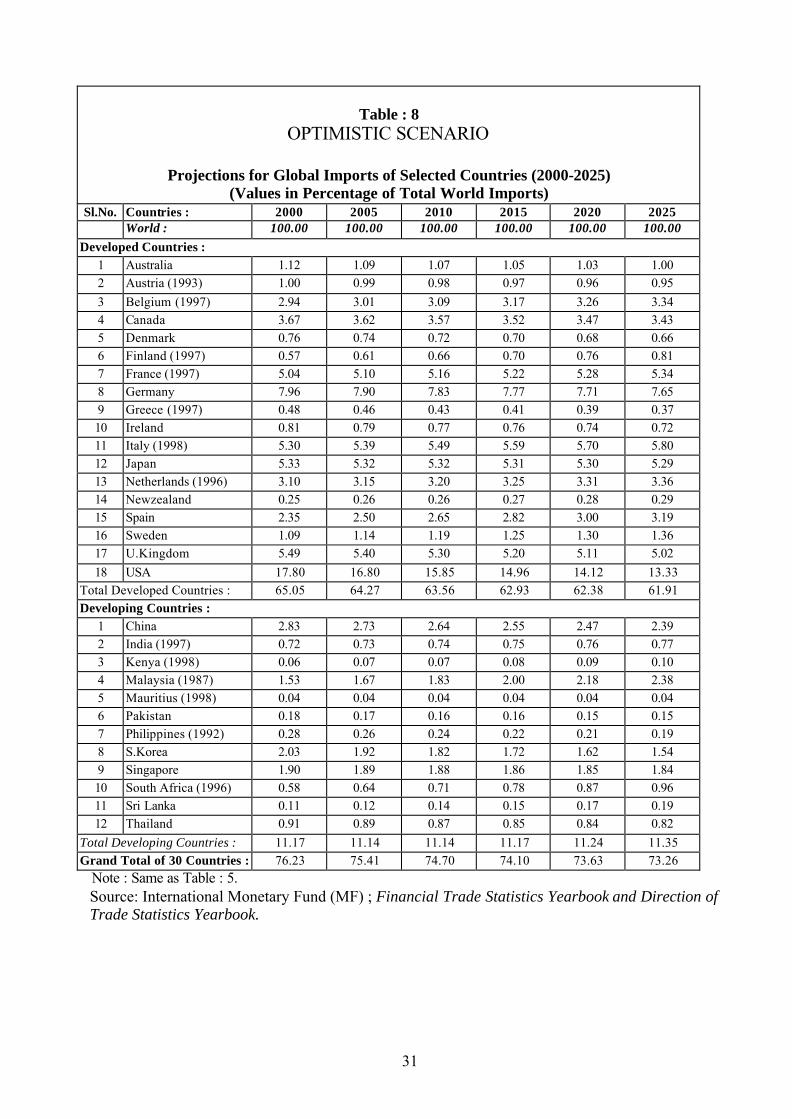
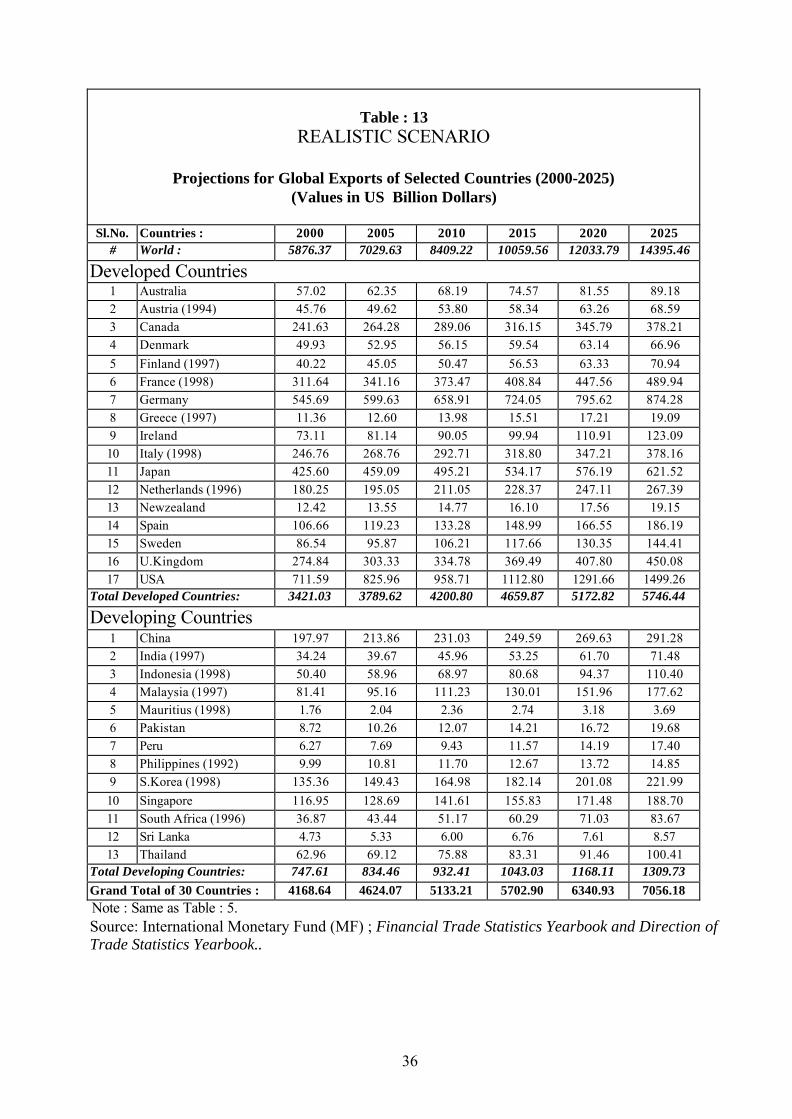
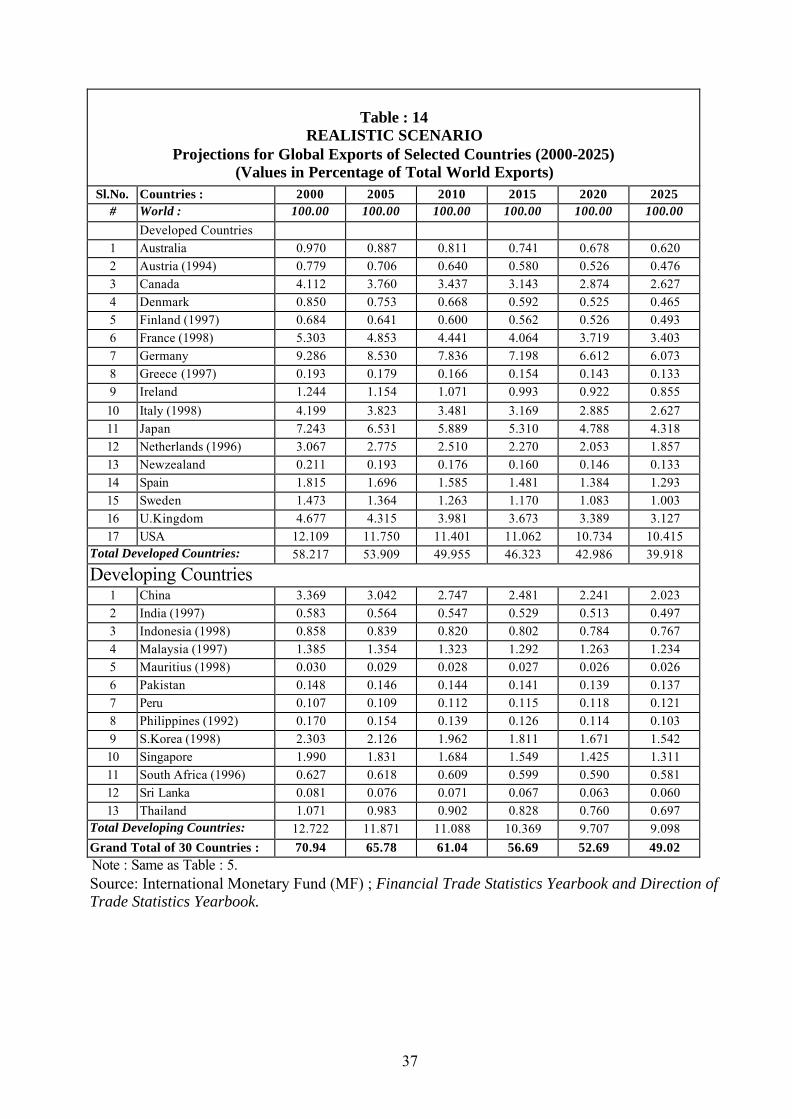
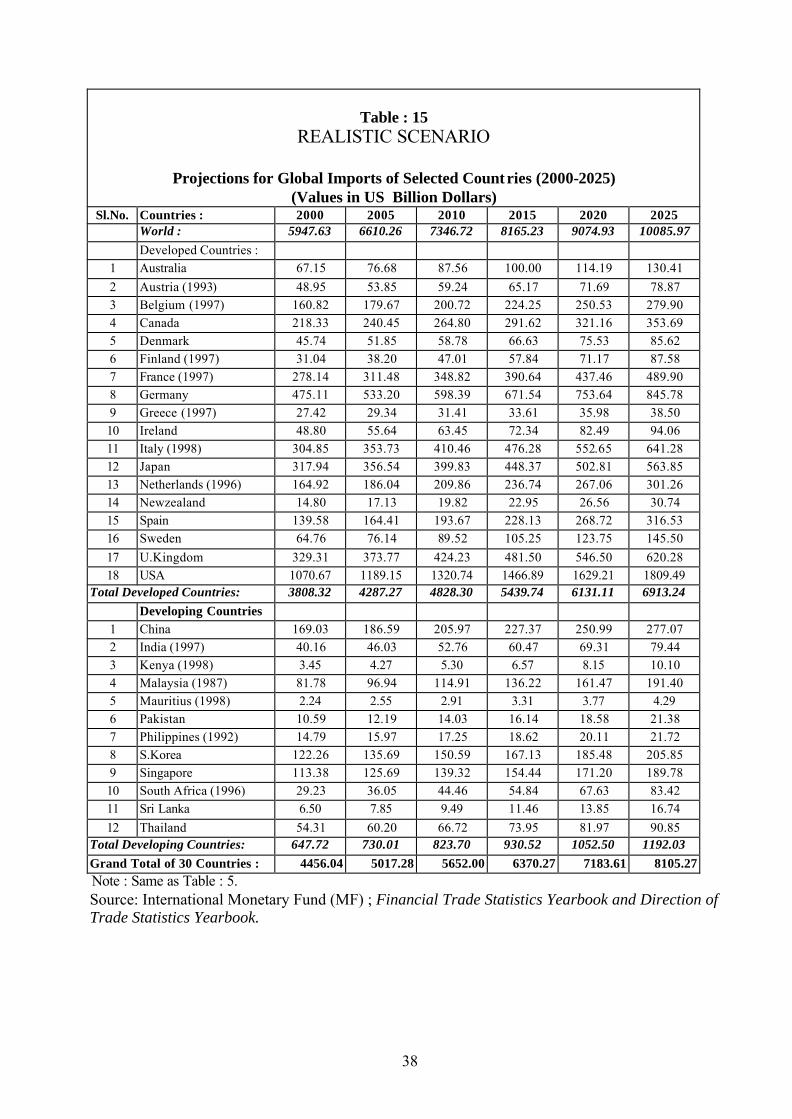
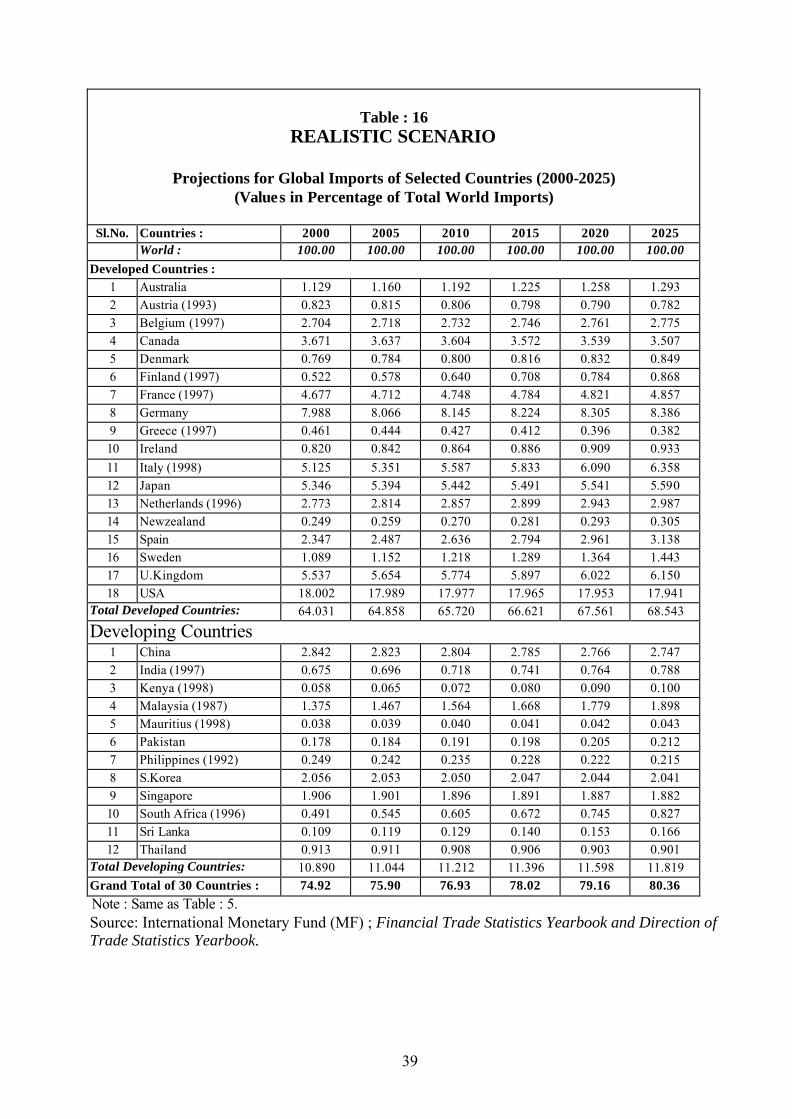
The projections for the realistic scenario for global exports and imports and relative
market shares for our 30 selected countries (including India) for the period 2000 to
2025 are presented in Tables 13 to 16. All countries covered in our study show
declining market shares in world exports throughout 2000-2025 period (although
marginally lesser for most developing countries). However, the opposite
generally/upward trend in market shares in global imports can be witnessed from the
side of imports for our selected 30 countries (including India). Thus, both the group
of selected 17 developed countries (to a larger extent) and the group of selected
developing countries (to a smaller extent) would become markets for larger imports
from rest of the world. Global trade liberalization would seem to lead to this
important conclusion if our projection turn out to be valid over time.
V
Trends in the Commodity Composition of India’s Trade and Projections
We now focus on the trends for India’s Commodity Composition of trade separately
for exports and imports for the principal commodities for the period 1993-94 to 1999-
2000 and for projecting their growth during the years 2000-2001 to 2025-2026.
Trends in India’s Commodity Exports
Tables 17 and 18 present the trends in India’s exports of major commodities for the
years 1993-94 to 1999-2000 based on Indian official statistics. Table 18 shows that
during the year 1999-2000 (the latest year for which data is available), the following
commodities constituted India’s principal exports (with their percentage share in
India’s global exports in parenthesis): (i) Gems and Jewellary (20.3 percent); (ii)
Agricultural and allied products (14.09 percent); (iii) Engineering goods (13.6
percent); (iv) Textiles (excluding garments) (13.4 percents); (v) Readymade garments
(11.0 percent); (vi) Chemicals and allied products (9.0 percent); (vii) Leather and
leather manufacturers (4.1 percent); and (viii) Marine products (3.1 percent).
16
Projections
Tables 19 and 20 provide projections for growth of exports of the same principal
commodities (as covered in Tables 17 and 18) for the period 2000-2001 to 2025-
2026. The picture which emerges these calculations show noticeable rise in 2025-
2026 in the share of the following export commodities (i) Gems and Jewellery (37.6
percent); (ii) Agricultural and allied products (21.9 percent); (iii) Engineering goods
(15.3 percent); (iv) Chemicals etc. (9.1 percent); (v) Leather and leather
manufacturers (6.34 percent); (vi) Drugs and pharmaceuticals (4.4 percent); and (vii)
Marine products (3.8 percent). These projections in India’s exports seem to be in line
with the emerging picture of India’s likely international competitiveness in
marchandise exports under the new regime of the World Trade Organisation.
A serious omission in our analysis and projections of India’s current exports and
projection is the export of services especially skill-intensive services like the
software. It is estimated that India’s share in global software exports will go up from
present less than 1.0 percent to over 15.0 percent by the year 2025. From a survey of
literature (not cited here) and from our field level experience, the exports of
following other services (besides software) hold high potential for India’s export
earnings during the period 2000-2001 to 2025-2026:-
(i) Tourism;
(ii) Information Technology Services in broad spectrum;
(iii) Management of Consultancy Services;
(iv) Yoga and Stress Management education/practices;
(v) Advising/Managerial Contracting for Turn Around of sick industries;
(vi) Export of low to mediam skilled manpower;
(vii) Export of high skilled and scientific, technical, medical, educational, cultural
and managerial manpower.
17
Trends in India’s Commodity Imports
Tables 21 and 22 present comparable picture for India’s actual imports by principal
commodities for the period 1993-94 to 1999-2000. As table 20 shows, the following
commodities (with percentage share in India’s total imports in the year 1999-2000)
constituted principal imports of India: (i) Petroleum, crude and products (22.2
percent); (ii) Capital Goods (12.3 percent); (iii) Pearls (precious) and semi-precious
stones for exports of gem and jewellery (11.4 percent); (iv) Gold and Silver (9.3
percent); (v) Non-electrical machinery (5.9 percent); (vi) Electrical goods (5.6
percent); and (vii) Food and related items (edible oil etc.) (5.1 percent).
Projections for India’s Commodity Imports:
Tables 23 and 24 present the projections for India’s imports by principal commodities
for the period 2000-2001 to 2025-2026. The presentation in percentage from (Table
24) is easier to comprehend. Table 24 clearly brings out the dramatic increase in
energy insecurity through a very substantive increase in import dependence of India
on petroleum, crude and products rising from 22.2 percent of India’s global imports
to 36.9 percent in the year 2025-2026. India seriously needs to formulate a more
comprehensive enrgy security policy including diversifying its imports of gas through
pipelines from Russia and from the Central Asian Republics around the Caspian sea
and from the neighbouring Bangladesh and Myanmar and investing in the security of
sea lanes for carrying petroleum and products and ensuring safety of gas pipelines
over land and under sea.
Among other major imports items (not related to processing for exports) showing
very significant growth in their share of India’s total imports during the period 2000-
2001 to 2025-2026 are the following: (i) Capital goods (up from 12.3 percent in
1999-2000 to 26.1 percent in the year 2025-26); (ii) Gold and silver (up to 12.9
18
percent in 2025-2026); and (iii) Non-electrical machinery from 5.9 percent to 10.3
percent.
India has to formulate polic ies for efficient import substitution for optimizing the
outgo of its hard earned foreign exchange for the horizon upto the year 2025-2026.
This is especially relevant if India is aiming to sustain growth rate of its national
output at the rate of 7 to 8 percent per annum for the next 25 years as initially the
import intensity of its production and exports of products and selected services (such
as most modern financial services) is most likely to rise.
VI
Trends and Projections in India’s Direction of Trade
In this section, we present trends in India’s direction of trade (exports and imports
separately) by major country destinations and by major regional trading
blocs/organizations of relevance to India (based on the intensity of its trade relations
with them).9 The trends are based on the actual value of exports and imports (in US$
billion) for the period 1980 to 1997 for which data for all member countries of our
selected regional trading blocs/organizations is available. We have also projected the
direction of India’s exports and imports for the period 2000 to 2025 in US dollar
terms on the basis of the average annual trend rate of growth (and termed this as
realistic scenario) for the period 1980 to 1997. The trends during 1980 to 1997 and
the projections for the period 2000 to 2025 relating to the direction of India’s trade by
major regional trading blocs/organizations and their member countries are presented
in Tables 25 to 32. Once again, as in the case of commodity-wise projections
presented in Section IV, our projections on the direction of India’s trade termed
“realistic scenario” are based on the annual trend rate of growth of relevant exports in
US$ terms for the period 1980 to 1997.
9 My previous attempt at projecting India’s direction of trade with various regional trading blocs/organizations is presented in Charan D. Wadhva, et.al. “India-2014” in V A Pai Panandiker (ed.), Fifty Years of Swaraj : Highlits and Shadows, New Delh: Konark Publishers Pvt. Ltd. 1998, Ch. 13.
19
It can be seen from the summary Tables 25 and 26 that as far as trends in India’s
exports are concerned, the ranking of selected regional trading blocs (with
overlapping membership of our selected countries) represented in alphabetical order
of their share in India’s global exports in the year 1997 was as follows: (i) Asia
Pacific Economic Cooperation (APEC-21) forum with 21 member countries (48.0
percent); (ii) ASEAN-10 (6.8 percent); (iii) Bangladesh-India-Myanmar-Sri Lanka-
Thailand Economic Cooperation forum (BIMSTEC-4) with 4 member countries (4.5
percent); (iv) The European Union (EU-15) currently with 15 member countries (24.7
percent); (v) Gulf Cooperation Council (GCC-6) with 6 member countries (7.1
percent); (vi) the nascent Indian Ocean Rim Association for Regional Cooperation
(IOR-ARC-18) currently with 18 member countries (18.9 percent); (vii) North
American Tree Trade Area (NAFTA-3) with three member countries (20.3 percent);
and (viii) South Asian Association for Regional Cooperation (SAARC) with 7
member countries (4.1 percent).
The detailed projections (2000-2025) on “realistic” basis for India’s direction of
exports with each regional trading bloc (or organization) selected by us are provided
in summary form at bloc level in Tables 25 and 26 and in disaggregated form for
each member country of each selected bloc/organization in Tables 29 and 30. It can
be seen from these tables that except for the ranking IOR-ARC-18 overtaking the
rank of the NAFTA-3 in 2025, the relative importance of each of our selected
regional trading blocs/organizations in India’s global exports by and large remains
the same as in the year 1997.
Similar statistics and comparable projections (based on similar methodology) for the
relative importance of each of our selected regional trading blocs/organizations in
India’s global imports for periods 1980-1997 and projections for the period 2000 to
2025 are presented in Tables 27, 28, 31 and 32. The reader can refer to the concerned
country source of imports for more disaggregated picture in these tables.
20
A look at Table 27 brings out the relative contribution of each selected regional
trading bloc/organization in India’s actual global imports in 1997 as follows : (i)
APEC-21 (58.9 percent); (ii) EU-15 (26.0 percent); (iii) IOR-ARC-18 (19.8 percent);
(iv) GCC-6 (19.7 percent); (v) NAFTA-3 (10.0 percent); (vi) ASEAN-10 (7.0
percent); (vii) BIMSTEC-4 (1.3 percent); and (viii) SAARC-6 excluding India (0.5
percent).
The projections presented in the Summary Tables 28 bring out the following ranking
(in descending order) of regional blocs as the source of Indian imports in its global
imports in the year 2025 : (i) APEC-21 (57.1 percent); (ii) GCC-6 (36.3 percent again
reflecting very significant rise in India’s import bill for petroleum and gas causing
growing concerns regarding India’s energy security in future); IOR-ARC-18 (33.9
percent).
VII
Formulation of Strategic Trade Policy for India upto 2025
To conclude, the projections presented above under realistic scenario for India’s
merchandise exports and imports upto the year 2025 based on our performance
during the last thirty years (1970-1999) leading at most to 1.0 percent share in global
trade turnover do not inspire sufficient confidence for India to emerge as significant
player in global trade. As pointed out earlier, the picture would be significantly
altered if we were to include trade in services (especially India’s dynamic exports of
selected services such as Information Technology related services). Even so, the
projected growth of India’s exports of goods and services by the year 2025 would not
come about automatically. Nor can the envisioned growth of India’s exports be
sustained at high growth level without designing and efficiently implementing
necessary strategic policy measures and simultaneously and continuously taking
necessary corrective measures to reorient our policies to meet the challenges posed
by the evolving WTO-order in the twenty first century.

21
India also needs to formulate a strategic policy framework for continuously ensuring
efficient import substitution ultimately leading to efficient export promotion in niche
products and services and niche markets among the regional trading
blocs/organizations of greater relevance to India. Thus, India needs to formulate and
to effectively implement a holistic natural strategic policy to ensure that India
emerges as a significant trading nation in the world accounting for a market share in
the world trade by 2025 not too much below China’s share in world trade. The
holistic policy must also reconcile growth of India’s trade with the country’s
sustainable ecological environment-friendly development.
We list below the major elements which could constitute critical elements of India’s
long term strategic trade policy focused on generation of continuing surpluses on the
balance of trade/current account through the simultaneous pursuit of an efficient
export promotion policy as well as an efficient import substitution policy.
(i) India should, like China, plan to maintain a high enough rate of growth of
India’s national income in real terms (in the not infeasible range of 7 percent to
8 percent annual growth rate) and to simultaneously achieve stabilization of its
population latest by the year 2025. The Tenth Five Year Plan of India (2002-
2007) has incorporated the goal of achieving 8 percent annual growth rate.
This is also not going to be achieved automatically given the growth
performance of the Indian economy during the last four years (1997-2000).
Sustaining India’s growth rate in the range of 7 to 8 percent level will require a
special push for raising Total Factor Productivity (TFP) especially of labour.
An aggressive drive at enhancing TFP will help to achieve a cutting edge in
international competitiveness for India’s carefully selected niche products and
services and the niche markets. It can be seen from the contents of this chapter
that India’s niche markets are mostly located in the Asian region (including
Central Asian Republics and the Middle East). An aggressive and refurbished
22
“Look East” trade policy will enable India to actually achieve its realistic
positioning in the competitive and dynamic world economy.
(ii) India would do well to pursue sound economic policies and policies based on
people-oriented governance provided these are backed by adequate amount of
“political will”. The experience of post-1991 economic reforms shows that
India has been overcautious and slow implementer of its harder second
generation of economic reforms. Globalization is an irreversible phenomenon
and India should caliberate its response to globalization for suiting its
particular conditions. India must continue to further open up its economy and
to further intensify its linkages with the global economy as well as the relevant
regional trading blocs/ organizations identified above. This approach will
help India to sustain higher growth of its exports in the long run compared to
pursuing policy of protectionism across the board.
(iii) The Government must create most favourable and attractive conditions for
market-based development free of bureaucratic hassels and corruption for
encouraging both domestic and foreign investment especially Foreign Direct
Investment.
(iv) The Government must also promote (at least not discourage) domestic private
savings and make every effort to improve savings from the public enterprises
at all levels.
(v) The public and the private sectors must be motivated through appropriate set of
policies to invest in ‘profitable’ infra-structural activities of both traditional
hard variety (power; roads; telecom; etc.) and soft variety (human resource and
skill development). The Government of India must seriously prepare itself for
the provision of efficient basic social services such as primary health and

23
primary education especially of the girl child. This policy approach will add to
the productivity of Indian labour.
(vi) Government (at all levels) must curb its fiscal profligacy and particularly its
revenue deficit. It must also control its large and balooning public debt (both
external and internal) to more prudent levels. Pursuit of sound macro-
economic policies will permit India to achieve sustained high growth with
relative price stability and ensure manageable balance of payments situation
without ever having the need to go to knock at the doors the International
Monetary Fund (IMF) to bail it out of potentially unmanageable balance of
payments situation. Only merit and targeted subsidies should be permitted.
(vii) India must make moves at micro level to stimulate productivity aimed at
raising both Total Factor Productivity (TFP) and at raising the productivity of
labour through appropriate training and education. This will allow labour to be
shifted from lower real wage rate areas of employment in India to sectors
providing higher real wage rates. India needs to reorient the pattern of its
exports to switch to more skill-intensive and more knowledge-intensive goods
and services of competitive international quality. Improving work culture and
adopting appropriate labour sector reforms across the board - especially for
export-oriented activities - hold the key to unleashing the productivity and
competitiveness revolutions in the Indian economy.
24
Table : 1
Global Exports of Selected Countries (1970-2000) Values in US Billion Dollars
Sl.No. Countries : 1970 1975 1980 1985 1990 1995 1999 2000
# World : 282.64 791.39 1875.10 1811.20 3386.10 5069.00 5669.50 6368.70 Developed Countries:
1 Australia 4.79 11.90 22.03 22.61 38.97 52.98 56.00 63.62 2 Austria 2.86 7.52 17.51 17.23 41.39 57.53 65.95 67.46 3 Canada 16.75 33.99 67.73 90.78 126.45 190.19 237.34 275.18 4 Denmark 3.36 8.71 16.98 17.07 34.03 47.49 49.35 50.75 5 Finland 2.31 5.50 14.16 13.64 26.57 39.57 42.36 45.87 6 France 18.10 53.12 116.02 101.67 216.40 286.74 323.87 323.53 7 Germany 34.23 90.11 192.86 183.91 409.24 509.03 535.49 548.79 8 Greece 0.64 2.29 5.18 4.56 8.07 10.95 10.48 10.75 9 Ireland 1.04 3.18 8.50 10.32 23.77 43.68 71.60 76.34 10 Italy 13.19 34.83 77.68 79.02 170.43 234.01 235.01 236.57 11 Japan 19.32 55.73 130.44 177.19 287.66 443.01 419.21 477.33 12 NewZealand 1.21 2.16 5.41 5.71 9.43 13.73 12.21 12.71 13 Netherlandss 11.76 35.04 73.94 68.22 130.71 177.37 220.14 229.74 14 Spain 2.39 7.67 20.72 24.25 55.73 91.61 104.31 108.85 15 Sweden 6.78 17.34 30.89 30.20 56.94 79.60 84.79 85.16 16 U.Kingdom 19.35 44.10 110.09 101.25 185.10 239.38 289.47 282.80 17 USA 43.23 107.59 220.78 213.15 393.11 582.53 690.69 771.99
Total Developed Countries : 201.30 520.77 1130.90 1160.77 2213.97 3099.39 3448.25 3667.42 Developing Countries :
1 China 1.42 5.29 19.14 27.33 62.88 148.89 194.93 249.20 2 India 0.15 0.31 8.00 8.27 17.81 30.54 38.58 44.30 3 Indonesia 1.11 7.10 21.91 18.60 25.68 44.00 48.65 62.10 4 Malaysia 1.69 3.81 12.96 25.41 29.42 73.72 84.55 98.15 5 Mauritius 0.07 0.30 0.44 0.43 1.20 1.54 1.56 1.49 6 Pakistan 0.72 1.05 2.61 2.74 5.59 7.99 8.44 9.16 7 Peru 1.05 1.25 3.91 2.98 3.28 5.51 6.02 6.92 8 Philippines 1.04 2.27 5.79 4.61 8.19 17.37 35.47 38.21 9 S.Korea 0.84 5.08 17.51 30.29 65.03 125.37 143.65 171.83 10 Singapore 1.55 5.38 19.38 22.81 52.75 118.19 114.73 137.93 11 South Africa 3.33 8.86 25.68 16.41 24.74 28.21 24.64 21.69 12 Sri Lanka 0.34 0.49 1.04 1.26 1.90 3.81 4.62 5.46 13 Thailand 0.71 2.21 6.50 7.12 23.07 56.43 61.80 65.16
Total Developing Countries : 14.02 43.40 144.86 168.26 321.53 661.57 767.64 911.59 Grand Total 30 Countries : 215.32 564.17 1275.76 1329.03 2535.50 3760.97 4215.89 4579.01 Source: International Monetary Fund (MF) ; Direction of Trade Statistics Yearbook- Various Issues.

25
Table : 2
Global Exports of Selected Countries (1970-2000) Values in Percentage of Total World Exports
Sl.No. Countries : 1970 1975 1980 1985 1990 1995 1999 2000 # World : 100.00 100.00 100.00 100.00 100.00 100.00 100.00 100.00
Developed Countries:
1 Australia 1.69 1.50 1.17 1.25 1.15 1.05 0.99 1.00 2 Austria 1.01 0.95 0.93 0.95 1.22 1.13 1.16 1.06 3 Canada 5.93 4.29 3.61 5.01 3.73 3.75 4.19 4.32 4 Denmark 1.19 1.10 0.91 0.94 1.00 0.94 0.87 0.80 5 Finland 0.82 0.69 0.76 0.75 0.78 0.78 0.75 0.72 6 France 6.40 6.71 6.19 5.61 6.39 5.66 5.71 5.08 7 Germany 12.11 11.39 10.29 10.15 12.09 10.04 9.45 8.62 8 Greece 0.23 0.29 0.28 0.25 0.24 0.22 0.18 0.17 9 Ireland 0.37 0.40 0.45 0.57 0.70 0.86 1.26 1.20 10 Italy 4.66 4.40 4.14 4.36 5.03 4.62 4.15 3.71 11 Japan 6.83 7.04 6.96 9.78 8.50 8.74 7.39 7.49 12 NewZealand 0.43 0.27 0.29 0.32 0.28 0.27 0.22 0.20 13 Netherlands 4.16 4.43 3.94 3.77 3.86 3.50 3.88 3.61 14 Spain 0.85 0.97 1.10 1.34 1.65 1.81 1.84 1.71 15 Sweden 2.40 2.19 1.65 1.67 1.68 1.57 1.50 1.34 16 U.Kingdom 6.85 5.57 5.87 5.59 5.47 4.72 5.11 4.44 17 USA 15.30 13.59 11.77 11.77 11.61 11.49 12.18 12.12
Total Developed Countries : 71.22 65.80 60.31 64.09 65.38 61.14 60.82 57.59 Developing Countries :
1 China 0.50 0.67 1.02 1.51 1.86 2.94 3.44 3.91 2 India 0.05 0.04 0.43 0.46 0.53 0.60 0.68 0.70 3 Indonesia 0.39 0.90 1.17 1.03 0.76 0.87 0.86 0.98 4 Malaysia 0.60 0.48 0.69 1.40 0.87 1.45 1.49 1.54 5 Mauritius 0.03 0.04 0.02 0.02 0.04 0.03 0.03 0.02 6 Pakistan 0.26 0.13 0.14 0.15 0.16 0.16 0.15 0.14 7 Peru 0.37 0.16 0.21 0.16 0.10 0.11 0.11 0.11 8 Philippines 0.37 0.29 0.31 0.25 0.24 0.34 0.63 0.60 9 S.Korea 0.30 0.64 0.93 1.67 1.92 2.47 2.53 2.70 10 Singapore 0.55 0.68 1.03 1.26 1.56 2.33 2.02 2.17 11 South Africa 1.18 1.12 1.37 0.91 0.73 0.56 0.43 0.34 12 Sri Lanka 0.12 0.06 0.06 0.07 0.06 0.08 0.08 0.09 13 Thailand 0.25 0.28 0.35 0.39 0.68 1.11 1.09 1.02
Total Developing Countries : 4.96 5.48 7.73 9.29 9.50 13.05 13.54 14.31 Grand Total 30 Countries : 76.18 71.29 68.04 73.38 74.88 74.20 74.36 71.90
Source: International Monetary Fund (MF) ; Direction of Trade Statistics Yearbook- Various Issues.
26
Table : 3
Global Imports of Selected Countries (1970-2000) Values in US Billion Dollars
Sl.No. Countries : 1970 1975 1980 1985 1990 1995 1999 2000 # World : 297.08 816.14 1928.70 1890.20 3510.90 5140.70 6823.30 6608.70
Developed Countries: 1 Australia 4.54 9.99 20.34 23.50 39.14 57.48 65.39 67.72 2 Austria 3.55 9.39 24.45 20.97 49.29 66.26 71.26 72.12 3 Canada 13.80 35.14 61.00 78.67 119.67 163.29 214.16 238.84 4 Denmark 4.40 10.37 19.41 18.22 81.37 42.23 44.61 45.53 5 Finland 2.65 7.61 15.62 13.24 26.94 28.11 32.41 34.31 6 France 19.13 53.99 134.87 108.25 234.44 275.28 313.48 331.84 7 Germany 29.96 74.92 188.00 158.49 346.46 443.69 464.28 500.28 8 Greece 1.96 5.32 10.58 10.14 19.76 25.94 28.01 27.84 9 Ireland 1.56 3.77 11.14 10.02 20.83 32.20 47.53 50.64 10 Italy 14.93 38.36 99.47 91.04 181.75 205.72 220.20 235.28 11 Japan 18.88 57.85 141.28 130.52 235.29 335.94 310.73 377.15 12 NewZealand 1.25 0.31 5.47 5.94 9.56 13.79 14.37 13.97 13 Netherlands 13.39 35.58 78.04 65.07 123.38 157.68 207.94 215.72 14 Spain 4.75 16.23 34.08 29.96 87.80 114.83 135.08 144.69 15 Sweden 7.01 18.03 33.43 28.29 53.38 64.57 62.70 69.35 16 U.Kingdom 21.73 53.57 115.73 109.00 223.04 262.50 321.07 334.97 17 USA 42.45 103.42 256.96 361.62 517.02 770.95 1048.44 1238.20
Total Developed Countries : 205.94 533.86 1249.88 1262.93 2369.13 3060.46 3601.66 3998.44 Developing Countries :
1 China 1.52 5.91 19.51 42.48 53.92 132.06 165.72 225.10 2 India 0.16 0.48 13.18 16.33 23.99 34.46 45.04 49.72 3 Indonesia 1.00 4.77 10.84 10.28 22.01 40.24 157.84 172.40 4 Malaysia 1.40 3.53 10.82 12.30 29.17 77.61 65.49 82.20 5 Mauritius 0.07 0.33 0.61 0.52 1.62 1.98 2.25 2.09 6 Pakistan 1.10 2.13 5.35 5.89 7.38 11.46 10.30 11.05 7 Peru 0.62 2.43 2.61 1.42 2.88 7.54 6.66 7.20 8 Philippines 1.21 3.70 8.29 5.35 12.99 28.28 31.37 31.69 9 S.Korea 1.98 7.27 22.29 31.06 69.86 135.15 119.74 160.48 10 Singapore 2.46 8.13 24.01 26.24 60.95 124.39 111.07 134.63 11 South Africa 3.57 7.59 18.33 10.34 17.42 26.82 23.41 24.82 12 Sri Lanka 0.39 0.68 2.03 1.83 2.64 4.77 6.26 6.69 13 Thailand 1.30 3.19 9.21 9.26 33.41 70.38 53.21 56.92
Total Developing Countries : 16.78 50.16 147.08 173.30 338.24 695.14 798.34 964.98 Grand Total 30 Countries : 222.72 584.01 1396.97 1436.23 2707.37 3755.60 4400.00 4963.42
Source: International Monetary Fund (MF) ; Direction of Trade Statistics Yearbook- Various Issues.
27
Table : 4
Global Imports of Selected Countries (1970-2000) Values in Percentage of Total World Imports
Sl.No. Countries : 1970 1975 1980 1985 1990 1995 1999 2000 # World : 100.00 100.00 100.00 100.00 100.00 100.00 100.00 100.00
Developed Countries: 1 Australia 1.53 1.22 1.05 1.24 1.11 1.12 0.96 1.02 2 Austria 1.19 1.15 1.27 1.11 1.40 1.29 1.04 1.09 3 Canada 4.65 4.31 3.16 4.16 3.41 3.18 3.14 3.61 4 Denmark 1.48 1.27 1.01 0.96 2.32 0.82 0.65 0.69 5 Finland 0.89 0.93 0.81 0.70 0.77 0.55 0.48 0.52 6 France 6.44 6.62 6.99 5.73 6.68 5.35 4.59 5.02 7 Germany 10.08 9.18 9.75 8.38 9.87 8.63 6.80 7.57 8 Greece 0.66 0.65 0.55 0.54 0.56 0.50 0.41 0.42 9 Ireland 0.53 0.46 0.58 0.53 0.59 0.63 0.70 0.77 10 Italy 5.03 4.70 5.16 4.82 5.18 4.00 3.23 3.56 11 Japan 6.36 7.09 7.33 6.90 6.70 6.53 4.55 5.71 12 NewZealand 0.42 0.04 0.28 0.31 0.27 0.27 0.21 0.21 13 Netherlands 4.51 4.36 4.05 3.44 3.51 3.07 3.05 3.26 14 Spain 1.60 1.99 1.77 1.59 2.50 2.23 1.98 2.19 15 Sweden 2.36 2.21 1.73 1.50 1.52 1.26 0.92 1.05 16 U.Kingdom 7.31 6.56 6.00 5.77 6.35 5.11 4.71 5.07 17 USA 14.29 12.67 13.32 19.13 14.73 15.00 15.37 18.74
Total Developed Countries : 69.32 65.41 64.80 66.81 67.48 59.53 52.78 60.50 Developing Countries :
1 China 0.51 0.72 1.01 2.25 1.54 2.57 2.43 3.41 2 India 0.05 0.06 0.68 0.86 0.68 0.67 0.66 0.75 3 Indonesia 0.34 0.58 0.56 0.54 0.63 0.78 2.31 2.61 4 Malaysia 0.47 0.43 0.56 0.65 0.83 1.51 0.96 1.24 5 Mauritius 0.02 0.04 0.03 0.03 0.05 0.04 0.03 0.03 6 Pakistan 0.37 0.26 0.28 0.31 0.21 0.22 0.15 0.17 7 Peru 0.21 0.30 0.14 0.08 0.08 0.15 0.10 0.11 8 Philippines 0.41 0.45 0.43 0.28 0.37 0.55 0.46 0.48 9 S.Korea 0.67 0.89 1.16 1.64 1.99 2.63 1.75 2.43 10 Singapore 0.83 1.00 1.25 1.39 1.74 2.42 1.63 2.04 11 South Africa 1.20 0.93 0.95 0.55 0.50 0.52 0.34 0.38 12 Sri Lanka 0.13 0.08 0.11 0.10 0.08 0.09 0.09 0.10 13 Thailand 0.44 0.39 0.48 0.49 0.95 1.37 0.78 0.86
Total Developing Countries : 5.65 6.15 7.63 9.17 9.63 13.52 11.70 14.60 Grand Total 30 Countries : 74.97 71.56 72.43 75.98 77.11 73.06 64.48 75.10
Source: International Monetary Fund (MF) ; Direction of Trade Statistics Yearbook- Various Issues.

28
Table : 5 OPTIMISTIC SCENARIO
Projections for Global Exports of Selected Countries (2000-2025) (Values in US Billion Dollars)
Sl.No. Countries : 2000 2005 2010 2015 2020 2025
# World : 6001.40 7976.08 10600.51 14088.48 18724.13 24885.08 Developed Countries :
1 Australia 57.21 63.63 70.77 78.71 87.55 97.37 2 Austria (1994) 51.07 56.73 63.01 69.99 77.73 86.34 3 Canada 241.99 266.63 293.79 323.71 356.68 393.00 4 Denmark 50.07 53.85 57.91 62.28 66.98 72.03 5 Finland (1997) 42.67 48.90 56.04 64.23 73.62 84.37 6 France (1998) 322.90 369.17 422.07 482.55 551.71 630.77 7 Germany 551.18 636.75 735.61 849.82 981.77 1134.19 8 Greece (1997) 12.60 15.51 19.08 23.47 28.88 35.54 9 Ireland 73.28 82.30 92.43 103.80 116.57 130.92 10 Italy (1998) 251.70 276.00 302.65 331.88 363.92 399.06 11 Japan 429.42 484.32 546.24 616.09 694.86 783.70 12 Malaysia (1997) 92.80 121.61 159.36 208.82 273.63 358.56 13 Netherlands (1996) 195.10 219.67 247.33 278.49 313.56 353.05 14 Newzealand 12.61 14.81 17.40 20.43 24.00 28.19 15 Spain 109.16 137.00 171.95 215.81 270.86 339.96 16 Sweden 88.02 106.15 128.00 154.36 186.15 224.48 17 U.Kingdom 275.77 309.55 347.47 390.03 437.81 491.44 18 USA 731.17 972.07 1292.33 1718.11 2284.17 3036.73
Total Developed Countries : 3588.71 4234.64 5023.45 5992.58 7190.44 8679.71 Developing Countries :
1 China 198.41 216.75 236.79 258.68 282.59 308.71 2 India (1997) 37.59 46.12 56.59 69.44 85.21 104.55 3 Indonesia (1998) 54.22 70.39 91.40 118.66 154.06 200.02 4 Mauritius (1998) 1.89 2.45 3.17 4.11 5.33 6.91 5 Pakistan 8.49 8.74 9.00 9.27 9.55 9.84 6 Peru 6.36 8.42 11.13 14.71 19.45 25.71 7 Philippines (1992) 11.63 12.91 14.34 15.93 17.69 19.65 8 S.Korea (1998) 139.60 158.46 179.87 204.17 231.75 263.06 9 Singapore 118.20 137.18 159.21 184.77 214.45 248.88 10 South Africa (1996) 43.54 55.84 71.61 91.83 117.77 151.03 11 Sri Lanka 4.82 5.97 7.39 9.14 11.31 14.00 12 Thailand 63.54 73.01 83.89 96.39 110.76 127.26
Total Developing Countries : 688.29 796.24 924.38 1077.11 1259.91 1479.63 Grand Total of 30 Countries : 4277.00 5030.88 5947.83 7069.70 8450.35 10159.33
Note : Years in parenthesis indicate the base year for projections. Source: International Monetary Fund (MF) ; Financial Trade Statistics Yearbook and Direction of Trade Statistics Yearbook.

29
Table 6 OPTIMISTIC SCENARIO
Projections for Global Exports of Selected Countries (2000-2025) (Values in Percentage of Total World Exports)
Sl.No. Countries : 2000 2005 2010 2015 2020 2025
# World : 100.00 100.00 100.00 100.00 100.00 100.00 Developed Countries :
1 Australia 0.71 0.61 0.53 0.46 0.39 0.34 2 Austria (1994) 0.83 0.68 0.55 0.44 0.36 0.29 3 Canada 3.25 2.75 2.33 1.98 1.67 1.42 4 Denmark 0.85 0.71 0.59 0.50 0.42 0.35 5 Finland (1997) 4.03 3.34 2.77 2.30 1.90 1.58 6 France (1998) 9.18 7.98 6.94 6.03 5.24 4.56 7 Germany 4.60 3.88 3.28 2.77 2.34 1.97 8 Greece (1997) 0.95 0.80 0.67 0.56 0.47 0.39 9 Ireland 1.22 1.03 0.87 0.74 0.62 0.53 10 Italy (1998) 0.21 0.19 0.16 0.15 0.13 0.11 11 Japan 1.47 1.33 1.21 1.10 0.99 0.90 12 Malaysia (1997) 1.55 1.52 1.50 1.48 1.46 1.44 13 Netherlands (1996) 7.16 6.07 5.15 4.37 3.71 3.15 14 Newzealand 0.21 0.19 0.18 0.17 0.15 0.14 15 Spain 5.38 4.63 3.98 3.43 2.95 2.53 16 Sweden 4.19 3.46 2.86 2.36 1.94 1.60 17 U.Kingdom 1.82 1.72 1.62 1.53 1.45 1.37 18 USA 12.18 12.19 12.19 12.20 12.20 12.20
Total Developed Countries : 59.80 53.09 47.39 42.54 38.40 34.88 Developing Countries :
1 China 3.31 2.72 2.23 1.84 1.51 1.24 2 India (1997) 0.63 0.58 0.53 0.49 0.46 0.42 3 Indonesia (1998) 0.90 0.88 0.86 0.84 0.82 0.80 4 Mauritius (1998) 0.03 0.03 0.03 0.03 0.03 0.03 5 Pakistan 0.14 0.11 0.08 0.07 0.05 0.04 6 Peru 0.11 0.11 0.10 0.10 0.10 0.10 7 Philippines (1992) 0.19 0.16 0.14 0.11 0.09 0.08 8 S.Korea (1998) 2.33 1.99 1.70 1.45 1.24 1.06 9 Singapore 1.97 1.72 1.50 1.31 1.15 1.00 10 South Africa (1996) 0.73 0.70 0.68 0.65 0.63 0.61 11 Sri Lanka 0.08 0.07 0.07 0.06 0.06 0.06 12 Thailand 1.06 0.92 0.79 0.68 0.59 0.51
Total Developing Countries : 11.47 9.98 8.72 7.65 6.73 5.95 Grand Total of 30 Countries : 71.27 63.07 56.11 50.18 45.13 40.83
Note : Same as Table : 5. Source: International Monetary Fund (MF) ; Financial Trade Statistics Yearbook and Direction of Trade Statistics Yearbook.

30
Table : 7 OPTIMISTIC SCENARIO
Projections for Global Imports of Selected Countries (2000-2025) (Values in US Billion Dollars)
Sl.No. Countries : 2000 2005 2010 2015 2020 2025 World : 6026.48 7153.82 8492.05 10080.60 11966.32 14204.79
Developed Countries : 1 Australia 67.38 78.27 90.92 105.62 122.70 142.54 2 Austria (1993) 60.17 70.67 83.01 97.50 114.52 134.52 3 Belgium (1997) 177.05 215.66 262.69 319.97 389.75 474.74 4 Canada 221.03 258.84 303.11 354.96 415.68 486.78 5 Denmark 45.91 52.97 61.13 70.54 81.40 93.94 6 Finland (1997) 34.43 43.82 55.79 71.02 90.42 115.11 7 France (1997) 303.53 364.61 437.99 526.12 632.00 759.17 8 Germany 479.71 564.91 665.24 783.40 922.54 1086.39 9 Greece (1997) 29.03 32.66 36.75 41.36 46.54 52.36 10 Ireland 48.95 56.72 65.71 76.13 88.20 102.19 11 Italy (1998) 319.24 385.91 466.51 563.94 681.73 824.11 12 Japan 321.46 380.91 451.36 534.84 633.76 750.97 13 Netherlands (1996) 187.02 225.55 272.01 328.05 395.64 477.14 14 Newzealand 14.96 18.28 22.35 27.32 33.40 40.82 15 Spain 141.52 178.63 225.46 284.57 359.19 453.36 16 Sweden 65.48 81.35 101.07 125.58 156.02 193.85 17 U.Kingdom 331.08 385.96 449.94 524.53 611.48 712.85 18 USA 1072.55 1201.70 1346.40 1508.52 1690.17 1893.69
Total Developed Countries : 3920.48 4597.44 5397.46 6344.00 7465.12 8794.53 Developing Countries :
1 China 170.34 195.49 224.35 257.46 295.47 339.08 2 India (1997) 43.61 52.34 62.83 75.42 90.53 108.67 3 Kenya (1998) 3.67 4.80 6.28 8.20 10.72 14.01 4 Malaysia (1987) 92.38 119.77 155.28 201.33 261.03 338.43 5 Mauritius (1998) 2.36 2.85 3.44 4.15 5.02 6.06 6 Pakistan 10.58 12.08 13.81 15.78 18.03 20.61 7 Philippines (1992) 16.91 18.57 20.39 22.39 24.58 26.99 8 S.Korea 122.53 137.51 154.33 173.19 194.37 218.13 9 Singapore 114.78 135.27 159.41 187.87 221.40 260.92 10 South Africa (1996) 34.84 45.75 60.06 78.85 103.51 135.90 11 Sri Lanka 6.62 8.78 11.66 15.47 20.53 27.25 12 Thailand 54.83 63.73 74.07 86.08 100.05 116.28
Total Developing Countries : 673.45 796.94 945.89 1126.20 1345.24 1612.33 Grand Total of 30 Countries : 4593.93 5394.38 6343.36 7470.19 8810.37 10406.86 Note : Same as Table : 5.
Source: International Monetary Fund (MF) ; Financial Trade Statistics Yearbook and Direction of Trade Statistics Yearbook.
31
Table : 8 OPTIMISTIC SCENARIO
Projections for Global Imports of Selected Countries (2000-2025) (Values in Percentage of Total World Imports)
Sl.No. Countries : 2000 2005 2010 2015 2020 2025 World : 100.00 100.00 100.00 100.00 100.00 100.00
Developed Countries : 1 Australia 1.12 1.09 1.07 1.05 1.03 1.00 2 Austria (1993) 1.00 0.99 0.98 0.97 0.96 0.95 3 Belgium (1997) 2.94 3.01 3.09 3.17 3.26 3.34 4 Canada 3.67 3.62 3.57 3.52 3.47 3.43 5 Denmark 0.76 0.74 0.72 0.70 0.68 0.66 6 Finland (1997) 0.57 0.61 0.66 0.70 0.76 0.81 7 France (1997) 5.04 5.10 5.16 5.22 5.28 5.34 8 Germany 7.96 7.90 7.83 7.77 7.71 7.65 9 Greece (1997) 0.48 0.46 0.43 0.41 0.39 0.37 10 Ireland 0.81 0.79 0.77 0.76 0.74 0.72 11 Italy (1998) 5.30 5.39 5.49 5.59 5.70 5.80 12 Japan 5.33 5.32 5.32 5.31 5.30 5.29 13 Netherlands (1996) 3.10 3.15 3.20 3.25 3.31 3.36 14 Newzealand 0.25 0.26 0.26 0.27 0.28 0.29 15 Spain 2.35 2.50 2.65 2.82 3.00 3.19 16 Sweden 1.09 1.14 1.19 1.25 1.30 1.36 17 U.Kingdom 5.49 5.40 5.30 5.20 5.11 5.02 18 USA 17.80 16.80 15.85 14.96 14.12 13.33
Total Developed Countries : 65.05 64.27 63.56 62.93 62.38 61.91 Developing Countries :
1 China 2.83 2.73 2.64 2.55 2.47 2.39 2 India (1997) 0.72 0.73 0.74 0.75 0.76 0.77 3 Kenya (1998) 0.06 0.07 0.07 0.08 0.09 0.10 4 Malaysia (1987) 1.53 1.67 1.83 2.00 2.18 2.38 5 Mauritius (1998) 0.04 0.04 0.04 0.04 0.04 0.04 6 Pakistan 0.18 0.17 0.16 0.16 0.15 0.15 7 Philippines (1992) 0.28 0.26 0.24 0.22 0.21 0.19 8 S.Korea 2.03 1.92 1.82 1.72 1.62 1.54 9 Singapore 1.90 1.89 1.88 1.86 1.85 1.84 10 South Africa (1996) 0.58 0.64 0.71 0.78 0.87 0.96 11 Sri Lanka 0.11 0.12 0.14 0.15 0.17 0.19 12 Thailand 0.91 0.89 0.87 0.85 0.84 0.82
Total Developing Countries : 11.17 11.14 11.14 11.17 11.24 11.35 Grand Total of 30 Countries : 76.23 75.41 74.70 74.10 73.63 73.26 Note : Same as Table : 5.
Source: International Monetary Fund (MF) ; Financial Trade Statistics Yearbook and Direction of Trade Statistics Yearbook.
32
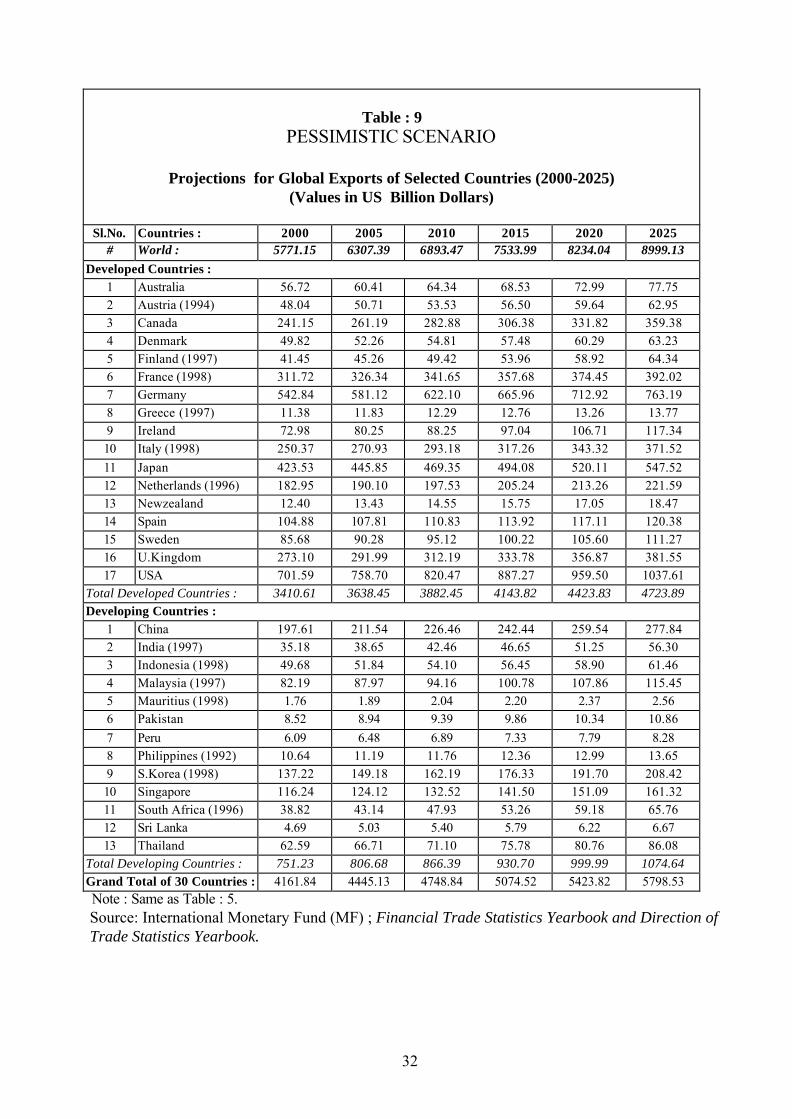
Table : 9 PESSIMISTIC SCENARIO
Projections for Global Exports of Selected Countries (2000-2025) (Values in US Billion Dollars)
Sl.No. Countries : 2000 2005 2010 2015 2020 2025
# World : 5771.15 6307.39 6893.47 7533.99 8234.04 8999.13 Developed Countries :
1 Australia 56.72 60.41 64.34 68.53 72.99 77.75 2 Austria (1994) 48.04 50.71 53.53 56.50 59.64 62.95 3 Canada 241.15 261.19 282.88 306.38 331.82 359.38 4 Denmark 49.82 52.26 54.81 57.48 60.29 63.23 5 Finland (1997) 41.45 45.26 49.42 53.96 58.92 64.34 6 France (1998) 311.72 326.34 341.65 357.68 374.45 392.02 7 Germany 542.84 581.12 622.10 665.96 712.92 763.19 8 Greece (1997) 11.38 11.83 12.29 12.76 13.26 13.77 9 Ireland 72.98 80.25 88.25 97.04 106.71 117.34 10 Italy (1998) 250.37 270.93 293.18 317.26 343.32 371.52 11 Japan 423.53 445.85 469.35 494.08 520.11 547.52 12 Netherlands (1996) 182.95 190.10 197.53 205.24 213.26 221.59 13 Newzealand 12.40 13.43 14.55 15.75 17.05 18.47 14 Spain 104.88 107.81 110.83 113.92 117.11 120.38 15 Sweden 85.68 90.28 95.12 100.22 105.60 111.27 16 U.Kingdom 273.10 291.99 312.19 333.78 356.87 381.55 17 USA 701.59 758.70 820.47 887.27 959.50 1037.61
Total Developed Countries : 3410.61 3638.45 3882.45 4143.82 4423.83 4723.89 Developing Countries :
1 China 197.61 211.54 226.46 242.44 259.54 277.84 2 India (1997) 35.18 38.65 42.46 46.65 51.25 56.30 3 Indonesia (1998) 49.68 51.84 54.10 56.45 58.90 61.46 4 Malaysia (1997) 82.19 87.97 94.16 100.78 107.86 115.45 5 Mauritius (1998) 1.76 1.89 2.04 2.20 2.37 2.56 6 Pakistan 8.52 8.94 9.39 9.86 10.34 10.86 7 Peru 6.09 6.48 6.89 7.33 7.79 8.28 8 Philippines (1992) 10.64 11.19 11.76 12.36 12.99 13.65 9 S.Korea (1998) 137.22 149.18 162.19 176.33 191.70 208.42 10 Singapore 116.24 124.12 132.52 141.50 151.09 161.32 11 South Africa (1996) 38.82 43.14 47.93 53.26 59.18 65.76 12 Sri Lanka 4.69 5.03 5.40 5.79 6.22 6.67 13 Thailand 62.59 66.71 71.10 75.78 80.76 86.08
Total Developing Countries : 751.23 806.68 866.39 930.70 999.99 1074.64 Grand Total of 30 Countries : 4161.84 4445.13 4748.84 5074.52 5423.82 5798.53
Note : Same as Table : 5. Source: International Monetary Fund (MF) ; Financial Trade Statistics Yearbook and Direction of Trade Statistics Yearbook.

33
Table : 10 PESSIMISTIC SCENARIO
Projections for Global Exports of Selected Countries (2000-2025) (Values in US Billion Dollars)
Sl.No. Countries : 2000 2005 2010 2015 2020 2025
# World : 100.00 100.00 100.00 100.00 100.00 100.00 Developed Countries :
1 Australia 0.98 0.96 0.93 0.91 0.89 0.86 2 Austria (1994) 0.83 0.80 0.78 0.75 0.72 0.70 3 Canada 4.18 4.14 4.10 4.07 4.03 3.99 4 Denmark 0.86 0.83 0.80 0.76 0.73 0.70 5 Finland (1997) 0.72 0.72 0.72 0.72 0.72 0.71 6 France (1998) 5.40 5.17 4.96 4.75 4.55 4.36 7 Germany 9.41 9.21 9.02 8.84 8.66 8.48 8 Greece (1997) 0.20 0.19 0.18 0.17 0.16 0.15 9 Ireland 1.26 1.27 1.28 1.29 1.30 1.30 10 Italy (1998) 4.34 4.30 4.25 4.21 4.17 4.13 11 Japan 7.34 7.07 6.81 6.56 6.32 6.08 12 Netherlands (1996) 3.17 3.01 2.87 2.72 2.59 2.46 13 Newzealand 0.21 0.21 0.21 0.21 0.21 0.21 14 Spain 1.82 1.71 1.61 1.51 1.42 1.34 15 Sweden 1.48 1.43 1.38 1.33 1.28 1.24 16 U.Kingdom 4.73 4.63 4.53 4.43 4.33 4.24 17 USA 12.16 12.03 11.90 11.78 11.65 11.53
Total Developed Countries : 59.10 57.69 56.32 55.00 53.73 52.49 Developing Countries :
1 China 3.42 3.67 3.92 4.20 4.50 4.81 2 India (1997) 0.61 0.67 0.74 0.81 0.89 0.98 3 Indonesia (1998) 0.86 0.90 0.94 0.98 1.02 1.07 4 Malaysia (1997) 1.42 1.52 1.63 1.75 1.87 2.00 5 Mauritius (1998) 0.03 0.03 0.04 0.04 0.04 0.04 6 Pakistan 0.15 0.15 0.16 0.17 0.18 0.19 7 Peru 0.11 0.11 0.12 0.13 0.13 0.14 8 Philippines (1992) 0.18 0.19 0.20 0.21 0.23 0.24 9 S.Korea (1998) 2.38 2.58 2.81 3.06 3.32 3.61 10 Singapore 2.01 2.15 2.30 2.45 2.62 2.80 11 South Africa (1996) 0.67 0.75 0.83 0.92 1.03 1.14 12 Sri Lanka 0.08 0.09 0.09 0.10 0.11 0.12 13 Thailand 1.08 1.16 1.23 1.31 1.40 1.49
Total Developing Countries : 13.02 13.98 15.01 16.13 17.33 18.62 Grand Total of 30 Countries : 72.11 71.66 71.33 71.13 71.05 71.11
Note : Same as Table : 5. Source: International Monetary Fund (MF) ; Financial Trade Statistics Yearbook and Direction of Trade Statistics Yearbook.
34
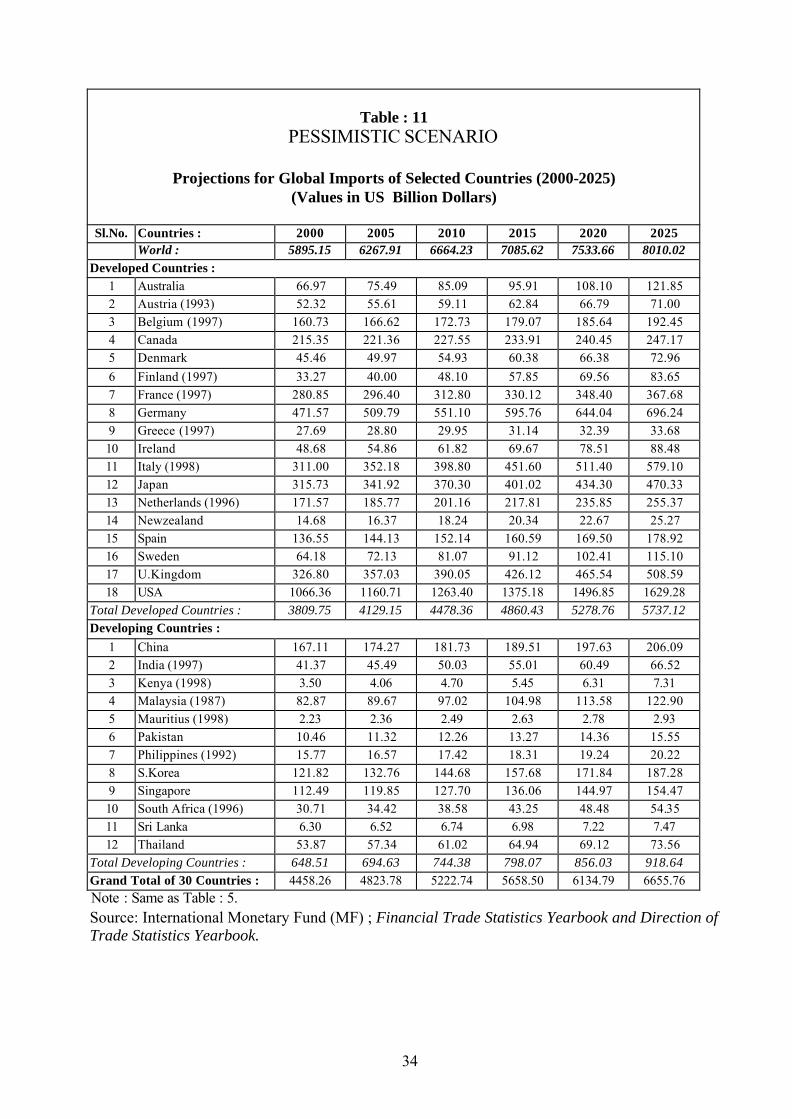
Table : 11 PESSIMISTIC SCENARIO
Projections for Global Imports of Selected Countries (2000-2025) (Values in US Billion Dollars)
Sl.No. Countries : 2000 2005 2010 2015 2020 2025
World : 5895.15 6267.91 6664.23 7085.62 7533.66 8010.02 Developed Countries :
1 Australia 66.97 75.49 85.09 95.91 108.10 121.85 2 Austria (1993) 52.32 55.61 59.11 62.84 66.79 71.00 3 Belgium (1997) 160.73 166.62 172.73 179.07 185.64 192.45 4 Canada 215.35 221.36 227.55 233.91 240.45 247.17 5 Denmark 45.46 49.97 54.93 60.38 66.38 72.96 6 Finland (1997) 33.27 40.00 48.10 57.85 69.56 83.65 7 France (1997) 280.85 296.40 312.80 330.12 348.40 367.68 8 Germany 471.57 509.79 551.10 595.76 644.04 696.24 9 Greece (1997) 27.69 28.80 29.95 31.14 32.39 33.68 10 Ireland 48.68 54.86 61.82 69.67 78.51 88.48 11 Italy (1998) 311.00 352.18 398.80 451.60 511.40 579.10 12 Japan 315.73 341.92 370.30 401.02 434.30 470.33 13 Netherlands (1996) 171.57 185.77 201.16 217.81 235.85 255.37 14 Newzealand 14.68 16.37 18.24 20.34 22.67 25.27 15 Spain 136.55 144.13 152.14 160.59 169.50 178.92 16 Sweden 64.18 72.13 81.07 91.12 102.41 115.10 17 U.Kingdom 326.80 357.03 390.05 426.12 465.54 508.59 18 USA 1066.36 1160.71 1263.40 1375.18 1496.85 1629.28
Total Developed Countries : 3809.75 4129.15 4478.36 4860.43 5278.76 5737.12 Developing Countries :
1 China 167.11 174.27 181.73 189.51 197.63 206.09 2 India (1997) 41.37 45.49 50.03 55.01 60.49 66.52 3 Kenya (1998) 3.50 4.06 4.70 5.45 6.31 7.31 4 Malaysia (1987) 82.87 89.67 97.02 104.98 113.58 122.90 5 Mauritius (1998) 2.23 2.36 2.49 2.63 2.78 2.93 6 Pakistan 10.46 11.32 12.26 13.27 14.36 15.55 7 Philippines (1992) 15.77 16.57 17.42 18.31 19.24 20.22 8 S.Korea 121.82 132.76 144.68 157.68 171.84 187.28 9 Singapore 112.49 119.85 127.70 136.06 144.97 154.47 10 South Africa (1996) 30.71 34.42 38.58 43.25 48.48 54.35 11 Sri Lanka 6.30 6.52 6.74 6.98 7.22 7.47 12 Thailand 53.87 57.34 61.02 64.94 69.12 73.56
Total Developing Countries : 648.51 694.63 744.38 798.07 856.03 918.64 Grand Total of 30 Countries : 4458.26 4823.78 5222.74 5658.50 6134.79 6655.76
Note : Same as Table : 5. Source: International Monetary Fund (MF) ; Financial Trade Statistics Yearbook and Direction of Trade Statistics Yearbook.
35
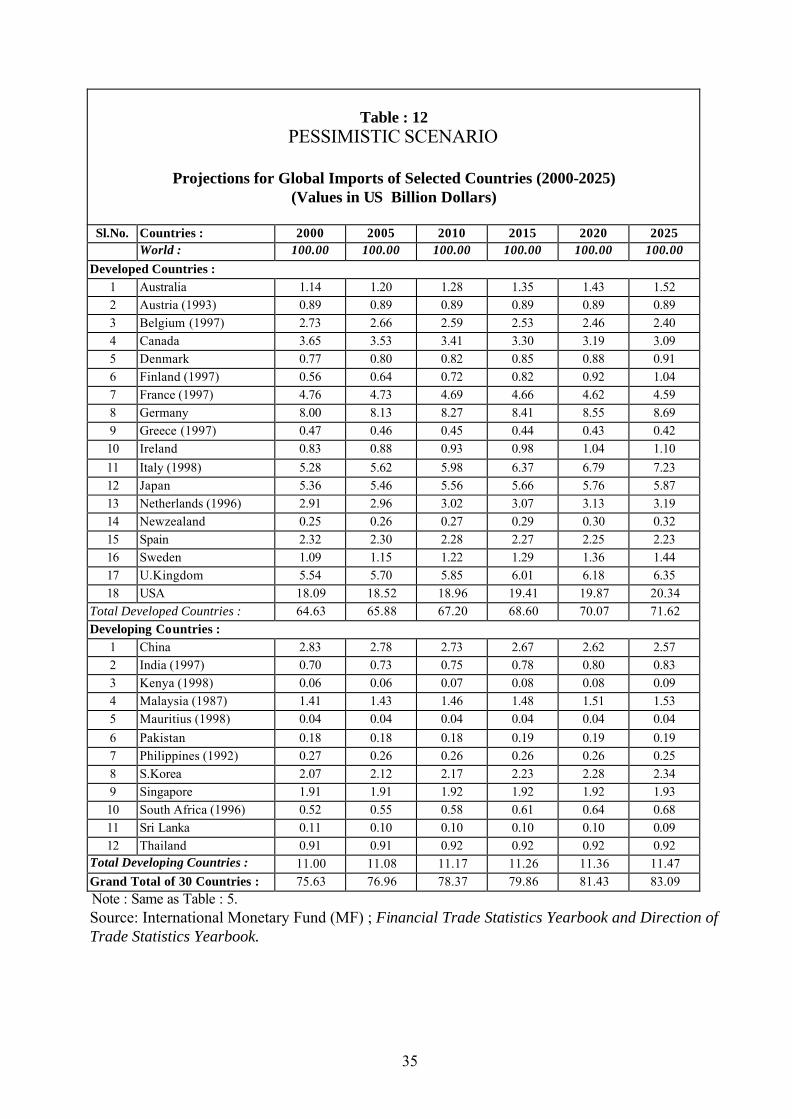
Table : 12 PESSIMISTIC SCENARIO
Projections for Global Imports of Selected Countries (2000-2025) (Values in US Billion Dollars)
Sl.No. Countries : 2000 2005 2010 2015 2020 2025
World : 100.00 100.00 100.00 100.00 100.00 100.00 Developed Countries :
1 Australia 1.14 1.20 1.28 1.35 1.43 1.52 2 Austria (1993) 0.89 0.89 0.89 0.89 0.89 0.89 3 Belgium (1997) 2.73 2.66 2.59 2.53 2.46 2.40 4 Canada 3.65 3.53 3.41 3.30 3.19 3.09 5 Denmark 0.77 0.80 0.82 0.85 0.88 0.91 6 Finland (1997) 0.56 0.64 0.72 0.82 0.92 1.04 7 France (1997) 4.76 4.73 4.69 4.66 4.62 4.59 8 Germany 8.00 8.13 8.27 8.41 8.55 8.69 9 Greece (1997) 0.47 0.46 0.45 0.44 0.43 0.42 10 Ireland 0.83 0.88 0.93 0.98 1.04 1.10 11 Italy (1998) 5.28 5.62 5.98 6.37 6.79 7.23 12 Japan 5.36 5.46 5.56 5.66 5.76 5.87 13 Netherlands (1996) 2.91 2.96 3.02 3.07 3.13 3.19 14 Newzealand 0.25 0.26 0.27 0.29 0.30 0.32 15 Spain 2.32 2.30 2.28 2.27 2.25 2.23 16 Sweden 1.09 1.15 1.22 1.29 1.36 1.44 17 U.Kingdom 5.54 5.70 5.85 6.01 6.18 6.35 18 USA 18.09 18.52 18.96 19.41 19.87 20.34
Total Developed Countries : 64.63 65.88 67.20 68.60 70.07 71.62 Developing Countries :
1 China 2.83 2.78 2.73 2.67 2.62 2.57 2 India (1997) 0.70 0.73 0.75 0.78 0.80 0.83 3 Kenya (1998) 0.06 0.06 0.07 0.08 0.08 0.09 4 Malaysia (1987) 1.41 1.43 1.46 1.48 1.51 1.53 5 Mauritius (1998) 0.04 0.04 0.04 0.04 0.04 0.04 6 Pakistan 0.18 0.18 0.18 0.19 0.19 0.19 7 Philippines (1992) 0.27 0.26 0.26 0.26 0.26 0.25 8 S.Korea 2.07 2.12 2.17 2.23 2.28 2.34 9 Singapore 1.91 1.91 1.92 1.92 1.92 1.93 10 South Africa (1996) 0.52 0.55 0.58 0.61 0.64 0.68 11 Sri Lanka 0.11 0.10 0.10 0.10 0.10 0.09 12 Thailand 0.91 0.91 0.92 0.92 0.92 0.92
Total Developing Countries : 11.00 11.08 11.17 11.26 11.36 11.47 Grand Total of 30 Countries : 75.63 76.96 78.37 79.86 81.43 83.09
Note : Same as Table : 5. Source: International Monetary Fund (MF) ; Financial Trade Statistics Yearbook and Direction of Trade Statistics Yearbook.
36
Table : 13 REALISTIC SCENARIO
Projections for Global Exports of Selected Countries (2000-2025) (Values in US Billion Dollars)
Sl.No. Countries : 2000 2005 2010 2015 2020 2025
# World : 5876.37 7029.63 8409.22 10059.56 12033.79 14395.46
Developed Countries 1 Australia 57.02 62.35 68.19 74.57 81.55 89.18 2 Austria (1994) 45.76 49.62 53.80 58.34 63.26 68.59 3 Canada 241.63 264.28 289.06 316.15 345.79 378.21 4 Denmark 49.93 52.95 56.15 59.54 63.14 66.96 5 Finland (1997) 40.22 45.05 50.47 56.53 63.33 70.94 6 France (1998) 311.64 341.16 373.47 408.84 447.56 489.94 7 Germany 545.69 599.63 658.91 724.05 795.62 874.28 8 Greece (1997) 11.36 12.60 13.98 15.51 17.21 19.09 9 Ireland 73.11 81.14 90.05 99.94 110.91 123.09 10 Italy (1998) 246.76 268.76 292.71 318.80 347.21 378.16 11 Japan 425.60 459.09 495.21 534.17 576.19 621.52 12 Netherlands (1996) 180.25 195.05 211.05 228.37 247.11 267.39 13 Newzealand 12.42 13.55 14.77 16.10 17.56 19.15 14 Spain 106.66 119.23 133.28 148.99 166.55 186.19 15 Sweden 86.54 95.87 106.21 117.66 130.35 144.41 16 U.Kingdom 274.84 303.33 334.78 369.49 407.80 450.08 17 USA 711.59 825.96 958.71 1112.80 1291.66 1499.26
Total Developed Countries: 3421.03 3789.62 4200.80 4659.87 5172.82 5746.44
Developing Countries 1 China 197.97 213.86 231.03 249.59 269.63 291.28 2 India (1997) 34.24 39.67 45.96 53.25 61.70 71.48 3 Indonesia (1998) 50.40 58.96 68.97 80.68 94.37 110.40 4 Malaysia (1997) 81.41 95.16 111.23 130.01 151.96 177.62 5 Mauritius (1998) 1.76 2.04 2.36 2.74 3.18 3.69 6 Pakistan 8.72 10.26 12.07 14.21 16.72 19.68 7 Peru 6.27 7.69 9.43 11.57 14.19 17.40 8 Philippines (1992) 9.99 10.81 11.70 12.67 13.72 14.85 9 S.Korea (1998) 135.36 149.43 164.98 182.14 201.08 221.99 10 Singapore 116.95 128.69 141.61 155.83 171.48 188.70 11 South Africa (1996) 36.87 43.44 51.17 60.29 71.03 83.67 12 Sri Lanka 4.73 5.33 6.00 6.76 7.61 8.57 13 Thailand 62.96 69.12 75.88 83.31 91.46 100.41
Total Developing Countries: 747.61 834.46 932.41 1043.03 1168.11 1309.73 Grand Total of 30 Countries : 4168.64 4624.07 5133.21 5702.90 6340.93 7056.18
Note : Same as Table : 5. Source: International Monetary Fund (MF) ; Financial Trade Statistics Yearbook and Direction of Trade Statistics Yearbook..
37
Table : 14 REALISTIC SCENARIO
Projections for Global Exports of Selected Countries (2000-2025) (Values in Percentage of Total World Exports)
Sl.No. Countries : 2000 2005 2010 2015 2020 2025 # World : 100.00 100.00 100.00 100.00 100.00 100.00 Developed Countries 1 Australia 0.970 0.887 0.811 0.741 0.678 0.620 2 Austria (1994) 0.779 0.706 0.640 0.580 0.526 0.476 3 Canada 4.112 3.760 3.437 3.143 2.874 2.627 4 Denmark 0.850 0.753 0.668 0.592 0.525 0.465 5 Finland (1997) 0.684 0.641 0.600 0.562 0.526 0.493 6 France (1998) 5.303 4.853 4.441 4.064 3.719 3.403 7 Germany 9.286 8.530 7.836 7.198 6.612 6.073 8 Greece (1997) 0.193 0.179 0.166 0.154 0.143 0.133 9 Ireland 1.244 1.154 1.071 0.993 0.922 0.855 10 Italy (1998) 4.199 3.823 3.481 3.169 2.885 2.627 11 Japan 7.243 6.531 5.889 5.310 4.788 4.318 12 Netherlands (1996) 3.067 2.775 2.510 2.270 2.053 1.857 13 Newzealand 0.211 0.193 0.176 0.160 0.146 0.133 14 Spain 1.815 1.696 1.585 1.481 1.384 1.293 15 Sweden 1.473 1.364 1.263 1.170 1.083 1.003 16 U.Kingdom 4.677 4.315 3.981 3.673 3.389 3.127 17 USA 12.109 11.750 11.401 11.062 10.734 10.415
Total Developed Countries: 58.217 53.909 49.955 46.323 42.986 39.918
Developing Countries 1 China 3.369 3.042 2.747 2.481 2.241 2.023 2 India (1997) 0.583 0.564 0.547 0.529 0.513 0.497 3 Indonesia (1998) 0.858 0.839 0.820 0.802 0.784 0.767 4 Malaysia (1997) 1.385 1.354 1.323 1.292 1.263 1.234 5 Mauritius (1998) 0.030 0.029 0.028 0.027 0.026 0.026 6 Pakistan 0.148 0.146 0.144 0.141 0.139 0.137 7 Peru 0.107 0.109 0.112 0.115 0.118 0.121 8 Philippines (1992) 0.170 0.154 0.139 0.126 0.114 0.103 9 S.Korea (1998) 2.303 2.126 1.962 1.811 1.671 1.542 10 Singapore 1.990 1.831 1.684 1.549 1.425 1.311 11 South Africa (1996) 0.627 0.618 0.609 0.599 0.590 0.581 12 Sri Lanka 0.081 0.076 0.071 0.067 0.063 0.060 13 Thailand 1.071 0.983 0.902 0.828 0.760 0.697
Total Developing Countries: 12.722 11.871 11.088 10.369 9.707 9.098 Grand Total of 30 Countries : 70.94 65.78 61.04 56.69 52.69 49.02
Note : Same as Table : 5. Source: International Monetary Fund (MF) ; Financial Trade Statistics Yearbook and Direction of Trade Statistics Yearbook.
38
Table : 15 REALISTIC SCENARIO
Projections for Global Imports of Selected Countries (2000-2025) (Values in US Billion Dollars)
Sl.No. Countries : 2000 2005 2010 2015 2020 2025 World : 5947.63 6610.26 7346.72 8165.23 9074.93 10085.97 Developed Countries : 1 Australia 67.15 76.68 87.56 100.00 114.19 130.41 2 Austria (1993) 48.95 53.85 59.24 65.17 71.69 78.87 3 Belgium (1997) 160.82 179.67 200.72 224.25 250.53 279.90 4 Canada 218.33 240.45 264.80 291.62 321.16 353.69 5 Denmark 45.74 51.85 58.78 66.63 75.53 85.62 6 Finland (1997) 31.04 38.20 47.01 57.84 71.17 87.58 7 France (1997) 278.14 311.48 348.82 390.64 437.46 489.90 8 Germany 475.11 533.20 598.39 671.54 753.64 845.78 9 Greece (1997) 27.42 29.34 31.41 33.61 35.98 38.50 10 Ireland 48.80 55.64 63.45 72.34 82.49 94.06 11 Italy (1998) 304.85 353.73 410.46 476.28 552.65 641.28 12 Japan 317.94 356.54 399.83 448.37 502.81 563.85 13 Netherlands (1996) 164.92 186.04 209.86 236.74 267.06 301.26 14 Newzealand 14.80 17.13 19.82 22.95 26.56 30.74 15 Spain 139.58 164.41 193.67 228.13 268.72 316.53 16 Sweden 64.76 76.14 89.52 105.25 123.75 145.50 17 U.Kingdom 329.31 373.77 424.23 481.50 546.50 620.28 18 USA 1070.67 1189.15 1320.74 1466.89 1629.21 1809.49
Total Developed Countries: 3808.32 4287.27 4828.30 5439.74 6131.11 6913.24 Developing Countries 1 China 169.03 186.59 205.97 227.37 250.99 277.07 2 India (1997) 40.16 46.03 52.76 60.47 69.31 79.44 3 Kenya (1998) 3.45 4.27 5.30 6.57 8.15 10.10 4 Malaysia (1987) 81.78 96.94 114.91 136.22 161.47 191.40 5 Mauritius (1998) 2.24 2.55 2.91 3.31 3.77 4.29 6 Pakistan 10.59 12.19 14.03 16.14 18.58 21.38 7 Philippines (1992) 14.79 15.97 17.25 18.62 20.11 21.72 8 S.Korea 122.26 135.69 150.59 167.13 185.48 205.85 9 Singapore 113.38 125.69 139.32 154.44 171.20 189.78 10 South Africa (1996) 29.23 36.05 44.46 54.84 67.63 83.42 11 Sri Lanka 6.50 7.85 9.49 11.46 13.85 16.74 12 Thailand 54.31 60.20 66.72 73.95 81.97 90.85
Total Developing Countries: 647.72 730.01 823.70 930.52 1052.50 1192.03 Grand Total of 30 Countries : 4456.04 5017.28 5652.00 6370.27 7183.61 8105.27
Note : Same as Table : 5. Source: International Monetary Fund (MF) ; Financial Trade Statistics Yearbook and Direction of Trade Statistics Yearbook.
39
Table : 16 REALISTIC SCENARIO
Projections for Global Imports of Selected Countries (2000-2025) (Values in Percentage of Total World Imports)
Sl.No. Countries : 2000 2005 2010 2015 2020 2025
World : 100.00 100.00 100.00 100.00 100.00 100.00 Developed Countries :
1 Australia 1.129 1.160 1.192 1.225 1.258 1.293 2 Austria (1993) 0.823 0.815 0.806 0.798 0.790 0.782 3 Belgium (1997) 2.704 2.718 2.732 2.746 2.761 2.775 4 Canada 3.671 3.637 3.604 3.572 3.539 3.507 5 Denmark 0.769 0.784 0.800 0.816 0.832 0.849 6 Finland (1997) 0.522 0.578 0.640 0.708 0.784 0.868 7 France (1997) 4.677 4.712 4.748 4.784 4.821 4.857 8 Germany 7.988 8.066 8.145 8.224 8.305 8.386 9 Greece (1997) 0.461 0.444 0.427 0.412 0.396 0.382 10 Ireland 0.820 0.842 0.864 0.886 0.909 0.933 11 Italy (1998) 5.125 5.351 5.587 5.833 6.090 6.358 12 Japan 5.346 5.394 5.442 5.491 5.541 5.590 13 Netherlands (1996) 2.773 2.814 2.857 2.899 2.943 2.987 14 Newzealand 0.249 0.259 0.270 0.281 0.293 0.305 15 Spain 2.347 2.487 2.636 2.794 2.961 3.138 16 Sweden 1.089 1.152 1.218 1.289 1.364 1.443 17 U.Kingdom 5.537 5.654 5.774 5.897 6.022 6.150 18 USA 18.002 17.989 17.977 17.965 17.953 17.941
Total Developed Countries: 64.031 64.858 65.720 66.621 67.561 68.543
Developing Countries 1 China 2.842 2.823 2.804 2.785 2.766 2.747 2 India (1997) 0.675 0.696 0.718 0.741 0.764 0.788 3 Kenya (1998) 0.058 0.065 0.072 0.080 0.090 0.100 4 Malaysia (1987) 1.375 1.467 1.564 1.668 1.779 1.898 5 Mauritius (1998) 0.038 0.039 0.040 0.041 0.042 0.043 6 Pakistan 0.178 0.184 0.191 0.198 0.205 0.212 7 Philippines (1992) 0.249 0.242 0.235 0.228 0.222 0.215 8 S.Korea 2.056 2.053 2.050 2.047 2.044 2.041 9 Singapore 1.906 1.901 1.896 1.891 1.887 1.882 10 South Africa (1996) 0.491 0.545 0.605 0.672 0.745 0.827 11 Sri Lanka 0.109 0.119 0.129 0.140 0.153 0.166 12 Thailand 0.913 0.911 0.908 0.906 0.903 0.901
Total Developing Countries: 10.890 11.044 11.212 11.396 11.598 11.819 Grand Total of 30 Countries : 74.92 75.90 76.93 78.02 79.16 80.36
Note : Same as Table : 5. Source: International Monetary Fund (MF) ; Financial Trade Statistics Yearbook and Direction of Trade Statistics Yearbook.

40
Table :17
India's Major Exports Items to the World (1993-94 to 1999-2000) (Values in US Million Dollars)
Sl.No. COMMODITIES 1993-94 1994-95 1995-96 1996-97 1997-98 1998-99 1999-00
All Commodities : 22213.01 26337.50 31841.87 31497.97 35048.67 33210.97 37644.39 1 Agricultural & allied products 4023.10 4227.28 6120.01 6808.50 6634.20 6033.11 5304.60 2 Basmati Rice 337.98 275.67 254.69 351.74 454.10 446.03 401.10 3 Marine products 812.70 1126.68 1012.31 1129.86 1208.72 1038.15 1181.55 4 Spices 181.18 195.04 237.58 338.92 379.76 387.96 393.23 5 Other ores & minerals 208.23 276.36 294.47 322.75 213.75 212.42 374.87 6 Manufactured goods 16636.93 20410.02 23782.44 24634.16 24634.16 25785.69 29509.85 7 Leather & leather manufacturers 1298.10 1611.07 1754.84 1607.17 1658.69 1660.34 1540.27 8 Finished leather 269.99 382.72 371.85 301.32 296.19 268.38 239.08 9 Footwear of Leather 457.19 549.62 340.92 337.74 282.24 324.74 331.20 10 Leather Goods 570.91 378.73 363.14 294.49 387.79 411.07 385.25 11 Footwear component 0.00 0.00 414.21 424.73 425.72 381.94 318.94 12 Chemicals & related products 1575.69 2081.14 2487.26 2841.85 3335.47 3057.24 3379.56 13 Drugs, pharm & fine chemicals 640.03 800.36 1020.57 1224.08 1459.94 1486.71 1532.22 14 Dyes, intermediates etc. 366.70 479.78 487.19 562.42 601.16 468.72 581.13 15 Engineering goods 3018.82 3479.59 4363.89 4928.60 5274.82 4432.61 4918.07 16 Electronic goods 303.23 412.30 671.12 784.33 760.49 502.64 567.09 17 Machinery & instruments 638.16 726.89 831.06 1057.99 1197.11 1154.59 1157.52 18 Manufacturers of metals 662.43 706.41 827.65 914.28 1024.42 1039.79 1244.20 19 Prim. & semin-fin. Iron & steel 452.24 426.14 526.18 615.58 757.59 495.96 754.00 20 Transport equipment 591.27 771.47 926.29 969.53 930.22 761.60 773.48 21 Textiles (encl. RMG) 2870.61 3811.23 4341.35 4867.80 5162.57 4480.75 5030.45 22 Carpet Handmade 453.24 441.60 421.05 436.67 411.11 409.16 509.40 23 Cotton yarn fab. Madeups etc. 1535.43 2234.38 2580.43 3124.36 3268.22 2771.27 3142.76 24 Manmade yarn fab. Madeups 425.22 614.12 751.90 703.26 805.85 699.87 821.33 25 Readymade garments (RMG) 2583.41 3282.83 3681.04 3756.45 3880.85 4363.96 4807.92 26 RMG of cotton and accessories 1965.83 2502.73 2830.64 2943.08 2878.02 3146.72 3524.59 27 RMG of manmade fibres 388.78 457.37 520.95 530.31 691.87 923.34 696.03 28 Other manufactured goods 5290.31 6144.17 7154.05 6632.30 7266.17 7790.78 9833.57 29 Footwear of rubber/canvas etc. 40.16 14.06 10.64 12.46 15.23 17.77 37.77 30 Gems & jewellery 3991.20 4501.60 5282.70 4756.72 5351.97 5928.02 7645.33 31 Handicrafts encl. Handmade carpets 318.18 386.42 434.57 476.07 526.49 632.97 671.11 32 Plastic & linoleum products 335.51 478.39 586.31 539.88 514.95 471.58 587.74 33 Petroleum & crude products 397.39 417.01 454.01 482.20 353.18 89.41 30.02 34 Other commidities 268.4 294.6 308.33 339.75 420.3 409.53 1692.13
Source : Computed from CMIE; Foreign Trade and Balance of Payments - July 2000.
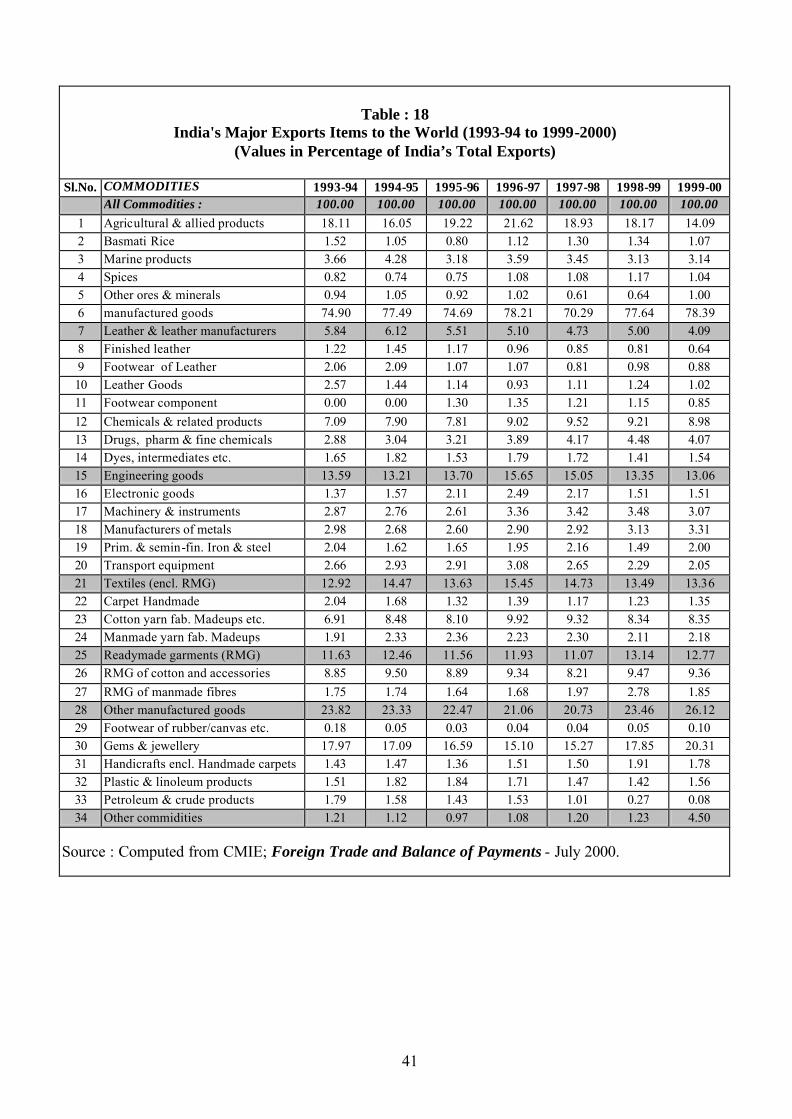
41
Table : 18 India's Major Exports Items to the World (1993-94 to 1999-2000)
(Values in Percentage of India’s Total Exports)
Sl.No. COMMODITIES 1993-94 1994-95 1995-96 1996-97 1997-98 1998-99 1999-00 All Commodities : 100.00 100.00 100.00 100.00 100.00 100.00 100.00 1 Agricultural & allied products 18.11 16.05 19.22 21.62 18.93 18.17 14.09 2 Basmati Rice 1.52 1.05 0.80 1.12 1.30 1.34 1.07 3 Marine products 3.66 4.28 3.18 3.59 3.45 3.13 3.14 4 Spices 0.82 0.74 0.75 1.08 1.08 1.17 1.04 5 Other ores & minerals 0.94 1.05 0.92 1.02 0.61 0.64 1.00 6 manufactured goods 74.90 77.49 74.69 78.21 70.29 77.64 78.39 7 Leather & leather manufacturers 5.84 6.12 5.51 5.10 4.73 5.00 4.09 8 Finished leather 1.22 1.45 1.17 0.96 0.85 0.81 0.64 9 Footwear of Leather 2.06 2.09 1.07 1.07 0.81 0.98 0.88 10 Leather Goods 2.57 1.44 1.14 0.93 1.11 1.24 1.02 11 Footwear component 0.00 0.00 1.30 1.35 1.21 1.15 0.85 12 Chemicals & related products 7.09 7.90 7.81 9.02 9.52 9.21 8.98 13 Drugs, pharm & fine chemicals 2.88 3.04 3.21 3.89 4.17 4.48 4.07 14 Dyes, intermediates etc. 1.65 1.82 1.53 1.79 1.72 1.41 1.54 15 Engineering goods 13.59 13.21 13.70 15.65 15.05 13.35 13.06 16 Electronic goods 1.37 1.57 2.11 2.49 2.17 1.51 1.51 17 Machinery & instruments 2.87 2.76 2.61 3.36 3.42 3.48 3.07 18 Manufacturers of metals 2.98 2.68 2.60 2.90 2.92 3.13 3.31 19 Prim. & semin-fin. Iron & steel 2.04 1.62 1.65 1.95 2.16 1.49 2.00 20 Transport equipment 2.66 2.93 2.91 3.08 2.65 2.29 2.05 21 Textiles (encl. RMG) 12.92 14.47 13.63 15.45 14.73 13.49 13.36 22 Carpet Handmade 2.04 1.68 1.32 1.39 1.17 1.23 1.35 23 Cotton yarn fab. Madeups etc. 6.91 8.48 8.10 9.92 9.32 8.34 8.35 24 Manmade yarn fab. Madeups 1.91 2.33 2.36 2.23 2.30 2.11 2.18 25 Readymade garments (RMG) 11.63 12.46 11.56 11.93 11.07 13.14 12.77 26 RMG of cotton and accessories 8.85 9.50 8.89 9.34 8.21 9.47 9.36 27 RMG of manmade fibres 1.75 1.74 1.64 1.68 1.97 2.78 1.85 28 Other manufactured goods 23.82 23.33 22.47 21.06 20.73 23.46 26.12 29 Footwear of rubber/canvas etc. 0.18 0.05 0.03 0.04 0.04 0.05 0.10 30 Gems & jewellery 17.97 17.09 16.59 15.10 15.27 17.85 20.31 31 Handicrafts encl. Handmade carpets 1.43 1.47 1.36 1.51 1.50 1.91 1.78 32 Plastic & linoleum products 1.51 1.82 1.84 1.71 1.47 1.42 1.56 33 Petroleum & crude products 1.79 1.58 1.43 1.53 1.01 0.27 0.08 34 Other commidities 1.21 1.12 0.97 1.08 1.20 1.23 4.50
Source : Computed from CMIE; Foreign Trade and Balance of Payments - July 2000.
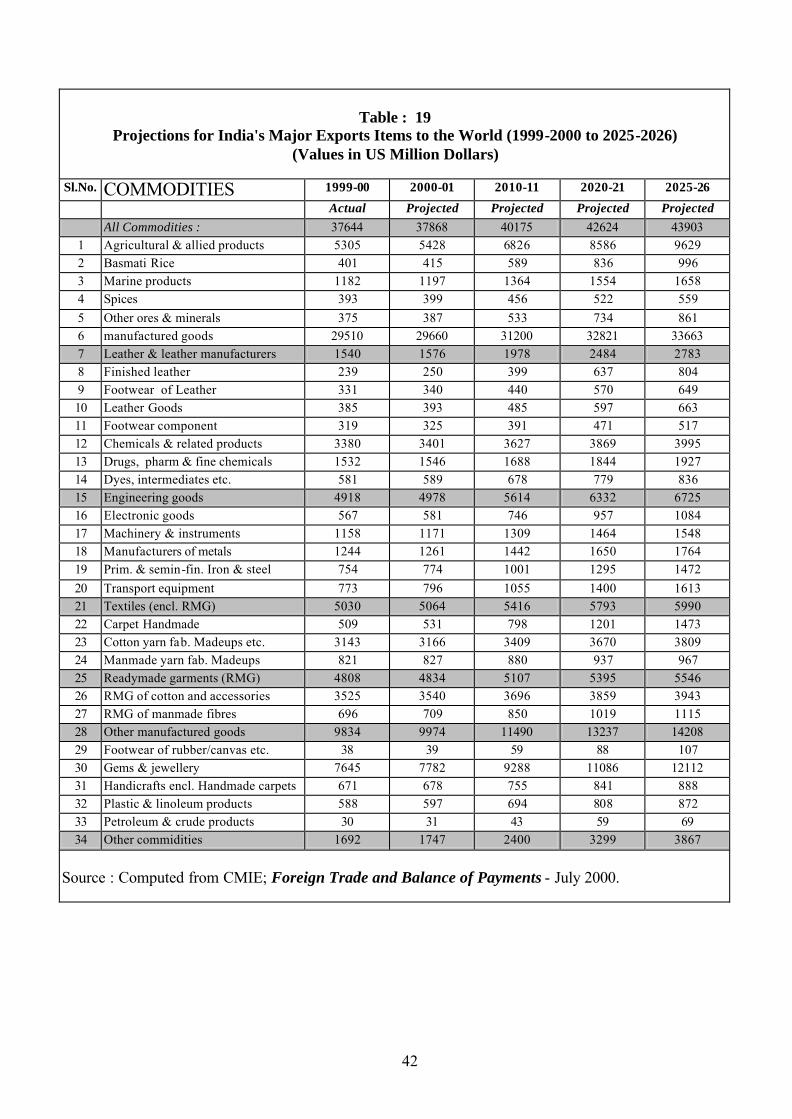
42
Table : 19 Projections for India's Major Exports Items to the World (1999-2000 to 2025-2026)
(Values in US Million Dollars)
Sl.No. COMMODITIES 1999-00 2000-01 2010-11 2020-21 2025-26
Actual Projected Projected Projected Projected All Commodities : 37644 37868 40175 42624 43903 1 Agricultural & allied products 5305 5428 6826 8586 9629 2 Basmati Rice 401 415 589 836 996 3 Marine products 1182 1197 1364 1554 1658 4 Spices 393 399 456 522 559 5 Other ores & minerals 375 387 533 734 861 6 manufactured goods 29510 29660 31200 32821 33663 7 Leather & leather manufacturers 1540 1576 1978 2484 2783 8 Finished leather 239 250 399 637 804 9 Footwear of Leather 331 340 440 570 649 10 Leather Goods 385 393 485 597 663 11 Footwear component 319 325 391 471 517 12 Chemicals & related products 3380 3401 3627 3869 3995 13 Drugs, pharm & fine chemicals 1532 1546 1688 1844 1927 14 Dyes, intermediates etc. 581 589 678 779 836 15 Engineering goods 4918 4978 5614 6332 6725 16 Electronic goods 567 581 746 957 1084 17 Machinery & instruments 1158 1171 1309 1464 1548 18 Manufacturers of metals 1244 1261 1442 1650 1764 19 Prim. & semin-fin. Iron & steel 754 774 1001 1295 1472 20 Transport equipment 773 796 1055 1400 1613 21 Textiles (encl. RMG) 5030 5064 5416 5793 5990 22 Carpet Handmade 509 531 798 1201 1473 23 Cotton yarn fab. Madeups etc. 3143 3166 3409 3670 3809 24 Manmade yarn fab. Madeups 821 827 880 937 967 25 Readymade garments (RMG) 4808 4834 5107 5395 5546 26 RMG of cotton and accessories 3525 3540 3696 3859 3943 27 RMG of manmade fibres 696 709 850 1019 1115 28 Other manufactured goods 9834 9974 11490 13237 14208 29 Footwear of rubber/canvas etc. 38 39 59 88 107 30 Gems & jewellery 7645 7782 9288 11086 12112 31 Handicrafts encl. Handmade carpets 671 678 755 841 888 32 Plastic & linoleum products 588 597 694 808 872 33 Petroleum & crude products 30 31 43 59 69 34 Other commidities 1692 1747 2400 3299 3867
Source : Computed from CMIE; Foreign Trade and Balance of Payments - July 2000.

43
Table : 20 Projections for India's Major Exports Items to the World (1999-2000 to 2025-2026)
(Values in Percentage of India’s Total Exports)
Sl.No. COMMODITIES 1999-00 2000-01 2010-11 2020-21 2025-26
Actual Projected Projected Projected Projected
All Commodities : 100.00 100.00 100.00 100.00 100.00 1 Agricultural & allied products 14.09 14.33 16.99 20.14 21.93 2 Basmati Rice 1.07 1.10 1.47 1.96 2.27 3 Marine products 3.14 3.16 3.39 3.64 3.78 4 Spices 1.04 1.05 1.14 1.23 1.27 5 Other ores & minerals 1.00 1.02 1.33 1.72 1.96 6 manufactured goods 78.39 78.32 77.66 77.00 76.67 7 Leather & leather manufacturers 4.09 4.16 4.92 5.83 6.34 8 Finished leather 0.64 0.66 0.99 1.49 1.83 9 Footwear of Leather 0.88 0.90 1.10 1.34 1.48 10 Leather Goods 1.02 1.04 1.21 1.40 1.51 11 Footwear component 0.85 0.86 0.97 1.11 1.18 12 Chemicals & related products 8.98 8.98 9.03 9.08 9.10 13 Drugs, pharm & fine chemicals 4.07 4.08 4.20 4.33 4.39 14 Dyes, intermediates etc. 1.54 1.56 1.69 1.83 1.90 15 Engineering goods 13.06 13.14 13.97 14.86 15.32 16 Electronic goods 1.51 1.54 1.86 2.25 2.47 17 Machinery & instruments 3.07 3.09 3.26 3.43 3.53 18 Manufacturers of metals 3.31 3.33 3.59 3.87 4.02 19 Prim. & semin-fin. Iron & steel 2.00 2.04 2.49 3.04 3.35 20 Transport equipment 2.05 2.10 2.63 3.28 3.67 21 Textiles (encl. RMG) 13.36 13.37 13.48 13.59 13.64 22 Carpet Handmade 1.35 1.40 1.99 2.82 3.36 23 Cotton yarn fab. Madeups etc. 8.35 8.36 8.49 8.61 8.67 24 Manmade yarn fab. Madeups 2.18 2.18 2.19 2.20 2.20 25 Readymade garments (RMG) 12.77 12.77 12.71 12.66 12.63 26 RMG of cotton and accessories 9.36 9.35 9.20 9.05 8.98 27 RMG of manmade fibres 1.85 1.87 2.12 2.39 2.54 28 Other manufactured goods 26.12 26.34 28.60 31.06 32.36 29 Footwear of rubber/canvas etc. 0.10 0.10 0.15 0.21 0.24 30 Gems & jewellery 20.31 20.55 23.12 26.01 27.59 31 Handicrafts encl. Handmade carpets 1.78 1.79 1.88 1.97 2.02 32 Plastic & linoleum products 1.56 1.58 1.73 1.90 1.99 33 Petroleum & crude products 0.08 0.08 0.11 0.14 0.16 34 Other commidities 4.50 4.61 5.97 7.74 8.81
Source : Computed from CMIE; Foreign Trade and Balance of Payments - July 2000.
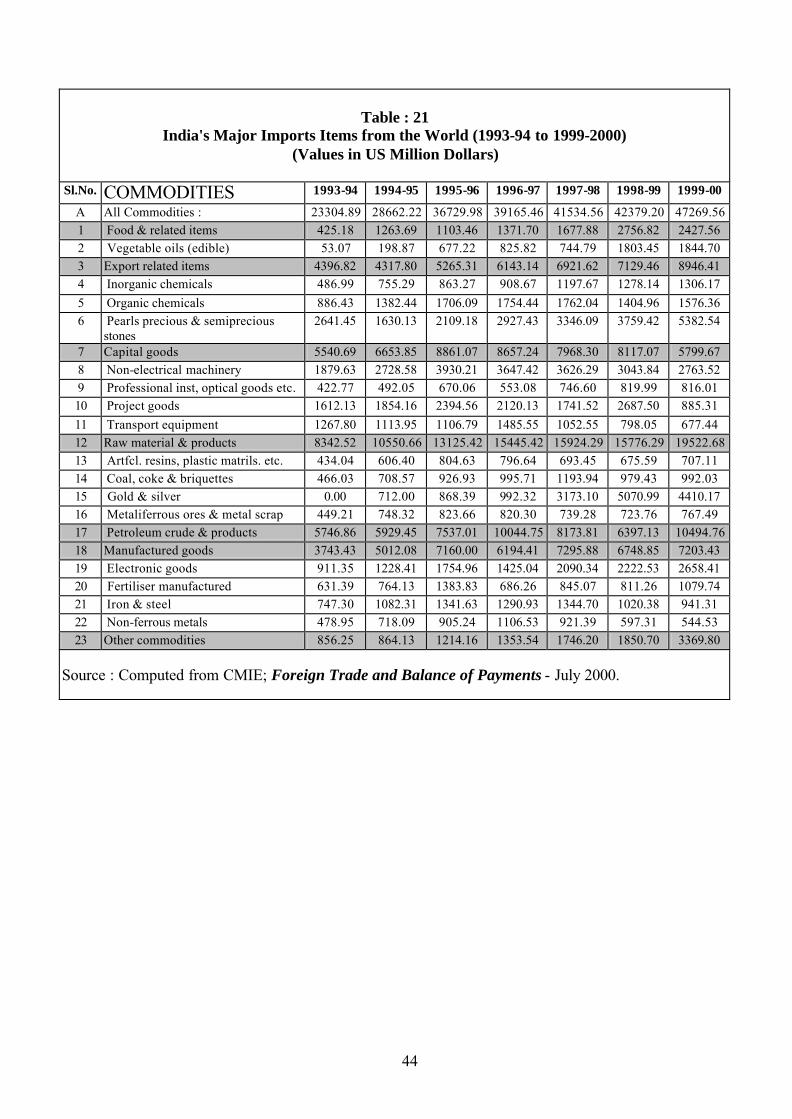
44
Table : 21 India's Major Imports Items from the World (1993-94 to 1999-2000)
(Values in US Million Dollars)
Sl.No. COMMODITIES 1993-94 1994-95 1995-96 1996-97 1997-98 1998-99 1999-00
A All Commodities : 23304.89 28662.22 36729.98 39165.46 41534.56 42379.20 47269.56 1 Food & related items 425.18 1263.69 1103.46 1371.70 1677.88 2756.82 2427.56 2 Vegetable oils (edible) 53.07 198.87 677.22 825.82 744.79 1803.45 1844.70 3 Export related items 4396.82 4317.80 5265.31 6143.14 6921.62 7129.46 8946.41 4 Inorganic chemicals 486.99 755.29 863.27 908.67 1197.67 1278.14 1306.17 5 Organic chemicals 886.43 1382.44 1706.09 1754.44 1762.04 1404.96 1576.36 6 Pearls precious & semiprecious
stones 2641.45 1630.13 2109.18 2927.43 3346.09 3759.42 5382.54
7 Capital goods 5540.69 6653.85 8861.07 8657.24 7968.30 8117.07 5799.67 8 Non-electrical machinery 1879.63 2728.58 3930.21 3647.42 3626.29 3043.84 2763.52 9 Professional inst, optical goods etc. 422.77 492.05 670.06 553.08 746.60 819.99 816.01 10 Project goods 1612.13 1854.16 2394.56 2120.13 1741.52 2687.50 885.31 11 Transport equipment 1267.80 1113.95 1106.79 1485.55 1052.55 798.05 677.44 12 Raw material & products 8342.52 10550.66 13125.42 15445.42 15924.29 15776.29 19522.68 13 Artfcl. resins, plastic matrils. etc. 434.04 606.40 804.63 796.64 693.45 675.59 707.11 14 Coal, coke & briquettes 466.03 708.57 926.93 995.71 1193.94 979.43 992.03 15 Gold & silver 0.00 712.00 868.39 992.32 3173.10 5070.99 4410.17 16 Metaliferrous ores & metal scrap 449.21 748.32 823.66 820.30 739.28 723.76 767.49 17 Petroleum crude & products 5746.86 5929.45 7537.01 10044.75 8173.81 6397.13 10494.76 18 Manufactured goods 3743.43 5012.08 7160.00 6194.41 7295.88 6748.85 7203.43 19 Electronic goods 911.35 1228.41 1754.96 1425.04 2090.34 2222.53 2658.41 20 Fertiliser manufactured 631.39 764.13 1383.83 686.26 845.07 811.26 1079.74 21 Iron & steel 747.30 1082.31 1341.63 1290.93 1344.70 1020.38 941.31 22 Non-ferrous metals 478.95 718.09 905.24 1106.53 921.39 597.31 544.53 23 Other commodities 856.25 864.13 1214.16 1353.54 1746.20 1850.70 3369.80
Source : Computed from CMIE; Foreign Trade and Balance of Payments - July 2000.
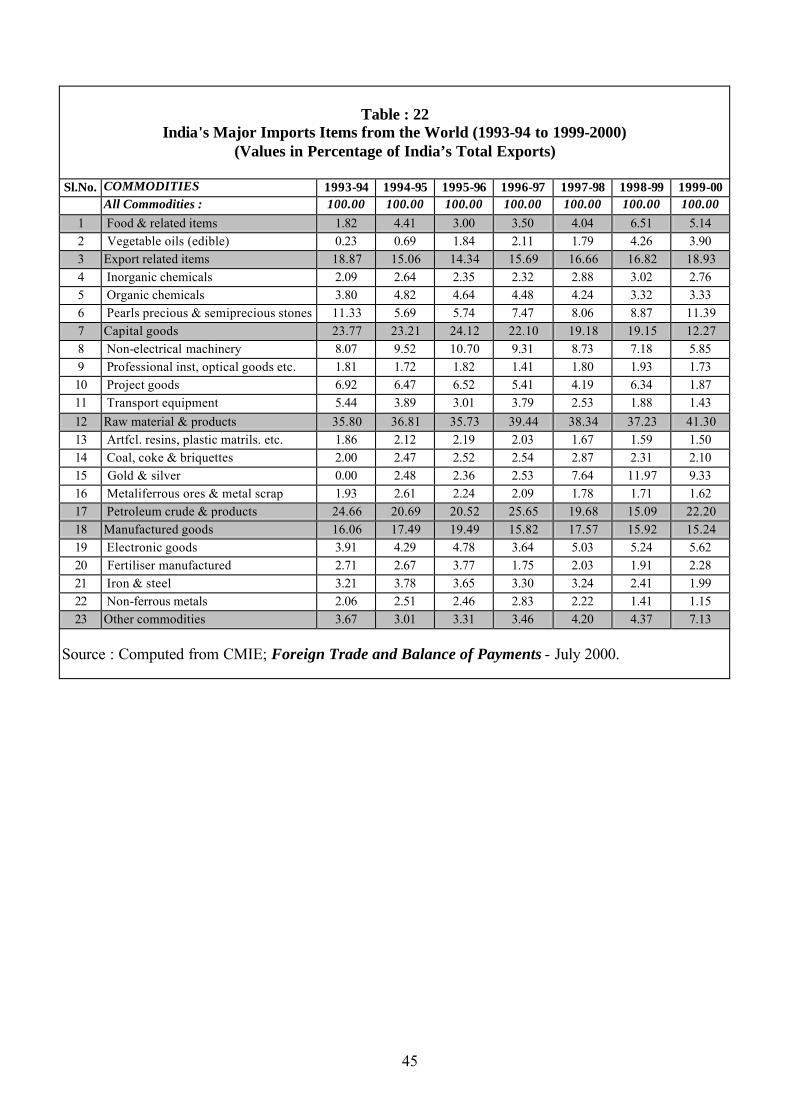
45
Table : 22 India's Major Imports Items from the World (1993-94 to 1999-2000)
(Values in Percentage of India’s Total Exports)
Sl.No. COMMODITIES 1993-94 1994-95 1995-96 1996-97 1997-98 1998-99 1999-00 All Commodities : 100.00 100.00 100.00 100.00 100.00 100.00 100.00 1 Food & related items 1.82 4.41 3.00 3.50 4.04 6.51 5.14 2 Vegetable oils (edible) 0.23 0.69 1.84 2.11 1.79 4.26 3.90 3 Export related items 18.87 15.06 14.34 15.69 16.66 16.82 18.93 4 Inorganic chemicals 2.09 2.64 2.35 2.32 2.88 3.02 2.76 5 Organic chemicals 3.80 4.82 4.64 4.48 4.24 3.32 3.33 6 Pearls precious & semiprecious stones 11.33 5.69 5.74 7.47 8.06 8.87 11.39 7 Capital goods 23.77 23.21 24.12 22.10 19.18 19.15 12.27 8 Non-electrical machinery 8.07 9.52 10.70 9.31 8.73 7.18 5.85 9 Professional inst, optical goods etc. 1.81 1.72 1.82 1.41 1.80 1.93 1.73 10 Project goods 6.92 6.47 6.52 5.41 4.19 6.34 1.87 11 Transport equipment 5.44 3.89 3.01 3.79 2.53 1.88 1.43 12 Raw material & products 35.80 36.81 35.73 39.44 38.34 37.23 41.30 13 Artfcl. resins, plastic matrils. etc. 1.86 2.12 2.19 2.03 1.67 1.59 1.50 14 Coal, coke & briquettes 2.00 2.47 2.52 2.54 2.87 2.31 2.10 15 Gold & silver 0.00 2.48 2.36 2.53 7.64 11.97 9.33 16 Metaliferrous ores & metal scrap 1.93 2.61 2.24 2.09 1.78 1.71 1.62 17 Petroleum crude & products 24.66 20.69 20.52 25.65 19.68 15.09 22.20 18 Manufactured goods 16.06 17.49 19.49 15.82 17.57 15.92 15.24 19 Electronic goods 3.91 4.29 4.78 3.64 5.03 5.24 5.62 20 Fertiliser manufactured 2.71 2.67 3.77 1.75 2.03 1.91 2.28 21 Iron & steel 3.21 3.78 3.65 3.30 3.24 2.41 1.99 22 Non-ferrous metals 2.06 2.51 2.46 2.83 2.22 1.41 1.15 23 Other commodities 3.67 3.01 3.31 3.46 4.20 4.37 7.13
Source : Computed from CMIE; Foreign Trade and Balance of Payments - July 2000.

46
Table : 23 Projections for India's Major Imports Items from the World (1999-2000 to 2025-26)
(Values in US Million Dollars)
Sl.No. COMMODITIES 1999-00 2000-01 2010-11 2020-21 2025-26 Actual Projected Projected Projected Projected
All Commodities : 47270 47542 50357 53338 54894 1 Food & related items 2428 2455 2743 3065 3241 2 Vegetable oils (edible) 1845 1874 2200 2583 2798 3 Export related items 8946 9105 10857 12946 14137 4 Inorganic chemicals 1306 1315 1403 1497 1546 5 Organic chemicals 1576 1604 1902 2256 2457 6 Pearls precious & semiprecious
stones 5383 5559 7682 10615 12479
7 Capital goods 5800 6005 8501 12035 14320 8 Non-electrical machinery 2764 2841 3746 4939 5671 9 Professional inst, optical goods etc. 816 826 930 1047 1111 10 Project goods 885 922 1387 2085 2557 11 Transport equipment 677 697 929 1238 1429 12 Raw material & products 19523 19678 21301 23059 23991 13 Artfcl. resins, plastic matrils. etc. 707 720 868 1045 1147 14 Coal, coke & briquettes 992 1001 1101 1211 1270 15 Gold & silver 4410 4491 5386 6459 7074 16 Metaliferrous ores & metal scrap 767 780 922 1089 1183 17 Petroleum crude & products 10495 10764 13865 17860 20270 18 Manufactured goods 7203 7265 7905 8601 8972 19 Electronic goods 2658 2689 3016 3383 3583 20 Fertiliser manufactured 1080 1117 1567 2198 2604 21 Iron & steel 941 974 1369 1923 2280 22 Non-ferrous metals 545 566 840 1247 1519 23 Other commodities 3370 3448 4341 5466 6133
Source : Computed from CMIE; Foreign Trade and Balance of Payments - July 2000.
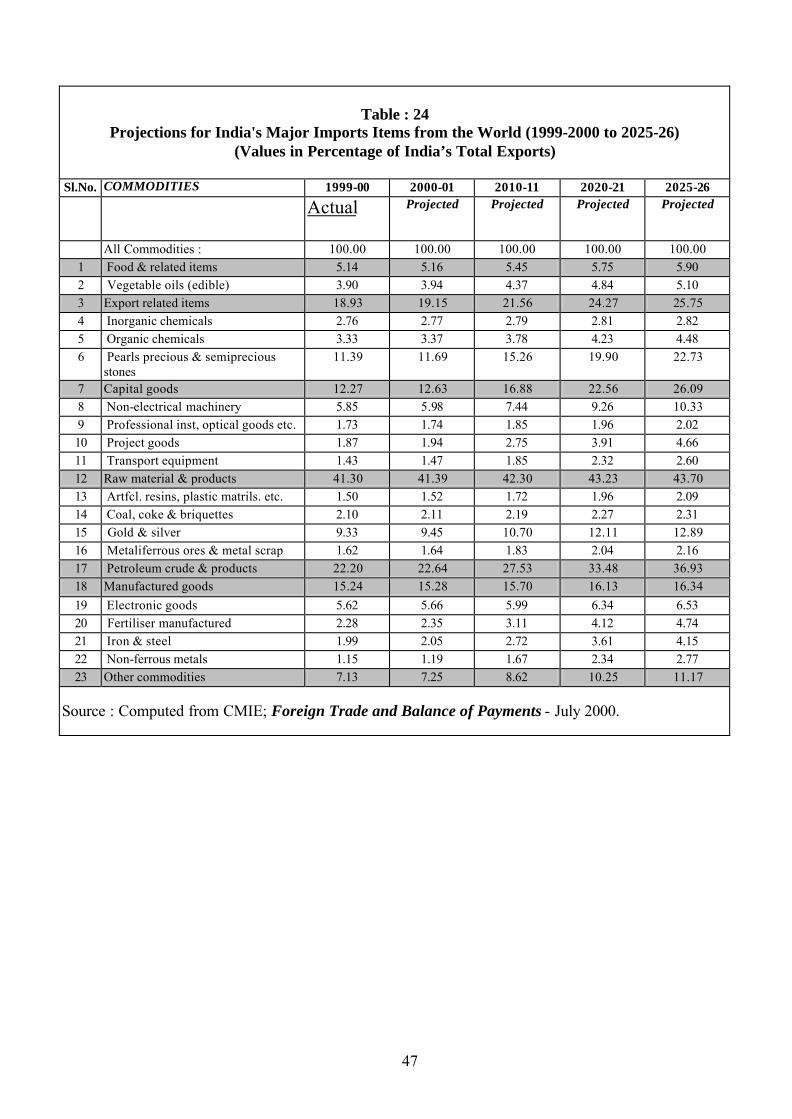
47
Table : 24 Projections for India's Major Imports Items from the World (1999-2000 to 2025-26)
(Values in Percentage of India’s Total Exports)
Sl.No. COMMODITIES 1999-00 2000-01 2010-11 2020-21 2025-26 Actual Projected Projected Projected Projected
All Commodities : 100.00 100.00 100.00 100.00 100.00 1 Food & related items 5.14 5.16 5.45 5.75 5.90 2 Vegetable oils (edible) 3.90 3.94 4.37 4.84 5.10 3 Export related items 18.93 19.15 21.56 24.27 25.75 4 Inorganic chemicals 2.76 2.77 2.79 2.81 2.82 5 Organic chemicals 3.33 3.37 3.78 4.23 4.48 6 Pearls precious & semiprecious
stones 11.39 11.69 15.26 19.90 22.73
7 Capital goods 12.27 12.63 16.88 22.56 26.09 8 Non-electrical machinery 5.85 5.98 7.44 9.26 10.33 9 Professional inst, optical goods etc. 1.73 1.74 1.85 1.96 2.02 10 Project goods 1.87 1.94 2.75 3.91 4.66 11 Transport equipment 1.43 1.47 1.85 2.32 2.60 12 Raw material & products 41.30 41.39 42.30 43.23 43.70 13 Artfcl. resins, plastic matrils. etc. 1.50 1.52 1.72 1.96 2.09 14 Coal, coke & briquettes 2.10 2.11 2.19 2.27 2.31 15 Gold & silver 9.33 9.45 10.70 12.11 12.89 16 Metaliferrous ores & metal scrap 1.62 1.64 1.83 2.04 2.16 17 Petroleum crude & products 22.20 22.64 27.53 33.48 36.93 18 Manufactured goods 15.24 15.28 15.70 16.13 16.34 19 Electronic goods 5.62 5.66 5.99 6.34 6.53 20 Fertiliser manufactured 2.28 2.35 3.11 4.12 4.74 21 Iron & steel 1.99 2.05 2.72 3.61 4.15 22 Non-ferrous metals 1.15 1.19 1.67 2.34 2.77 23 Other commodities 7.13 7.25 8.62 10.25 11.17
Source : Computed from CMIE; Foreign Trade and Balance of Payments - July 2000.

48
Table : 25
REALISTIC SCENARIO Projections for India’s Exports to the Selected Regional Trading Groupings (2000-2025)
(Values in US Billion Dollars)
Years-àà 1980 1985 1990 1995 1997 2000 2005 2010 2015 2020 2025
Actual/Projected A A A A A P P P P P P India’s Global Exports 8.00 8.27 18.18 30.75 34.25 37.13 42.47 48.59 55.59 63.60 72.76 1. APEC-21 2.83 5.14 9.47 14.56 16.44 17.60 19.70 22.05 24.68 27.63 30.93 2. ASEAN-10 0.42 0.22 0.91 2.03 2.33 2.55 2.97 3.46 4.03 4.69 5.46 3. BIMSTEC-4 1.19 0.20 0.53 1.83 1.55 1.73 2.05 2.45 2.91 3.47 4.13 4. BISTEC-3 1.19 0.20 0.53 1.80 1.51 1.68 2.00 2.38 2.83 3.37 4.01 5. EU-15 2.04 1.60 5.02 8.23 8.46 9.19 10.56 12.12 13.92 15.99 18.37 6. GCC-6 0.40 0.61 0.95 2.65 2.43 2.66 3.10 3.61 4.21 4.90 5.71 7. IOR-ARC-18 1.76 1.04 2.46 6.18 6.46 7.15 8.48 10.05 11.92 14.13 16.75 8. NAFTA-3 0.23 1.89 3.11 5.65 6.94 7.30 7.94 8.64 9.40 10.23 11.13 9. SAARC-6 0.26 0.27 0.48 1.52 1.39 1.53 1.79 2.10 2.46 2.88 3.37 Note : 1. Asia Pacific Economic Cooperation (APEC – 21): Australia, Brunei, Canada, Chile, China, Hongkong, Indonesia, Japan, south Korea, Malaysia, Mexico, NewZealand, P N Guinea, Peru, Philippines, Russia, Singapore, Taiwan, Thailand, USA and Vietnam. 2. Association of South East Nations (ASEAN-10) : Brunei, Cambodia, Indonesia, Laos, Malaysia, Mynamar, Philippines, Singapore, Thailand and Vietnam. 3. Bangladesh- India- Myanmar- Sri Lanka-Thailand Economic Cooperation (BIMSTEC-4). 4. Bangladesh-India- Sri Lanka-Thailand Economic Cooperation (BISTEC-3). 5.European Union (EU-15) : Austria, Belgium, Denmark, Finland, France, Germany, Greece, Ireland, Italy, Luxembourg, Netherlands, Portugal, Spain, Sweden and United Kingdom. 6.Gulf Cooperation Council (GCC-6) : Bahrain, Kuwait, Oman, Quattar, South Africa and UAE. 7. Indian Ocean Rim Association for Regional Cooperation (IOR-ARC-19) : Australia, Bangladesh, India, Indonesia, Iran, Kenya, Malaysia, Mauritius, Madagascar, Mozambique, Oman, Seychelles, Singapore, South Africa, Sri Lanka, Tanzania, Thailand, UAE and Yemen. 8.North America Free Trade Area (NAFTA-3) : USA, Canada and Mexico. 9. South Asia Association for Regional Cooperation (SAARC-7) : Bangladesh, Bhutan, India, Maldives, Nepal, Pakistan and Sri Lanka. Source : International Monetary Fund; Direction of Trade Statistics Yearbook, Various Issues.
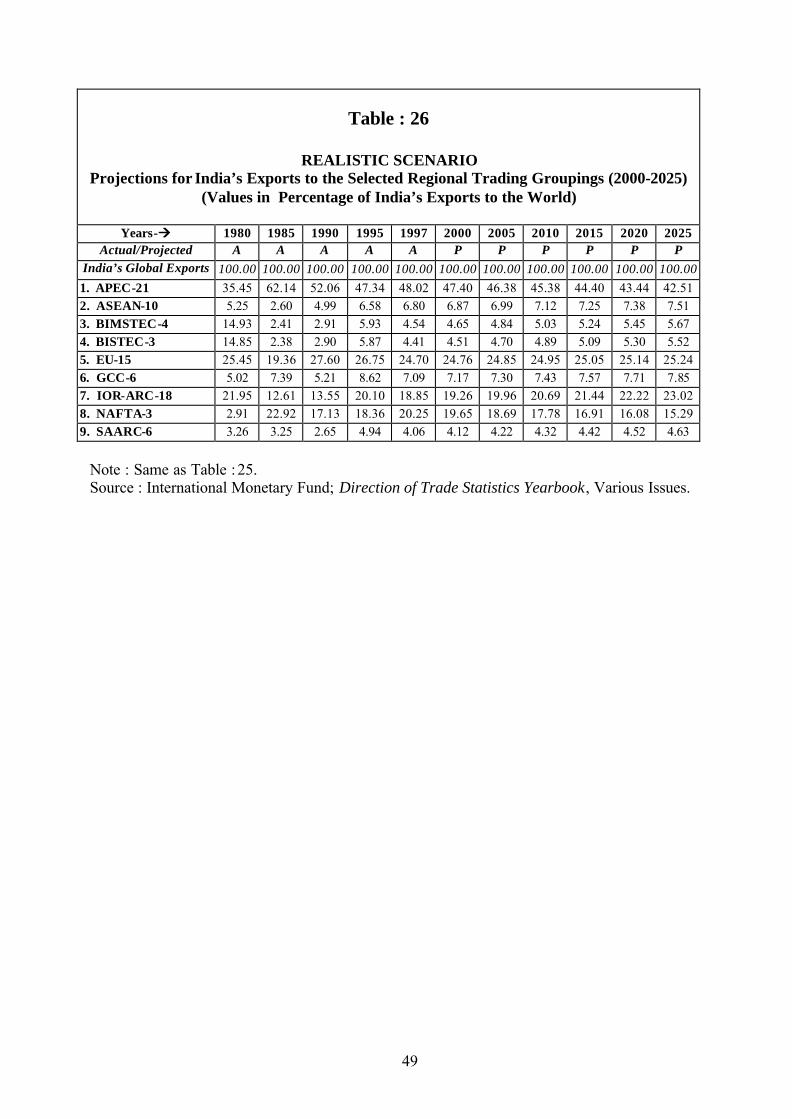
49
Table : 26
REALISTIC SCENARIO Projections for India’s Exports to the Selected Regional Trading Groupings (2000-2025)
(Values in Percentage of India’s Exports to the World)
Years-àà 1980 1985 1990 1995 1997 2000 2005 2010 2015 2020 2025 Actual/Projected A A A A A P P P P P P
India’s Global Exports 100.00 100.00 100.00 100.00 100.00 100.00 100.00 100.00 100.00 100.00 100.00 1. APEC-21 35.45 62.14 52.06 47.34 48.02 47.40 46.38 45.38 44.40 43.44 42.51 2. ASEAN-10 5.25 2.60 4.99 6.58 6.80 6.87 6.99 7.12 7.25 7.38 7.51 3. BIMSTEC-4 14.93 2.41 2.91 5.93 4.54 4.65 4.84 5.03 5.24 5.45 5.67 4. BISTEC-3 14.85 2.38 2.90 5.87 4.41 4.51 4.70 4.89 5.09 5.30 5.52 5. EU-15 25.45 19.36 27.60 26.75 24.70 24.76 24.85 24.95 25.05 25.14 25.24 6. GCC-6 5.02 7.39 5.21 8.62 7.09 7.17 7.30 7.43 7.57 7.71 7.85 7. IOR-ARC-18 21.95 12.61 13.55 20.10 18.85 19.26 19.96 20.69 21.44 22.22 23.02 8. NAFTA-3 2.91 22.92 17.13 18.36 20.25 19.65 18.69 17.78 16.91 16.08 15.29 9. SAARC-6 3.26 3.25 2.65 4.94 4.06 4.12 4.22 4.32 4.42 4.52 4.63
Note : Same as Table : 25. Source : International Monetary Fund; Direction of Trade Statistics Yearbook, Various Issues.
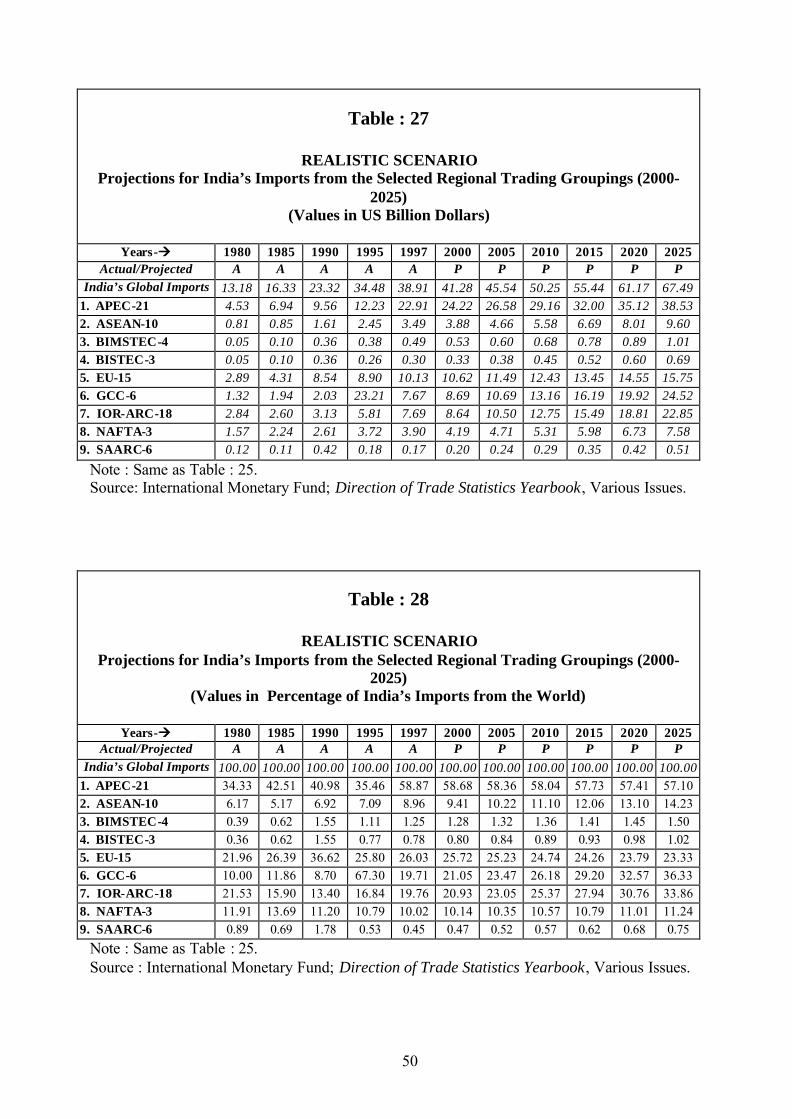
50
Table : 27
REALISTIC SCENARIO Projections for India’s Imports from the Selected Regional Trading Groupings (2000-
2025) (Values in US Billion Dollars)
Years-àà 1980 1985 1990 1995 1997 2000 2005 2010 2015 2020 2025
Actual/Projected A A A A A P P P P P P India’s Global Imports 13.18 16.33 23.32 34.48 38.91 41.28 45.54 50.25 55.44 61.17 67.49
1. APEC-21 4.53 6.94 9.56 12.23 22.91 24.22 26.58 29.16 32.00 35.12 38.53 2. ASEAN-10 0.81 0.85 1.61 2.45 3.49 3.88 4.66 5.58 6.69 8.01 9.60 3. BIMSTEC-4 0.05 0.10 0.36 0.38 0.49 0.53 0.60 0.68 0.78 0.89 1.01 4. BISTEC-3 0.05 0.10 0.36 0.26 0.30 0.33 0.38 0.45 0.52 0.60 0.69 5. EU-15 2.89 4.31 8.54 8.90 10.13 10.62 11.49 12.43 13.45 14.55 15.75 6. GCC-6 1.32 1.94 2.03 23.21 7.67 8.69 10.69 13.16 16.19 19.92 24.52 7. IOR-ARC-18 2.84 2.60 3.13 5.81 7.69 8.64 10.50 12.75 15.49 18.81 22.85 8. NAFTA-3 1.57 2.24 2.61 3.72 3.90 4.19 4.71 5.31 5.98 6.73 7.58 9. SAARC-6 0.12 0.11 0.42 0.18 0.17 0.20 0.24 0.29 0.35 0.42 0.51
Note : Same as Table : 25. Source: International Monetary Fund; Direction of Trade Statistics Yearbook, Various Issues.
Table : 28
REALISTIC SCENARIO Projections for India’s Imports from the Selected Regional Trading Groupings (2000-
2025) (Values in Percentage of India’s Imports from the World)
Years-àà 1980 1985 1990 1995 1997 2000 2005 2010 2015 2020 2025
Actual/Projected A A A A A P P P P P P India’s Global Imports 100.00 100.00 100.00 100.00 100.00 100.00 100.00 100.00 100.00 100.00 100.00
1. APEC-21 34.33 42.51 40.98 35.46 58.87 58.68 58.36 58.04 57.73 57.41 57.10 2. ASEAN-10 6.17 5.17 6.92 7.09 8.96 9.41 10.22 11.10 12.06 13.10 14.23 3. BIMSTEC-4 0.39 0.62 1.55 1.11 1.25 1.28 1.32 1.36 1.41 1.45 1.50 4. BISTEC-3 0.36 0.62 1.55 0.77 0.78 0.80 0.84 0.89 0.93 0.98 1.02 5. EU-15 21.96 26.39 36.62 25.80 26.03 25.72 25.23 24.74 24.26 23.79 23.33 6. GCC-6 10.00 11.86 8.70 67.30 19.71 21.05 23.47 26.18 29.20 32.57 36.33 7. IOR-ARC-18 21.53 15.90 13.40 16.84 19.76 20.93 23.05 25.37 27.94 30.76 33.86 8. NAFTA-3 11.91 13.69 11.20 10.79 10.02 10.14 10.35 10.57 10.79 11.01 11.24 9. SAARC-6 0.89 0.69 1.78 0.53 0.45 0.47 0.52 0.57 0.62 0.68 0.75
Note : Same as Table : 25. Source : International Monetary Fund; Direction of Trade Statistics Yearbook, Various Issues.

51
Table : 29
REALISTIC SCENARIO Projections for India's Exports to the Selected Regional Trading Groups
and Their Member Countries (1980-2025) (Values in US Million Dollars)
Country(ies)/ A A A A A P P P P P P
Sl.No. Region (s) 1980 1985 1990 1995 1997 2000 2005 2010 2015 2020 2025 World Total : 7995 8265 18183 30754 34245 37125 42473 48592 55593 63602 72764 1 Australia 122 103 223 351 402 438 504 581 669 770 887 2 Brunei na na na na na na na na na na na 3 Canada 73 112 186 292 399 435 502 579 668 771 889 4 Chile 5 0 0 49 144 162 198 241 294 359 438 5 China 127 21 38 283 615 686 822 985 1181 1416 1697 6 Hongkong 127 154 563 1821 1926 2088 2389 2733 3127 3578 4094 7 Indonesia 42 11 97 501 595 662 790 942 1125 1343 1602 8 Japan 852 921 1940 2310 1869 2051 2395 2797 3266 3814 4454 9 Malaysia 86 60 162 355 527 587 702 841 1006 1204 1441 10 Mexico 29 4 6 50 97 108 129 155 185 222 265 11 New Zealand 1 14 32 58 68 72 79 87 96 106 117 12 P.N.Guinea 3 0 1 1 1 1 1 1 2 2 2 13 Peru 9 0 1 16 13 15 18 23 28 35 43 14 Philippines 9 4 36 122 245 264 299 338 383 433 490 15 Russia 58 1693 2337 1031 815 863 950 1046 1152 1268 1396 16 S.Korea 107 73 181 394 483 541 653 788 951 1148 1385 17 Singapore 0 103 330 807 892 944 1038 1141 1254 1378 1514 18 Taiwan 38 50 197 251 402 444 523 617 727 858 1011 19 Thailand 1015 22 199 461 392 418 465 518 576 641 713 20 U.S.A 131 1778 2922 5305 6439 6758 7326 7941 8608 9331 10115 21 Vietnam 0 13 15 97 117 132 160 195 237 289 351 I. Total APEC-21 : 2834 5136 9466 14560 16444 17596 19697 22050 24683 27631 30931 1 U.S.A 131 1778 2922 5305 6439 6758 7326 7941 8608 9331 10115 2 Canada 73 112 186 292 399 435 502 579 668 771 889 3 Mexico 29 4 6 50 97 108 129 155 185 222 265 II. Total NAFTA-3 : 233 1894 3114 5647 6935 7296 7938 8638 9399 10228 11129 1 Australia 122 103 183 351 402 440 511 594 690 802 932 2 Bangladesh 82 113 297 960 649 714 838 984 1155 1355 1590 7 Indonesia 42 11 97 501 595 662 790 942 1125 1343 1602 5 Iran 0 84 76 160 169 178 195 214 234 256 281 6 Kenya 34 26 38 233 123 139 170 208 255 312 382 7 Madagascar 1 0 3 7 6 7 8 9 11 13 16 9 Malaysia 86 60 162 355 527 587 702 841 1006 1204 1441 9 Mauritius 17 12 44 135 171 188 219 255 298 347 405 10 Mozambique 7 29 23 25 30 35 41 48 57 11 Oman 15 0 56 99 104 118 146 181 224 277 342 12 Seychelles 0 1 2 3 5 6 7 8 10 12 14 17 Singapore 0 103 330 807 892 944 1038 1141 1254 1378 1514 14 South Africa 5 194 331 269 362 386 430 479 533 594 661 6 Sri Lanka 90 71 128 383 468 512 596 694 807 939 1092 16 Tanzania 30 12 27 71 70 78 92 110 130 155 184 19 Thailand 1015 22 199 461 392 418 465 518 576 641 713

52
18 UAE 203 217 455 1306 1446 1611 1930 2311 2768 3314 3969 19 Yemen 13 13 28 52 52 60 76 97 123 156 198 III. Total IOR-ARC-18 : 1755 1042 2463 6182 6456 7150 8478 10052 11918 14130 16753 1 Brunei 0 0 0 5 3 3 4 5 6 8 10 2 Combodia 0 0 0 2 2 2 3 3 4 5 6 3 Indonesia 42 11 97 501 595 662 790 942 1125 1343 1602 4 Laos na na na na na na na na na na na 5 Malaysia 86 60 162 355 527 587 702 841 1006 1204 1441 6 Myanmar 7 2 1 21 45 50 60 72 87 104 125 7 Philippines 9 4 36 122 245 264 299 338 383 433 490 8 Singapore 107 103 330 461 392 442 541 662 809 990 1210 9 Thailand 38 22 266 461 392 426 489 561 643 738 847 10 Vietnam 131 13 15 97 127 138 160 184 212 245 282 IV. Total ASEAN-10 : 420 215 907 2025 2328 2551 2971 3460 4029 4692 5464 1 Austria 21 13 70 90 89 96 108 123 139 157 178 2 Belgium 193 169 561 1109 1088 1180 1350 1544 1767 2021 2313 3 Denmark 54 31 77 147 152 168 197 232 274 322 380 4 Finland 7 6 34 46 46 52 65 82 102 127 158 5 France 255 162 474 683 726 796 928 1083 1262 1472 1717 6 Germany 505 401 1337 1841 1783 1915 2157 2430 2738 3084 3474 7 Greece 0 7 20 94 86 93 107 123 141 162 186 8 Ireland 21 9 27 46 59 66 80 97 117 142 172 9 Italy 238 169 570 974 972 1068 1249 1460 1708 1997 2336 10 Luxemburg na na na na na na na na na na na 11 Netherlands 140 133 296 711 759 830 964 1120 1301 1511 1755 12 Portugal 0 10 51 83 105 114 131 150 172 197 226 13 Spain 0 25 123 381 441 486 572 674 793 933 1098 14 Sweden 44 32 94 141 156 170 196 226 261 301 347 15 U.Kingdom 557 433 1284 1881 1997 2173 2502 2881 3316 3818 4396 V. Total EU -15 : 2035 1600 5018 8227 8459 9192 10557 12124 13924 15992 18367 1 Bangladesh 82 104 201 960 649 718 851 1007 1193 1413 1673 2 Bhutan na na na na na na na na na na na 3 Maldives na na na na na na na na na na na 4 Nepal 86 82 123 107 145 162 195 234 282 339 408 5 Pakistan 3 12 30 70 129 143 169 199 236 278 329 6 Sri Lanka 90 71 128 383 468 512 596 694 807 939 1092
VI. Toatal SAARC-6 : 261 269 482 1520 1391 1529 1791 2097 2456 2876 3368 1 Bangladesh 82 104 201 960 649 718 851 1007 1193 1413 1673 2 Myanmar 7 2 1 21 45 50 60 72 87 104 125 3 Sri Lanka 90 71 128 383 468 512 596 694 807 939 1092 4 Thailand 1015 22 199 461 392 418 465 518 576 641 713
VII. Total BIMSTEC-4 : 1194 199 529 1825 1554 1725 2054 2446 2912 3467 4128 VIII. Total BISTEC-3 : 1187 197 528 1804 1509 1676 1996 2376 2830 3370 4013
1 Bahrain 25 30 44 62 54 61 74 89 108 131 159 2 Kuwait 150 100 83 731 162 184 227 279 345 425 524 3 Oman 15 50 78 99 104 110 119 130 142 155 169 4 Quattar 8 20 24 29 38 40 45 50 55 61 68 5 Soudi Arabia 0 194 331 425 625 667 743 827 921 1026 1143 6 UAE 203 217 387 1306 1446 1612 1933 2318 2780 3333 3997
IX. Total GCC-6 : 401 611 947 2652 2429 2662 3101 3612 4208 4902 5710 Total RTGs (I to IX) : 10320 11163 23454 44442 47405 49366 52815 56505 60454 64678 69197
Note : A denotes Actual and P denotes Projected Source: International Monetary Fund; Direction of Trade Statistics Yearbook, Various Issues.
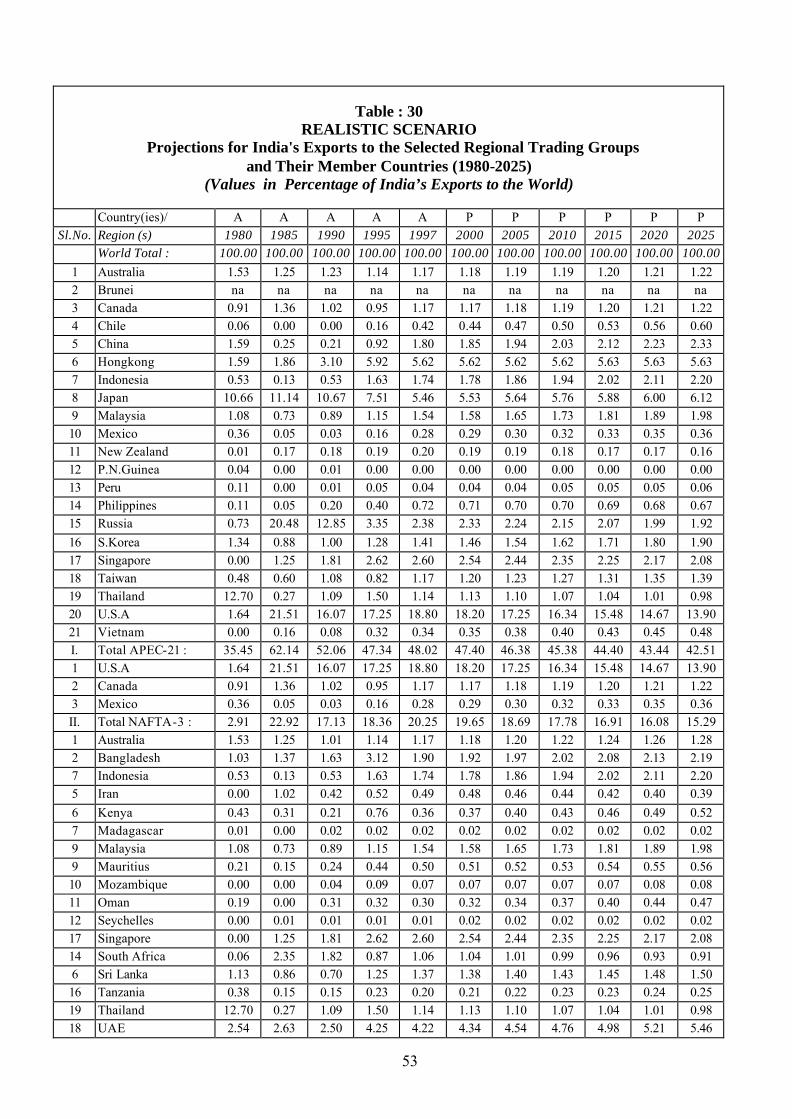
53
Table : 30 REALISTIC SCENARIO
Projections for India's Exports to the Selected Regional Trading Groups and Their Member Countries (1980-2025)
(Values in Percentage of India’s Exports to the World)
Country(ies)/ A A A A A P P P P P P Sl.No. Region (s) 1980 1985 1990 1995 1997 2000 2005 2010 2015 2020 2025
World Total : 100.00 100.00 100.00 100.00 100.00 100.00 100.00 100.00 100.00 100.00 100.00 1 Australia 1.53 1.25 1.23 1.14 1.17 1.18 1.19 1.19 1.20 1.21 1.22 2 Brunei na na na na na na na na na na na 3 Canada 0.91 1.36 1.02 0.95 1.17 1.17 1.18 1.19 1.20 1.21 1.22 4 Chile 0.06 0.00 0.00 0.16 0.42 0.44 0.47 0.50 0.53 0.56 0.60 5 China 1.59 0.25 0.21 0.92 1.80 1.85 1.94 2.03 2.12 2.23 2.33 6 Hongkong 1.59 1.86 3.10 5.92 5.62 5.62 5.62 5.62 5.63 5.63 5.63 7 Indonesia 0.53 0.13 0.53 1.63 1.74 1.78 1.86 1.94 2.02 2.11 2.20 8 Japan 10.66 11.14 10.67 7.51 5.46 5.53 5.64 5.76 5.88 6.00 6.12 9 Malaysia 1.08 0.73 0.89 1.15 1.54 1.58 1.65 1.73 1.81 1.89 1.98 10 Mexico 0.36 0.05 0.03 0.16 0.28 0.29 0.30 0.32 0.33 0.35 0.36 11 New Zealand 0.01 0.17 0.18 0.19 0.20 0.19 0.19 0.18 0.17 0.17 0.16 12 P.N.Guinea 0.04 0.00 0.01 0.00 0.00 0.00 0.00 0.00 0.00 0.00 0.00 13 Peru 0.11 0.00 0.01 0.05 0.04 0.04 0.04 0.05 0.05 0.05 0.06 14 Philippines 0.11 0.05 0.20 0.40 0.72 0.71 0.70 0.70 0.69 0.68 0.67 15 Russia 0.73 20.48 12.85 3.35 2.38 2.33 2.24 2.15 2.07 1.99 1.92 16 S.Korea 1.34 0.88 1.00 1.28 1.41 1.46 1.54 1.62 1.71 1.80 1.90 17 Singapore 0.00 1.25 1.81 2.62 2.60 2.54 2.44 2.35 2.25 2.17 2.08 18 Taiwan 0.48 0.60 1.08 0.82 1.17 1.20 1.23 1.27 1.31 1.35 1.39 19 Thailand 12.70 0.27 1.09 1.50 1.14 1.13 1.10 1.07 1.04 1.01 0.98 20 U.S.A 1.64 21.51 16.07 17.25 18.80 18.20 17.25 16.34 15.48 14.67 13.90 21 Vietnam 0.00 0.16 0.08 0.32 0.34 0.35 0.38 0.40 0.43 0.45 0.48 I. Total APEC-21 : 35.45 62.14 52.06 47.34 48.02 47.40 46.38 45.38 44.40 43.44 42.51 1 U.S.A 1.64 21.51 16.07 17.25 18.80 18.20 17.25 16.34 15.48 14.67 13.90 2 Canada 0.91 1.36 1.02 0.95 1.17 1.17 1.18 1.19 1.20 1.21 1.22 3 Mexico 0.36 0.05 0.03 0.16 0.28 0.29 0.30 0.32 0.33 0.35 0.36 II. Total NAFTA-3 : 2.91 22.92 17.13 18.36 20.25 19.65 18.69 17.78 16.91 16.08 15.29 1 Australia 1.53 1.25 1.01 1.14 1.17 1.18 1.20 1.22 1.24 1.26 1.28 2 Bangladesh 1.03 1.37 1.63 3.12 1.90 1.92 1.97 2.02 2.08 2.13 2.19 7 Indonesia 0.53 0.13 0.53 1.63 1.74 1.78 1.86 1.94 2.02 2.11 2.20 5 Iran 0.00 1.02 0.42 0.52 0.49 0.48 0.46 0.44 0.42 0.40 0.39 6 Kenya 0.43 0.31 0.21 0.76 0.36 0.37 0.40 0.43 0.46 0.49 0.52 7 Madagascar 0.01 0.00 0.02 0.02 0.02 0.02 0.02 0.02 0.02 0.02 0.02 9 Malaysia 1.08 0.73 0.89 1.15 1.54 1.58 1.65 1.73 1.81 1.89 1.98 9 Mauritius 0.21 0.15 0.24 0.44 0.50 0.51 0.52 0.53 0.54 0.55 0.56 10 Mozambique 0.00 0.00 0.04 0.09 0.07 0.07 0.07 0.07 0.07 0.08 0.08 11 Oman 0.19 0.00 0.31 0.32 0.30 0.32 0.34 0.37 0.40 0.44 0.47 12 Seychelles 0.00 0.01 0.01 0.01 0.01 0.02 0.02 0.02 0.02 0.02 0.02 17 Singapore 0.00 1.25 1.81 2.62 2.60 2.54 2.44 2.35 2.25 2.17 2.08 14 South Africa 0.06 2.35 1.82 0.87 1.06 1.04 1.01 0.99 0.96 0.93 0.91 6 Sri Lanka 1.13 0.86 0.70 1.25 1.37 1.38 1.40 1.43 1.45 1.48 1.50 16 Tanzania 0.38 0.15 0.15 0.23 0.20 0.21 0.22 0.23 0.23 0.24 0.25 19 Thailand 12.70 0.27 1.09 1.50 1.14 1.13 1.10 1.07 1.04 1.01 0.98 18 UAE 2.54 2.63 2.50 4.25 4.22 4.34 4.54 4.76 4.98 5.21 5.46
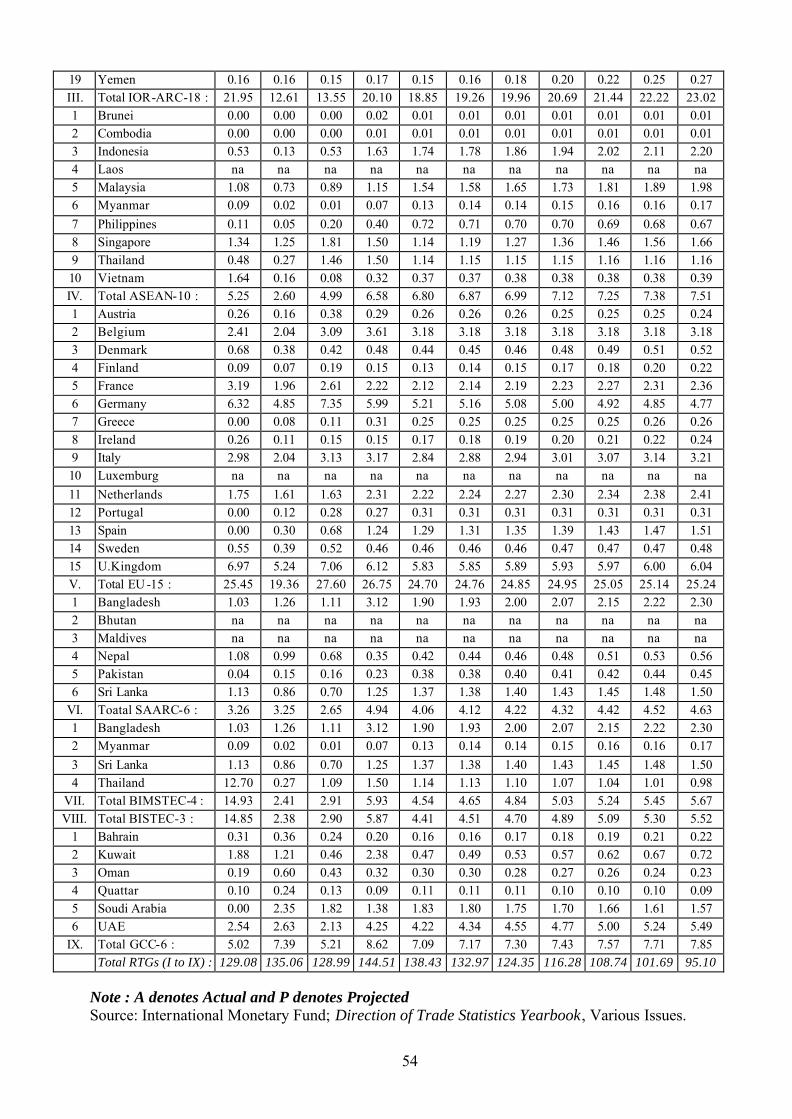
54
19 Yemen 0.16 0.16 0.15 0.17 0.15 0.16 0.18 0.20 0.22 0.25 0.27 III. Total IOR-ARC-18 : 21.95 12.61 13.55 20.10 18.85 19.26 19.96 20.69 21.44 22.22 23.02 1 Brunei 0.00 0.00 0.00 0.02 0.01 0.01 0.01 0.01 0.01 0.01 0.01 2 Combodia 0.00 0.00 0.00 0.01 0.01 0.01 0.01 0.01 0.01 0.01 0.01 3 Indonesia 0.53 0.13 0.53 1.63 1.74 1.78 1.86 1.94 2.02 2.11 2.20 4 Laos na na na na na na na na na na na 5 Malaysia 1.08 0.73 0.89 1.15 1.54 1.58 1.65 1.73 1.81 1.89 1.98 6 Myanmar 0.09 0.02 0.01 0.07 0.13 0.14 0.14 0.15 0.16 0.16 0.17 7 Philippines 0.11 0.05 0.20 0.40 0.72 0.71 0.70 0.70 0.69 0.68 0.67 8 Singapore 1.34 1.25 1.81 1.50 1.14 1.19 1.27 1.36 1.46 1.56 1.66 9 Thailand 0.48 0.27 1.46 1.50 1.14 1.15 1.15 1.15 1.16 1.16 1.16 10 Vietnam 1.64 0.16 0.08 0.32 0.37 0.37 0.38 0.38 0.38 0.38 0.39 IV. Total ASEAN-10 : 5.25 2.60 4.99 6.58 6.80 6.87 6.99 7.12 7.25 7.38 7.51 1 Austria 0.26 0.16 0.38 0.29 0.26 0.26 0.26 0.25 0.25 0.25 0.24 2 Belgium 2.41 2.04 3.09 3.61 3.18 3.18 3.18 3.18 3.18 3.18 3.18 3 Denmark 0.68 0.38 0.42 0.48 0.44 0.45 0.46 0.48 0.49 0.51 0.52 4 Finland 0.09 0.07 0.19 0.15 0.13 0.14 0.15 0.17 0.18 0.20 0.22 5 France 3.19 1.96 2.61 2.22 2.12 2.14 2.19 2.23 2.27 2.31 2.36 6 Germany 6.32 4.85 7.35 5.99 5.21 5.16 5.08 5.00 4.92 4.85 4.77 7 Greece 0.00 0.08 0.11 0.31 0.25 0.25 0.25 0.25 0.25 0.26 0.26 8 Ireland 0.26 0.11 0.15 0.15 0.17 0.18 0.19 0.20 0.21 0.22 0.24 9 Italy 2.98 2.04 3.13 3.17 2.84 2.88 2.94 3.01 3.07 3.14 3.21 10 Luxemburg na na na na na na na na na na na 11 Netherlands 1.75 1.61 1.63 2.31 2.22 2.24 2.27 2.30 2.34 2.38 2.41 12 Portugal 0.00 0.12 0.28 0.27 0.31 0.31 0.31 0.31 0.31 0.31 0.31 13 Spain 0.00 0.30 0.68 1.24 1.29 1.31 1.35 1.39 1.43 1.47 1.51 14 Sweden 0.55 0.39 0.52 0.46 0.46 0.46 0.46 0.47 0.47 0.47 0.48 15 U.Kingdom 6.97 5.24 7.06 6.12 5.83 5.85 5.89 5.93 5.97 6.00 6.04 V. Total EU -15 : 25.45 19.36 27.60 26.75 24.70 24.76 24.85 24.95 25.05 25.14 25.24 1 Bangladesh 1.03 1.26 1.11 3.12 1.90 1.93 2.00 2.07 2.15 2.22 2.30 2 Bhutan na na na na na na na na na na na 3 Maldives na na na na na na na na na na na 4 Nepal 1.08 0.99 0.68 0.35 0.42 0.44 0.46 0.48 0.51 0.53 0.56 5 Pakistan 0.04 0.15 0.16 0.23 0.38 0.38 0.40 0.41 0.42 0.44 0.45 6 Sri Lanka 1.13 0.86 0.70 1.25 1.37 1.38 1.40 1.43 1.45 1.48 1.50
VI. Toatal SAARC-6 : 3.26 3.25 2.65 4.94 4.06 4.12 4.22 4.32 4.42 4.52 4.63 1 Bangladesh 1.03 1.26 1.11 3.12 1.90 1.93 2.00 2.07 2.15 2.22 2.30 2 Myanmar 0.09 0.02 0.01 0.07 0.13 0.14 0.14 0.15 0.16 0.16 0.17 3 Sri Lanka 1.13 0.86 0.70 1.25 1.37 1.38 1.40 1.43 1.45 1.48 1.50 4 Thailand 12.70 0.27 1.09 1.50 1.14 1.13 1.10 1.07 1.04 1.01 0.98
VII. Total BIMSTEC-4 : 14.93 2.41 2.91 5.93 4.54 4.65 4.84 5.03 5.24 5.45 5.67 VIII. Total BISTEC-3 : 14.85 2.38 2.90 5.87 4.41 4.51 4.70 4.89 5.09 5.30 5.52
1 Bahrain 0.31 0.36 0.24 0.20 0.16 0.16 0.17 0.18 0.19 0.21 0.22 2 Kuwait 1.88 1.21 0.46 2.38 0.47 0.49 0.53 0.57 0.62 0.67 0.72 3 Oman 0.19 0.60 0.43 0.32 0.30 0.30 0.28 0.27 0.26 0.24 0.23 4 Quattar 0.10 0.24 0.13 0.09 0.11 0.11 0.11 0.10 0.10 0.10 0.09 5 Soudi Arabia 0.00 2.35 1.82 1.38 1.83 1.80 1.75 1.70 1.66 1.61 1.57 6 UAE 2.54 2.63 2.13 4.25 4.22 4.34 4.55 4.77 5.00 5.24 5.49
IX. Total GCC-6 : 5.02 7.39 5.21 8.62 7.09 7.17 7.30 7.43 7.57 7.71 7.85 Total RTGs (I to IX) : 129.08 135.06 128.99 144.51 138.43 132.97 124.35 116.28 108.74 101.69 95.10
Note : A denotes Actual and P denotes Projected Source: International Monetary Fund; Direction of Trade Statistics Yearbook, Various Issues.
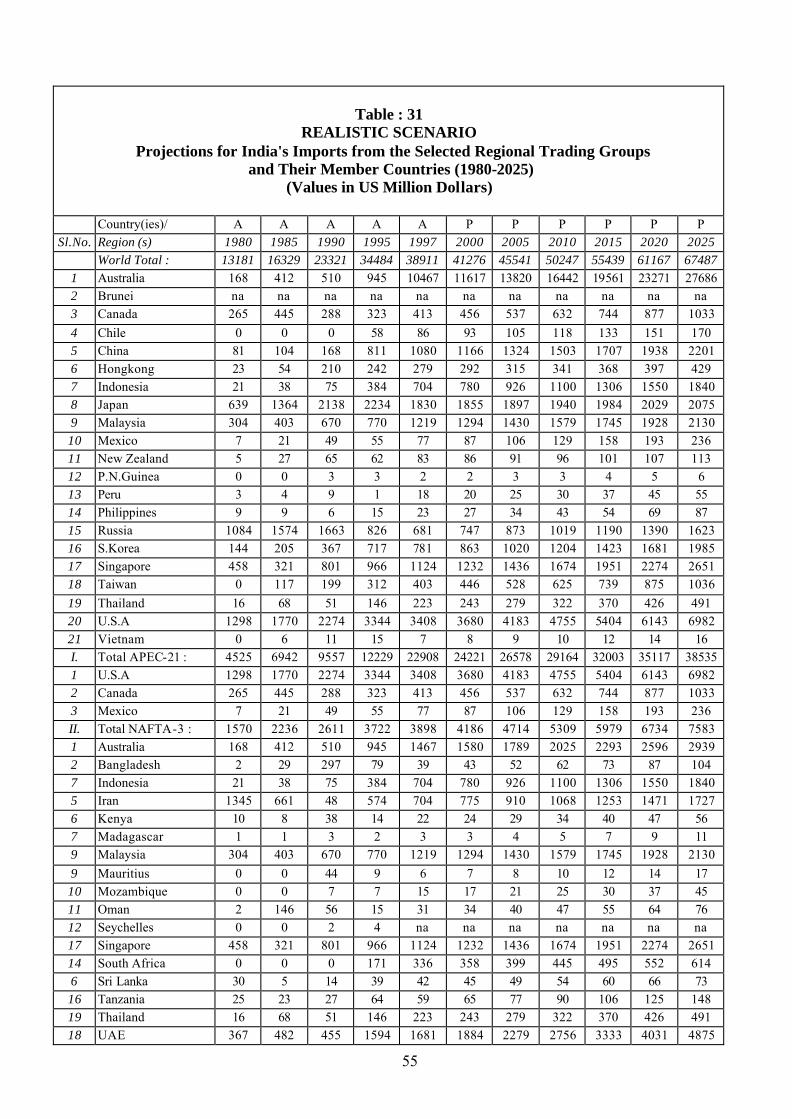
55
Table : 31 REALISTIC SCENARIO
Projections for India's Imports from the Selected Regional Trading Groups and Their Member Countries (1980-2025)
(Values in US Million Dollars)
Country(ies)/ A A A A A P P P P P P Sl.No. Region (s) 1980 1985 1990 1995 1997 2000 2005 2010 2015 2020 2025
World Total : 13181 16329 23321 34484 38911 41276 45541 50247 55439 61167 67487 1 Australia 168 412 510 945 10467 11617 13820 16442 19561 23271 27686 2 Brunei na na na na na na na na na na na 3 Canada 265 445 288 323 413 456 537 632 744 877 1033 4 Chile 0 0 0 58 86 93 105 118 133 151 170 5 China 81 104 168 811 1080 1166 1324 1503 1707 1938 2201 6 Hongkong 23 54 210 242 279 292 315 341 368 397 429 7 Indonesia 21 38 75 384 704 780 926 1100 1306 1550 1840 8 Japan 639 1364 2138 2234 1830 1855 1897 1940 1984 2029 2075 9 Malaysia 304 403 670 770 1219 1294 1430 1579 1745 1928 2130 10 Mexico 7 21 49 55 77 87 106 129 158 193 236 11 New Zealand 5 27 65 62 83 86 91 96 101 107 113 12 P.N.Guinea 0 0 3 3 2 2 3 3 4 5 6 13 Peru 3 4 9 1 18 20 25 30 37 45 55 14 Philippines 9 9 6 15 23 27 34 43 54 69 87 15 Russia 1084 1574 1663 826 681 747 873 1019 1190 1390 1623 16 S.Korea 144 205 367 717 781 863 1020 1204 1423 1681 1985 17 Singapore 458 321 801 966 1124 1232 1436 1674 1951 2274 2651 18 Taiwan 0 117 199 312 403 446 528 625 739 875 1036 19 Thailand 16 68 51 146 223 243 279 322 370 426 491 20 U.S.A 1298 1770 2274 3344 3408 3680 4183 4755 5404 6143 6982 21 Vietnam 0 6 11 15 7 8 9 10 12 14 16 I. Total APEC-21 : 4525 6942 9557 12229 22908 24221 26578 29164 32003 35117 38535 1 U.S.A 1298 1770 2274 3344 3408 3680 4183 4755 5404 6143 6982 2 Canada 265 445 288 323 413 456 537 632 744 877 1033 3 Mexico 7 21 49 55 77 87 106 129 158 193 236 II. Total NAFTA-3 : 1570 2236 2611 3722 3898 4186 4714 5309 5979 6734 7583 1 Australia 168 412 510 945 1467 1580 1789 2025 2293 2596 2939 2 Bangladesh 2 29 297 79 39 43 52 62 73 87 104 7 Indonesia 21 38 75 384 704 780 926 1100 1306 1550 1840 5 Iran 1345 661 48 574 704 775 910 1068 1253 1471 1727 6 Kenya 10 8 38 14 22 24 29 34 40 47 56 7 Madagascar 1 1 3 2 3 3 4 5 7 9 11 9 Malaysia 304 403 670 770 1219 1294 1430 1579 1745 1928 2130 9 Mauritius 0 0 44 9 6 7 8 10 12 14 17 10 Mozambique 0 0 7 7 15 17 21 25 30 37 45 11 Oman 2 146 56 15 31 34 40 47 55 64 76 12 Seychelles 0 0 2 4 na na na na na na na 17 Singapore 458 321 801 966 1124 1232 1436 1674 1951 2274 2651 14 South Africa 0 0 0 171 336 358 399 445 495 552 614 6 Sri Lanka 30 5 14 39 42 45 49 54 60 66 73 16 Tanzania 25 23 27 64 59 65 77 90 106 125 148 19 Thailand 16 68 51 146 223 243 279 322 370 426 491 18 UAE 367 482 455 1594 1681 1884 2279 2756 3333 4031 4875
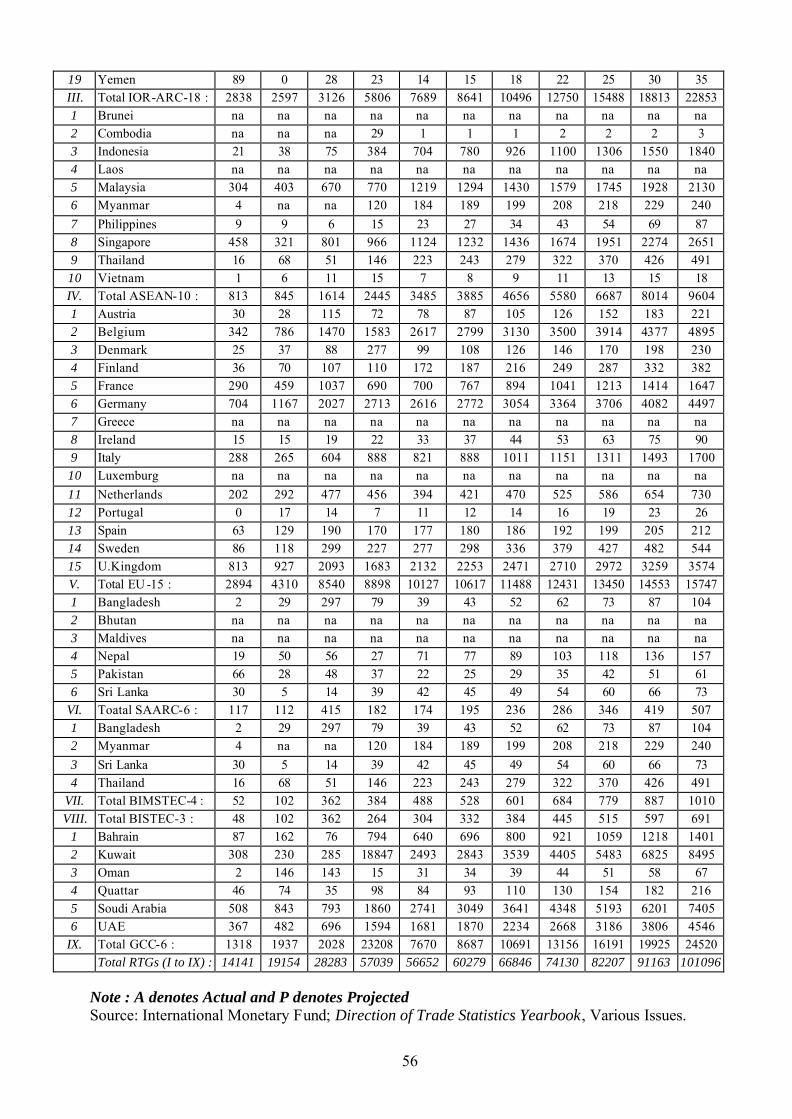
56
19 Yemen 89 0 28 23 14 15 18 22 25 30 35 III. Total IOR-ARC-18 : 2838 2597 3126 5806 7689 8641 10496 12750 15488 18813 22853 1 Brunei na na na na na na na na na na na 2 Combodia na na na 29 1 1 1 2 2 2 3 3 Indonesia 21 38 75 384 704 780 926 1100 1306 1550 1840 4 Laos na na na na na na na na na na na 5 Malaysia 304 403 670 770 1219 1294 1430 1579 1745 1928 2130 6 Myanmar 4 na na 120 184 189 199 208 218 229 240 7 Philippines 9 9 6 15 23 27 34 43 54 69 87 8 Singapore 458 321 801 966 1124 1232 1436 1674 1951 2274 2651 9 Thailand 16 68 51 146 223 243 279 322 370 426 491 10 Vietnam 1 6 11 15 7 8 9 11 13 15 18 IV. Total ASEAN-10 : 813 845 1614 2445 3485 3885 4656 5580 6687 8014 9604 1 Austria 30 28 115 72 78 87 105 126 152 183 221 2 Belgium 342 786 1470 1583 2617 2799 3130 3500 3914 4377 4895 3 Denmark 25 37 88 277 99 108 126 146 170 198 230 4 Finland 36 70 107 110 172 187 216 249 287 332 382 5 France 290 459 1037 690 700 767 894 1041 1213 1414 1647 6 Germany 704 1167 2027 2713 2616 2772 3054 3364 3706 4082 4497 7 Greece na na na na na na na na na na na 8 Ireland 15 15 19 22 33 37 44 53 63 75 90 9 Italy 288 265 604 888 821 888 1011 1151 1311 1493 1700 10 Luxemburg na na na na na na na na na na na 11 Netherlands 202 292 477 456 394 421 470 525 586 654 730 12 Portugal 0 17 14 7 11 12 14 16 19 23 26 13 Spain 63 129 190 170 177 180 186 192 199 205 212 14 Sweden 86 118 299 227 277 298 336 379 427 482 544 15 U.Kingdom 813 927 2093 1683 2132 2253 2471 2710 2972 3259 3574 V. Total EU -15 : 2894 4310 8540 8898 10127 10617 11488 12431 13450 14553 15747 1 Bangladesh 2 29 297 79 39 43 52 62 73 87 104 2 Bhutan na na na na na na na na na na na 3 Maldives na na na na na na na na na na na 4 Nepal 19 50 56 27 71 77 89 103 118 136 157 5 Pakistan 66 28 48 37 22 25 29 35 42 51 61 6 Sri Lanka 30 5 14 39 42 45 49 54 60 66 73
VI. Toatal SAARC-6 : 117 112 415 182 174 195 236 286 346 419 507 1 Bangladesh 2 29 297 79 39 43 52 62 73 87 104 2 Myanmar 4 na na 120 184 189 199 208 218 229 240 3 Sri Lanka 30 5 14 39 42 45 49 54 60 66 73 4 Thailand 16 68 51 146 223 243 279 322 370 426 491
VII. Total BIMSTEC-4 : 52 102 362 384 488 528 601 684 779 887 1010 VIII. Total BISTEC-3 : 48 102 362 264 304 332 384 445 515 597 691
1 Bahrain 87 162 76 794 640 696 800 921 1059 1218 1401 2 Kuwait 308 230 285 18847 2493 2843 3539 4405 5483 6825 8495 3 Oman 2 146 143 15 31 34 39 44 51 58 67 4 Quattar 46 74 35 98 84 93 110 130 154 182 216 5 Soudi Arabia 508 843 793 1860 2741 3049 3641 4348 5193 6201 7405 6 UAE 367 482 696 1594 1681 1870 2234 2668 3186 3806 4546
IX. Total GCC-6 : 1318 1937 2028 23208 7670 8687 10691 13156 16191 19925 24520 Total RTGs (I to IX) : 14141 19154 28283 57039 56652 60279 66846 74130 82207 91163 101096
Note : A denotes Actual and P denotes Projected Source: International Monetary Fund; Direction of Trade Statistics Yearbook, Various Issues.

57
Table : 32 REALISTIC SCENARIO
Projections for India's Imports from the Selected Regional Trading Groups and Their Member Countries (1980-2025)
(Values in Percentage of India’s Imports from the World)
Country(ies)/ A A A A A P P P P P P
Sl.No. Region (s) 1980 1985 1990 1995 1997 2000 2005 2010 2015 2020 2025 World Total : 100.00 100.00 100.00 100.00 100.00 100.00 100.00 100.00 100.00 100.00 100.00 1 Australia 1.27 2.52 2.19 2.74 26.90 28.14 30.35 32.72 35.28 38.05 41.02 2 Brunei na na na na na na na na na na na 3 Canada 2.01 2.73 1.23 0.94 1.06 1.10 1.18 1.26 1.34 1.43 1.53 4 Chile 0.00 0.00 0.00 0.17 0.22 0.22 0.23 0.24 0.24 0.25 0.25 5 China 0.61 0.64 0.72 2.35 2.78 2.82 2.91 2.99 3.08 3.17 3.26 6 Hongkong 0.17 0.33 0.90 0.70 0.72 0.71 0.69 0.68 0.66 0.65 0.64 7 Indonesia 0.16 0.23 0.32 1.11 1.81 1.89 2.03 2.19 2.36 2.53 2.73 8 Japan 4.85 8.35 9.17 6.48 4.70 4.49 4.17 3.86 3.58 3.32 3.07 9 Malaysia 2.31 2.47 2.87 2.23 3.13 3.14 3.14 3.14 3.15 3.15 3.16 10 Mexico 0.05 0.13 0.21 0.16 0.20 0.21 0.23 0.26 0.29 0.32 0.35 11 New Zealand 0.04 0.17 0.28 0.18 0.21 0.21 0.20 0.19 0.18 0.18 0.17 12 P.N.Guinea 0.00 0.00 0.01 0.01 0.01 0.01 0.01 0.01 0.01 0.01 0.01 13 Peru 0.02 0.02 0.04 0.00 0.05 0.05 0.05 0.06 0.07 0.07 0.08 14 Philippines 0.07 0.06 0.03 0.04 0.06 0.06 0.07 0.08 0.10 0.11 0.13 15 Russia 8.22 9.64 7.13 2.40 1.75 1.81 1.92 2.03 2.15 2.27 2.40 16 S.Korea 1.09 1.26 1.57 2.08 2.01 2.09 2.24 2.40 2.57 2.75 2.94 17 Singapore 3.47 1.97 3.43 2.80 2.89 2.99 3.15 3.33 3.52 3.72 3.93 18 Taiwan 0.00 0.72 0.85 0.90 1.04 1.08 1.16 1.24 1.33 1.43 1.53 19 Thailand 0.12 0.42 0.22 0.42 0.57 0.59 0.61 0.64 0.67 0.70 0.73 20 U.S.A 9.85 10.84 9.75 9.70 8.76 8.92 9.19 9.46 9.75 10.04 10.35 21 Vietnam 0.00 0.04 0.05 0.04 0.02 0.02 0.02 0.02 0.02 0.02 0.02 I. Total APEC-21 : 34.33 42.51 40.98 35.46 58.87 58.68 58.36 58.04 57.73 57.41 57.10 1 U.S.A 9.85 10.84 9.75 9.70 8.76 8.92 9.19 9.46 9.75 10.04 10.35 2 Canada 2.01 2.73 1.23 0.94 1.06 1.10 1.18 1.26 1.34 1.43 1.53 3 Mexico 0.05 0.13 0.21 0.16 0.20 0.21 0.23 0.26 0.29 0.32 0.35 II. Total NAFTA-3 : 11.91 13.69 11.20 10.79 10.02 10.14 10.35 10.57 10.79 11.01 11.24 1 Australia 1.27 2.52 2.19 2.74 3.77 3.83 3.93 4.03 4.14 4.24 4.35 2 Bangladesh 0.02 0.18 1.27 0.23 0.10 0.10 0.11 0.12 0.13 0.14 0.15 7 Indonesia 0.16 0.23 0.32 1.11 1.81 1.89 2.03 2.19 2.36 2.53 2.73 5 Iran 10.20 4.05 0.21 1.66 1.81 1.88 2.00 2.12 2.26 2.40 2.56 6 Kenya 0.08 0.05 0.16 0.04 0.06 0.06 0.06 0.07 0.07 0.08 0.08 7 Madagascar 0.01 0.01 0.01 0.01 0.01 0.01 0.01 0.01 0.01 0.01 0.02 9 Malaysia 2.31 2.47 2.87 2.23 3.13 3.14 3.14 3.14 3.15 3.15 3.16 9 Mauritius 0.00 0.00 0.19 0.03 0.02 0.02 0.02 0.02 0.02 0.02 0.02 10 Mozambique 0.00 0.00 0.03 0.02 0.04 0.04 0.05 0.05 0.05 0.06 0.07 11 Oman 0.02 0.89 0.24 0.04 0.08 0.08 0.09 0.09 0.10 0.11 0.11 12 Seychelles 0.00 0.00 0.01 0.01 0.00 0.00 0.00 0.00 0.00 0.00 0.00 17 Singapore 3.47 1.97 3.43 2.80 2.89 2.99 3.15 3.33 3.52 3.72 3.93 14 South Africa 0.00 0.00 0.00 0.50 0.86 0.87 0.88 0.88 0.89 0.90 0.91 6 Sri Lanka 0.23 0.03 0.06 0.11 0.11 0.11 0.11 0.11 0.11 0.11 0.11 16 Tanzania 0.19 0.14 0.12 0.19 0.15 0.16 0.17 0.18 0.19 0.20 0.22 19 Thailand 0.12 0.42 0.22 0.42 0.57 0.59 0.61 0.64 0.67 0.70 0.73
58
18 UAE 2.78 2.95 1.95 4.62 4.32 4.56 5.00 5.48 6.01 6.59 7.22 19 Yemen 0.68 0.00 0.12 0.07 0.04 0.04 0.04 0.04 0.05 0.05 0.05 III. Total IOR-ARC-18 : 21.53 15.90 13.40 16.84 19.76 20.93 23.05 25.37 27.94 30.76 33.86 1 Brunei na na na na na na na na na na na 2 Combodia na na na na na na na na na na na 3 Indonesia 0.16 0.23 0.32 1.11 1.81 1.89 2.03 2.19 2.36 2.53 2.73 4 Laos 0.00 0.00 0.00 0.00 0.00 0.00 0.00 0.00 0.00 0.00 0.00 5 Malaysia 2.31 2.47 2.87 2.23 3.13 3.14 3.14 3.14 3.15 3.15 3.16 6 Myanmar 0.03 0.00 0.00 0.35 0.47 0.46 0.44 0.41 0.39 0.37 0.36 7 Philippines 0.07 0.06 0.03 0.04 0.06 0.06 0.07 0.08 0.10 0.11 0.13 8 Singapore 3.47 1.97 3.43 2.80 2.89 2.99 3.15 3.33 3.52 3.72 3.93 9 Thailand 0.12 0.42 0.22 0.42 0.57 0.59 0.61 0.64 0.67 0.70 0.73 10 Vietnam 0.01 0.04 0.05 0.04 0.02 0.02 0.02 0.02 0.02 0.02 0.03 IV. Total ASEAN-10 : 6.17 5.17 6.92 7.09 8.96 9.41 10.22 11.10 12.06 13.10 14.23 1 Austria 0.23 0.17 0.49 0.21 0.20 0.21 0.23 0.25 0.27 0.30 0.33 2 Belgium 2.59 4.81 6.30 4.59 6.73 6.78 6.87 6.97 7.06 7.16 7.25 3 Denmark 0.19 0.23 0.38 0.80 0.25 0.26 0.28 0.29 0.31 0.32 0.34 4 Finland 0.27 0.43 0.46 0.32 0.44 0.45 0.47 0.50 0.52 0.54 0.57 5 France 2.20 2.81 4.45 2.00 1.80 1.86 1.96 2.07 2.19 2.31 2.44 6 Germany 5.34 7.15 8.69 7.87 6.72 6.72 6.71 6.70 6.68 6.67 6.66 7 Greece na na na na na na na na na na na 8 Ireland 0.11 0.09 0.08 0.06 0.08 0.09 0.10 0.10 0.11 0.12 0.13 9 Italy 2.18 1.62 2.59 2.58 2.11 2.15 2.22 2.29 2.36 2.44 2.52 10 Luxemburg na na na na na na na na na na na 11 Netherlands 1.53 1.79 2.05 1.32 1.01 1.02 1.03 1.04 1.06 1.07 1.08 12 Portugal 0.00 0.10 0.06 0.02 0.03 0.03 0.03 0.03 0.03 0.04 0.04 13 Spain 0.48 0.79 0.81 0.49 0.45 0.44 0.41 0.38 0.36 0.34 0.31 14 Sweden 0.65 0.72 1.28 0.66 0.71 0.72 0.74 0.75 0.77 0.79 0.81 15 U.Kingdom 6.17 5.68 8.97 4.88 5.48 5.46 5.43 5.39 5.36 5.33 5.30 V. Total EU -15 : 21.96 26.39 36.62 25.80 26.03 25.72 25.23 24.74 24.26 23.79 23.33 1 Bangladesh 0.02 0.18 1.27 0.23 0.10 0.10 0.11 0.12 0.13 0.14 0.15 2 Bhutan na na na na na na na na na na na 3 Maldives na na na na na na na na na na na 4 Nepal 0.14 0.31 0.24 0.08 0.18 0.19 0.20 0.20 0.21 0.22 0.23 5 Pakistan 0.50 0.17 0.21 0.11 0.06 0.06 0.06 0.07 0.08 0.08 0.09 6 Sri Lanka 0.23 0.03 0.06 0.11 0.11 0.11 0.11 0.11 0.11 0.11 0.11
VI. Toatal SAARC-6 : 0.89 0.69 1.78 0.53 0.45 0.47 0.52 0.57 0.62 0.68 0.75 1 Bangladesh 0.02 0.18 1.27 0.23 0.10 0.10 0.11 0.12 0.13 0.14 0.15 2 Myanmar 0.03 0.00 0.00 0.35 0.47 0.46 0.44 0.41 0.39 0.37 0.36 3 Sri Lanka 0.23 0.03 0.06 0.11 0.11 0.11 0.11 0.11 0.11 0.11 0.11 4 Thailand 0.12 0.42 0.22 0.42 0.57 0.59 0.61 0.64 0.67 0.70 0.73
VII. Total BIMSTEC-4 : 0.39 0.62 1.55 1.11 1.25 1.28 1.32 1.36 1.41 1.45 1.50 VIII. Total BISTEC-3 : 0.36 0.62 1.55 0.77 0.78 0.80 0.84 0.89 0.93 0.98 1.02
1 Bahrain 0.66 0.99 0.33 2.30 1.64 1.69 1.76 1.83 1.91 1.99 2.08 2 Kuwait 2.34 1.41 1.22 54.65 6.41 6.89 7.77 8.77 9.89 11.16 12.59 3 Oman 0.02 0.89 0.61 0.04 0.08 0.08 0.08 0.09 0.09 0.10 0.10 4 Quattar 0.35 0.45 0.15 0.28 0.22 0.23 0.24 0.26 0.28 0.30 0.32 5 Soudi Arabia 3.85 5.16 3.40 5.39 7.04 7.39 8.00 8.65 9.37 10.14 10.97 6 UAE 2.78 2.95 2.98 4.62 4.32 4.53 4.90 5.31 5.75 6.22 6.74
IX. Total GCC-6 : 10.00 11.86 8.70 67.30 19.71 21.05 23.47 26.18 29.20 32.57 36.33 Total RTGs (I to IX) : 107.28 117.30 121.28 165.41 145.59 146.04 146.78 147.53 148.28 149.04 149.80
Note : A denotes Actual and P denotes Projected Source: International Monetary Fund; Direction of Trade Statistics Yearbook, Various Issues.

59

60

61