Embed Size (px)
Citation preview

2011 SIMULIA Customer Conference 1
XFEM Analyses of Critical Cracks in a Pressure Tap for a 40mm Gun Breech
C. M. Weaver, P. A. Rigg*, J. A. Cordes, A. Haynes
U.S. Army/ARDEC, Picatinny Arsenal, NJ 07806-5000
*Los Alamos National Laboratory, Los Alamos, NM 87545
Abstract: Pressure sensors are used in gun breeches to capture the pressure for interior ballistic analyses. The pressure tap in a 40-mm gun breech was evaluated for critical flaw size and crack initiation potential at varying pressure loads. Critical flaw size was estimated using the Extended Finite Element Method (XFEM) capabilities in the general purpose finite element program ABAQUS. Results suggest that the pressure loads were not high enough to initiate a crack or propagate cracks within the critical defect size limits of the breech for pressure loads currently used in test and evaluation. The results are consistent with the 150+ successful shots that have been completed and the 1000+ shots completed on a similar breech with similar pressure taps.
Keywords: 6061-T6 aluminum, AZ31B magnesium, breech, crack, fatigue, failure, fe-safe, fracture, H13 tool steel, implicit, IMR4350, XFEM
1. Introduction
Pressure sensors are commonly used to measure breech pressure for interior ballistic analyses. Breech pressure data can be used to measure the effects of a particular gun powder charge and primer and the effects of varying the weights of these charges and primers. This data is useful for interior ballistic analysis when analyzing the cycle life of a gun. It is also used for exterior ballistics when analyzing the function of projectiles. In order for breech pressure data to be recorded, a pressure sensor needs to be inside the breech component of a gun. A popular method for inserting a pressure sensor inside a gun breech is to fabricate a pressure tap (or a through-the-thickness hole) in the top of the breech with a threaded region to screw the pressure sensor in place. The pressure data is then obtained from the part of the pressure sensor which is exposed to the inside of the breech. Figure 1 shows a drawing of a typical pressure sensor used in pressure taps (Pressure Division, 2009). Figure 2 shows the interface between the pressure tap and the pressure sensor in the modeled assembly.
2 2011 SIMULIA Customer Conference
Figure 1. Pressure Sensor Drawing.
Figure 2. Pressure Tap and Sensor Interface.

2011 SIMULIA Customer Conference 3
This paper describes the modeling and simulation of a breech for the 40mm gun system. The purpose of these analyses was to predict the critical flaw size and crack initiation potential at pressure loads currently used in test and evaluation. For this study, critical flaw sizes were estimated using linear elastic fracture assumptions and the critical defect size limit of the breech specified by the manufacturer. Results were analyzed with XFEM in ABAQUS.
2. Experiment
2.1 Test Description
The breech pressure data used in these simulations was obtained from a pressure sensor used in five impact test shots that were performed and documented from February to December of 2009 at Los Alamos National Laboratory (LANL), Los Alamos, NM. The test shots were performed using a single stage 40mm gun system designed by Physics Applications, Inc using a powder breech constructed of H13 tool steel heat-treated to Rockwell hardness of 36-40. For these tests, various IMR 4350 powder charge loads were used to launch either a 6061-T6 aluminum (Al) or AZ31B magnesium (Mg) projectile to impact a test sample. The purpose of these impact experiments was to obtain Equation-of-State information on shock-compressed metals for LANL programs. An example of this work can be found in the manuscript by Rigg, et al. (Rigg, P.A., 2009). While over 150 experiments have been performed on this gun since 2006, the five experiments used for this study were chosen because they represented experiments with a wide range of projectile velocities and, thus, breech pressures. Breech pressure data was recorded using a pressure sensor designed by the Pressure Division of PCB Piezotronics, Inc. (Rigg, P.A. 2009). This sensor, contructed of 300C maraging steel, was designed for this breech and calibrated to 100 kpsi.
3. Method
3.1 Modeling and Simulation, Overview
The gun breech was modeled using ABAQUS 6.10.1 Explicit and Implicit. Explicit modeling and simulation were used to determine plasticity, stress, and displacement response. The implicit analysis was done using the XFEM capability in ABAQUS. The XFEM analysis contained 332,330 nodes and 304,192 elements. It was compiled on a UNIX cluster using 32 cpus and took approximately 73 hours to complete. Analyses were non-linear. The XFEM capability in ABAQUS was used to model the structural effects of the recorded breech pressure data on the breech. The analyses were first used to determine if the breech could crack as a result of the breech pressure produced by the impact of the shot. Then the breech pressure data with the highest maximum pressure (shot 69ss-09-47) was increased by a scaling factor to determine whether there was a pressure capable of cracking the breech (Rigg, P.A., 2009). That scaling factor was determined to be 4.25. Several simulations used scaled pressure data to determine the pressure that would initiate or propagate a crack in the breech. Four additional notable cases were used: (1) the breech pressure curve from shot 69ss-09-47; (2) the curve from shot 69ss-09-47 with a scaling factor of 1.25 (the factor of safety for gun design in our office); (3) the curve from shot 69ss-09-47 with a scaling factor of 1.65 (to reach 100kpsi which is the maximum pressure the pressure tap is rated to); and

4 2011 SIMULIA Customer Conference
(4) the curve from shot 69ss-09-47 with a scaling factor of 2. Precrack simulations were also run in XFEM using crack sizes above and below the critical crack defect for the part of 0.060-in. Three precracked models were used for XFEM simulation: (1) a crack 0.0075 x 0.0375 inch on the bottom of the pressure tap and the inside wall of the breech; (2) a crack 0.015 x 0.0375 inch on the inside wall of the shelf at the bottom of the pressure tap; and (3) a crack 0.090 x 0.060 inch on the bottom of the pressure tap and the inside wall of the breech. Cases (1) and (2) are within the limits of the critical defect size for the breech. Case (3) is above the limit of the critical defect size.
3.2 Model Geometry
The geometry of the complex muzzle break was imported from Pro/Engineer. All models used in the analyses were meshed with 8-node hexahedral elements (C3D8R). Analyses were first done using only the breech part without a threaded pressure tap. Once this XFEM simulation was successfully completed, a simulation was run with the unthreaded pressure sensor part and the breech part modeled with a tie constraint at the thread interface in the pressure tap. A simulation was then run using a breech with a threaded pressure tap. The breech was modeled as three parts connected by tie constraints in this simulation. Finally a threaded pressure sensor part and a breech part with a threaded pressure tap were used in the XFEM simulation. Additional dynamic, explicit simulations were performed to compare the stresses between the breech modeled as a single part and the breech as modeled with multiple tied parts. Stresses between the two models were within 3.5%.
3.3 Material Model
All parts were modeled with elastic/plastic material models. The material data used for these simulations was obtained from the Material Science Lab (MSL) database at LANL. The true ultimate and yield strength and elongations were calculated using the material properties formula provided by ABAQUS (Simulia, 2004 – 2010). The material properties used in these simulations are shown in Table 1 for H13 tool steel and Table 2 for 300C maraging steel. The analyses used the lower values in the tables.
Table 1. Material Properties – H13 Tool Steel. Material Property Value Density, lbf-s2/in4 7.3298E-04 Young’s Modulus, psi 3.0E07 Poisson’s Ratio 0.290 Yield Stress, psi 2.40E05 Ultimate Stress, psi 2.70E05 Elongation at Failure, % 10 Yield Stress (calculated), psi 242160 Ultimate Stress (calculated), psi 297000 Plastic Strain (calculated), % 8.541 Fracture Energy (min, max), psi-in 20.13, 63.61 Viscosity coefficient, psi-s 1.45E-10

2011 SIMULIA Customer Conference 5
Table 2. Material Properties – 300C Maraging Steel. Material Property Value Density, lbf-s2/in4 7.356E-04 Young’s Modulus, psi 2.74E07 Poisson’s Ratio 0.290 Yield Stress, psi 1.20E05 Ultimate Stress, psi 1.52E05 Elongation at Failure, % 19 Yield Stress (calculated), psi 120666 Ultimate Stress (calculated), psi 180880 Plastic Strain (calculated), % 16.735 Fracture Energy (min, max), psi-in 58.39,364.96 Viscosity coefficient, psi-s 1.45E-10
The XFEM analysis requires additional material information in the enriched area of the crack. The maximum principal stress criteria (‘Maxps Damage’ in Abaqus) was selected for the damage initiation criteria. For both materials, the calculated true ultimate strength was used as the limiting maximum principal stress. Fracture energy was used for the damage evolution criteria. Fracture energy was estimated using the relationship
EKG ICIC2= , (1)
where GIC is fracture energy, KIC is fracture toughness, and E is Young’s modulus, (Reinhardt, L., 2010). The value for KIC was estimated from a paper with data on H13 tool steel (Okorator, 1987). The reference provided values of KIC for a Rockwell hardness range of 54 – 60. The breech material is H13 but with a Rockwell hardness of 36 – 40. Since fracture toughness generally increases as Rockwell hardness decreases, the higher-hardness toughness value, 54-kpsi√inch, was used as an estimate. The KIC value for 4130 steel was used an estimate for the 300C maraging steel.
3.4 Analysis Method
All XFEM simulations were performed using dynamic, implicit analysis. The ABAQUS advice under ‘XFEM’ was very helpful for convergence issues (ABAQUS answers 4396, 4397). Based on previous work and the ABAQUS answers, the minimum time step was set to 1.E-10 s and the number of increments was increased to 100,000 (Reinhardt, L., 2010). The initial time step was varied depending on the pressure-time curve. For the uncut, unfiltered curve 0.007 s was used. For the filtered and cut curve 0.0391 s was used. For smooth curve simulations 0.001 s and 0.002 s were used. Simulation times were chosen to make sure the analysis ran past the peak pressure of the curve. The following changes were also made to in the Step Module (Reinhardt, L., 2010): • Step Module Other General Solutions Control Manager Step-1 Edit Time
Increment (tab on top) Specify: Discontinuous analysis (check box) More (second tab down on the left) IA = 20 Okay
• Step Module Step Manager Step-1 Edit Basic (tab on top) Application: Moderate dissipation (pull down tab) Okay

6 2011 SIMULIA Customer Conference
3.5 Specifying XFEM in ABAQUS
XFEM is specified in the Interaction Module in ABAQUS for a model that does not contain a precrack as follows (Reinhardt, L., 2010): • Interaction Module Special Crack Manager Create XFEM Continue
Select sections or part for crack location Allow crack growth (check box) Specify contact property (check box) Select contact property (pull down tab) Okay
For a model containing a precrack the following steps needed to be done: • Part Module Create a Planar Shell of the correct crack length and twice the depth.
Placement was easier. Figure 4 shows one of several cracks used. • Assembly Module Translate the crack instance so that the mid surface node of the crack
corresponds to an accessible node in the part. Then move the crack-instance slightly so that crack doesn’t correspond to an element edge.
• Interaction Module Special Crack Manager Create XFEM Continue Select sections or part for crack location Allow crack growth (check box) Crack location (check box) Select Planar Shell part that represents the crack Specify contact property (check box) Select contact property (pull down tab) Okay
• Mesh Module – several elements along the crack are desirable. An aspect ratio near 1 for the element dimensions in the enriched area is preferred.
In order to visualize the crack in the output database the following changes need to be made to the Step Module:
• Step Module Output Field Output Requests Manager F-Output-1 Edit Fracture/Failure PHILSM State/Field/User/Time STATUSXFEM Okay

2011 SIMULIA Customer Conference 7
Figure 4. Example of Crack in Finite Element Mesh.
3.6 Boundary Conditions, Loads, and Constraints
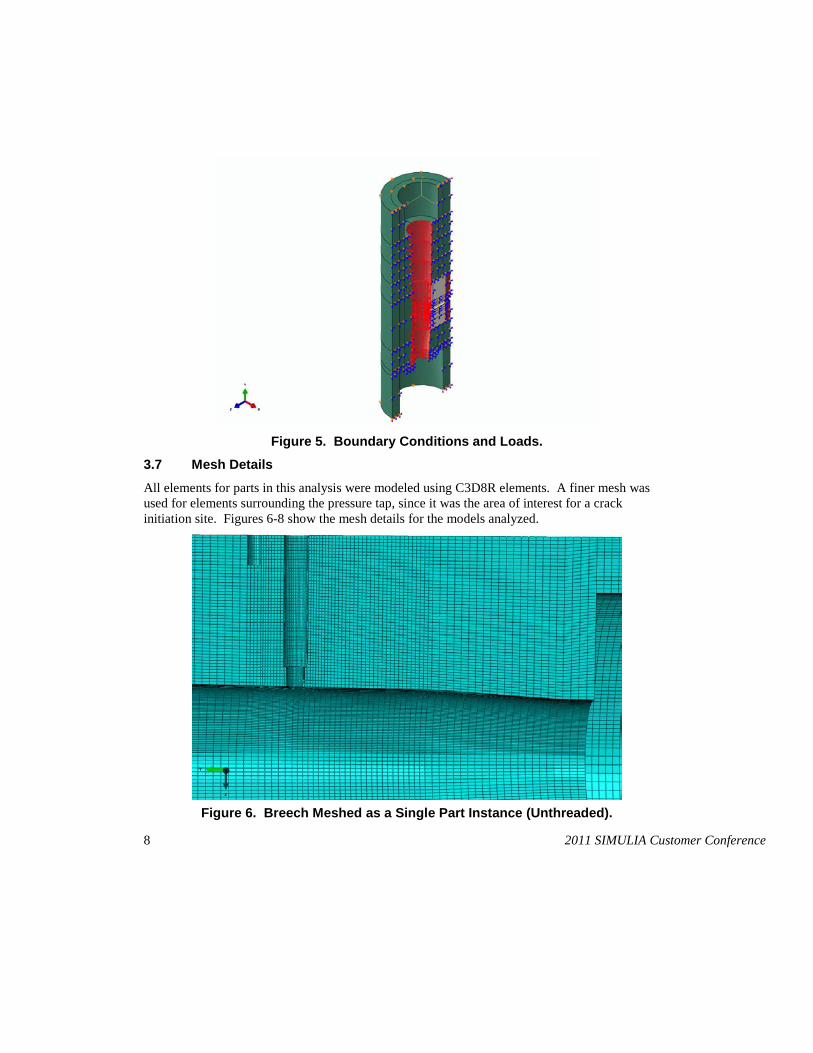
The model for this analysis was constructed as a half model of only the breech and pressure sensor parts. To simulate the fixed position of the breech on the launch table, the x-z plane faces were constrained with a pinned boundary condition. To constrain the half-model to represent a full model, the y-z plane was tied to the x-direction. The breech pressure load was applied to the inside of the breech and the bottom of the pressure sensor. This load setup is shown in Figure 5.
8 2011 SIMULIA Customer Conference
Figure 5. Boundary Conditions and Loads.
3.7 Mesh Details
All elements for parts in this analysis were modeled using C3D8R elements. A finer mesh was used for elements surrounding the pressure tap, since it was the area of interest for a crack initiation site. Figures 6-8 show the mesh details for the models analyzed.
Figure 6. Breech Meshed as a Single Part Instance (Unthreaded).

2011 SIMULIA Customer Conference 9
Figure 7. Breech Meshed as Two Tied Part Instances with Pressure Tap
(Unthreaded).
Figure 8. Breech Meshed as Three Tied Part Instances with Pressure Tap
(Threaded).
4. Results
4.1 Results 4.25x Expected Load, Crack Initiation and Growth (XFEM)
Using a breech pressure curve from shot 69ss-09-47 modified by a factor of 4.25, simulated crack growth is observed. The crack initiation site for the unthreaded model is on the inside wall in the middle of the pressure tap mounting hole in the breech part. The crack then grows upwards to the outside of the breech and deepens in thickness along the x-z plane which is shown in Figure 9.

10 2011 SIMULIA Customer Conference
Figure 9. Crack Propagation in Pressure Tap (Unthreaded).
The crack initiation site for the threaded model is on the inside wall of the shelf at the bottom of the pressure tap mounting hole in the breech part. The crack then deepens in thickness along the x-z plane which is shown in Figure 10.
Figure 10. Crack Propagation in Pressure Tap (Threaded).
2011 SIMULIA Customer Conference 11
4.2 Precracked Simulations
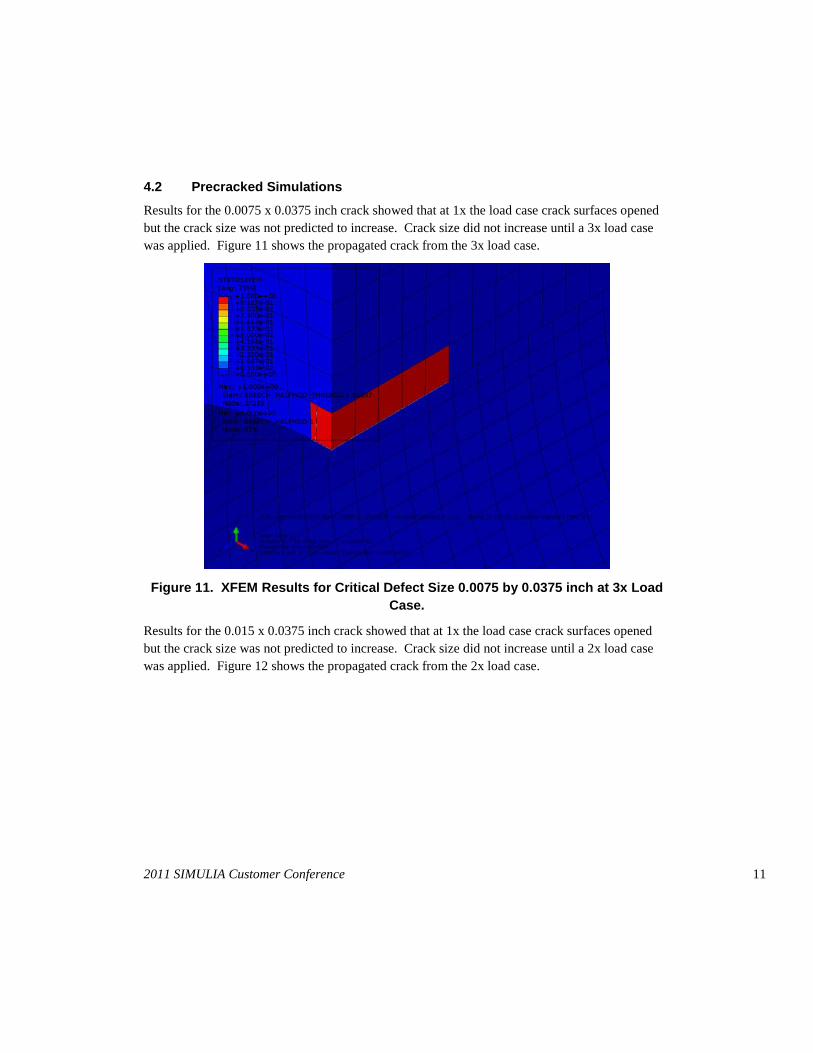
Results for the 0.0075 x 0.0375 inch crack showed that at 1x the load case crack surfaces opened but the crack size was not predicted to increase. Crack size did not increase until a 3x load case was applied. Figure 11 shows the propagated crack from the 3x load case.
Figure 11. XFEM Results for Critical Defect Size 0.0075 by 0.0375 inch at 3x Load Case.
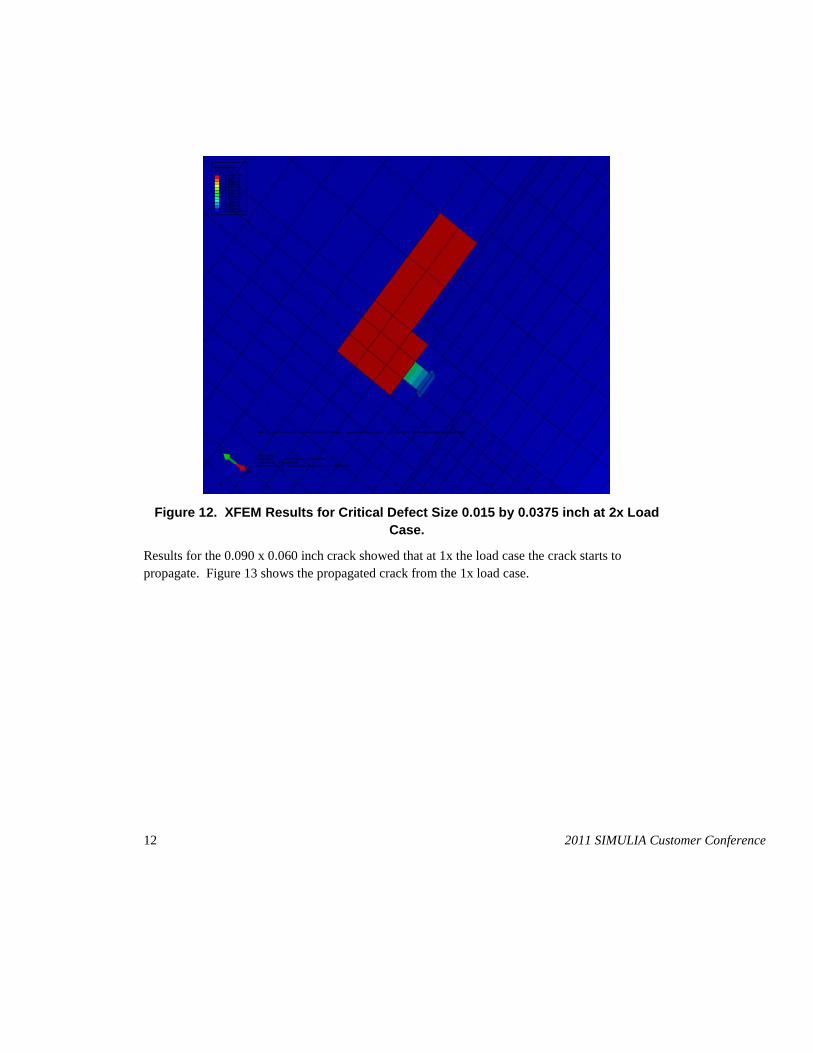
Results for the 0.015 x 0.0375 inch crack showed that at 1x the load case crack surfaces opened but the crack size was not predicted to increase. Crack size did not increase until a 2x load case was applied. Figure 12 shows the propagated crack from the 2x load case.
12 2011 SIMULIA Customer Conference
Figure 12. XFEM Results for Critical Defect Size 0.015 by 0.0375 inch at 2x Load Case.
Results for the 0.090 x 0.060 inch crack showed that at 1x the load case the crack starts to propagate. Figure 13 shows the propagated crack from the 1x load case.

2011 SIMULIA Customer Conference 13
Figure 13. XFEM Results for Critical Defect Size 0.090 by 0.060 inch at 1x Load Case.”
4.3 Maximum Stress and Plastic Strain
Results for stress using the von Mises criteria and plastic strain using the PEEQ criteria are show in Figures 14 and 15. The results show that yield stress was reached before the crack initiated. The results also show that plastic strain was exceeded before the crack was initiated.
Figure 14. Von Mises Stress with Results Above Yield (Unthreaded and Threaded
Model).

14 2011 SIMULIA Customer Conference
Figure 15. Plastic Strain with Results Above Yield (Unthreaded and Threaded
Model).
5. Discussion
The ABAQUS XFEM simulation method has been studied and shown to be an accurate predictor of a through-crack in a thin aluminum panel (Reinhardt, L., 2010). In this study, the method was implement for 3-dimensional cases of safety-critical concern. The method employed was able to show that it is possible for crack initiation to occur in the breech, however, the pressure load required for this occurrence is well above a pressure load that would be produced during test shots. Crack initiation was observed in both the threaded and unthreaded model cases, however, these cracks occurred in different locations within the pressure tap region. Due to these results, both locations of the pressure tap region should be considered as high fatigue areas. Precracked models confirm the need for a critical defect size of 0.060-in. The results from case (2) show that location of a crack has an important effect on what load it propagates at. Since the location of this precrack is at the same location of a crack initiation site in the 4.25x load case, it is not surprising that the crack propagated at a lower pressure load than the precrack in case (1). XFEM results were completed using both ABAQUS Implicit Dynamics and ABAQUS Implicit Static analysis. Similar results were obtained. The static analysis was much quicker and converged at higher applied loads. The implicit dynamic results required a small initial time step for convergence at higher applied loads.
6. Conclusions
The ABAQUS XFEM simulations for critical crack analysis provide valuable insight into the pressure loads required in order to produce a crack failure in the breech of the gun. Since pressure loads greater than the recording limits of the pressure sensor are needed to produce crack initiation, these analyses confirm that crack failure will probably not occur for the specified pressure profiles. Polishing the surface near the transducer and scanning for critical defects prior to tests is recommended.
2011 SIMULIA Customer Conference 15
7. References
1. “ABAQUS Users Manual V6.10-1”, Dassault Systems 2004 – 2010.
2. ABAQUS Customer help answers 4396, 4397
3. Reinhardt, L., Cordes, J.A., “XFEM Modeling of Mixed-Mode Cracks in Thin Aluminum Panels.” Proceedings of the 2010 Simulia Customer Conference, Providence, RI, 24-27 May 2010.
4. “Model 108B11 ICP Dynamic Pressure Sensor Installation and Operating Manual,” PCB Piezotronics, Pressure Division, 2009.
5. Okorator, O. E., Fracture Toughness of M2 and H13 Alloy Tool Steels, Materials Science and Technology, Vol. 3, pp. 118 – 124, 1987.
6. Rigg, P.A., Greeff, C.W., Knudson, M.D., Gray III, G.T., Hixson, R.S., Influence of Impurities on the α to ω Phase Transition in Zirconium Under Dynamic Loading Conditions, Journal of Applied Physics 106, pp. 123532-1 – 123532-9, 2009.
7. Rigg, P.A, Byers, M., DiMarino, S., “Experiment Summary for Shot 69ss-09-47”, Los Alamos National Laboratory, Los Alamos, NM, 2009.