Embed Size (px)
Citation preview

®
First-Quarter 2010 Earnings Presentation
Ursula BurnsChief Executive Officer
Larry ZimmermanVice Chairman & CFO
April 23, 2010

2®
Forward-Looking Statements
This presentation contains "forward-looking statements" as defined in the Private Securities Litigation Reform Act of
1995. The words “anticipate,” “believe,” “estimate,” “expect,” “intend,” “will,” “should” and similar expressions, as they
relate to us, are intended to identify forward-looking statements. These statements reflect management’s current
beliefs, assumptions and expectations and are subject to a number of factors that may cause actual results to differ
materially. These factors include but are not limited to: the unprecedented volatility in the global economy; the risk
that unexpected costs will be incurred; the outcome of litigation and regulatory proceedings to which we may be a
party; actions of competitors; changes and developments affecting our industry; quarterly or cyclical variations in
financial results; development of new products and services; interest rates and cost of borrowing; our ability to protect
our intellectual property rights; our ability to maintain and improve cost efficiency of operations, including savings
from restructuring actions; changes in foreign currency exchange rates; changes in economic conditions, political
conditions, trade protection measures, licensing requirements and tax matters in the foreign countries in which we do
business; reliance on third parties for manufacturing of products and provision of services; the risk that we will not
realize all of the anticipated benefits from the acquisition of Affiliated Computer Services, Inc. (“ACS”); our ability to
recover capital investments; the risk that subcontractors, software vendors and utility and network providers will not
perform in a timely, quality manner; the risk that multi-year contracts with governmental entities could be terminated
prior to the end of the contract term; the risk that individually identifiable information of customers, clients and
employees could be inadvertently disclosed or disclosed as a result of a breach of our security; and other factors that
are set forth in the “Risk Factors” section, the “Legal Proceedings” section, the “Management’s Discussion and Analysis
of Financial Condition and Results of Operations” section and other sections of our 2009 Annual Report on Form 10-K
filed with the Securities and Exchange Commission. The Company assumes no obligation to update any forward-
looking statements as a result of new information or future events or developments, except as required by law.

3®Constant currency (CC): see slide 17 for explanation of non-GAAP measures
Annuity revenue represents service, outsourcing and rentals, supplies, paper and other sales and finance income
1 Adjusted EPS, pro-forma basis, operating margin: see slide 17 for explanation of non-GAAP measures
First-Quarter OverviewAdjusted EPS1 of $0.18 per share, GAAP EPS of $(0.04) per share
• Q1 adjusted EPS above guidance of $0.11 to $0.13
Good performance across all businesses
Total revenue up 5% and 2% CC on a pro-forma1 basis, up 33% on a GAAP basis
• Technology up 6% and 3% CC
– Continue to see improvement in developing markets, color and supplies
• Services up 3% and 2% CC on a pro-forma basis1
– Significant growth in business process outsourcing
• 83% of revenue from annuity
Solid operational cost and expense execution
• Capturing savings from operational improvements and restructuring
• Operating margin1 of 8.5% up 1.5 pts YOY on a pro-forma basis
Continued strong cash performance
• Cash from operations $375M
• Cash balance of $1.0B
Synergy programs on track

4®
83%Annuity % of Revenue
Pro-forma1
4%
7%
2%
4%
2%
5%
4%
7%
$ 822
37%
40%
$ 3,899
30%
33%
$ 4,721
Q1
CC Growth
Growth
Equipment
CC Growth
Growth
Annuity
CC Growth
Growth
Total Revenue
(in millions)
Constant currency: see slide 17 for explanation of non-GAAP measures
Revenue
2010
1Pro-forma: see slide 17 for explanation of non-GAAP measures
Annuity revenue represents service, outsourcing and rentals, supplies, paper and other sales and finance income
Segment Revenue
Contribution
Technology
Services
Other
39%
8%
53%

5®MIF (Machines in Field) exclude printers, developing markets & GIS
Pages include estimates for developing markets, GIS and printers
Signings: total contract value of new business signings and renewals signed in the quarter
Metrics
4%
(8)%
17%
1%
Q4 ‘09 Q1 ‘10
16%Color MIF
1%Digital MIF
8%Color Pages
(4)%Digital Pages
Q1 ‘10
5%Signings Growth LTM
Q1 ‘10
11%Color Revenue Growth
22%Color % of Pages
30%Color % of MIF
$1.5BColor Revenue
Color RevenueMIF and Pages Growth - YOY
Signings Metrics (TCV)
Q1 ‘10
$3.9BSignings

6®
Technology Segment
Constant currency (CC): see slide 17 for explanation of non-GAAP measures
* Installs include units sold in Technology and Services segment
% B/(W) YOYQ1
2.3pts9.4%Segment Margin
40%$233Segment Profit
3%6%$2,483Total Revenue
CCAct Cur2010(in millions)
Installs*
(11)%
43%
28%
Color Printers
A4 Color MFDs
A4 Mono MFDs
Entry
18%
5%
Mid-Range Color MFDs
Mid-Range B&W MFDs
Mid-Range
15%
(14)%
High-End Color
High-End B&W
High-End
• Color revenue momentum
• Technology leadership continues
– ColorQubeTM
– 7002/8002 digital presses
– Newly launched Xerox Color 800 / 1000,
WorkCentre 7120 and WorkCentre 5700
• High-end black & white remains pressured
• Revenue mix: 23% Entry, 56% Mid-range and 21% High-end

7®
• Revenue growth driven by BPO
– Commercial Healthcare
– Electronic Payment
– Customer Care
• Operating profit improvement driven by BPO volumes, new business and cost actions
• Strong signings in Medicaid business and government services
• Growing document outsourcing and ITO pipelines
• Normalized revenue mix: ~50% BPO, ~35% Document Outsourcing and ~15% ITO
Services Segment
17%$203Segment Profit
2%3%$1,843Total Revenue
% B/(W) YOYQ1
1.3 pts11.0%Segment Margin
CCAct Cur2010(in millions)
Constant currency (CC) and pro-forma: see slide 17 for explanation of non-GAAP measures1Signings: total contract value of new business signings and renewals signed in the quarter2BPO does not include at this time historic Xerox BPO services, which are included in Document Outsourcing
$2.9BQ1 2010
Business Process Outsourcing2
Information Technology Outsourcing
Document Outsourcing
Signings1
$0.4BQ1 2010
$0.6BQ1 2010
Total Signings
5%Signings Growth LTM
$3.9BQ1 2010
Pro-forma

8®
Venezuela deval $0.02, Medicare subsidy tax change $0.010.03Other discrete items (Venezuela, Medicare)
0.03Acquisition-related Costs
Reflects $0.02 less restructuring0.13Restructuring incl Fuji Xerox
0.03Amortization of Intangible Assets
Adjusted for $22M of Fuji Xerox restructuring$ 20Adjusted Equity Income2
32%Adjusted Tax Rate2
Above guidance of $0.11 to $0.13$ 0.18 Adjusted EPS2
$ (0.04)
$ 224
$97
8.5%
$ 400
23.3%
$ 1,099
$ 205
36.1%
$ 4,721
Q1 2010 Comments(in millions, except per share data)
Pro-forma improvement 1.5 points
Significant improvement
Pro-forma down $14M CC
Above 33 to 35% range given partial quarter of ACS
Pro-forma actual growth 5%, CC of 2%
GAAP EPS
Adjusted Net Income – Xerox2
Adjusted Other, net1,2
Operating Income % of Revenue
Adjusted Operating Income2
SAG % of Revenue
SAG
RD&E
Gross Margin
Revenue
Earnings
1 Includes net income attributable to noncontrolling interest of $8M in Q12 Adjusted Operating Income, Adjusted Other, net, Adjusted Equity Income, Adjusted Net Income – Xerox, Adjusted Tax Rate and Adjusted EPS: see slide 17 for explanation of non-GAAP measures

9®
195Restructuring and asset impairment charges
$ 1,010
(2,789)
$ (1,565)
78
(1,643)
$ (1,566)
34
(1,524)
(76)
$ 375
104
(58)
131
169
(197)
(137)
(39)
241
$ (34)
Q1 2010(in millions, except per share data)
Acquisitions
Restructuring payments
Ending Cash and Cash Equivalents
Other
Cash from Financing
Equipment on Operating Leases
Accounts Payable and Accrued Compensation
Other
Change in Cash and Cash Equivalents
Net Debt Payments / Proceeds
Depreciation and amortization
Other
Accounts Receivable and Billed Portion of Finance Receivables
Inventories
CAPEX (incl. internal use software)
Cash from Investing
Finance Receivables
Cash from Operations
Net Loss
Cash Flow
On track to deliver full-year Cash from Operations outlook of $2.6B
Adjusted Net Income drove cash flow
Working Capital1 $253M use of cash
Acquisition-related operating cash outflows were $75M in the quarter
Debt increased $700M in connection with the ACS acquisition
CAPEX of $76M
Free Cash Flow of $299M
1Working capital includes only accounts receivable, accounts payable and inventory
Free Cash Flow: see slide 17 for explanation of non-GAAP measures

10®1As measured from ACS acquisition closing date
22010 assumes $267M put under private placements (final maturity 2023)
Balanced Debt MaturitiesDebt Ladder
$ millions
15 yr putable notes2
0
400
800
1,200
1,600
2010
2011
2012
2013
2014
2015
2016
2017
2018
2019+
Financing Dynamics
• Xerox’s value proposition includes leasing of Xerox equipment
• Maintain 7:1 leverage ratio of debt to equity on these finance assets
DebtFin. Assets$ billions
$ 10.0$ 7.3Total Xerox
$ 3.6-Core
$ 6.4$ 7.3Financing
Receivables
Bad Debt Provision% Receivables
Write-offs % Receivables
Quarterly provisions and write-offs as a % of Receivables remains less than 1%
0.0%
1.0%
2.0%
Q1 2009 Q1 2010
$58M$60M$69M
$56M
$(0.3)$(0.3)Dividend Payments
$1.0-Available Cash
$(0.8)$(1.8)1Debt Payments
$(0.7)$(0.6)CAPEX
$2.8$2.6Cash from Operations
FY 2011FY 2010(in billions)
Cash Flow
Balance Sheet

11®
ACS Update
Year 1 profit synergies: $100M base case to $150M upside
Synergies on track:
• Corporate Governance• Represents early savings• Over 30 workstreams. Clear ownership and accountability for deliverables
• Delivery & Infrastructure• More than 20 projects worldwide • Productivity pilots underway in managed services and technical service
• Sales• Joint Xerox/ACS account planning on 100+ accounts• Pipeline growing
• Innovation• Technology benefits validated• Areas of focus: Improved scanned data recognition, workflow automation and
platform enhancements
12®
World leader in business process and document management
Expanded offerings, market leadership drive growth
• Strong performance in BPO
• Developing markets, color and supplies drive technology revenue
• Economic pressure continues for large enterprises and graphic communications
Evolving business model
• Larger market opportunity, increased annuity and higher operating margin
Continued effective execution on cost and expense management
On track with acquisition-related synergies
Strong operating cash flow
2010 guidance*
• Q2 Adjusted EPS $0.20 - $0.22; GAAP EPS $0.14 - $0.16
• Full-year Adjusted EPS of $0.75 - $0.85, high end of range; GAAP EPS $0.37 - $0.47
Summary
*Guidance - Adjusted EPS: see slide 17 for explanation of non-GAAP measures

13®
GAAP EPS to Adjusted EPS Guidance Track
Guidance - Adjusted EPS: see slide 17 for explanation of non-GAAP measures
*Average shares exclude 27 million shares associated with the Series A convertible preferred stock because to include them would be anti-dilutive. However, the quarterly dividends of $6 million associated with the preferred stock have been taken into account in the EPS guidance range.
The full year EPS may differ from the sum of the quarterly EPS calculations due to rounding and the effects of the changes in average shares in the individual quarters versus the full year
Q2 2010 FY 2010
GAAP EPS $ 0.14 - $ 0.16 $ 0.37 - $ 0.47
Adjustments:Xerox restructuring charge 0.01 0.15 Fuji Xerox restructuring charge - 0.02 Acquisition related costs 0.01 0.04 Amortization of intangible assets 0.04 0.14 Venezuela devaluation - 0.02 Medicare subsidy tax law change - 0.01
0.06 0.38
Adjusted EPS $ 0.20 - $ 0.22 $ 0.75 - $ 0.85
Estimated weighted avg shares* 1,415 1,360
Earnings Per Share

®
Supplemental Slides

15®
Restructuring and Cost Action Details
Secures 2009 cost / margin progress:
• Recognizes lower revenue base out of 2009
• Leverages digital product reliability and
system improvements
• Enables investments in growth areas
Focus areas:
• Supply chain and manufacturing
infrastructure
• Back office functions
• Technical service and managed service
costs
• Development and engineering costs
~$140MApproximate 2010 Savings
~$280MApproximate 2010 Charge
2010 Restructuring Program
2010 Restructuring Charge Details
Q1 2010 Charge $195M
BOY 2010 Charge ~ $85M
FY 2010 Charge ~ $280M
Balance of year includes charges to capture synergy savings

®
Appendix
17®
“Constant Currency”: To better understand trends in our business, we believe that it is helpful to adjust revenue to exclude the impact of changes in the translation of foreign currencies into U.S. dollars. We refer to this adjusted revenue as “constant currency.” Currencies for developing market countries (Latin America, Brazil, Middle East, India, Eurasia and Central-Eastern Europe) that we operate in are reported at actual exchange rates for both actual and constant revenue growth rates because (1) these countries historically have had volatile currency and inflationary environments and (2) our subsidiaries in these countries have historically taken pricing actions to mitigate the impact of inflation and devaluation. Management believes the constant currency measure provides investors an additional perspective on revenue trends. Currency impact can be determined as the difference between actual growth rates and constant currency growth rates.
“Free Cash Flow”: To better understand the trends in our business, we believe that it is helpful to adjust cash flows from operations to exclude amounts for capital expenditures including internal use software. Management believes this measure gives investors an additional perspective on cash flow from operating activities in excess of amounts required for reinvestment. It provides a measure of our ability to fund acquisitions, dividends and share repurchase. It also is used to measure our yield on market capitalization.
Non-GAAP Financial Measures

18®
“Adjusted Earnings Measures”: To better understand the trends in our business and the impact of the ACS acquisition post-closing, we believe it is necessary to adjust the following amounts determined in accordance with GAAP to exclude the effects of the certain items as well as their related income tax effects: • Net income and Earnings per share (EPS) – first quarter actual and EPS guidance for second quarter and full-year 2010• Effective tax rate• Equity Income• Other expenses, net• Operating income and margin
The above have been adjusted for the following items:• Restructuring and asset impairment charges (including those incurred by Fuji Xerox): Restructuring and asset impairment charges
consist of costs primarily related to severance and benefits for employees terminated pursuant to formal restructuring and workforce reduction plans. We exclude these charges because we believe that these historical costs do not reflect expected future operating expenses and do not contribute to a meaningful evaluation of our current or past operating performance. In addition, such charges are inconsistent in amount and frequency. Such changes are expected to yield future benefits and savings with respect to our operational performance.
• Acquisition related costs: We incurred significant expenses in connection with our acquisition of ACS which we generally would not have otherwise incurred in the periods presented as a part of our continuing operations. Acquisition related costs include transaction and integration costs, which represent external incremental costs directly related to completing the acquisition and the integration of ACS and Xerox. We believe it is useful for investors to understand the effects of these cost on our total operating expenses.
• Amortization of intangible assets: The amortization of intangible assets is driven by our acquisition activity which can vary in size, nature and timing as compared to other companies within our industry and from period to period. Accordingly, due to the incomparability of acquisition activity among companies and from period to period, we believe exclusion of the amortization associated with intangible assets acquired through our acquisitions allows investors to better compare and understand our results. The use of intangible assets contributed to our revenues earned during the periods presented and will contribute to our future period revenues as well. Amortization of intangible assets will recur in future periods.
• Other discrete, unusual or infrequent costs and expenses: In addition, we have also excluded the following additional items given the discrete, unusual or infrequent nature of these items on our results of operations for the period – 1) Venezuela devaluation and 2) Medicare subsidy tax law change (Income tax effect only).
Non-GAAP Financial Measures

19®
“Pro-Forma Basis”: To better understand the trends in our business, we discuss our 2010 operating results by comparing them against adjusted 2009 results which include ACS historical results for the comparable period. ACS is included in our 2010 results since the date of acquisition (2/5/10) through the end of the quarter (3/31/10). Accordingly, we have included ACS’s 2009 estimated results for the comparable period – 2/6/09 through 3/31/09 – in our reported 2009 results. We refer to comparisons against these adjusted 2009 results as “pro-forma” basis comparisons. ACS 2009 historical results have been adjusted to reflect fair value adjustments related to property, equipment and computer software as well as customer contract costs. In addition, adjustments were made for deferred revenue, exited businesses and other material non-recurring costs associated with the acquisition. We believe comparisons on a pro-forma basis are more meaningful than the actual comparisons given the size and nature of the ACS acquisition. We believe the pro forma basis comparisons allow investors to have better understanding and additional perspective of the expected trends in our business as well as the impact of the ACS acquisition on the Company’s operations.
Management believes that these non-GAAP financial measures provide an additional means of analyzing the current periods’results against the corresponding prior periods’ results. However, these non-GAAP financial measures should be viewed in addition to, and not as a substitute for, the Company’s reported results prepared in accordance with GAAP. Our non-GAAP financial measures are not meant to be considered in isolation or as a substitute for comparable GAAP measures and should be read only in conjunction with our consolidated financial statements prepared in accordance with GAAP. Our management regularly uses our supplemental non-GAAP financial measures internally to understand, manage and evaluate our business and make operating decisions. These non-GAAP measures are among the primary factors management uses in planning for and forecasting future periods. Compensation of our executives is based in part on the performance of our business based on these non-GAAP measures.
A reconciliation of these non-GAAP financial measures and the most directly comparable measures calculated and presented in accordance with GAAP are set forth on the following slides.
Non-GAAP Financial Measures

20®
Q1 GAAP EPS to Adjusted EPS Track
(in millions; except per share amounts) Net Income EPS
Reported (42)$ (0.04)$
Adjustments:
Xerox restructuring charge 135 0.11
Fuji Xerox restructuring charge 22 0.02
Acquisition related costs 36 0.03
Amortization of intangible assets 36 0.03
Venezuela devaluation 21 0.02
Medicare subsidy tax law change 16 0.01
266 0.22
Adjusted 224$ 0.18$
Three Months Ended
March 31, 2010

21®
GAAP EPS to Adjusted EPS Guidance Track
*Average shares exclude 27 million shares associated with the Series A convertible preferred stock because to include them would be anti-dilutive. However, the quarterly dividends of $6 million associated with the preferred stock have been taken into account in the EPS guidance range.
The full year EPS may differ from the sum of the quarterly EPS calculations due to rounding and the effects of the changes in average shares in the individual quarters versus the full year
Q2 2010 FY 2010
GAAP EPS $ 0.14 - $ 0.16 $ 0.37 - $ 0.47
Adjustments:Xerox restructuring charge 0.01 0.15 Fuji Xerox restructuring charge - 0.02 Acquisition related costs 0.01 0.04 Amortization of intangible assets 0.04 0.14 Venezuela devaluation - 0.02 Medicare subsidy tax law change - 0.01
0.06 0.38
Adjusted EPS $ 0.20 - $ 0.22 $ 0.75 - $ 0.85
Estimated weighted avg shares* 1,415 1,360
Earnings Per Share

22®
Q1 Adjusted Operating Income/Margin
Three Months Ended
March 31, 2010
(in millions) Amount Revenue Margin
Pre-tax Loss/Margin - Reported (10)$ 4,721$ (0.2)%
Adjustments:
Xerox restructuring charge 195
Acquisition related costs 48
Amortization of intangible assets 57
Other expenses, net 110
Operating Income/Margin - Adjusted 400$ 4,721$ 8.5%

23®
Q1 Free Cash Flow
Three Months EndedMarch 31,
(in millions) 2010Cash from Operations - Reported 375$
Adjustments:Cost of additions to land, buildings and equipment (51) Cost of additions to internal use software (25)
(76)
Free Cash Flow 299$

24®
Q1 Adjusted Effective Tax Rate
Three Months Ended
March 31, 2010
(in millions)Pre-Tax
Income
Income Tax
Expense
Effective
Tax Rate
Reported (10)$ 22$ (220.0%)
Adjustments:Xerox restructuring charge 195 60 Acquisition related costs 48 12
Amortization of intangible assets 57 22 Venezuela devaluation 21 -
Medicare subsidy tax law change - (16)
Adjusted 311$ 100$ 32.2%
25®
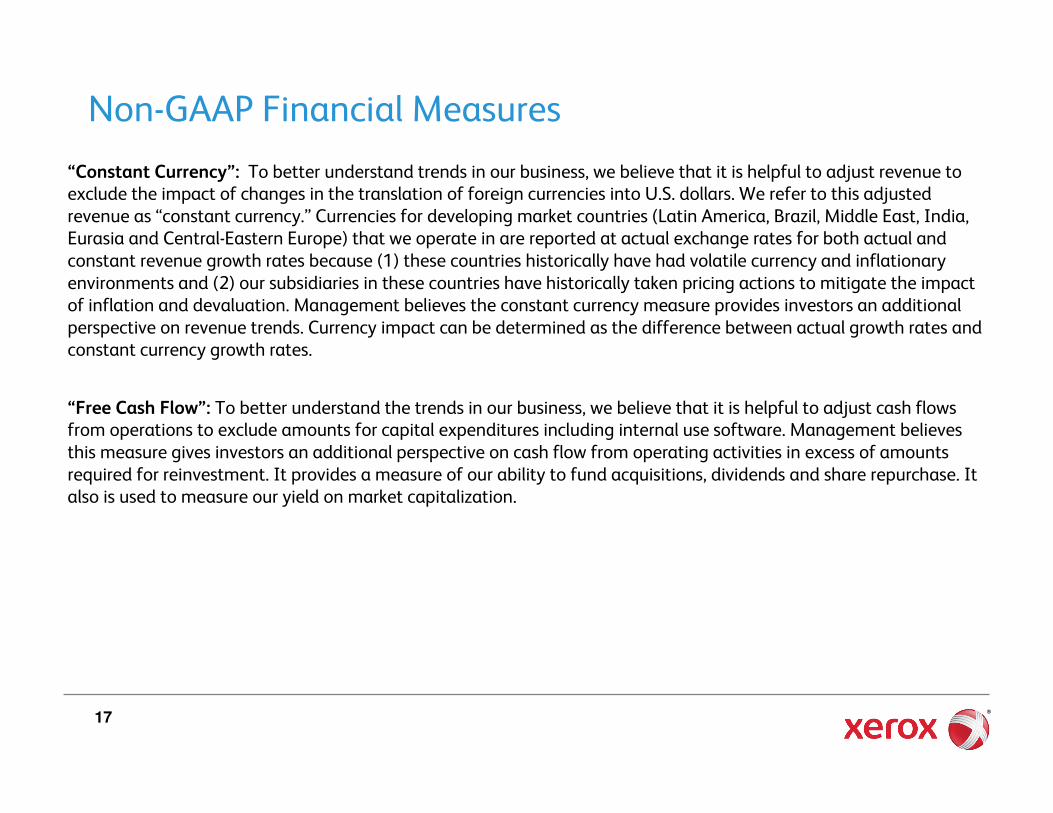
2009/2010 Q1 Adjusted Equity Income
Three Months Ended
March 31,
(in millions) 2010 2009
Equity Loss - Reported (2)$ (10)$
Adjustments:
Fuji Xerox restructuring charge 22 22
Equity Income - Adjusted 20$ 12$

26®
Q1 Adjusted Other, net
Three Months EndedMarch 31,
(in millions) 2010Other expenses, net - Reported 110$
Adjustments:Venezuela devaluation (21) Net income attributable to noncontrolling interests 8
(13)
Other expenses, net - Adjusted 97$

27®
Pro-forma ReconciliationTotal Xerox: Three Months Ended March 31,
(in millions)
As Reported
2010
As Reported
2009
Pro-forma
2009 (1)
Change
Pro-forma
Change
Revenue Category
Equipment sales 822$ 770$ 770$ 7% 7%Supplies, paper and other 856 724 747 18% 15%
Sales 1,678 1,494 1,517 12% 11%Service, outsourcing and rentals 2,870 1,880 2,813 53% 2%
Finance income 173 180 180 (4%) (4%)Total Revenues 4,721$ 3,554$ 4,510$ 33% 5%
Service, outsourcing and rentals 2,870$ 1,880$ 2,813$ 53% 2%Add: Finance income 173 180 180
Add: Supplies, paper and other sales 856 724 747 Annuity Revenue 3,899$ 2,784$ 3,740$ 40% 4%
SAG 1,099$ 1,004$ 1,081$ SAG % Revenue 23.3% 28.2% 24.0% (4.9) pts (0.7) pts
NOTES:
(1) Pro-forma reflects ACS's 2009 estimated results from February 6th through March 31st in 2009 adjusted toreflect fair value adjustments related to property, equipment and computer software as well as customer
contract costs. In addition, adjustments were made for deferred revenue, exited businesses and othermaterial non-recurring costs associated with the acquisition.
28®
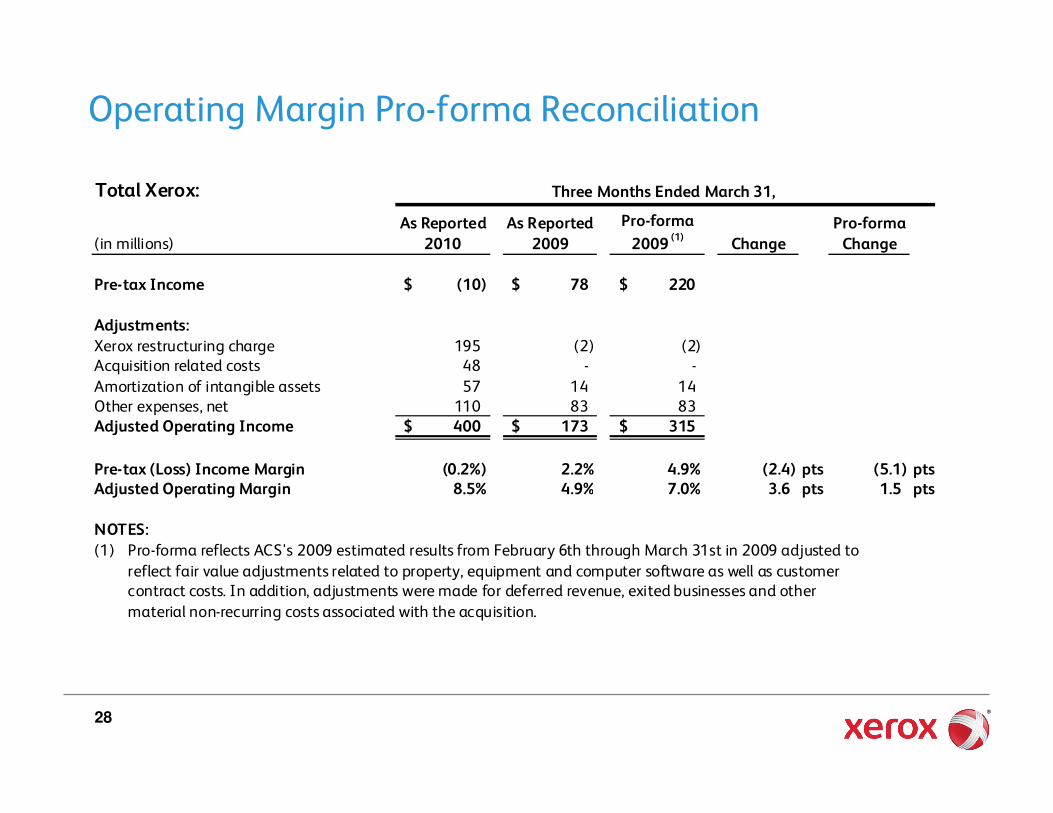
Operating Margin Pro-forma Reconciliation
Total Xerox: Three Months Ended March 31,
(in millions)As Reported
2010
As Reported
2009
Pro-forma
2009 (1)
Change
Pro-forma
Change
Pre-tax Income (10)$ 78$ 220$
Adjustments:
Xerox restructuring charge 195 (2) (2) Acquisition related costs 48 - -
Amortization of intangible assets 57 14 14 Other expenses, net 110 83 83 Adjusted Operating Income 400$ 173$ 315$
Pre-tax (Loss) Income Margin (0.2%) 2.2% 4.9% (2.4) pts (5.1) ptsAdjusted Operating Margin 8.5% 4.9% 7.0% 3.6 pts 1.5 pts
NOTES:
(1) Pro-forma reflects ACS's 2009 estimated results from February 6th through March 31st in 2009 adjusted to
reflect fair value adjustments related to property, equipment and computer software as well as customercontract costs. In addition, adjustments were made for deferred revenue, exited businesses and other
material non-recurring costs associated with the acquisition.

29®
Segment Pro-forma Reconciliation
Services Segment: Three Months Ended March 31,
(in millions)As Reported
2010
As Reported
2009
Pro-forma
2009 (1)
Change
Pro-forma
Change
Document Outsourcing 831$ 833$ 833$ - -
Business Processing Outsourcing (2)
813 - 751 * 8%Information Technology Outsourcing 199 - 205 * (3%)
Total Revenue - Services 1,843$ 833$ 1,789$ 121% 3%
Segment Profit - Services 203$ 31$ 173$ * 17%
Segment Margin - Services 11.0% 3.7% 9.7%
NOTES:(1) Pro-forma reflects ACS's 2009 estimated results from February 6th through March 31st in 2009 adjusted to
reflect fair value adjustments related to property, equipment and computer software as well as customercontract costs. In addition, adjustments were made for deferred revenue, exited businesses and other
material non-recurring costs associated with the acquisition.
(2) BPO does not include at this time historic Xerox BPO services, those are included in Document Outsourcing.
* Percent change not meaningful.