Embed Size (px)
Citation preview

For Marion Bracy Vice President Xavier University Facilities Planning 1 Drexel Drive | New Orleans | LA | 70125 | (504) 520‐1056 Submitted By Siemens Industry, Inc. Building Technologies Division 150 Teal Street | Suite 100 | St. Rose | LA | 70087 | (504) 466‐9300
Xavier University of Louisiana
Annual Savings Report –Year 2 May 1, 2012 to April 30, 2013 July 2013

Xavier University of Louisiana Annual Savings Report – Year 2
Page 1 of 18
Executive Summary
Siemens Industry, Inc. is pleased to submit the following Annual Savings Report for Xavier University of Louisiana (Xavier University). This report covers the second year of energy performance during the period from May 1, 2012 to April 30, 2013. Energy and cost savings are presented and compared to the contractual guaranteed savings. The facility improvement measures (FIMs) implemented with this project are listed in Table 1.
Table 1 – Facility Improvement Measures FIM DESCRIPTION
Lighting Upgrades Upgrade of lighting in classrooms, corridors, and exterior locations of multiple facilities’ lighting fixtures with energy efficient lighting and devices.
Chilled Water Optimization Chiller plant optimization to include variable frequency drives (VFDs), piping changes, and temperature/pressure sensors required to implement an advanced strategy to reduce electrical usage generated by the Central Chilled Water Plant.
Energy Management and Control System (EMCS)
Implementation of scheduling and ventilation energy savings strategies at multiple facilities.
Mechanical Upgrades Implementation of mechanical upgrades at multiple facilities, including insulation, service valves, and air/water balancing.
Water Management Upgrade of multiple facilities’ plumbing systems with more energy efficient water consuming devices.
During this annual period, Xavier University realized total energy reductions in the amount of 10,001,493 kWh of electric energy, 48,169 ccf of natural gas, and 4,347 kgal of water. The total energy savings equate to a dollar savings in the amount of $1,020,566, 173 percent of the guaranteed cost savings of $588,371 – $432,195 in excess savings. Table 2 shows kWh, ccf, and kgal annual reductions.
Table 2 – Annual Measured Savings
FIM ELECTRICENERGY (kWh/yr)
NATURALGAS
(ccf/yr)
WATER (kgal/yr)
TOTAL SAVINGS
($)
Lighting Upgrades 2,216,109 $205,433
Chilled Water Optimization 6,180,956 $572,975
EMCS 1,604,428 32,121 $188,432
Water Conservation 16,048 4,347 $53,726
Water Conservation (CT Sewer Credits) $0
Total Savings 10,001,493 48,169 4,347 $1,020,566
Savings Guarantee 5,401,365 50,485 4,870 $588,371
Excess Savings / (Shortfall) 4,600,128 (2,316) (523) $432,195
Percent of Savings Achieved 173%

Xavier University of Louisiana Annual Savings Report – Year 2
Page 2 of 18
The utility costs used for savings calculations are based on agreed upon utility rates from the contract and the annual rate escalation of three percent. Table 3 shows the annual utility rates with escalation.
Table 3 –Utility Rates (Annual Rate Escalation of 3%)
YEAR ELECTRIC ($/kWh)
NATURALGAS ($/ccf)
WATER ($/kgal)
SEWER ($/kgal)
1 0.09 1.20 3.53 4.04
2 0.09 1.24 3.64 4.16
Baseline utility consumption by FIM is shown in Table 4. Total electric baseline consumption was 16,794,911 kWh, total natural gas baseline consumption was 89,561 ccf, and total water baseline consumption was 26,717 kgals for the year of January 2008 to December 2008. Additional buildings have been constructed on campus since baseline development in 2008, increasing electric, natural gas, and water consumption. Increased consumption from new buildings connected to the Central Chilled Water Plant, the Chapel and Qatar, has been mitigated by increased efficiency at the plant resulting from the chilled water optimization FIM.
Table 4 – Baseline Utility Consumption (January to December 2008)
FIM ELECTRIC (kWh)
NATURALGAS (ccf)
WATER (kgal)
Lighting 3,523,989
Water 59,090 22,717
Water (CT Sewer Credits) 4,000
Chilled Water Optimization 10,775,383
EMCS 2,495,539 28,035
Piping Insulation 2,436
Total 16,794,911 89,561 26,717
Xavier University of Louisiana Annual Savings Report – Year 2
Page 3 of 18
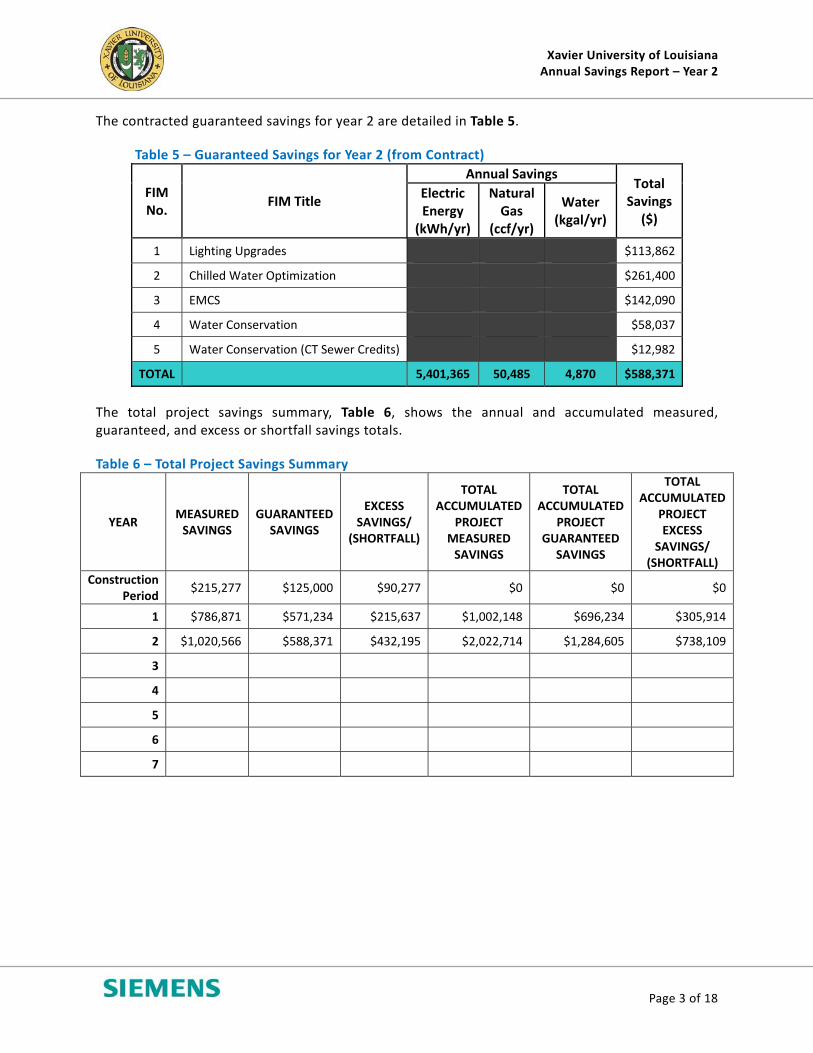
The contracted guaranteed savings for year 2 are detailed in Table 5.
Table 5 – Guaranteed Savings for Year 2 (from Contract)
FIM No.
FIM Title
Annual Savings Total Savings ($)
Electric Energy (kWh/yr)
Natural Gas
(ccf/yr)
Water (kgal/yr)
1 Lighting Upgrades $113,862
2 Chilled Water Optimization $261,400
3 EMCS $142,090
4 Water Conservation $58,037
5 Water Conservation (CT Sewer Credits) $12,982
TOTAL 5,401,365 50,485 4,870 $588,371
The total project savings summary, Table 6, shows the annual and accumulated measured, guaranteed, and excess or shortfall savings totals.
Table 6 – Total Project Savings Summary
YEAR MEASURED SAVINGS
GUARANTEED SAVINGS
EXCESS SAVINGS/
(SHORTFALL)
TOTAL ACCUMULATED
PROJECT MEASURED SAVINGS
TOTAL ACCUMULATED
PROJECT GUARANTEED
SAVINGS
TOTAL ACCUMULATED
PROJECT EXCESS
SAVINGS/ (SHORTFALL)
Construction Period
$215,277 $125,000 $90,277 $0 $0 $0
1 $786,871 $571,234 $215,637 $1,002,148 $696,234 $305,914
2 $1,020,566 $588,371 $432,195 $2,022,714 $1,284,605 $738,109
3
4
5
6
7

Xavier University of Louisiana Annual Savings Report – Year 2
Page 4 of 18
Figure 1 shows job to date savings, including guaranteed and realized construction period savings, of $2,022,714 compared to the job to date guaranteed savings target of $1,284,605.
Figure 1 – Job to Date Savings
Figure 2 shows the annual savings from each of the project years. The first annual period realized savings of $786,871. The second annual period achieved savings of $1,020,566.
Figure 2 – Annual Savings
These energy savings resulted in a significant reduction in green house gas emissions from power plants producing electricity in the New Orleans area. A reduction of 12,609,760 pounds of CO2 was realized in the second year of this project.
$1,284,605
$2,022,714
$0
$500,000
$1,000,000
$1,500,000
$2,000,000
$2,500,000
Job to Date Guaranteed Savings Target
Job to Date Savings
$786,871
$1,020,566
$0
$200,000
$400,000
$600,000
$800,000
$1,000,000
$1,200,000
Annual Period 1 Savings
Annual Period 2 Savings

Xavier University of Louisiana Annual Savings Report – Year 2
Page 5 of 18
The expected savings were exceeded through the implementation of lighting retrofits and air handling unit (AHU) time of day (TOD) scheduling, demand control ventilation (DCV), and Demand Flow® chiller optimization controls and sequencing logic to allow the chiller plant equipment to slow down in times of reduced load and significantly reduce electricity consumption. Excess savings were also realized due to a significant increase in chilled water load at the plant. The additional load and savings associated with the chiller optimization FIM are detailed on page 7 of this report. Siemens believes that the best program to cost‐effectively achieve energy reductions by today’s standards has been executed. Our service personnel continue to work closely with University staff and the Siemens PA group to improve and enhance performance. It is anticipated that with continued vigilance the projected energy savings will be met. Siemens remains a committed partner with Xavier University and looks forward to continuing a valued relationship on future energy savings projects.
Sincerely, The Gulf Coast Performance Assurance Team

Xavier University of Louisiana Annual Savings Report – Year 2
Page 6 of 18
Annual Equipment Inspection/Installed Facility Improvement Measures (FIMs)
The annual equipment inspection took place during recent site visits to Xavier University on July 2, 2013 and July 9, 2013. Siemens Performance Assurance and Service personnel met to discuss plant performance and operation and to view lighting and mechanical upgrades and water conservation measures in the Library and Xavier South.
Lighting
This FIM involved retrofitting existing, inefficient lighting systems in several buildings located throughout Xavier University with new energy efficient lighting equipment. Occupancy sensors were also installed to automatically turn lights off during unoccupied times. Figures 3 and 4 show lighting upgrades at Xavier South. Fixtures were retrofitted with four 30 watt T8 fluorescent lamps, the retrofitted equipment was operational.
Figure 3 – Lighting Retrofit Figure 4 – Lighting Retrofit

Xavier University of Louisiana Annual Savings Report – Year 2
Page 7 of 18
Figure 5 shows a new LED exit sign with battery backup installed at Xavier South.
Figure 5 – Exit Sign
Chilled Water Optimization
This FIM involved optimizing the existing 2,400‐ton capacity central chilled water plant that serves over fourteen (14) buildings on campus. Chilled water optimization included advanced energy management and control system strategies to enhance comfort and optimize energy efficiency. The optimization required physical upgrades, repairs, and additional mechanical installations that included the following:
New VFDs on all chilled water pumps New fill on the Central Plant cooling tower New piping and valves in select buildings New chilled water temperature and flow sensors at multiple buildings New 2‐way chilled water control valves on AHUs Cleaning of coils on select AHUs New Premium Efficiency Tertiary Pump Motors New VFDs on Building AHU Fans
The following FIMs result in reduced cooling loads at the chiller plant:
Lighting retrofits EMCS / TOD scheduling and DCV Piping Insulation – The savings for this FIM are realized at the chilled water plant and are
claimed with the chilled water optimization savings.
The new Chiller No. 2 was the only operating chiller for this reporting period. The existing Chiller No. 1 was recently repaired and brought back online. Since the addition of Chiller No. 1, the plant is typically operating both chillers each with one compressor. Preliminary indications are that this configuration is producing greater efficiencies than the operation of one chiller with both stages.
Xavier University of Louisiana Annual Savings Report – Year 2
Page 8 of 18
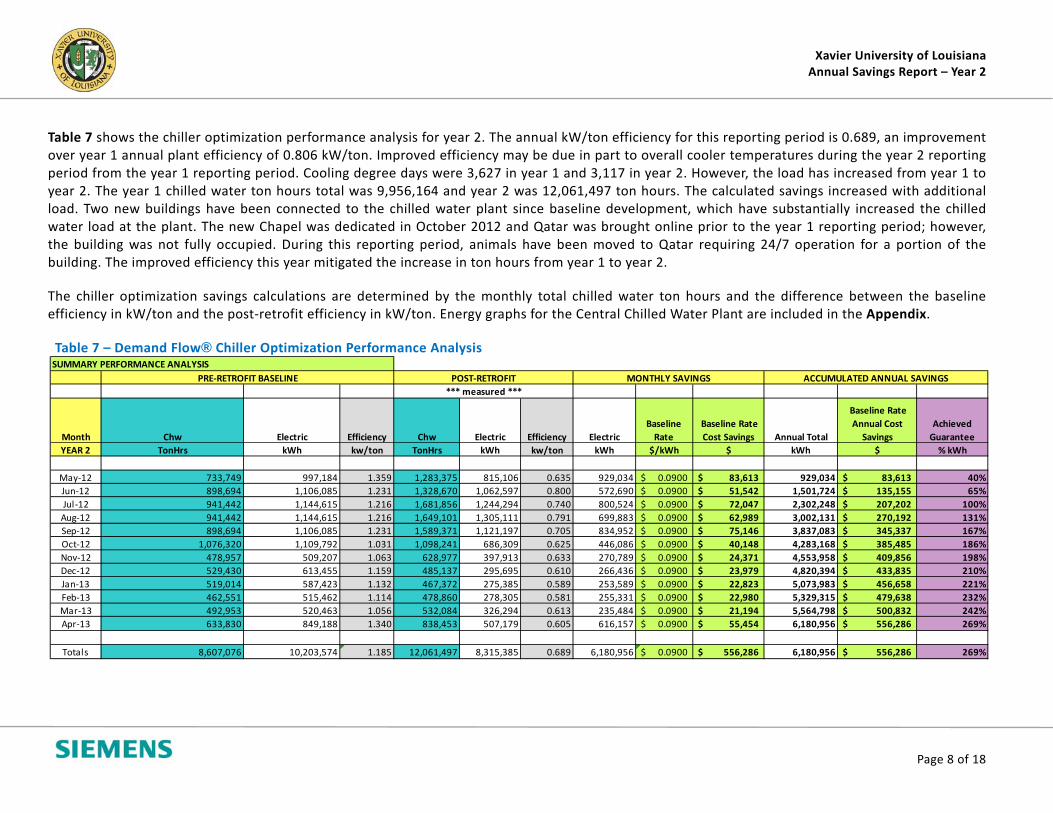
Table 7 shows the chiller optimization performance analysis for year 2. The annual kW/ton efficiency for this reporting period is 0.689, an improvement over year 1 annual plant efficiency of 0.806 kW/ton. Improved efficiency may be due in part to overall cooler temperatures during the year 2 reporting period from the year 1 reporting period. Cooling degree days were 3,627 in year 1 and 3,117 in year 2. However, the load has increased from year 1 to year 2. The year 1 chilled water ton hours total was 9,956,164 and year 2 was 12,061,497 ton hours. The calculated savings increased with additional load. Two new buildings have been connected to the chilled water plant since baseline development, which have substantially increased the chilled water load at the plant. The new Chapel was dedicated in October 2012 and Qatar was brought online prior to the year 1 reporting period; however, the building was not fully occupied. During this reporting period, animals have been moved to Qatar requiring 24/7 operation for a portion of the building. The improved efficiency this year mitigated the increase in ton hours from year 1 to year 2.
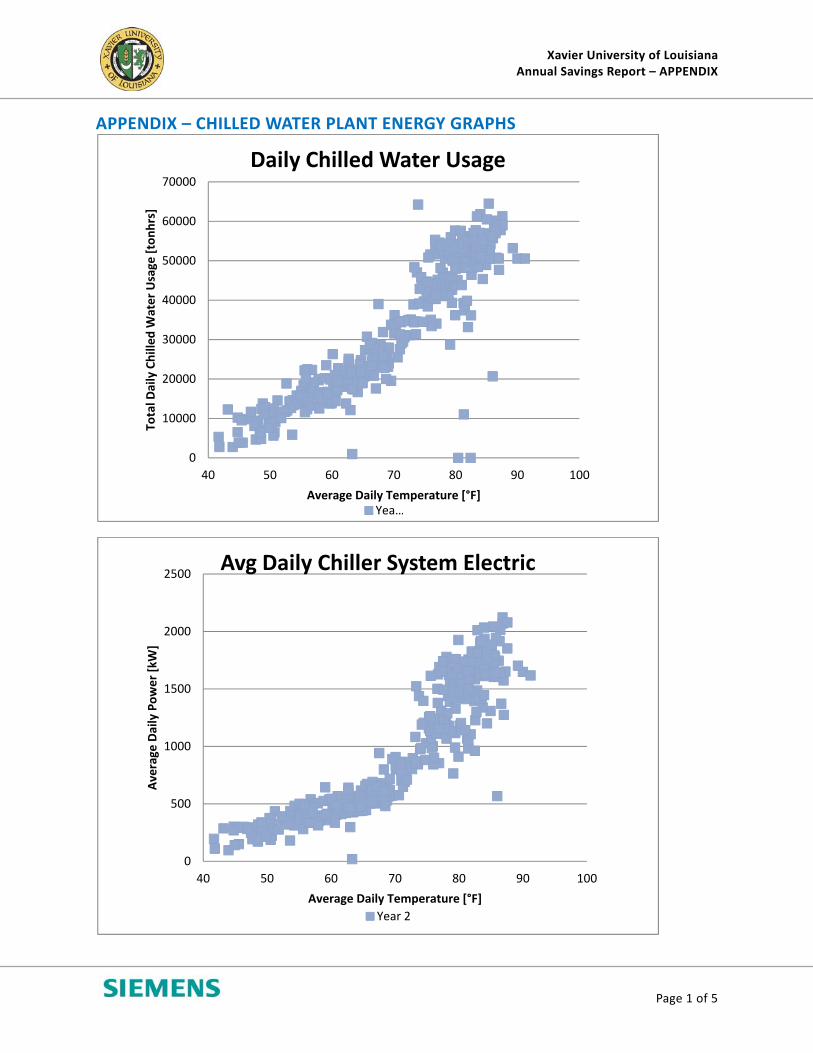
The chiller optimization savings calculations are determined by the monthly total chilled water ton hours and the difference between the baseline efficiency in kW/ton and the post‐retrofit efficiency in kW/ton. Energy graphs for the Central Chilled Water Plant are included in the Appendix.
Table 7 – Demand Flow® Chiller Optimization Performance Analysis
SUMMARY PERFORMANCE ANALYSIS
PRE‐RETROFIT BASELINE POST‐RETROFIT MONTHLY SAVINGS ACCUMULATED ANNUAL SAVINGS
*** measured ***
Month Chw Electric Efficiency Chw Electric Efficiency Electric
Baseline
Rate
Baseline Rate
Cost Savings Annual Total
Baseline Rate
Annual Cost
Savings
Achieved
Guarantee
YEAR 2 TonHrs kWh kw/ton TonHrs kWh kw/ton kWh $/kWh $ kWh $ % kWh
May‐12 733,749 997,184 1.359 1,283,375 815,106 0.635 929,034 0.0900$ 83,613$ 929,034 83,613$ 40%
Jun‐12 898,694 1,106,085 1.231 1,328,670 1,062,597 0.800 572,690 0.0900$ 51,542$ 1,501,724 135,155$ 65%
Jul‐12 941,442 1,144,615 1.216 1,681,856 1,244,294 0.740 800,524 0.0900$ 72,047$ 2,302,248 207,202$ 100%
Aug‐12 941,442 1,144,615 1.216 1,649,101 1,305,111 0.791 699,883 0.0900$ 62,989$ 3,002,131 270,192$ 131%
Sep‐12 898,694 1,106,085 1.231 1,589,371 1,121,197 0.705 834,952 0.0900$ 75,146$ 3,837,083 345,337$ 167%
Oct‐12 1,076,320 1,109,792 1.031 1,098,241 686,309 0.625 446,086 0.0900$ 40,148$ 4,283,168 385,485$ 186%
Nov‐12 478,957 509,207 1.063 628,977 397,913 0.633 270,789 0.0900$ 24,371$ 4,553,958 409,856$ 198%
Dec‐12 529,430 613,455 1.159 485,137 295,695 0.610 266,436 0.0900$ 23,979$ 4,820,394 433,835$ 210%
Jan‐13 519,014 587,423 1.132 467,372 275,385 0.589 253,589 0.0900$ 22,823$ 5,073,983 456,658$ 221%
Feb‐13 462,551 515,462 1.114 478,860 278,305 0.581 255,331 0.0900$ 22,980$ 5,329,315 479,638$ 232%
Mar‐13 492,953 520,463 1.056 532,084 326,294 0.613 235,484 0.0900$ 21,194$ 5,564,798 500,832$ 242%
Apr‐13 633,830 849,188 1.340 838,453 507,179 0.605 616,157 0.0900$ 55,454$ 6,180,956 556,286$ 269%
Totals 8,607,076 10,203,574 1.185 12,061,497 8,315,385 0.689 6,180,956 0.0900$ 556,286$ 6,180,956 556,286$ 269%
Xavier University of Louisiana Annual Savings Report – Year 2
Page 9 of 18
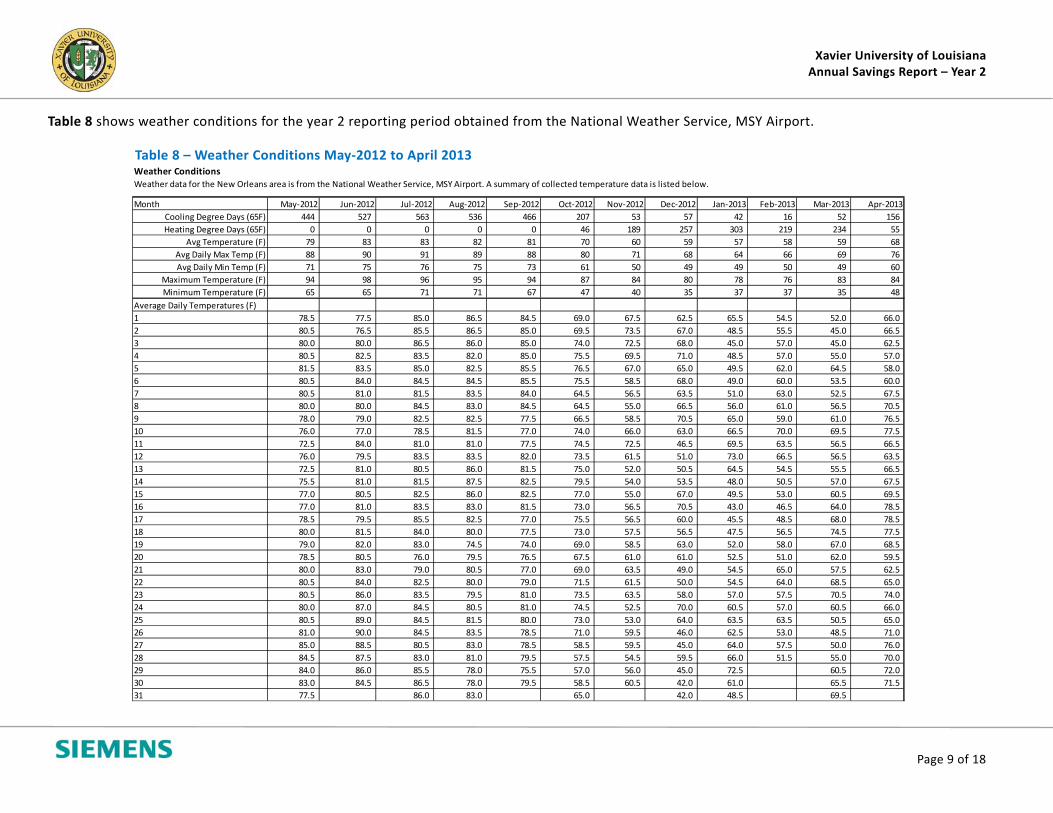
Table 8 shows weather conditions for the year 2 reporting period obtained from the National Weather Service, MSY Airport.
Table 8 – Weather Conditions May‐2012 to April 2013 Weather Conditions
Month May‐2012 Jun‐2012 Jul‐2012 Aug‐2012 Sep‐2012 Oct‐2012 Nov‐2012 Dec‐2012 Jan‐2013 Feb‐2013 Mar‐2013 Apr‐2013
Cooling Degree Days (65F) 444 527 563 536 466 207 53 57 42 16 52 156
Heating Degree Days (65F) 0 0 0 0 0 46 189 257 303 219 234 55
Avg Temperature (F) 79 83 83 82 81 70 60 59 57 58 59 68
Avg Daily Max Temp (F) 88 90 91 89 88 80 71 68 64 66 69 76
Avg Daily Min Temp (F) 71 75 76 75 73 61 50 49 49 50 49 60
Maximum Temperature (F) 94 98 96 95 94 87 84 80 78 76 83 84
Minimum Temperature (F) 65 65 71 71 67 47 40 35 37 37 35 48
Average Daily Temperatures (F)
1 78.5 77.5 85.0 86.5 84.5 69.0 67.5 62.5 65.5 54.5 52.0 66.0
2 80.5 76.5 85.5 86.5 85.0 69.5 73.5 67.0 48.5 55.5 45.0 66.5
3 80.0 80.0 86.5 86.0 85.0 74.0 72.5 68.0 45.0 57.0 45.0 62.5
4 80.5 82.5 83.5 82.0 85.0 75.5 69.5 71.0 48.5 57.0 55.0 57.0
5 81.5 83.5 85.0 82.5 85.5 76.5 67.0 65.0 49.5 62.0 64.5 58.0
6 80.5 84.0 84.5 84.5 85.5 75.5 58.5 68.0 49.0 60.0 53.5 60.0
7 80.5 81.0 81.5 83.5 84.0 64.5 56.5 63.5 51.0 63.0 52.5 67.5
8 80.0 80.0 84.5 83.0 84.5 64.5 55.0 66.5 56.0 61.0 56.5 70.5
9 78.0 79.0 82.5 82.5 77.5 66.5 58.5 70.5 65.0 59.0 61.0 76.5
10 76.0 77.0 78.5 81.5 77.0 74.0 66.0 63.0 66.5 70.0 69.5 77.5
11 72.5 84.0 81.0 81.0 77.5 74.5 72.5 46.5 69.5 63.5 56.5 66.5
12 76.0 79.5 83.5 83.5 82.0 73.5 61.5 51.0 73.0 66.5 56.5 63.5
13 72.5 81.0 80.5 86.0 81.5 75.0 52.0 50.5 64.5 54.5 55.5 66.5
14 75.5 81.0 81.5 87.5 82.5 79.5 54.0 53.5 48.0 50.5 57.0 67.5
15 77.0 80.5 82.5 86.0 82.5 77.0 55.0 67.0 49.5 53.0 60.5 69.5
16 77.0 81.0 83.5 83.0 81.5 73.0 56.5 70.5 43.0 46.5 64.0 78.5
17 78.5 79.5 85.5 82.5 77.0 75.5 56.5 60.0 45.5 48.5 68.0 78.5
18 80.0 81.5 84.0 80.0 77.5 73.0 57.5 56.5 47.5 56.5 74.5 77.5
19 79.0 82.0 83.0 74.5 74.0 69.0 58.5 63.0 52.0 58.0 67.0 68.5
20 78.5 80.5 76.0 79.5 76.5 67.5 61.0 61.0 52.5 51.0 62.0 59.5
21 80.0 83.0 79.0 80.5 77.0 69.0 63.5 49.0 54.5 65.0 57.5 62.5
22 80.5 84.0 82.5 80.0 79.0 71.5 61.5 50.0 54.5 64.0 68.5 65.0
23 80.5 86.0 83.5 79.5 81.0 73.5 63.5 58.0 57.0 57.5 70.5 74.0
24 80.0 87.0 84.5 80.5 81.0 74.5 52.5 70.0 60.5 57.0 60.5 66.0
25 80.5 89.0 84.5 81.5 80.0 73.0 53.0 64.0 63.5 63.5 50.5 65.0
26 81.0 90.0 84.5 83.5 78.5 71.0 59.5 46.0 62.5 53.0 48.5 71.0
27 85.0 88.5 80.5 83.0 78.5 58.5 59.5 45.0 64.0 57.5 50.0 76.0
28 84.5 87.5 83.0 81.0 79.5 57.5 54.5 59.5 66.0 51.5 55.0 70.0
29 84.0 86.0 85.5 78.0 75.5 57.0 56.0 45.0 72.5 60.5 72.0
30 83.0 84.5 86.5 78.0 79.5 58.5 60.5 42.0 61.0 65.5 71.5
31 77.5 86.0 83.0 65.0 42.0 48.5 69.5
Weather data for the New Orleans area is from the National Weather Service, MSY Airport. A summary of collected temperature data is listed below.
Xavier University of Louisiana Annual Savings Report – Year 2
Page 10 of 18
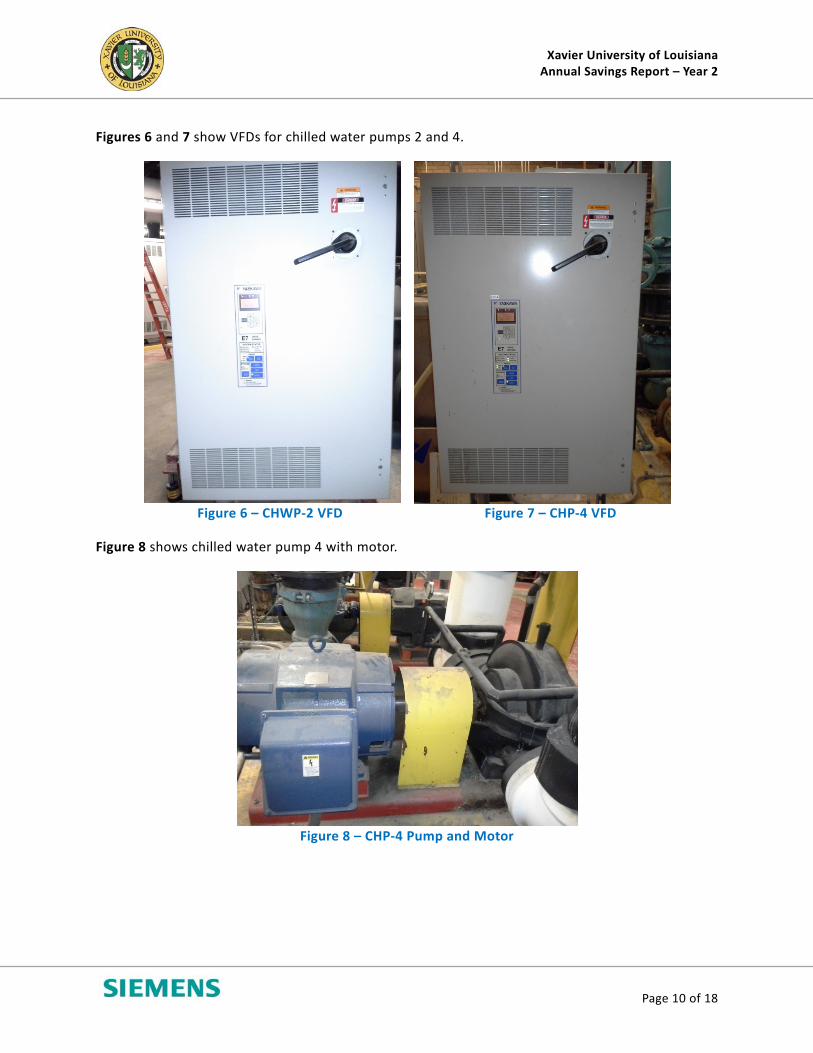
Figures 6 and 7 show VFDs for chilled water pumps 2 and 4.
Figure 6 – CHWP‐2 VFD Figure 7 – CHP‐4 VFD
Figure 8 shows chilled water pump 4 with motor.
Figure 8 – CHP‐4 Pump and Motor

Xavier University of Louisiana Annual Savings Report – Year 2
Page 11 of 18
Figure 9 shows VFDs for condenser water pumps 3 and 4.
Figure 9 – CWP‐3 and 4 VFDs
EMCS – Time of Day Scheduling and Demand Control Ventilation
This FIM involved installing and/or enhancing the Apogee Energy Management and Control System in various buildings to perform a TOD scheduling function and for implementation of DCV of the Heating, Ventilating and Air Conditioning (HVAC) equipment. This FIM also included the installation of equipment necessary to provide advanced energy management and control system strategies for the Chilled Water Plant. The following list includes some of the additional equipment installed:
Computer workstation and printer Control panel firmware and/or software upgrades Air flow measuring stations Outside air dampers Outside air damper electronic actuators Room CO2 sensors Room temperature sensors Insertion probe temperature sensors for mixed air Insertion probe relative humidity sensors Unit equipment controllers or terminal equipment controllers Outside air temperature sensors Outside air dewpoint temperature sensor Room relative humidity sensors

Xavier University of Louisiana Annual Savings Report – Year 2
Page 12 of 18
Figure 9 shows the Apogee panels in the Central Plant.
Figure 9 – Apogee Panels
Figure 10 shows a retrofitted control panel upgrade on the first floor of the Library. Figure 11 shows CO2 and humidity sensors on the first floor of the Library.
Figure 10 – Retrofitted Control Panel Figure 11 – CO2 and Humidity Sensors
Xavier University of Louisiana Annual Savings Report – Year 2
Page 13 of 18
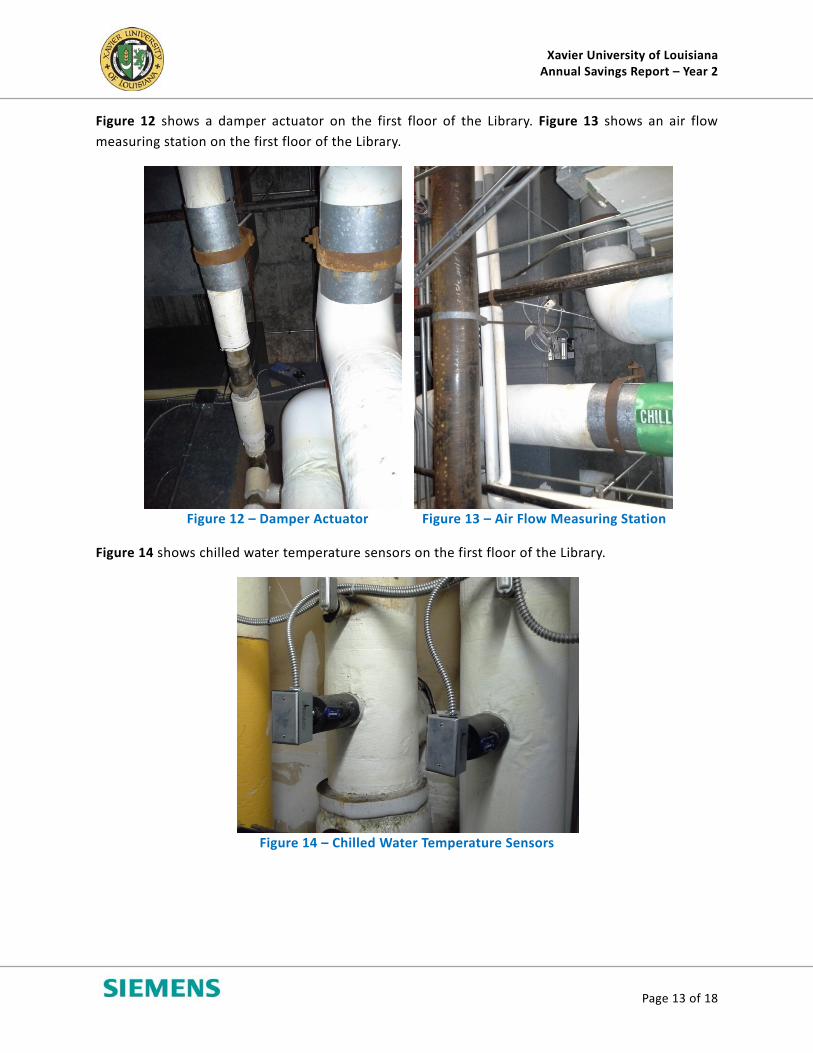
Figure 12 shows a damper actuator on the first floor of the Library. Figure 13 shows an air flow
measuring station on the first floor of the Library.
Figure 12 – Damper Actuator Figure 13 – Air Flow Measuring Station
Figure 14 shows chilled water temperature sensors on the first floor of the Library.
Figure 14 – Chilled Water Temperature Sensors

Xavier University of Louisiana Annual Savings Report – Year 2
Page 14 of 18
Figure 15 shows an upgraded control panel on the 5th floor of the Library
Figure 15 – Upgraded Control Panel
Figure 16 shows an airflow measuring station on the fifth floor of the Library. Figure 17 shows a
damper actuator on the fifth floor of the Library.
Figure 16 – Air Flow Measuring Station Figure 17 – Damper Actuator

Xavier University of Louisiana Annual Savings Report – Year 2
Page 15 of 18
Figure 18 shows a control panel upgrade at the Xavier South Plant.
Figure 18 – Upgraded Control Panel
Water Conservation
This FIM involved the installation of low flow devises to reduce potable water consumption in various buildings.
Figure 19 shows a urinal with a 0.5 gallons per flush (GPF) flush valve in the Library and Figure 20 shows a toilet with a 1.6 GPF flush valve in the Library.
Figure 19 – 0.5 GPF Flush Valve Figure 20 – 1.6 GPF Flush Valve
Xavier University of Louisiana Annual Savings Report – Year 2
Page 16 of 18
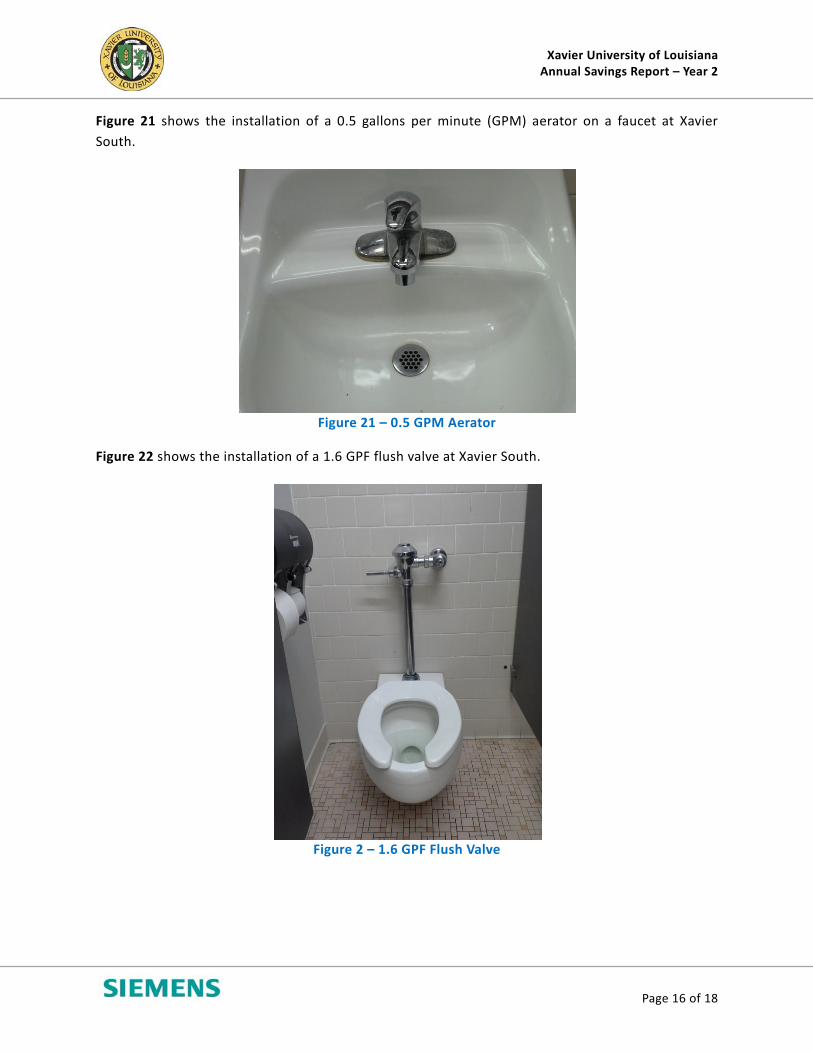
Figure 21 shows the installation of a 0.5 gallons per minute (GPM) aerator on a faucet at Xavier
South.
Figure 21 – 0.5 GPM Aerator
Figure 22 shows the installation of a 1.6 GPF flush valve at Xavier South.
Figure 2 – 1.6 GPF Flush Valve
Xavier University of Louisiana Annual Savings Report – Year 2
Page 17 of 18
Water Conservation (Metered Cooling Tower Sewerage Savings)
A flow meter was installed on the make‐up water line to the chilled water plant cooling tower. Most of the water consumed at the cooling tower is evaporated and does not reach the sewer system. The monthly consumption measured at the cooling tower flow meter should be recorded and reported to the Sewerage and Water Board so that a credit can be issued to the sewerage account. Currently, the water consumed at the cooling tower is not being reported to the Sewerage and Water Board, so no sewerage credits are being realized by Xavier University. Siemens is not reporting any cooling tower sewerage credits for this year, however, we reserve the right to initiate a baseline adjustment and claim these sewerage credits in future years.

Xavier University of Louisiana Annual Savings Report – Year 2
Page 18 of 18
Sustainability and Environmental Stewardship
In addition to energy savings, this project resulted in a significant reduction in green house gases into the atmosphere from power plants producing electricity in the New Orleans area. A reduction in over 12,600,000 pounds of CO2 was realized in the second year of this project and a reduction in over 21 million pounds of CO2 has been realized over the two year term.
Xavier University of Louisiana Annual Savings Report – APPENDIX
Page 1 of 5
APPENDIX – CHILLED WATER PLANT ENERGY GRAPHS
0
10000
20000
30000
40000
50000
60000
70000
40 50 60 70 80 90 100
Total D
aily Chilled W
ater Usage
[tonhrs]
Average Daily Temperature [°F]
Daily Chilled Water Usage
Yea…
0
500
1000
1500
2000
2500
40 50 60 70 80 90 100
Average
Daily Power [kW]
Average Daily Temperature [°F]
Avg Daily Chiller System Electric
Year 2

Xavier University of Louisiana Annual Savings Report – APPENDIX
Page 2 of 5
0
200
400
600
800
1000
1200
1400
1600
1800
40 50 60 70 80 90 100
Average
Daily Power [kW]
Average Daily Temperature [°F]
Chillers Electric
Year 2
0
50
100
150
200
250
300
40 50 60 70 80 90 100
Average
Daily Power [kW]
Average Daily Temperature [°F]
Chilled Water Pumps Electric
Year 2

Xavier University of Louisiana Annual Savings Report – APPENDIX
Page 3 of 5
0
20
40
60
80
100
120
140
40 50 60 70 80 90 100
Average
Daily Power [kW]
Average Daily Temperature [°F]
Condenser Pumps Electric
Year 2
0
50
100
150
200
250
40 50 60 70 80 90 100
Average
Daily Power [kW]
Average Daily Temperature [°F]
Cooling Towers Electric
Year 2

Xavier University of Louisiana Annual Savings Report – APPENDIX
Page 4 of 5
0
50
100
150
200
250
300
350
400
40 50 60 70 80 90 100
Average
Daily Power [kW]
Average Daily Temperature [°F]
Total Condenser System Electric(Condenser Pumps & Cooling Tower)
Year 2
0.0
0.1
0.2
0.3
0.4
0.5
0.6
0.7
0.8
0.9
1.0
0 500 1,000 1,500 2,000 2,500 3,000
System Efficiency [kw
/ton]
Chilled Water Load [tons]
Overall Chiller System Efficiency
Year 2

Xavier University of Louisiana Annual Savings Report – APPENDIX
Page 5 of 5
0.00
0.10
0.20
0.30
0.40
0.50
0.60
0.70
0.80
0.90
1.00
40 50 60 70 80 90 100
Chiller System Component Efficiencies [kW
/Ton]
Average Daily Temperature [°F]
Chiller System Efficiency
Overall System Chillers Pri & Sec Chw Pumps Cndsr Pumps Cooling Towers
Year 2
0.00
0.05
0.10
0.15
0.20
0.25
0.30
0.35
40 50 60 70 80 90 100
Chiller System Component Efficiencies [kW
/Ton]
Average Daily Temperature [°F]
Chiller System Efficiency
Pri & Sec Chw Pumps Cndsr Pumps Cooling Towers
Year 2