Embed Size (px)
Citation preview

Final reportproject Enhancing farm profitability in
north-western India and South Australia by improving grain quality of wheat
project number CIM/2006/094
date published August 2011
prepared by Professor David Coventry
co-authors/ contributors/ collaborators
Dr Jay Cummins, Dr Randhir Singh Poswal and Dr Ashok Kumar
approved by Dr Paul Fox, Research Program Manager for Crop Improvement and Management, ACIAR
final report number FR2011-23
ISBN 978 1 921962 06 6
published by ACIARGPO Box 1571Canberra ACT 2601Australia
This publication is published by ACIAR ABN 34 864 955 427. Care is taken to ensure the accuracy of the information contained in this publication. However ACIAR cannot accept responsibility for the accuracy or completeness of the information or opinions contained in the publication. You should make your own enquiries before making decisions concerning your interests.
© Australian Centre for International Agricultural Research (ACIAR) 2011 - This work is copyright. Apart from any use as permitted under the Copyright Act 1968, no part may be reproduced by any process without prior written permission from ACIAR, GPO Box 1571, Canberra ACT 2601, Australia, [email protected].

Final report: Enhancing farm profitability in north-western India and South Australia by improving grain quality of wheat
Contents
1 Acknowledgments....................................................................................4
2 Executive summary..................................................................................5
3 Background...............................................................................................6
4 Objectives..................................................................................................9
5 Methodology............................................................................................105.1 Farmer practice survey.....................................................................................................10
5.2 On-farm experiments at farmers’ fields.............................................................................10
5.3 CCSHAU Hisar research farm experiment.......................................................................12
5.4 Demonstration sites..........................................................................................................12
5.5 Indian Domestic Market Survey........................................................................................12
6 Achievements against activities and outputs/milestones...................146.1 Objective 1: To develop innovative nitrogen management scheduling with sustainable
production practices that optimise specific grain quality attributes...................................14
6.2 Objective 2: To develop innovative approaches to engaging Indian farmers in the extension of a number of specific agronomic management packages aimed at addressing wheat quality, in partnership with State Extension Officers and private agribusiness agronomists.................................................................................................15
6.3 Objective 3: To develop private sector and market linkages that focus on creating farmer awareness of wheat quality opportunities and niche market responsiveness to quality price premiums......................................................................................................16
6.4 Objective 4: To develop industry based expertise amongst Australian agricultural consultants, advisers, and leading farmers through field-scale trials and workshops relating to the use and interpretation of nitrogen sensing tools, and optimising the management associated with producing high quality wheat for domestic and international markets........................................................................................................19
7 Key results and discussion....................................................................20
8 Impacts....................................................................................................398.1 Scientific impacts – now and in 5 years............................................................................39
8.2 Capacity impacts – now and in 5 years............................................................................39
8.2 Community impacts – now and in 5 years........................................................................39
8.3 Communication and dissemination activities....................................................................41
9 Conclusions and recommendations.....................................................429.1 Conclusions......................................................................................................................42
9.2 Recommendations............................................................................................................43
Page
Final report: Enhancing farm profitability in north-western India and South Australia by improving grain quality of wheat
10 References...............................................................................................4410.1 References cited in report................................................................................................44
10.2 List of publications produced by project............................................................................44
11 Appendixes..............................................................................................4611.1 Appendix 1:...................................................................................................................... 46
Page
Final report: Enhancing farm profitability in north-western India and South Australia by improving grain quality of wheat
1 AcknowledgmentsThis study was not possible without the excellent collaboration provided by the farmers at each of the field sites: specifically we acknowledge Sahib Singh, Ramba village; Anil Kumar, Kalri village, Mukhtiar Singh, Darar village; Kuldeep Singh, Keorak village; Charantjeet Singh, Sullar village; Palamjeet Singh, Sadhura village; Ved Prakash, Chhapar village; Praveen Kumar, Chhapar village; Om Prakash, Thana village; Daljeet Singh, Madanpura village; Dharam Pal , Kapriwas village; Shiv Charan, Jarthal village; Raj Kumar, Hari Ram, Vinod, Sunil Kumar, Rakesh and Surender, Tigra village; Devender Dulhera village, Mange Ram, Jholri village, Kamal, Berwal village, Sam Sher Fateh Puri village, Mani Ram Jhabuwa village, Tek Chand Gudiyani village, Raja Ram Sahapur Begu village and Sawran Singh and Gurdeep, Baingu village.
The outstanding contribution of Dr R.K. Gupta, Principal Scientist & PI, DWR, and the staff of the Wheat Quality Laboratory is acknowledged. Without this input of providing wheat quality measurements, which was provided free of charge, the significant achievements made with this project would not have been possible.
The input provided by Mr B.S.Duggal Additional Director of the Department of Agriculture Haryana is acknowledged. So too is the input provided by DSCL and the Haryali Kisan Bazaar network, and in particular contributions by Sudhir Asthana and Rakesh Negi
Throughout the project the following staff provided regular and valuable inputs: Directorate of Wheat Research (DWR) Dr S.C. Gill, Dr R.K. Sharma, Dr B.S. Chokkar, Dr A. Kumar, Dr Ramesh Chand, and (KVK) Dr V. Yadav, A. Mehta. Dedicated project technical assistance was provided by Ajay Kumar and Amrit Riar at DWR and R.K. Jat at CSS HAU.
Dr Alessandra Bonamano undertook the agro-meteorological study as part of her PhD dissertation (University of Padova and The University of Adelaide) and Dr M.L. Khicher at CSS HAU provided some of the long-term meteorological data.
Sam Kleemann and Dr Joe Coventry gave invaluable input with the data handling and analyses. Ian Cooper assisted with the economic analysis.
Page

Final report: Enhancing farm profitability in north-western India and South Australia by improving grain quality of wheat
2 Executive summaryWheat is the main winter cereal crop of North-West India and in Haryana State is grown in an area of about 2.5 M ha. The quality of wheat for the consumer in India is very important, yet farmers do not attach much importance to quality as nearly all the wheat is sold with no segregation. Of the wheat grown, 80-85% is consumed as traditional Indian flat bread (chapatti). To date the major emphasis in wheat improvement has been on increasing wheat yield, with only limited emphasis given to wheat quality. In extensive farmer-field based experiments we have evaluated management practices that best achieve high yield and best chapatti quality. In particular we assessed yield and quality of commonly grown wheat varieties sown at differing sowing times and different rotation practice, combinations of N-fertiliser and irrigation timings, input of micronutrients, and with different crop establishment methods.
Good chapatti quality is assessed by chapatti score, and high grain hardness was shown to be the main wheat quality measure that is closely correlated with high chapatti score. The practice of sowing early, although resulting in lower protein than with later sown wheat, maintains high grain hardness, and this particularly with the recognised high chapatti quality wheats C-306 and WH-283. High grain hardness could also be achieved with the much higher yielding varieties PBW-343 and PBW-502. For the irrigated wheat the use of a 3-way split of N fertiliser applied at seeding, early tillering and first node stage provided the highest grain yields, protein, grain hardness and chapatti quality. The use of the GreenSeeker instrument, with the aim to match N supply with crop N demand, resulted in N fertiliser savings of 21 to 25 kg N ha-1 with similar grain yield, protein and grain hardness to that where the recommended 150 kg N ha-1 was used. This shows that farmers are likely to be over-fertilising their crop and a more appropriate N fertiliser recommendation both for yield and chapatti quality would be for application of a total of 130 kg N ha-1. The best grain yields obtained in these experiments were 5.5-6.0 t ha-1 and these yields are consistent with a decade-long ‘attainable yield’ identified for wheat in rice-wheat rotations for Haryana. Given these high yields were obtained at all the sites, and these were located at widely dispersed locations in Haryana, it can be concluded the nutrient management with wheat is mostly good with respect to grain yield. We obtained no evidence of S or micronutrients limiting grain yield, but a cautionary note must be given about the possibility that P availability may be limiting yield. Given that yield responses were obtained in the rice-wheat regions where farmyard manure was applied in addition to the recommended rates for N, P and K, the possibility exists that the recommended rate of 26 kg P ha-1 for the rice-wheat rotation is too low. Where S and micronutrients were used there were in all crop rotations improvements in the chapatti quality. Grain yields with zero till were similar or slightly better at all sites where zero till sowing was the method used for crop establishment. The grain from the zero till also had higher protein, grain hardness and chapatti score from all 4 of the rotations. Thus with the use of appropriate varieties, the best practice outlined here for optimising grain yield with integrated nutrient and soil management will be the same practice that optimises chapatti quality.
In the last few years, linked to local price premiums and market signals and increased farmer awareness, there are some Haryana farmers selling wheat at a premium to consumers for chapatti production. Indeed in the market place our surveys have revealed that often more than 40% of the wheat sold is sold directly and locally to consumers as unbranded wheat. The project has explored in preliminary ways getting farmers to form local village cooperatives to market branded wheat where high quality wheats have been grown. It is clear that the initial stages of the development of a quality-based market will have to follow this farmer directed ‘bottom-up’ approach. The market will have to be self-regulated with local cooperatives providing the compliance and quality assurance requirements. It is recognised that villages initially will need assistance with generating the particular needs of a cooperative including development of a marketing business plan.
Page

Final report: Enhancing farm profitability in north-western India and South Australia by improving grain quality of wheat
3 BackgroundWheat and other crops are grown sequentially in an irrigated, double cropping pattern in Haryana state (North-West India) on about 2.5 M ha. This is a major cropping system for sustaining food security in the region and Haryana plays a dominant role in building grain buffers for the whole country. There are millions of farmers and agricultural workers dependent on this system for their livelihoods. Profitability is the key motivation for these farmers and their aim has been to harvest maximum yields. The climate is semi-arid and sub-tropical, with a distinct wet rainy season (kharif) from July to September and a dry winter season (rabi) from October to April. The annual rotation sequences used are rice-wheat in the north and east of Haryana, cotton-wheat in the west of the state and pearl millet-wheat or cluster bean-wheat in the SW regions of Haryana. Wheat is planted after the kharif crop is harvested, starting from the last week of October through November and sometimes into December. These are intensive production systems with, for example, the rice and wheat sequence having a combined yield of about 11 t grain ha -1 (range 8.8-13.2 t ha-1). In northern India there is a serious concern in relation to the long-term sustainability of food production associated with the use of such intensive grain production systems, and related to the environmental impact of declining soil fertility, retraction of groundwater tables (at 20-30 cm per annum) and nitrate leaching associated with poor fertiliser management. Haryana has recently harvested record wheat production of 10.81 million tons during 2008-09 and the growth rate of wheat productivity from 1994-95 to 2002-2003 was 2.47%, although this progress has slowed down in the last few years with wheat yield productivity now at about 1% and average wheat yields (2005-09) at about 4.2 t/ha.
Of the wheat grown in Haryana, 80-85% is consumed as traditional Indian flat bread (chapatti). Consumers in the market place have a strong preference for the older wheat variety C-306 that has excellent chapatti, but yields much lower than the widely grown varieties PBW-343, PBW-502 and WH-711. Therefore the main objective for farmers has been to harvest maximum yields, and while the quality of wheat for consumers is very important, the farmers as yet have not attached much importance to quality as nearly all the wheat is sold with no segregation and price incentive. Wheat is purchased largely by Government agencies based on a minimum support price (MSP) irrespective of any quality traits, even though it is recognised that these high yielding wheats sold via the MSP mostly have fairly good chapatti quality. The MSP for the year 2009-10 was Rs 1100 per quintal (1 quintal equals 100 kg; R1000 = USD 21.50 mean for 2009-10). However, some farmers are selling the variety C-306 at around Rs 1500-2000 per quintal. An emerging opportunity has therefore been identified for selling wheat at a premium to consumers for chapatti production. Therefore there is much interest in exploring the scope for improving chapatti quality of the high yielding wheats by manipulating agronomic practices.
Most soils in Haryana where wheat is grown sequentially in an irrigated double-cropping pattern are deficient in N. In a recent survey carried out in Haryana, the most common farmer practice for N fertiliser input in the wheat phase of the rice-wheat rotation is to apply on average 165.7 kg N/ ha, with more than 50% of farmers opting for a 3-split N fertilizer schedule (Singh et al. 2010). The current recommended practice is to use150 kg N/ha, involving a 2-split schedule (1/3 basal and 2/3 at the first irrigation) (Mishra et al. 2005). The current understanding is that a 2-split application of N fertiliser is suited to the
Page

Final report: Enhancing farm profitability in north-western India and South Australia by improving grain quality of wheat
slightly heavier soils of eastern Haryana where the rice-wheat system dominates and that a 3-way split should apply in the west and south-west regions that have lighter soils and where rice is not grown. Whatever the system, farmers are usually applying N fertilizer at higher rates than the recommended 150 kg/ha to ensure getting yields.
Fertilizer management strategies need to integrate methods to both minimise soil losses and to ensure N fertiliser is applied when required as well as not using excessive rates. Low N use efficiency due to inefficient management of fertiliser N is reflected in low recovery of fertiliser N by the crop. Optical sensors (such as GreenSeekerTM) offer an opportunity to apply real time needs-based N fertiliser inputs to match N supply with crop N demand. Such sensors have enabled the reduced use of N fertiliser in rice, with reports from studies elsewhere of N rates reduced by 25-49 kg N /ha (Alam et al. 2006). To attain higher nitrogen use efficiency (NUE) and grain yield of wheat, it is essential farmers also match the application of the N fertiliser with the irrigation requirements of the crop. In a recent survey reported by Singh et al. (2010) Haryana farmers indicated they used on average 165.7 kg N ha-1 and 12.5 kg P ha-1 with wheat, and only 9.2 % of the farmers surveyed used K-fertilizer. Given the average wheat yield for Haryana is 4.2 t ha -1 (Anon 2009), this corresponds to about 80 kg N ha-1 and 12.6 kg P ha-1 removed in grain. The fertilizer recommendation for wheat is to apply 150 kg N ha-1 (2-split schedule -1/3 at sowing and 2/3 at the first irrigation) and 26 kg P ha-1 at sowing (Mishra et al. 2005), so given these application rates it is unlikely that N or P supply will be limiting for grain yield.
In these areas of Haryana where intensive grain production is practiced reports of deficiencies of micronutrients in soils, particularly Zn and Fe, have started appearing (Quinquennial Report 2002-06). Sulphur deficiency has also been identified on Haryana soils (Singh 2008). What is not known is whether there will be any additional grain yield and chapatti quality responses with addition of micronutrients and S to wheat crops alongside using best practice N and P-fertilizer input.
The traditional method of wheat establishment has involved multiple ploughings usually done with a disc harrow or tine cultivator before planting. Many farmers burn the summer crop residues (particularly rice), especially after combine harvest. In the rice-wheat production areas farmers have adopted zero tillage of wheat with the area rising from zero in 1997 to 300,000 ha in 2002. However, there has been little work done on the development of zero till systems in west and south-west Haryana where other (non-rice) summer crop rotations are used. Zero-tillage establishment of wheat after rice has benefits of allowing earlier sowing and similar or higher yields of wheat and lower costs of production. Seeding under zero-till situations where there is much loose residue often requires modification of existing tillage machines.
Whilst most wheat is sold at prices set as a minimum support price (MSP), which is fixed by the Government of India, there does seem at this time opportunity for more involvement by the private sector in wheat marketing. The MSP for wheat in India serves two purposes, firstly as a check against the price falling below a floor, and secondly to meet the procurement targets determined by the government. The MSP is based on the cost of production. This includes all actual expenses in cash and kind, rent for leased-in land, and imputed values of the cost of family labour, owned capital assets, depreciation, and the interest on fixed and variable capital and rent for owned assets. This ensures that the producers do not suffer a loss and get a price that is remunerative, and also, with some flexibility, market trends can be captured. The government purchases a significant quantity of wheat in the harvest season, so the MSP has a very strong influence on the
Page
Final report: Enhancing farm profitability in north-western India and South Australia by improving grain quality of wheat
open market price not only in the harvest season but in the entire year. With the International prices of wheat booming during 1995 and 1996, and much higher than domestic prices, various farm and industry groups started advocating for more closely aligning the domestic prices with global prices. The growing awareness about the quality of products and the rising local economy has helped consumers to pay a higher price for better chapatti wheat as well as other food products.
In parallel farmers must be engaged in both the supply of guaranteed high chapatti quality grain and also the maintenance of marketing opportunities for this grain. At this stage there is only limited awareness amongst farmers of such marketing opportunities. This therefore is the overarching aim of this project; to develop awareness of what constitutes chapatti quality, how to produce economically best chapatti quality wheat, and how to financially benefit from the production of best chapatti quality wheat.
Page

Final report: Enhancing farm profitability in north-western India and South Australia by improving grain quality of wheat
4 Objectives1. To develop innovative nitrogen management scheduling with sustainable
production practices that optimise specific grain quality attributes
2. To develop innovative approaches to engaging Indian farmers in the extension of a number of specific agronomic management packages aimed at addressing wheat quality, in partnership with State Extension Officers and private agribusiness agronomists
3. To develop private sector and market linkages that focus on creating farmer awareness of wheat quality opportunities and niche market responsiveness to quality price premiums.
4. To develop industry based expertise amongst Australian agricultural consultants, advisers, and leading farmers through field-scale trials and workshops relating to the use and interpretation of nitrogen sensing tools, and optimising the management associated with producing high quality wheat for domestic and international markets.
Page

Final report: Enhancing farm profitability in north-western India and South Australia by improving grain quality of wheat
5 Methodology
5.1 Farmer practice surveyA block wise survey was conducted during 2007-08 in 116 villages (7-8 farmers per block) that involved 927 farmers in the 20 districts of Haryana (Table 1). From each village, 2 marginal (<1ha) 2 small (1-2ha), 2 medium (2-4ha) and 2 large (>4ha) farmers were surveyed to represent all the categories of farmers. Specific blocks were identified through previous block survey analyses and related trial data through the Directorate of Wheat Research (Karnal) and CSS Haryana Agricultural University (Hisar) (Singh et al. 2010). Block selection was also influenced by local crop rotation sequences, reflecting the diversity of rotations. The survey targeted information on current wheat production practices, including information on variety choice, fertilizer practice, pest control and tillage practice.
5.2 On-farm experiments at farmers’ fields A comprehensive series of on-farm experiments at farmers’ fields were conducted in the winter seasons of 2007-08 and 2008-09 at locations in Karnal, Sirsa, Rewari and Mahendergarh districts. Here four separate experiments were sown in rice-wheat (Karnal), cotton-wheat (Sirsa), pearl millet-wheat and cluster bean-wheat rotations (Rewari in 2007-08 and Rewari and Mahendergarh in 2008-09). A time of sowing experiment split with different wheat varieties had as the main plot 3 dates of sowing and varieties as sub-plots. In the Karnal region the fully replicated (3) experiments were undertaken on 3 separate farms at villages Darar, Ramba and Kalri. In the Sirsa and Rewari/Mahendergarh districts during 2007-08 the trial at each of two sites per rotation were replicated while in 2008-09 individual farm sites were used as replicates. There were four locations with the cotton-wheat cropping system in district Sirsa, two located in village Sahapur Begu situated 8 km south of Sirsa and two in village Baingu, 20 km north of Sirsa. Two of the pearl millet-wheat and clusterbean-wheat were situated in two adjacent fields in village Kapriwas (district Rewari) 30 km from Gurgaon. The second 2 pearl millet-wheat and clusterbean-wheat sites were situated in village Dulhera (district, Rewari) close to the CCSHAU Regional Research Station, Bawal during 2007-08. But during 2008-09, each of two of the pearl millet–wheat and clusterbean-wheat were situated in village Kapriwas and Jarthal (Rewari), at two locations in Tigra (Mahendergarh) and for cotton-wheat in village Sahapur Begu (2 locations), Baingu (2 locations). In 2007-08 six varieties (DBW-17, PBW-502, PBW-343, Raj-3765, WH-283, C-306) were used at all sites. In 2008-09 these six varieties were also used at all sites but additionally at the Karnal sites PBW-550 was included and at Sirsa and Rewari/Mahendergarh sites PBW-550 and WH-1025 were included. The three sowing dates for the different sites were 20th October, 15th November and 10th December during both the years at Karnal; at Sirsa (2007-08) 6th November, 22nd November and 8th December and (2008-09) 5th November, 20th November and 5th December; at Rewari (2007-08) 2nd November, 15th November and 14th December and (2008-09) 5th November, 20th November and 5th December in Rewari and Mahendergarh. The basal fertiliser regime comprised 50 kg N ha-1, 26 kg P ha-1 and 33 kg K ha-1 applied at seeding. Urea was also used twice as a topdressing application at 100 kg N ha-1 (½ at 22 days after sowing (DAS) and ½ at 45 DAS just before
Page

Final report: Enhancing farm profitability in north-western India and South Australia by improving grain quality of wheat
applying irrigation). Irrigations were undertaken using the farmer check basin method with the farmers applying water at 22, 45, 65, 85, 105, 120 DAS.
A second experiment involved different split applications of N-fertiliser and different irrigation scheduling. At each of the above sites there were 4 irrigation schedule treatments that were split with 3 nitrogen management treatments. The main plots consisted of four irrigation treatments; they were 3 irrigations (22, 65, 105 DAS), 4 irrigations (22,45, 85,105 DAS), 5 irrigations (22,45, 65, 85,105 DAS) and 6 irrigations (22,45, 65, 85,105, 120 DAS) using a check basin method. The sub-plot consisted of three nitrogen schedules (1/3 basal + 2/3 at 45/65 DAS; 1/3 basal +1/3 at 22 DAS + 1/3 at 65/85 DAS and No basal + ½ at 22 DAS + ½ at 45/65 DAS). The recommended dose of NPK applied with all sub-plots was 150:26:33 kg element/ha input.
In another nutrient experiment included micronutrients with 10 treatments at each site, and these were arranged within blocks and replicated as given above. The nutrients were i) common farmer practice (conventional) (125 kg ha-1 of diammonium phosphate at sowing and two applications of 50kg urea ha-1 at 25 days after sowing (DAS) and 45 DAS with irrigations), ii) recommended NPK (50 kg N ha-1, 26 kg P ha-1 and 33 kg K ha-1 applied at seeding. Urea was also used twice as a topdressing application at 100 kg N ha-1 (½ at 22 DAS and ½ at 45 DAS just before applying irrigation), iii) NPK plus FM (recommended NPK plus Farm Yard Manure (FM) at 15 t ha-1 with the FM applied 3-4 days pre-sowing), iv) NPK plus all secondary and micronutrients (recommended NPK plus boron, copper, iron, sulphur, zinc and manganese as below), v) NPK plus B (recommended NPK plus B as Borax (0.2%) as foliar spray 35-55 DAS), vi) NPK plus Cu (recommended NPK plus Cu as CuS04 (0.2%) as foliar spray 35 and 55 DAS), vii) NPK plus Fe (recommended NPK plus Fe as FeS04 (0.5 %) as foliar spray 35 and 55 DAS), viii) NPK plus S (recommended NPK plus S Reap® 90WDG (10 kg ha-1) at first irrigation in rice wheat cropping system and as gypsum (250 kg ha-1) basal at sowing) in other systems, ix) NPK plus Zn (recommended NPK plus Zn at 0.5% as foliar spray at 35 and 55 DAS in rice wheat system and as ZnSO4 (25 kg ha-1) basal at sowing in the other systems, and x) NPK plus Mn (recommended NPK plus Mn as MnS04 (0.5%) as foliar spray 30 DAS.
The final experiment was a tillage experiment and this involved two systems of sowing the wheat, namely conventional and zero tillage in a split arrangement with fertiliser treatments (nitrogen and sulphur). Recommended NPK was as described above and NPK plus S was the recommended NPK with S application as given above. Zero tillage (ZT) sowing was done with zero-till-seed-cum-fertilizer drill and conventional tillage involved field preparation with 4-6 harrowings and planking before wheat sowing with the same seeder. At the Karnal sites (rice-wheat rotations), within this experiment different rates of N-fertiliser were included within the conventional tillage treatment. These subplots were treatments with the recommended NPK (150:26:33 kg /ha), recommended PK plus an N-fertiliser application that was based on GreenSeeker measured values, and recommended PK plus N-fertiliser applied at a high rate (200:60:40 kg/ha). The full amount of PK and 1/3rd N-fertiliser was applied as basal at the time of seeding, a second split of 1/3rd N-fertiliser was applied at the first irrigation in all the treatments and the remaining 1/3rd N-fertiliser was applied with the second irrigation in two of the NPK treatments (recommended and N rich), whereas in the third treatment N was applied based on GreenSeeker observations.
Observations were recorded during the crop growth cycle on yield attributes and finally grain yield. The effective tillers were counted about a fortnight before harvesting in one
Page

Final report: Enhancing farm profitability in north-western India and South Australia by improving grain quality of wheat
running meter at two places in each plot and converted to per meter square. At harvesting, crop biomass (straw and heads) was recorded before threshing (three 1 m x 2 m quadrants). The threshing was done by small plot thresher and after recording the yield, a random sample was taken from each treatment to evaluate 1000 grain weight (TGW) and grain quality. Protein content, hectolitre weight, grain hardness index (no units) and sedimentation value were measured for all grain samples. For the evaluation of chapatti quality, various parameters like water absorption, nature and colour of dough (before and after maturation), chapatti appearance, colour, aroma, taste, puffing height, pliability and loss of water (just after and after 4 hrs of baking) were considered and a score was given out of 10.0. All quality analyses were undertaken at the Wheat Quality Laboratory, Directorate of Wheat Research, Karnal. All the agronomy and quality data were subjected to analysis of variance using the GENSAT package, and correlations were plotted using EXCEL. In some situations the Tukay’s range analysis was used to compare value means.
5.3 CCSHAU Hisar research farm experimentThree separate experiments with either 3 or 4 replicates were undertaken on the experimental farm (sandy loam texture) of Haryana Agricultural University (Hisar) to evaluate the above described agronomic practices with wheat (2008-09 winter crop). The practices were: Wheat varieties and time of sowing; Tillage and N rates; Nitrogen input and irrigation. The wheat crop was sown following either cotton (Gossypium hirsutum), pearl millet (Pennisetum glaucum) or cluster bean (Cyamopsis tetragonoloba) (all preceding monsoon sown crops were in adjacent blocks, thus a split plot design). The variety used was PBW-502 for the latter 2 experiments and planting occurred on 6 th
November following cotton and cluster bean and 23rd November following pearl millet.
5.4 Demonstration sitesDemonstration sites were established at multiple locations in four seasons. In the first 2 seasons the demonstrations were simple block side-by-side comparisons featuring improved practices with farmer practice. In the final 2 seasons (2009-10, 2010-11) the demonstrations also compared farmer practice with improved practice with the latter best management based on obtaining the best yield and chapatti outcomes as per the information obtained from the research experiments. All 4 rotations were represented and wherever possible the sites were established associated with a Hariyali Kisan Bazaar outlet.
5.5 Indian Domestic Market Survey A random street-wise market survey was conducted in May-June 2011 in several sectors of Karnal city. A standard interview proforma was used and 2 DWR staff undertook the interviews, with questions covering household characteristics, wheat/flour consumption/requirements and preferences. Another survey was taken of 20 Karnal retailers, seeking information of branded and unbranded wheat/flour sources and sales.
At training programme on chapatti quality evaluation was organized for 28 women, mostly young (< 25 years), though age varied between 22 to 59 years, both from rural and urban backgrounds, all literate with minimum high school of education. They were trained on how to record the ‘kitchen –based’ parameters. They were provided with one kg flour of
Page

Final report: Enhancing farm profitability in north-western India and South Australia by improving grain quality of wheat
pure varieties as well as mixed flour, water measuring cylinder and a scale to record the parameters. They were asked to taste and record observations for the raw chapatti without taking other food.
Page

Final report: Enhancing farm profitability in north-western India and South Australia by improving grain quality of wheat
6 Achievements against activities and outputs/milestones
6.1 Objective 1: To develop innovative nitrogen management scheduling with sustainable production practices that optimise specific grain quality attributes
no. activity outputs/milestones
completion date
comments
1.1 Undertake Region and Block survey analysis to identify trends in wheat production, quality and agronomic management (India)
1. Survey report summary prepared and distributed to project staff and stakeholders
2. Survey identifies specific districts (or blocks) in which to target on-farm trial and demonstration program
Yr 3 7/09 – 1/10
Block wise survey was conducted from 116 blocks of 20 districts of Haryana with the help of State Department of Agriculture. These data have been analysed and are being used in various publications
1.2 Conduct on-farm experimentation (India) to achieve specific quality outcomes
*irrigation x nitrogen management to optimise protein content
*variety x sowing times to optimise grain hardness and grain size
1. Primary Field Trial sites identified and trial protocol and treatments established
2. Nitrogen budgets developed and summarised
3. Primary Field Trials conducted, data and observations collected and summarised as part of an annual progress report.
4. Farmer field day conducted, attended by local farmers linked to each Primary Field trial site.
Yr 1 10/07-3/08
Yr 2 10/08-3/09
Yr 3 10/09-3/10
Yr4 10/10-3/11
Primary Field trial sites were completed according to established protocol and project output requirements.
Soil samples from these sites have been analysed and included in publications.
Field trial treatments and management of trials undertaken in accordance with seasonal growing conditions and trial treatment protocol.
Complete agronomic and quality data from all 2007-08 and 2008-09 sites have been collated and statistically analysed. These data are the basis of 3 published papers (Field Crops Research).
The data from the 2009-10, 2010-11 sites is being used for an economic analysis of best practice management.
Farmer field days were held in February-March 2009 2010 and 2011 at 20+ sites and were all well attended
PC = partner country, A = Australia
Page

Final report: Enhancing farm profitability in north-western India and South Australia by improving grain quality of wheat
6.2 Objective 2: To develop innovative approaches to engaging Indian farmers in the extension of a number of specific agronomic management packages aimed at addressing wheat quality, in partnership with State Extension Officers and private agribusiness agronomists
no. activity outputs/milestones
completion date
comments
2.1 Introduce crop monitoring and comparative analysis tools for use by farmers, research, extension and agribusiness professionals, focussing on wheat quality, productivity and environmental management systems (EMS) principles.
1. Wheat quality based crop monitoring cards, monitoring guide and tools developed and distributed to selected extension officers, agronomists and farmers involved in the project
2. Train the trainer session for Extension Officers and agronomists conducted
3. Spreadsheet developed for analysis of crop monitoring data
4. Demonstration of crop monitoring systems undertaken adjacent to each trial site to farmers
5. Wheat crop monitoring data collated, with a summary report prepared.
Yr 1 7/07-10/07
Yr 2 7/08-10/08
Yr 3 7/09-10/09
Training was organized on “Monitoring of Wheat Crop” in collaboration with HKB, Ladwa in which 100 farmers and 10 officials of Hariyali Kisan Bazar participated. Activities also included farmer training on crop monitoring approaches, as well as train the trainer activities of agribusiness and extension agronomists involved in the project.
Page

Final report: Enhancing farm profitability in north-western India and South Australia by improving grain quality of wheat
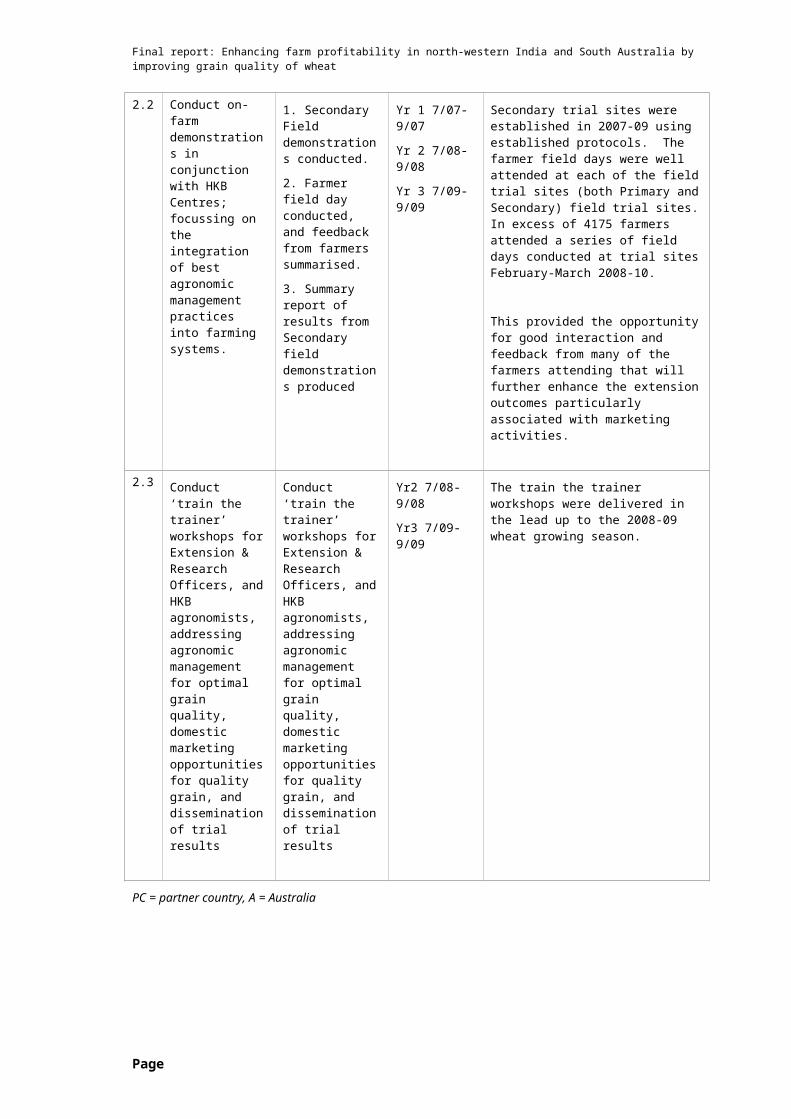
2.2 Conduct on-farm demonstrations in conjunction with HKB Centres; focussing on the integration of best agronomic management practices into farming systems.
1. Secondary Field demonstrations conducted.
2. Farmer field day conducted, and feedback from farmers summarised.
3. Summary report of results from Secondary field demonstrations produced
Yr 1 7/07-9/07
Yr 2 7/08-9/08
Yr 3 7/09-9/09
Secondary trial sites were established in 2007-09 using established protocols. The farmer field days were well attended at each of the field trial sites (both Primary and Secondary) field trial sites. In excess of 4175 farmers attended a series of field days conducted at trial sites February-March 2008-10.
This provided the opportunity for good interaction and feedback from many of the farmers attending that will further enhance the extension outcomes particularly associated with marketing activities.
2.3 Conduct ‘train the trainer’ workshops for Extension & Research Officers, and HKB agronomists, addressing agronomic management for optimal grain quality, domestic marketing opportunities for quality grain, and dissemination of trial results
Conduct ‘train the trainer’ workshops for Extension & Research Officers, and HKB agronomists, addressing agronomic management for optimal grain quality, domestic marketing opportunities for quality grain, and dissemination of trial results
Yr2 7/08-9/08
Yr3 7/09-9/09
The train the trainer workshops were delivered in the lead up to the 2008-09 wheat growing season.
PC = partner country, A = Australia
6.3 Objective 3: To develop private sector and market linkages that focus on creating farmer awareness of wheat quality opportunities and niche market responsiveness to quality price premiums.
no. activity outputs/milestones
completion date
comments
Page

Final report: Enhancing farm profitability in north-western India and South Australia by improving grain quality of wheat
3.1 Conduct an Indian market survey analysis aimed at identifying opportunities for marketing grain into niche markets by Indian farmers
1. Market Assessment survey undertaken to Identify specific niche markets, marketing approach adopted, constraints in marketing, opportunity to establish a platform for better marketing and price premiums for farmers
The CCSHAU and DWR have conducted survey of markets. In addition to this, the grain marketing survey was expanded to include a regional block survey analysis of agronomic management practices. Support in undertaking the survey has been obtained from the State Department of Agriculture (Haryana) and the Haryana Agricultural University KVK Extension Officers.
3.2 Conduct selected visits by farmers to Bakers Circle baking facilities to create greater awareness of links between quality grain and bread products
1. Farmers participate in visit to Bakers Circle facilities in Haryana
2.Farmer awareness of quality requirements (demanded by end-users of wheat flour) enhanced
Two visits to the Bakers Circle Factory facilities at Uttarakhand was undertaken (March 2008 and 2010). These visits included 20 participating farmers from the Haryana sites and were led respectively by Jay Cummins and Michael Wurst from Rural Solutions Australia. Mr Dev Lall, owner of the Bakers’ Circle and Mr Naveen Sanders, CEO interacted with the farmers and officials.
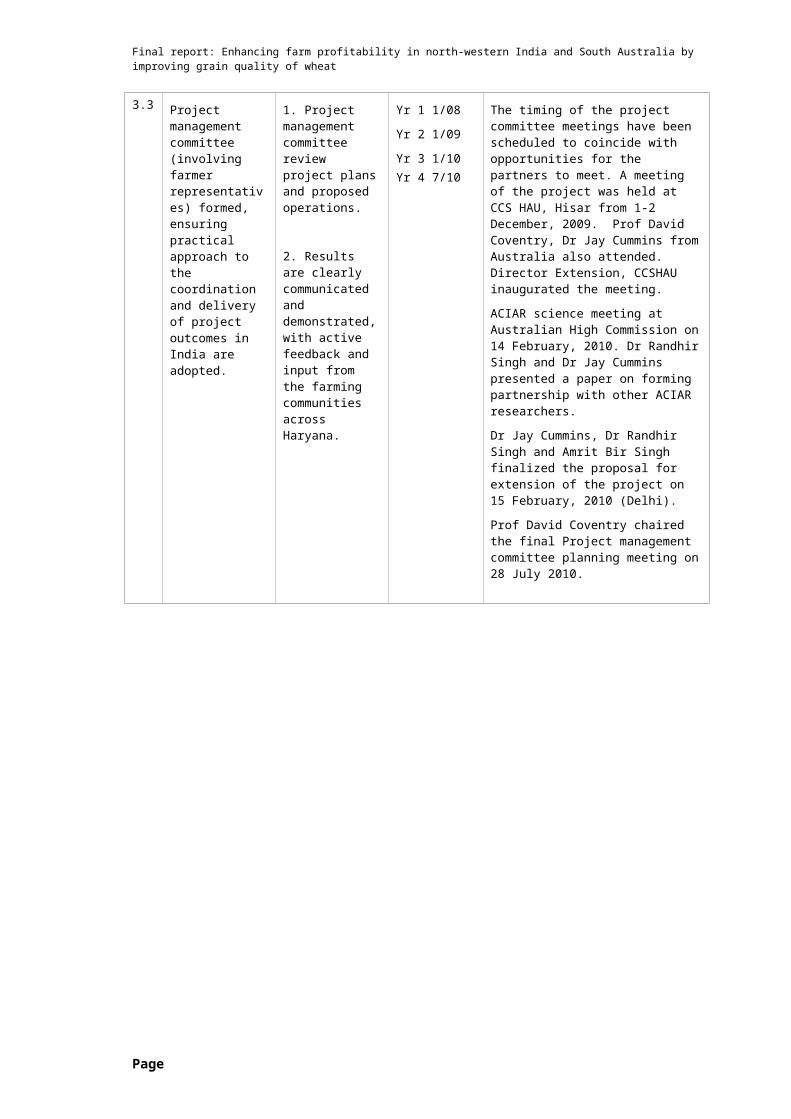
3.3 Project management committee (involving farmer representatives) formed, ensuring practical approach to the coordination and delivery of project outcomes in India are adopted.
1. Project management committee review project plans and proposed operations.
2. Results are clearly communicated and demonstrated, with active feedback and input from the farming communities across Haryana.
Yr 1 1/08
Yr 2 1/09
Yr 3 1/10Yr 4 7/10
The timing of the project committee meetings have been scheduled to coincide with opportunities for the partners to meet. A meeting of the project was held at CCS HAU, Hisar from 1-2 December, 2009. Prof David Coventry, Dr Jay Cummins from Australia also attended. Director Extension, CCSHAU inaugurated the meeting.
ACIAR science meeting at Australian High Commission on 14 February, 2010. Dr Randhir Singh and Dr Jay Cummins presented a paper on forming partnership with other ACIAR researchers.
Dr Jay Cummins, Dr Randhir Singh and Amrit Bir Singh finalized the proposal for extension of the project on 15 February, 2010 (Delhi).
Prof David Coventry chaired the final Project management committee planning meeting on 28 July 2010.
Page

Final report: Enhancing farm profitability in north-western India and South Australia by improving grain quality of wheat
3.4 Development and introduction of ‘high quality wheat flour products’ for trial market consumer assessment
1. Farmer identified with some experience in niche marketing of grain, and who have available high quality wheat for trial marketing through Hariyali Kissan Bazzar (HKB) retail network
2. Product processed, packaged and branded
3. Trial consumer market assessment undertaken (including ‘standard quality’ flour alongside high premium quality chapatti flour), incorporating consumer feedback on product comparisons
Preliminary work on developing farmer cooperatives has been undertaken. Whilst this concept has been discussed at many field days, more work is required in assisting farmers with the understanding of the role and workings associated with ’self-marketing’ of chapatti quality wheaet.
3.5 Conduct Best Bet Management Practices Field demonstrations (on-farm) across Haryana in conjunction with HKB Centres (supported by State Extension Officers); and State Department Agriculture, Haryana
1. Twenty Field Demonstration sites identified, with sites assigned to HKB store across Haryana
2. Soil analysis data collected, crop at trial site monitored through the growing season.
3. Field day conducted at each site during latter crop growth period, incorporating demonstration of agronomic best practice, and niche marketing opportunities for high quality grain
The data generated from these sites is being used in an economic analysis of the production of chapatti quality wheat.
PC = partner country, A = Australia
Page

Final report: Enhancing farm profitability in north-western India and South Australia by improving grain quality of wheat
6.4 Objective 4: To develop industry based expertise amongst Australian agricultural consultants, advisers, and leading farmers through field-scale trials and workshops relating to the use and interpretation of nitrogen sensing tools, and optimising the management associated with producing high quality wheat for domestic and international markets.
no. activity outputs/milestones
completion date
comments
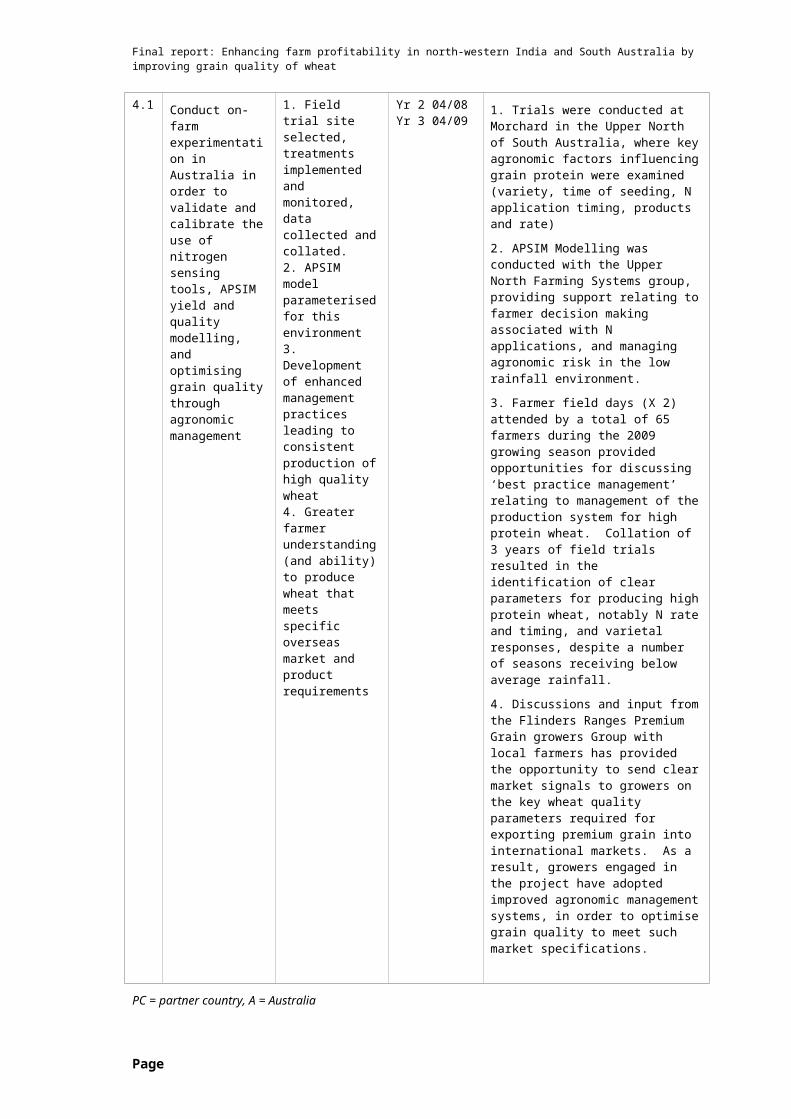
4.1 Conduct on-farm experimentation in Australia in order to validate and calibrate the use of nitrogen sensing tools, APSIM yield and quality modelling, and optimising grain quality through agronomic management
1. Field trial site selected, treatments implemented and monitored, datacollected and collated.2. APSIM model parameterised for this environment3. Development of enhanced management practices leading to consistentproduction of high quality wheat4. Greater farmer understanding (and ability) to produce wheat that meetsspecific overseas market and product requirements
Yr 2 04/08Yr 3 04/09
1. Trials were conducted at Morchard in the Upper North of South Australia, where key agronomic factors influencing grain protein were examined (variety, time of seeding, N application timing, products and rate)
2. APSIM Modelling was conducted with the Upper North Farming Systems group, providing support relating to farmer decision making associated with N applications, and managing agronomic risk in the low rainfall environment.
3. Farmer field days (X 2) attended by a total of 65 farmers during the 2009 growing season provided opportunities for discussing ‘best practice management’ relating to management of the production system for high protein wheat. Collation of 3 years of field trials resulted in the identification of clear parameters for producing high protein wheat, notably N rate and timing, and varietal responses, despite a number of seasons receiving below average rainfall.
4. Discussions and input from the Flinders Ranges Premium Grain growers Group with local farmers has provided the opportunity to send clear market signals to growers on the key wheat quality parameters required for exporting premium grain into international markets. As a result, growers engaged in the project have adopted improved agronomic management systems, in order to optimise grain quality to meet such market specifications.
PC = partner country, A = Australia
Page
Final report: Enhancing farm profitability in north-western India and South Australia by improving grain quality of wheat
7 Key results and discussion
Survey and variety information
The average wheat yield in Haryana was 4.39 t/ha. The variety PBW 343 (61.85%) was the leading variety sown followed by WH 711 (22.84%), PBW 502 (13.58%), WH 283 (6.14%), WH 147 (4.09%) and Raj 3765 (5.39%). There are a number of other varieties grown in small areas. Though the majority of the farmers followed conventional tillage practices to grow wheat crop, about 11.42% follow zero tillage technology and 8.84% reduced tillage. Most of the farmers used their own seed (100%) as well as purchased seed from private traders (48.60%) and government agencies (26.19). The quality of seed was reported to be good (84.38 %) by the majority of the farmers. The other farmers reported seed of medium (13.15%) and average (2.48%) quality. The average seed rate was used at 115 kg/ha. Most of them (67.13%) treated the wheat seed. Majority (68.75 %) of the farmers completed wheat sowing during 1-15 November, whereas 25.32 percent had sown during 16-30 November. A negligible percent (4.63) of the farmers had sown wheat during October. The average use per hectare of nitrogen, phosphorus (P2O5) and potash was 138, 55 and 34 kg. Nitrogen was used by all the farmers, phosphorous by 65.62% and potash by 16.05%. Zinc (25 kg/ha) was applied by 12.7% of farmers. Topic (34.05%), Leader (20.47%), Algrip (13.90%) and 2,4-D (10.78%) were the main herbicides applied by the farmers to control weeds in wheat crop. Most of the farmers applied three to six irrigations. The majority (79.74%) of the farmers manually harvested their wheat crop (in Haryana), however, a trend was observed for combine harvesting (20.26%). Those who got their wheat crop harvested by combine harvester, had used reaper for straw making. Some of the farmers burnt wheat crop residue.
PBW-343 is the dominant variety (mean 62%) in all of the 20 districts in Haryana with the equally high yielding variety WH-711 the clear second most preferred variety (mean 18%). Of the varieties, PBW-343 has a higher preference by farmers in the rice-wheat districts located in the eastern parts of Haryana (Table 1). PBW-502 which is a more recently released variety has at this stage only limited grower use. WH-147 is preferred by farmers in districts that have areas of sodic/saline soils. The lower yielding varieties WH-283 and C-306 have some use in the south-west districts, particularly where pearl-millet is the main rotation crop with wheat. Of the other varieties PBW-373, Raj-3765, UP-2338, HD-2009 and HD-2851 were grown by very few farmers. Whilst conventional tillage is predominant across all the cropping systems in Haryana, zero tillage has been adopted by many farmers (3-25% range) in the predominant rice-wheat growing districts (Table 1). Zero tillage has also some adoption in cotton-wheat districts (eg. Hisar 10% of farmers sampled). However there were no instances of adoption of zero tillage with the sampled farmers in the predominant pearl millet-wheat and cluster bean- wheat districts.
Page

Final report: Enhancing farm profitability in north-western India and South Australia by improving grain quality of wheat
Table 1: Percentage of farmers in Haryana regions with sowing method and the variety listed as primary variety
RotationsTillage % ZT PBW-343 PBW-502 WH-711
WH-283/C-306 WH-147 Other
Sonepat aRW 22.5 88 6 6 0 0 0Panipat RW 5.7 96 5 0 0 0 0Karnal RW 3.1 80 11 4 0 0 6Kurukshetra RW 25.2 66 8 20 0 0 5 Kaithal RW 19.9 98 3 0 0 0 0Jind RW,bPW 18.4 78 2 5 2 0 15Ambala RW,PW 8.6 42 6 46 0 0 6Yamunanagar cSW, RW, 13.8 21 13 67 0 0 0Faridabad dCW,RW 3.4 86 8 5 0 0 3Panchkula eMW, PW 0 47 3 44 0 0 6Sirsa CW 0 67 9 0 0 16 8Hisar CW,PW 10.8 76 4 6 6 0 8Fatehbad fCBW, RW 23.4 69 3 6 0 10 8Gurgaon PW 0 60 0 35 3 0 3Mewat PW 0 46 2 15 8 2 27Jhajjar PW,RW 0 40 0 18 13 5 8Rohtak PW, CBW 0 63 0 16 9 0 12Rewari PW, CBW 0 31 5 21 33 0 10Mahendragarh PW, CBW 0.4 78 5 10 8 0 0Bhiwani PW, CBW 0 32 1 30 6 18 9
8.3 62 5 18 4 4 7aRW rice-wheat, bPW pearl millet-wheat, cSW sugar-wheat, dCW cotton-wheat, eMW maize-wheat
Page
Final report: Enhancing farm profitability in north-western India and South Australia by improving grain quality of wheat
Soil data
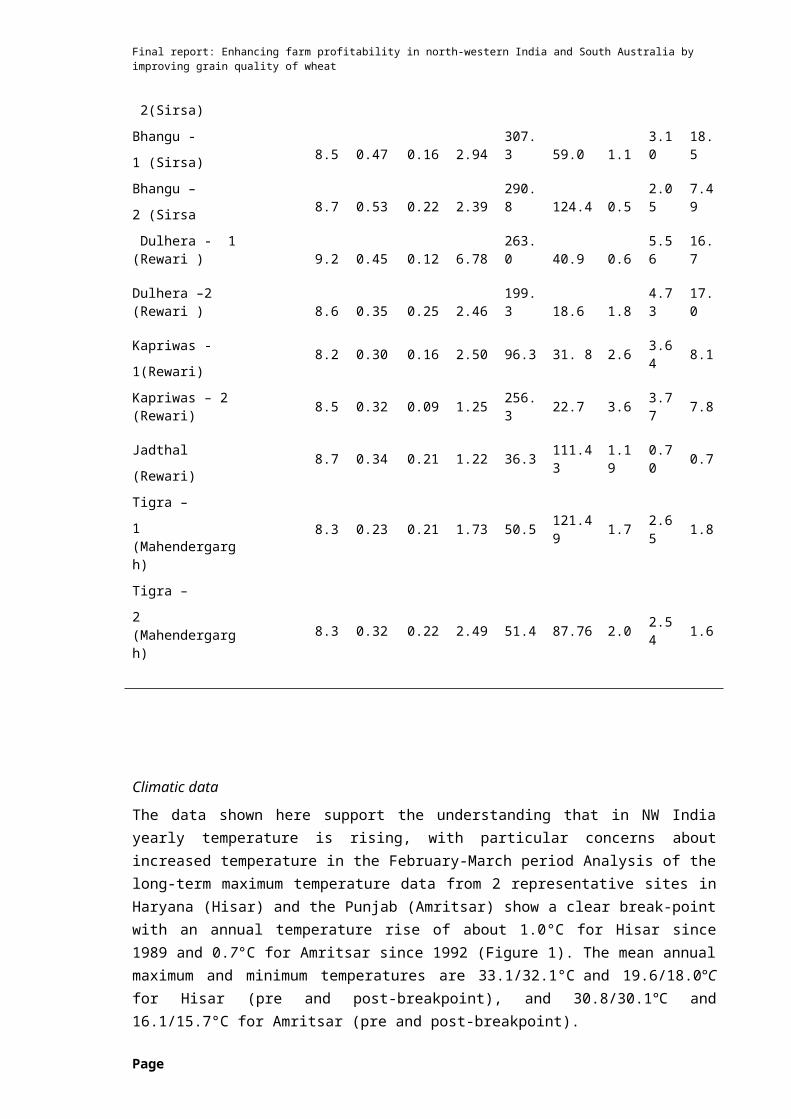
At all locations the soil was alkaline in reaction (pH 8.1-9.2), mostly low in OC with slightly higher values with the rice-wheat rotation (range 0.36-0.56%) compared with the other cropping systems (range 0.09-0.25 %), low in P and medium to high in available K (Table 2). Based on a deficiency value for available S of <20mg kg -1 the S values measured at each site would suggest this nutrient would be sufficient. For the micronutrients Zn and Fe were in the low range at most of the west and south-west locations (Singh 2008). The EC measured was from 0.3-1.1 dS m-1 indicating salinity was not an issue at these sites, with the possible exception of Kalri (Table 2).
The values for P from all farmer sites of the experiments reported here showed mostly very low levels of soil P. Farmers in rice-wheat systems are recommended to apply 26 kg P ha-1 in the wheat phase of the rotation. Numerous experiments have demonstrated this application rate gives the highest wheat yields, with supply of P from fertilizer addition exceeding removal of P in the crop (Bijay Singh et al. 2000). However data from long-term experiments with rice-wheat rotations where the 26 kg P ha-1 rate is used show no on-going improvement in the P balance in the soil (Bijay Singh et al. 2000). Given recent survey data shows Haryana farmers on average use 12 kg P ha-1 for the wheat crop, these intensive systems are likely to be mostly in a negative P balance in the soil (Singh et al. 2010). From the data given in this paper we cannot tell if the soils at the farmer sites would be responsive to additional P input, as the recommended-NPK fertilizer treatment had similar P input to the typical farmer practice (conventional) treatment. However with all the rice-wheat sites in both seasons the addition of farm yard manure (FM) gave the most grain yield (data shown later). K-fertiliser is not used much by Haryana farmers and with the farmer sites used in the experiments reported here there was adequate soil levels of K, such that any deficiency is unlikely. Farm yard manure does provide benefits to the P balance of soils, and with the low soil P status in the rice-wheat sites, and the grain yield responses of 6-13% recorded at these sites with addition of FM, this may suggest that the recommended rate of 26 kg P ha-1 for the rice-wheat rotation is too low.
Page

Final report: Enhancing farm profitability in north-western India and South Australia by improving grain quality of wheat
Table 2: Values for the soil chemical analyses for the experimental sites (0-15 cm depth) and sufficiency ratings for each measure
Site Rating
(for cereal crops)
pH
(1:2)
EC(1:2)
dS m-1OC(%)
P2O5
(mg kg-1)
K2O
(mg kg-1)
S
(mg
kg-1)
Zn
(mg kg-1)
Fe
(mg kg-1)
Mn
(mg kg-1)
Low <6.5 <0.8 <0.40 <2.5 <60 <20 <1.0 <4.5 <1.0
Medium 6.5-8.7
0.8-2.5
0.40-0.75
2.5-12.5
60-140 20-40 1.0-
3.04.5-9.0
1.0-2.0
High >8.7 >2.5 >0.75 >12.5 >140 >40 >3.0 >9.0 >2.0
Darar (Karnal) 8.1 0.39 0.36 2.27 86.9 75.4 4.00 38.2 10.5
Ramba (Karnal) 8.2 0.50 0.53 6.29 114.2 96.3 6.7 32.3 10.7
Kalri (Karnal) 8.3 1.03 0.56 2.27 86.9 142.3 4.9 35.8 13.1
Begu Shahpur –
1(Sirsa)8.4 0.41 0.21 5.88 281.3 59.0 2.1 3.64 10.3
Begu Shahpur –
2(Sirsa) 8.4 0.52 0.13 6.73 317.8 94.4 1.9 3.37 10.2
Bhangu -
1 (Sirsa) 8.5 0.47 0.16 2.94 307.3 59.0 1.1 3.10 18.5
Bhangu –
2 (Sirsa 8.7 0.53 0.22 2.39 290.8 124.4 0.5 2.05 7.49
Dulhera - 1 (Rewari ) 9.2 0.45 0.12 6.78 263.0 40.9 0.6 5.56 16.7
Dulhera –2 (Rewari ) 8.6 0.35 0.25 2.46 199.3 18.6 1.8 4.73 17.0
Kapriwas -
1(Rewari)8.2 0.30 0.16 2.50 96.3 31. 8 2.6 3.64 8.1
Kapriwas – 2 (Rewari)
8.5 0.32 0.09 1.25 256.3 22.7 3.6 3.77 7.8
Jadthal
(Rewari)8.7 0.34 0.21 1.22 36.3 111.43 1.19 0.70 0.7
Tigra –
1 (Mahendergargh)
8.3 0.23 0.21 1.73 50.5 121.49 1.7 2.65 1.8
Tigra –
2 (Mahendergargh)
8.3 0.32 0.22 2.49 51.4 87.76 2.0 2.54 1.6
Page

Final report: Enhancing farm profitability in north-western India and South Australia by improving grain quality of wheat
Climatic data
The data shown here support the understanding that in NW India yearly temperature is rising, with particular concerns about increased temperature in the February-March period Analysis of the long-term maximum temperature data from 2 representative sites in Haryana (Hisar) and the Punjab (Amritsar) show a clear break-point with an annual temperature rise of about 1.0°C for Hisar since 1989 and 0.7°C for Amritsar since 1992 (Figure 1). The mean annual maximum and minimum temperatures are 33.1/32.1°C and 19.6/18.0°C for Hisar (pre and post-breakpoint), and 30.8/30.1°C and 16.1/15.7°C for Amritsar (pre and post-breakpoint).
Figure 1
Maximum (Tmax) and minimum (Tmin) temperatures for Hisar and Amritsar with breakpoint (vertical line) and mean temperatures pre- and post- breakpoint.
Farmer field experiments
Time of sowing and variety data – grain yield and chapatti quality
The varieties DBW-17, PBW-343, PBW-502 had the highest (and comparable) yields with all rotations and seasons and there were no differences in yields with the rotations (Table 3). With these high yielding varieties there was little difference in yield outcome between the early and mid sowing times, with an equal distribution of highest yield outcomes for TOS1 and TOS2, or favouring TOS1 and TOS2 respectively. There was a significant interaction with sowing time and variety and this was due to the varieties C-306 and WH-283 performing differently to the other varieties. C-306 and WH-283 are varieties with excellent chapatti quality (Table 4) but are lower yielding by 15-26% than the more widely
Page
Final report: Enhancing farm profitability in north-western India and South Australia by improving grain quality of wheat
grown varieties such as PBW-343 and PBW-502. C-306 always performed best when sown early, and performed poorly with the late sowing. The performance of WH-283 was much better when grown in non-rice rotations in western Haryana. Although there was only minor evidence of lodging in these experiments, the greater height of C-306 makes it vulnerable to lodging and thereby can affect the productivity more than the relative differences reported here.
Table 3: Grain yield (t ha-1) with variety and time of sowing
Rotation Season TOS Variety
C-306DBW-17
PBW-343
PBW-502
PBW-550 RAJ-3765
WH-283
WH-1025
R-W 07-08 1 4.74a 5.32a 5.38a 5.24a 3.07c 2.41c
2 4.51a 5.53a 5.41a 5.49a 4.99a 3.92a
3 3.15b 3.57b 3.50b 3.43b 3.72b 3.1b
08-09 1 3.19b 5.25a 5.15a 5.12a 5.19a 3.83b 3.69b
2 3.45a 5.11a 4.87b 5.03a 5.26a 4.19a 4.00a
3 2.10c 3.56b 3.52c 3.31b 3.67b 3.86b 3.38c
C-W 07-08 1 4.26a 5.60a 5.63a 5.72a 4.60a 4.86a
2 3.89b 5.13b 5.09b 4.97b 4.55a 4.62a
3 3.36c 4.24c 4.31c 4.31c 4.07b 3.86b
08-09 1 4.25a 5.86a 5.86a 5.91a 5.34a 5.15a 4.88a 4.68a
2 3.82b 5.49a 5.49a 5.49a 5.12a 4.83a 4.94a 3.81b
3 3.03c 4.87b 4.97b 4.99b 4.43b 4.46ab 4.34b 2.95c
P-W 07-08 1 4.39a 4.85b 5.01b 5.13b 3.60c 4.44b
2 4.19b 5.85a 5.70a 5.96a 4.95a 5.02a
3 2.89c 4.77b 4.34c 4.72c 4.22b 3.41c
08-09 1 3.89a 5.08a 5.11a 5.02a 4.52a 4.45a 4.55a 3.90a
2 3.34b 4.67b 4.68b 4.64b 4.15b 4.06b 4.11b 3.44b
3 2.78c 3.86c 3.94c 3.93c 3.68c 3.58c 3.54c 2.82c
CB-W 07-08 1 4.21a 5.17b 5.28b 5.37b 3.98b 4.28a
2 4.04a 5.89a 5.74a 5.99a 4.68a 4.42a
3 3.08b 4.55c 4.33c 4.61c 4.16b 3.67b
08-09 1 4.14a 5.41a 5.45a 5.42a 4.87a 4.79a 4.94a 4.21a
2 3.67b 4.93b 4.92b 4.89b 4.48b 4.24b 4.48b 3.74b
3 2.98c 4.19c 4.18c 4.25c 3.93c 3.85c 3.81c 3.06cTOS values within a season followed with a different letter within columns differ
Page
Final report: Enhancing farm profitability in north-western India and South Australia by improving grain quality of wheat
The data show that, as yield and grain weight decreased with delayed sowing, the protein content increased. At all the sites very late sowing (December) always gave the highest protein. However there was no overall association between the chapatti score and grain protein, although within a variety, as protein increases (eg. with delay in sowing time), then there was an increase in chapatti score. C-306 and WH-283 had the highest chapatti score, the high yielding varieties PBW-343 and DBW-17 were of mid-score and PBW-550 and PBW-502 had the lowest chapatti score (Table 4). The high yielding varieties also had the highest protein levels and there were no obvious differences in wheat protein levels in the different crop rotations. For all the sites and the 2 seasons the first sowing time resulted in less chapatti score compared with the mid and late sowing time (Table 4).
Grain hardness is a key chapatti quality characteristic with a measure greater than 75 the desired outcome. The results show a strong association between variety and hardness with C-306, RAJ-3765, WH-283 always achieving a score >75, and, similarly to chapatti score, PBW-343 and DBW-17 were mid-score and PBW-550 and PBW-502 the lowest (Figure 2). With grain hardness there was a strong correlation (mean R2=0.35/0.42; 2008-09) with chapatti score (Figure 2). Given this close association, and similarly to chapatti score, hardness did not necessarily have the highest outcome with the late time of sowing (in contrast to protein). Hardness whilst a varietal trait is not as much affected by sowing time as is protein, and within a variety there was no clear associations (Figure 2). This result is important given that the second time of sowing usually did not result in much of a grain yield penalty. There were no differences in either year in the association with hardness and chapatti score among the 4 rotations (Figure 2).
Figure 2: Association between chapatti score and grain hardness shown for the 4 rotations (a) and wheat varieties (b) and 2 seasons.
Page

Final report: Enhancing farm profitability in north-western India and South Australia by improving grain quality of wheat
Table 4: Chapatti score with variety and sowing time
RotationSeasonTOSVariety
C-306DBW-17PBW-343PBW-502PBW-550RAJ-3765WH-283 WH-1025
R-W 07-08 1 8.1c 7.6c 7.4c 7.5b 7.5b 8.0b
2 8.2b 7.7b 7.5b 7.6a 7.7a 8.1a
3 8.3a 7.8a 7.6a 7.6a 7.7a 8.1a
08-09 1 8.0b 7.6c 7.7b 7.4c 7.3c 7.6c 8c 8.0c
2 8.2a 7.8b 7.7b 7.5b 7.4b 7.7b 8.1b 8.1b
3 8.2a 7.9a 7.8a 7.7a 7.5a 7.8a 8.2a 8.2a
C-W 07-08 1 8.0c 7.6c 7.4b 7.5c 7.5c 8.0b
2 8.1b 7.6b 7.5b 7. 6b 7.6b 8.0b
3 8.2a 7. 8a 7.5a 7.7a 7.7a 8.1a
08-09 1 8.0c 7.8a 7.7b 7.4b 7.3c 7.6c 7.9c 7.8c
2 8.1b 7.8a 7.8a 7.6a 7.5a 7.7b 8.2a 7.9b
3 8.4a 7.8a 7.8a 7.6a 7.4b 8.0a 8.1b 8.1a
P-W 07-08 1 8.0b 7.6c 7.4b 7.5b 7.5b 8.0b
2 8.2a 7.7b 7.5a 7.6a 7.5b 8.0b
3 8.2a 7. 8a 7.5a 7.5a 7.6a 8.2a
08-09 1 8.0c 7.8c 7.7c 7.3c 7.3c 7.6c 7.9c 7.8c
2 8.2b 7.8b 7.8b 7.6b 7.6a 7.7b 8.2b 7.9b
3 8.3a 7.8a 7.8a 7.6a 7.4b 8.0a 8.2a 8.0a
CB-W 07-08 1 8.1b 7.6b 7.4c 7.5c 7.5b 8.0b
2 8.0b 7.7a 7.6b 7. 6b 7. 6ab 8.0b
3 8.4a 7.7ab 7.7a 7.7a 7.6a 8.1a
08-09 1 7.9c 7. 7c 7.6c 7.3c 7.1b 7.5c 7.8c 7.7c
2 8.1b 7.9b 7.7b 7.5b 7.4a 7.6b 8.0a 7.8b
3 8.3a 7.7a 7.8a 7. 6a 7.4a 7. 8a 8.0a 7.9a
TOS values within a season followed with a different letter within columns differ
Nitrogen fertilizer input
With the rice-wheat system, there were no differences between the 3 different split timings of N application with grain yield (Table 5). However with the 3 other wheat systems (cotton, pearl millet, and cluster bean rotations) in each of the seasons the 3 way split of N-fertiliser application always gave the highest yield (Table 5) and this corresponded with more fertile tillers. This treatment had N-fertiliser applied at seeding, early tillering (22 DAS) and first node stage (65 DAS). When N application at 22 DAS was included in a 2-way split the yield outcomes were better than where 22 DAS was not included in the split. Grain yield increased in a step-wise manner as each additional irrigation was implemented with all rotations and seasons (Table 5). The maximum grain yields were
Page

Final report: Enhancing farm profitability in north-western India and South Australia by improving grain quality of wheat
with each rotation in the range 5.3-6.0 t ha-1; there were no interactions for grain yield, fertile heads and DM with N input timing and number of irrigations.
Where the GreenSeeker instrument was used in the rice-wheat rotation to determine the amount of N-fertiliser required (for the third N-fertiliser application at the early node growth stage), the plant growth and yield measures of fertile tillers, DM, grain yield and TGW did not differ compared with where the recommended rate of 150 kg N ha-1 was applied with the 3-way split treatment (Table 6). Further, when comparing the quality measures, grain hardness and chapatti score did not differ, but in 2007-08 there was more protein (P<0.05) where the GreenSeeker was used. With the treatment where there was higher input of N-fertiliser (200 kg ha-1) the number of fertile tillers was increased compared to the other two N treatments, but there was no difference in DM yield, grain yield or TGW. This higher N treatment did result in about 8-10% increase in grain protein (and consequent increase in N content), and a similar increase in grain hardness and chapatti score. Overall the GreenSeeker based N scheduling gave a saving of 21 to 25 kg N ha-1with similar grain yield, and this was reflected in a much higher apparent recovery (AR) of the N-fertiliser (70-75%) compared with 60% and 50% for the two fixed N treatments. The application of extra N-fertiliser with the 3 non rice-wheat rotations provided no additional grain yield (or DM) with an increase in the N-fertiliser beyond the 150 kg N ha-1 rate. Again protein and N-content increased incrementally, and the AR values were similar to those obtained with the rice-wheat rotation. Grain hardness and chapatti score trended higher with increases in N-fertiliser input but the increases were relatively small
With all 4 rotations the highest protein level was achieved (range 11.8-12.5%) with the 3-way split in N application, particularly with the wheat that had only 3 irrigations. Where N was applied as a split with the majority of N-fertiliser applied later in the growth of the crop (1/3 basal + 2/3 at 65 DAS) the lowest protein was achieved (2007-08), but where a 50:50 split (½ basal + ½ 22 DAS) was included (2008-09) with the non-rice rotations, this treatment, although providing the second best grain yield outcome, resulted in the lowest protein. In all situations the highest protein outcomes were achieved with the least irrigations, and protein was reduced incrementally as the numbers of irrigations were increased. There were no interactions obtained with protein and the irrigation and N-fertiliser timing treatments. Similarly to protein and grain yield, the apparent recovery (AR), which is expressed as the percentage of the N content of the grain to the N-fertiliser applied, was highest with the 3-way split (treatment N2), and also the 2-way split that did not include a basal application (treatment N3) (Table 6). With the irrigation treatments, in contrast to the protein results, the AR values mirrored the grain yield outcome having higher values as the number of irrigations was increased (Table 6), and again there were no interactions.
Overall the grain hardness measured was high with site means in the range 70-77 (2007-08) and 79-86 (2008-09). The timing of N-fertiliser input did sometimes result in differences in hardness achieved but, where significant, these differences were usually small. Whilst the 3-way split treatment always resulted in the highest hardness outcome, the pattern of differences between treatments differed from that obtained with the protein measure in that treatment N4 (½ basal + ½ 22 DAS) resulted in higher hardness compared with N1 (1/3 basal + 2/3 at 65 DAS). Similarly with protein, where increasing the numbers of irrigation gave less protein, increasing irrigations decreased the grain hardness outcomes. The results for chapatti score with the various N-fertiliser management timings had treatments N2 >N3 > N1 and N4 as the order of highest to
Page

Final report: Enhancing farm profitability in north-western India and South Australia by improving grain quality of wheat
lowest score, and, together with the trends of higher scores with fewer irrigations, these results mostly reflected the outcomes obtained with grain hardness.
Table 5: Grain yield (t ha-1) of wheat with irrigation scheduling and N fertiliser input
Rotation
Season I Nitrogena
Irrigation
Nitrogen
IxN
N1 N2 N3 N4 lsd (P<0.05)
R-W 07-08 I1 4.45d 4.64c 4.52d 0.10 ns ns
I2 4.79c 4.67c 4.78c
I3 5.03b 5.12b 5.02b
I4 5.26a 5.33a 5.27a
08-09 I1 3.98c 4.33c 4.26c 0.26 ns ns
I2 4.91b 4.92b 4.96b
I3 5.33a 5.16ab
5.19ab
I4 5.28a 5.35a 5.25a
C-W 07-08 I1 4.19d 4.48d 4.37d 0.11 0.1 ns
I2 4.63c 4.91c 4.79c
I3 5.01b 5.32b 5.21b
I4 5.39a 5.71a 5.49a
08-09 I1 4.47d 4.75d 4.58d 4.50d 0.13 0.13 ns
I2 4.86c 5.15c 5.06c 4.99c
I3 5.35b 5.69b 5.55b 5.45b
I4 5.62a 6.02a 5.87a 5.78a
P-W 07-08 I1 3.75d 4.12d 3.95d 0.16 0.14 ns
I2 3.97c 4.41c 4.24c
I3 4.48b 4.91b 4.87b
I4 4.92a 5.36a 5.08a
08-09 I1 3.24d 3.62d 3.46d 3.33d 0.15 0.15 ns
I2 3.91c 4.31c 4.14c 4.03c
I3 4.53b 4.91b 4.73b 4.64b
I4 4.90a 5.27a 5.09a 4.97a
CB-W 07-08 I1 3.97d 4.26d 4.14d 0.17 0.15 ns
I2 4.25c 4.61c 4.45c
I3 4.69b 4.98b 4.87b
I4 5.04a 5.37a 5.17a
08-09 I1 3.52d 3.85d 3.71d 3.63d 0.14 0.14 ns
I2 4.17c 4.49c 4.37c 4.27c
I3 4.70b 5.16b 4.98b 4.80b
Page

Final report: Enhancing farm profitability in north-western India and South Australia by improving grain quality of wheat
I4 5.03a 5.49a 5.30a 5.15a
Table 6: Apparent recovery of applied N fertilisera in wheat grain with irrigation scheduling
Rotation Apparent Recovery (%) Lsd (P<0.05)
I N1 N2 N3 N4 I N IxN
R-W (07-08) I155.6d 61.2c 59.1c
1.4 1.2
ns
I2 58.8c 60.3c 60.7c
I3 61.2b 64.6b 63.0b
I4 63.1a 66.3a 64.5a
R-W (08-09) I150.4c 58.0c 56.3b
3.3 2.9
ns
I2 61.6b 65.3b 65.0a
I3 65.8a 67.5ab 67.1a
I4 64.5a 69.0a 67.2a
C-W (07-08) I1 52.3d 58.4d 57.1d 1.6 1.4
ns
I2 57.1c 63.1c 61.8c
I3 61.1b 67.2b 66.0b
I4 65.3a 71.7a 68.9a
C-W (08-09) I154.5d 60.4c 57.4d
54.3d
1.5 1.5
ns
I2 58. 5c 65.3b 63.1c 59.7c
I364.1b 71. 4a 68.7b
64.7b
I466.7a 71.7a 72.2a
71.4a
P-W (07-08) I1 46.6c 52.2d 49.6b 3.4 2.9
ns
I2 48.7c 55.5c 52.6b
I3 54.5b 61.5b 60.1a
I4 59.3a 66.0a 62.3a
P-W (08-09) I139.1d 45.8c 43.d
39.8d
1.8 1.8
ns
I2 46.8c 54.0b 51.c 47.4c
Page

Final report: Enhancing farm profitability in north-western India and South Australia by improving grain quality of wheat
I353.8b 61.2a 58.2b
54.7b
I457.7a 62.3a 62.4a
60.6a
CB-W (07-08) I1 50.0c 55.8d 53.5c 3.4 3.0
ns
I2 52.9c 59.5c 56.2c
I3 58.0b 62.9b 60.8b
I4 61.6a 67.2a 64.6a
CB-W (08-09) I142.6d 48.7c 46.5d
43.4d
1.8 1.8
ns
I2 49.9c 56.2b 54.3c 50.2c
I355.8b 64.2a 61.2b
56.7b
I459.2a 64.8a 65.0a
62.8a
a Nitrogen management (N) – N1, 1/3 basal + 2/3 at 45/65 DAS; N2, 1/3 basal +1/3 at 22 DAS + 1/3 at 65/85 DAS; N3, No basal + ½ at 22 DAS + ½ at 45/65 DAS; N4, (½ basal + ½ at 22 DAS)
Micronutrient input and tillage-seeding method
Whilst the addition of individual micronutrients with the recommended NPK mostly did not produce more growth than where recommended NPK was added without micronutrients, there were responses to NPK plus the addition of all micronutrients in the 3 non-rice rotations (one season data). The individual nutrients that occasionally gave more growth were Zn and Cu. With the rice-wheat system in the 2007-08 season there was no difference in grain yield produced with the 2 sowing systems but in 2008-09 there was a small reduction in yield (P<0.05) where the wheat was sown by the ZT method. Zero tillage improved the yield consistently, but by a small amount (mean value 1.5%) at the 3 south-west rotation sites.
The protein levels were highest for all sites and seasons with the recommended NPK plus all micronutrients; overall the latter treatment had 8% more protein (Table 7). Sulphur added alone with the recommended NPK improved protein at all sites and in both seasons and in the 2 separate experiments (mean 3%). With grain hardness and with chapatti score the values were similarly increased where the recommended NPK plus all micronutrients fertilisation was used. ZT as the seeding method resulted in higher protein, higher grain hardness and consistently higher chapatti score. The benefits to these 3 quality measures from S input and ZT was additive in all cases.
There is some variation in the reports of the extent of S deficiency in Haryana with estimates from 40% to 8% of fields S deficient, but for the sites used in these experiments nearly all would be classified as having adequate or high S (Table 2). Sulphur use by farmers is more common in the districts where the rice-wheat rotation dominates. In our study there were no yield responses with S addition at any of the sites and in the 2 experiments. Nutrient treatments that included all or the individual micronutrients did not
Page
Final report: Enhancing farm profitability in north-western India and South Australia by improving grain quality of wheat
significantly increase grain yield at any of the locations or rotations when compared with the recommended NPK treatment. A recent survey has identified more than 50% of Haryana soils in the 11 Districts surveyed as deficient in Zn, though the extent of Zn deficiency is less evident in the rice-wheat districts (Singh 2008). This too was apparent with the 3 rice-wheat sites used in the experiments reported here, where high values for soil Zn were recorded. The use of Zn in the rice-wheat areas is common with farmers, especially for the rice phase of the rotation.
Adequate crop nutrition is very important for quality attributes and the recommended NPK treatment where all micronutrients were used always resulted in the best outcome. This treatment had higher protein than where S was added individually, although the grain protein where the S fertilizer alone was increased by an average across all sites of 6%. Importantly this substantial improvement in grain protein with S input also was associated with similar increases in grain hardness; high grain hardness is the most important grain quality attribute associated with chapatti quality.
CCSHAU Hisar Research Farm experiments
Wheat was grown in rotation with cotton, pearl millet and cluster bean in an experiment at the experimental farm of Haryana Agricultural University. The experiments are an evaluation of wheat varieties with time of sowing, conventional tillage and no-till, N fertiliser and irrigation treatments. The results obtained here were similar to those reported above. Here the varieties C-306 and WH-283, which have good chapatti characteristics (hardness and good grain size), were lower yielding (21 and 5% respectively) than varieties like PBW 343, PBW 502, DBW17 and PBW550. For the sowing times there was no yield difference between the early and mid-November sowings but December was always lower. Protein was higher with the later sowing and with cluster bean in the rotation. Highest yield and protein was achieved when N-fertiliser was applied in three equal splits. Wheat yield did not differ with sowing method but protein was improved with the wheat sown with no-till.
Market Assessment
Wheat is mainly purchased by the Food Corporation of India (FCI) on a Minimum Support Price (MSP) in Haryana and Punjab, and this purchase is on a weight basis with no quality attributes recognised. At times, a few private buyers such as Cargill, ITC, Adani, Delhi Flour Mills, AWB (now Wheat Australia) also purchase wheat as per the guidelines of the government.
As part of a broader farmer-industry survey a targeted survey was undertaken of wheat flour (attar) sales outlets in Karnal, a medium size regional centre. Karnal has 69,871 total units, 72,276 total houses, 5036 commercial units, 3086 residential cum commercial units, as per the data received from Chief Sanitary Inspector, Karnal (23 June, 2011) . Of the total residential cum commercial units, 200 are classified as ‘good stores’, 400 ‘normal’ and 2486 are ‘below normal’. The good stores generally cater to the needs of higher end consumers.
The flour brands mainly sold at these stores were commercially labelled as Ombhog, Ashirwad, Amritbhos, Rajdani, Divaga (Dawat), Pilsbari, Shona, Rambhog and Gautam. Ombhog is local flour that is sold without any nutritive value shown on the packing material. None of the brands include the wheat variety source on the label. Of these brands the majority of shopkeepers were only selling Ombhog and Ashirwad; Ombhog is cheap and most of the consumers preferred it compared to the ITC brand Ashirwad.
Page

Final report: Enhancing farm profitability in north-western India and South Australia by improving grain quality of wheat
However some people preferred to use Ashirwad because of its nutritive value. Mainly high income consumers purchased Ashirwad. Most of the consumers were not concerned about the nutritive value mentioned on the packing material. They were selling the local flour @ 16 Rs/kg and Ashirwad @ 22 /kg; for many consumers price was an issue and consequently they were not much worried about the quality. However some preferred to eat quality flour like Ashirwad and they willingly purchased it @ 22 Rs/kg. Some of the local small scale flour mills were milling wheat and selling loose flour @ Rs 14 per kg to nearby residents. On an average every shopkeeper sold 50-60 kg local flour daily and 20-30 kg of the branded flour like Ashirwad.
The household survey data showed that the average age of the consumers was 44.3 years with the average family size of 4.5. The average requirement was for flour per family was 268 kg per year. The range of requirement varied from 60 to 800 kg per year depending upon the family size. The majority of the consumers (84%) independently purchased wheat and got that processed after cleaning as per their monthly requirement. There were only 16% of respondents who purchased wheat flour from the market shop. Generally those who had large family size preferred to purchase wheat and arrange their own milling than purchasing branded flour. There were only 16% of consumers who purchased their flour directly from the market shop as well as from the local grain miller in loose packs.
As far as source of wheat grain was concerned, 58% purchased it from the grain market/ friends, 8% had it from their own farm and the rest purchased from the farmers. This would indicate that many of the consumers have direct linkage with the farmers. Therefore, the farmers can take advantage of such linkage by producing quality wheat and supplying that to their existing consumers. Regarding brand loyalty, local flour was preferred by majority of the consumers and Ashirwad and other brands by some. While few preferred wheat flour of desi wheat such as C-306 which they directly purchased from the farmers. Some of the consumers purchased MP wheat from the market, which is imported by the grain traders from Madhya Pradesh (MP) a state known for its chapatti quality.
All the survey respondents consumed wheat in chapatti form and a few also indicated some preference to consume wheat in the form of Dalia (indigenous preparation), Halwa (sweet dish), Pasta, Sewiyan (indigenous product like noodles but smaller in size, about one inch length) and noodles. The younger generation prefer some of these alternative wheat products as compared to the older generation who find chapatti more satisfying. Overall the study indicated that there is more scope for wheat based products in India and this will increase with the increasing purchasing capacity of the consumers. Certainly quality wheat will find a place in consumer preference in a large segment in the urban areas.
To provide a ‘snapshot’ evaluation of chapatti quality an assessment was made for wheat flour originating from 5 different varieties as well as from blends of these different varieties. This exercise was undertaken to attain a viewpoint of a consumer familiar with making chapattis on quality but separate from the laboratory based measurement of quality. A training programme was organized for the 28 women participants who had been independently sourced. Prior to this assessment many of the participants had no concept of the idea of quality and were unaware that wheat flour could differ depending on variety. The respondents varied in their response on colour, flavour, taste, chapatti puffiness, water needed for dough making, stickiness, colour of fresh dough and after 12 hours ,
Page

Final report: Enhancing farm profitability in north-western India and South Australia by improving grain quality of wheat
chapatti breaking after four hours. Though C-306 was a clear favourite of all, they could not easily differentiate the other varieties for their chapatti quality. Chapatti making is recognised as an art, and as such the results varied as every person possesses different level of skills. Most of the respondents reported light brown of chapatti made from DBW-17, DBW-550, HD-2851 and WH-283. Only C-306 had cream colour. Althoughll these respondents when making chapatti, were not clear in their evaluation about chapatti colour as well as other parameters too. When the chapatti was fresh, it was difficult for them to identify which one was the best. From the data given in Table 7-8 characteristics such as less stickiness when mixing, and physical characteristics post-baking are just as important as taste when quality is assessed. A full review of chapatti quality has been given in a publication arising from this project (Coventry et al. 2011).
Table 7: Household chapatti evaluation – source pure wheat varieties Attribute Pure varieties (Figure in parenthesis for attributes indicate percentage)
DBW 17(21)
PBW 550(21)
HD 2851(21)
C 306(28)
WH 283(21)
Colour
Cream 21 (100) 9 (42.9) 9 (42.9) 28(100) 7 (33.3)
Light brown 12 (57.1) 12 (57.1) 14 (66.7)
Dark brown
Flavour
Very good 9 (42.9) 5 (23.8) 8(30.1) 13 (46.4) 8 (30.9)
Good 12(57.1) 16(76.2) 13 (51.9) 15(53.6) 13(61.9)
Poor
Taste
Very good 8 (30.09) 5 (23.80) 6 (28.57) 14 (50.0) 5 (23.80)
Good 11(52.38) 16 (76-19) 15(71-42) 14 (50.0) 11 (52.38)
Poor 2(9.52) 5(23.80)
Chapatti puffiness (cm)
6 -35 -7
2&7 2-2&7 3-2&8 2&6
Chapatti breaking after 4 hours
Needs more force
13 (61.9) 15 (71.4) 4 (14.3) 8 (30.1)
Need less force 8 (30.1) 6 (28.6) 24 (85.7) 13 (61.9)
Water needed for dough making (ml)
73&78 75&80 75&85 75&83 73&75
Stickiness during dough making
High
Medium 12 (57.1) 13(61.9) 12 (57.1) 11 (39.3) 11 (52.4)
Less 9 (42.9) 8 (30.1) 9 (42.9) 17(60.7) 10 (47.6)
Dough colour
Cream 17 (81.0) 11 (52.4) 12 (57.1) 27 (96.4) 12 (57.1)
Page

Final report: Enhancing farm profitability in north-western India and South Australia by improving grain quality of wheat
Light gray 4 (19.0) 10 (47.6) 9 (42.9) 1 (3.6) 9 (42.9)
Dark gray
Dough colour after 12 hours
Cream 2 (9.5) 7 (25.0) 11 (52.4)
Light gray 14 (66.7) 13 (61.9) 13 (61.9) 21 (75.0) 10 (47.6)
Dark gray 7 (33.3) 8 (30.1) 6 (28.6)
Table 8: Household chapatti evaluation – source blended wheat varieties Attribute Blended varieties (Figure in parenthesis for attributes indicate percentage)
C306+ DBW 17
WH 283+DBW 17
HD 2851 + DBW 17
C 306 + PBW 550
WG 283 + PBW 550
HD 2851 + PBW 550
C306 +HD 2851
WH 283 + HD 2851
Colour
Cream 10(100) 2 (20) 6 (60) 5 (50) 4 (40) 4 (40) 10(100) 3 (30)
Light brown 8 (80) 4 (40) 4 (40) 6 (60) 6 (60) 7 (70)
Dark brown 1 (10)
Flavour
Very good 1 (10) 1 (10) 2 (20) 3 (30) 4 (40) 4 (40) 2 (20)
Good 7 (70) 8 (80) 7 (70) 7 (70) 7 (70) 6 (60) 6 (60) 8 (80)
Poor 2 (20) 1 (10) 3 (30) 1 (10)
Taste
Very good 1 (10) 1 (10) 3 (30) 3 (30) 2 (20) 3 (30) 6 (60) 3 (30)
Good 8 (80) 9 (90) 4 (40) 7 (70) 8 (80) 6 (60) 4 (40) 7 (70)
Poor 1 (10) 3 (30) 1 (10)
Chapatti puffiness (cm)
3&7 3&6 3&6 3&8 2&8 2-2&8 3-2&8 3&7
Chapatti breaking after 4 hours
Needs more force 5 (50) 6 (60) 4 (40) 5 (50) 6 (60) 5 (50) 4 (40) 3 (30)
Need less force 5 (50) 4 (40) 6 (60) 5 (50) 4 (40) 5 (50) 6 (60) 7 (70)
Water needed for dough making (ml)
77&78 80&85 76&80 74&78 75&80 78&82 76&83 75&81
Stickiness during dough making
High 3 (30) 1 (10) 1 (10) 1 (10)
Medium 2 (20) 7 (70) 7 (70) 6 (60) 9 (90) 9 (90) 4 (40) 6 (60)
Less 8 (80) 3 (30) 4 (40) 6 (60) 3(30)
Dough colour
Cream 9 (90) 2 (20) 9 (90) 7 (70) 3 (30) 5 (50) 10(100) 5 (50)
Page

Final report: Enhancing farm profitability in north-western India and South Australia by improving grain quality of wheat
Light gray 1 (10) 8 (80) 1 (10) 3 (30) 7 (70) 5 (50) 5 (50)
Dark gray
Cream 3 (30) 2 (20) 5 (50) 3 (30) 8 (80) 1 (10)
Light gray 7 (70) 7 (70) 6 (60) 5 (50) 7 (70) 8 (80) 2 (20) 9 (90)
Dark gray 3 (30) 2 (20) 2 (20)
Extension activities
A feature of the farmer extension undertaken is that it has regularly been undertaken at the research and demonstration sites, and has progressively communicated the up-to-date outcomes from the project as well as the purpose of the project. Notwithstanding the repeat locations of these field days the local extension staff regularly inform us that the field days are constantly reaching out to new farmer audiences each time. The field days have also been very important for engaging Haryana Department of Agriculture personnel HAU KVK staff and Haryali Kisan Bazaar staff in the project. Table 9 shows the locations, timings and numbers of participants (farmers, extension personnel, researchers) attending these field days. In total 44 field days/ visits were conducted since 2008. The programs were attended by 4175 farmers. In the two exposure visits, 46 farmers and state officers visited Bakers’ Circle, Kashipur during 2008 and 2010 to interact with their staff and establish linkages with them. Seven training programmes were organized in which 178 persons were trained. Six TV talk were delivered by Dr Randhir Singh and two TV talks were arranged for Sahab Singh, a progressive farmer.
Table 9: Log of project field days
Site Year
(2008-09)
Number Site Year
(2010-11)
Number
Pehowa, Kurukshetra 21.2.2008 30 Ramba, Karnal 13.3.2009 150
Ramba, Karnal 22.2.2008 300 Kalri, Karnal 10.2.2010 50
Kalri, Karnal 22.2.2008 100 Darar , Karnal 11.2.2010 50
Begu Shahpur, Sirsa 24.2.2008 50 Ramba, Karnal 11.2.2010 100
Panjuwana, Sirsa 24.2.2008 20 Ramba, Karnal 15.2.2010 150
Bhangu, Sirsa 24.2.2008 20 Chhapar, Karnal 3.3.2010 100
Tigra, M.Garh 25.2.2008 300 Sadhura, Karnal 3.3.2010 50
Dulhera, Rewari 26.2.2008 10 Thana, Kaithal 5.3.2010 100
Gudiyani, Rewari 26.2.2008 150 Ramba, Karnal 10.3.2010 20
Kapriwas, Rewari 26.2.2008 25 Ramba, Karnal 24.3.2010 20
Ramba, Karnal 24.12.2008 10 Bhangu, Sirsa 11.12.2010 150
Ramba, Karnal 8.2.2009 40 Begu Shahpur , Sirsa 11.12.2010 50
Page

Final report: Enhancing farm profitability in north-western India and South Australia by improving grain quality of wheat
Kapriwas, Rewari 8.2.2009 150 Tigra, Mahendargarh 10.3.2011 200
Jadthal, Rewari 8.2.2009 50 Darar, Karnal 19.3.2011 45
Tigra, Mahendargarh 9.2.2009 350 Ramba, Karnal 19.3.2011 130
Gudiani, Rewari 9.2.2009 100 Kalri, Karnal 21.3.2011 45
Ramba, Karnal 10.2.2009 150 Begu Shahpur , Sirsa 16.3.2011 100
Santri, Karnal 10.2.2009 100 CCSHAU, Bawal 25.7.2011 50
Keorak, Kaithal 11.2.2009 50 Tigra, Mahendargarh 26.7.2011 150
Balana, Ambala 11.2.2009 100
Begu Shahpur Sirsa 11.2.2009 50
Bhangu, Sirsa 11.2.2009 100 Total 44
Teek, Kaithal 12.2.2009 50
Ramba 12.2.2009 10
Kalri, Karnal 12.2.2009 100
Darar, Karnal 12.2.2009 100
Page
Final report: Enhancing farm profitability in north-western India and South Australia by improving grain quality of wheat
Table 10: Training Programmes Organized
Exposure of Farmers to Bakers’ Circle
A total of 35 participants including farmers associated with the project, State Department of Agriculture officials and Hariyali Kisan Bazaar officials were taken to Bakers’ Circle Group, Kashipur, 20-21 April, 2008.They were provided with first hand information about the wheat products made and the process involved in manufacturing and marketing of products. Dr Jay Cummins also accompanied the group. A second visit to Bakers’ Circle Kashipur from 22-23 March, 2010 involved 11 farmers from Haryana. Michael Wurst from Rural Solutions Australia also attended the programme. Mr Dev Lall, owner of the Bakers’ Circle interacted with the farmers. Mr Naveen Sanders, CEO also addressed the farmers and officials.
Page
Title Duration Site Participants
Wheat based Product Making
14-15.10. 2008 DWR, Karnal 43 women from rural areas
Monitoring of Wheat Crop
10.12.2008 DWR, Karnal 15 ADOs from State Department of Agriculture, Haryana
Monitoring of Wheat Crop
2.1.2008 Keorak, Kaithal 25 Farmers and extension officers
Monitoring of Wheat Crop
21.2.2008 Madanpura, Kurukshetra
20 Farmers and extension officers
Monitoring of Wheat Crop
21.2.2008 Sullar, Ambala 30 Farmers and extension officers
Monitoring of Wheat Crop
5.2.2010 Ladwa 110 farmers and state officers
Entrepreneurship development among women and chapatti quality evaluation
29.9.2010 Karnal 35 women from villages Kohand, Dhakwala, sector 9, DWR & and NDRI

Final report: Enhancing farm profitability in north-western India and South Australia by improving grain quality of wheat
8 Impacts
8.1 Scientific impacts – now and in 5 yearsThe outcomes from the experiments undertaken as part of this project are having immediate impact in that they are guiding farm practice change. The specific areas being changed are nitrogen fertiliser practice, tillage system choice (particularly in the non-rice regions) and, as quality markets develop, variety choice. Another science outcome from this work is the highlighting of the very low status of P availability with the intensive rotations used. The identification of a clear correlation between grain hardness and chapatti quality should allow plant breeders to be more proactive in using chapatti quality as a key rapid parameter in wheat breeding programs.
The findings of this project are reaching a wide international audience with 5 refereed publications published and a further 2 publications currently being drafted.
8.2 Capacity impacts – now and in 5 yearsThe project has helped in strengthening the existing collaboration between the Australian and Indian scientists. The agribusiness experts, state agriculture officials and farmers were trained in Australia on various aspects of quality wheat and direct marketing aspects. The participatory approach has helped in quick learning and dissemination of experimentation results with the help of State Government and agri-business agronomists.
The capacity of the research/extension scientists in Haryana has been improved with their participation in field days and local training activities. The involvement from HAU Home Science staff in some of the later field days is a positive step forward in embracing the project findings beyond the science and farmer interface.
Amrit Bir Singh Riar was selected for a John Allright Fellowship and currently undertaking his PhD study at The Adelaide University. The broad based involvement of the research associates employed by the project (RK Jat, Jitender, Ajay Kumar, Amrit Bir Singh Riar) provided for them good interaction with scientists, project staff
Farmers, scientists and agribusiness experts got an opportunity to visit Bakers’ Circle which supplies frozen dough to Subway in India. These visits helped in strengthening awareness and relationships amongst farmers and industry.
The project will help in enhancing income of farmers through direct marketing approach in future as they are expected to get better price for their quality wheat as local based marketing systems develop, as compared against the existing Minimum Support Price.
8.2 Community impacts – now and in 5 years
8.2.1 Economic impactsThe economic impact for farmers should be substantial. Best practice identified within this project involves savings associated with less tillage and less N use as well as potential yield gains. Further the opportunity exists for premium prices for grain sold as high chapatti quality wheat. These profit gains however will be offset by less yield obtained by using the recognised high chapatti quality wheat varieties. To quantify this balance a series of spreadsheet partial budgets are being developed based on the data obtained from the 2009-10 and 2010-11 farm based (>20) wheat sites, and current input and grain prices. This study compares 1) existing practice with best practice; compares 1) with reduced nitrogen etc; compares 2) with alternative varieties (reduced yield but higher
Page

Final report: Enhancing farm profitability in north-western India and South Australia by improving grain quality of wheat
price); and will create yield price tables and breakeven points – price at a given yield or yield at a given price.
8.2.2 Social impactsA few villages are already actively undertaking locally based marketing of chapatti quality wheat. Project scientists are in close contact with farmers in village Amoli (Rewari) from the last two years to study the market linkages for quality wheat near Delhi. Around 40% of the area under wheat in Amoli and other nearby villages such as Dharoli, Jatwara, Bhurawas, Amadal, Bithala are being sown with chapatti quality wheat, mainly C-306. WH-283 and C-306 are frequently being grown by many farmers covering an area of about 10% in Rewari and Mahendergarh districts, where the project can help the stakeholders to further improve grain quality and establish strong market linkages. In the rice-wheat system, the farmers were mainly concerned about high wheat yield but due to the efforts made by the project team, farmers in village Kalri and nearby villages of the Indri block have adopted wheat varieties C-306, WH-283 and also the higher yielding HD 2851, all known for their chapatti quality. HD 1025 a recently released variety has also been requested for use by the farmers. A group approach was used to assess the preference of farmers towards growing quality wheat in villages Kalri, Ramba, Darar, Indri and Santri. A few farmers (2%) were not keen to grow quality wheat as they feared that they may not get market recognition for the quality produce. They also mentioned that every farmer cannot be a salesman. Though the project team motivated them to form a broadly based cooperative, a small group of farmers came forward to look after marketing of the produce. Although the consumer market for chapatti quality wheat is evolving in India and some consumers are ready to pay even a 250% premium, there still is much to be done in developing this market. Whilst the project through a pilot study has created awareness amongst women through a training program about wheat quality and different types of wheat available in the market, more is required targeting women and specifically targeting Home Science training.
8.2.3 Environmental impactsThe results given here show that opportunities exist for managing fertiliser inputs more effectively with the rice-wheat and non-rice wheat crop rotations in Haryana. The use of the GreenSeeker instrument to give an indication of crop demand for N gave N-input savings of 21 to 25 kg N/ha with similar grain yield, protein and grain hardness to that provided by using the recommended 150 kg N/ha. This shows that, at least with the rice-wheat system, farmers are likely to be over-fertilising their crop and a more appropriate recommendation would be for application of a total of 130 kg N/ha. Where the GreenSeeker was used the apparent recovery (AR) was 70-75% compared with 60% with the wheat receiving the recommended 150 kg N/ha, and 50% where N was applied in luxury amounts. The fertilizer use efficiency of applied N is still very low in India (40-50%), and one of the main reasons for this has been suggested to be the lack of perfection in time of application of N fertilisers. Broadcast application and flood irrigation as practiced in India can lead to high N losses through various pathways such as denitrification and leaching loss, and certainly the data given here show the potential for improving N use efficiency by increasing uptake at critical growth stages. These apparent recovery data show practices used for N application and timings and extent of irrigations, whilst targeting high nitrogen use efficiency is not only economically prudent, it is also environmentally
Page

Final report: Enhancing farm profitability in north-western India and South Australia by improving grain quality of wheat
wise as at some Haryana locations the groundwater below irrigated soils is showing increased nitrate-N concentrations due to nitrate leaching.
8.3 Communication and dissemination activities
A project management committee (involving farmer representatives and scientists representing agronomy, soil science, quality, extension) was formed to ensure that a practical ‘hands-on’ approach and communicate and demonstrate the results. Demonstrations were conducted across Haryana covering all the major wheat based cropping systems in collaboration with Hariyali Kisan Bazaar and State Department of Agriculture in villages Ramba, Kalri, Darar, Keorak, Sullar, Sadhura, Chhapar, Thana village, Madanpura, Kapriwas, Gudiyani, Jarthal, Tigra, Berwal, Jhabuwa, Jholri, Bucholi, Berli, Fatehpuri, Sahapur Begu and Bhangu.
Feedback was received from the farmers about other farmers being motivated to grow quality wheat. Agribusiness experts from Hariyali Kisan Bazar were also involved for speedy transfer of technology and adoption using participatory approach. Farmers’ days, exposure visits, training programmes, press release and TV talks were organized to ensure that results are clearly communicated with active feedback and input from the farming communities across Haryana. Opportunities through exhibitions were availed to communicate to farmers about growing quality wheat.
Wheat crop monitoring tools and resources were also used to assist the farmers in evaluating and identifying the benefits associated with alternate management practices developed across the different wheat production systems of Haryana.
‘Train the trainer’ workshops, targeting Haryana State Extension Officers, and HKB Agronomists assisted in enhancing the skills, knowledge and capabilities of participants; in relation to wheat quality management, crop monitoring systems, marketing and market chain development. Training course notes and resources were produced; ensuring that extension officers and agronomists have ready access to research and technical information.
During the survey, the mobile numbers of the farmers across Haryana were also recorded and a data bank has been created to disseminate the research findings through mobile phones as well as published literature. Before initiation and during the crop season, the farmers were provided information about growing quality wheat and marketing opportunities in nearby locations to the field sites.
Page

Final report: Enhancing farm profitability in north-western India and South Australia by improving grain quality of wheat
9 Conclusions and recommendations
9.1 ConclusionsChapatti quality of wheat for the consumer in India is very important, yet farmers do not attach much importance to quality as nearly all wheat is sold with no segregation. Good chapatti quality is assessed by chapatti score, and high grain hardness is shown to be the main wheat quality measure that is closely correlated with high chapatti score. The practice of sowing early, although resulting in lower protein than with later sown wheat, maintains high grain hardness, and this particularly with the recognised high chapatti quality wheats C-306 and WH-283. High grain hardness could also be achieved with the high yielding varieties PBW-343 and PBW-502, showing that farmers can adopt a practice including variety choice and timely sowing to obtain acceptable chapatti quality without losing grain yield benefits. With opportunities for wheat segregation and marketing of wheat based on quality characteristics now becoming more available, the timely sowing of wheat along with appropriate variety selection is recommended to achieve accepted chapatti quality. With our observations of variable and possibly warming Indian environment, farmers also have to manage wheat crops that may be experiencing more exposure to heat stress at anthesis and grain filling. The adoption of early sowing with high yielding varieties that are suited to a spread in sowing time (like PBW-343 and PBW-502) allows longer maturation time and earlier anthesis, thus reducing high temperature exposure. From the results shown here it is evident that farmers can manage with variety choice and timely sowing to obtain high yields as well as chapatti quality benefits.
For irrigated wheat grown in Haryana the use of a 3-way split of N fertiliser applied at seeding, early tillering and first node stage provides the highest grain yields, protein, grain hardness and chapatti quality. Currently the recommendation for farmers is to apply N fertiliser at 150 kg N ha-1, and this involves a 2-split schedule (1/3 basal and 2/3 at the first irrigation). The high recovery figures obtained for N in grain show there are opportunities for improving nitrogen use efficiency and (by association) profitability. The use of the GreenSeeker instrument resulted in N fertiliser savings of 21 to 25 kg N ha-1 with similar grain yield, protein and grain hardness to that provided by using the recommended 150 kg N ha-1. Further, where the GreenSeeker was used, the apparent recovery was 70-75% compared with the 60% recovery with the recommended rate. This shows that farmers are likely to be over-fertilising their crop and a more appropriate N fertiliser recommendation both for yield and chapatti quality would be for application of a total of 130 kg N ha-1, with an equal application of 50 kg N ha-1 at seeding and early tillering and a lesser rate at first node stage. In the intensive crop production systems practiced in Haryana particular care must be taken to ensure that the availability of each nutrient is not limiting grain yield. Given the high wheat yields obtained at the sites which were located at widely dispersed location in Haryana, it can be concluded the nutrient management is mostly good with respect to grain yield. Whilst there is no evidence of S or micronutrients limiting grain yield, a cautionary note must be given about the possibility that P availability may be limiting yield. Given that yield responses were obtained in the rice-wheat regions where farmyard manure was applied in addition to the recommended rates for N, P and K, the possibility exists that the recommended rate of 26 kg P ha-1 for the rice-wheat rotation is too low. Where S and micronutrients were used there were in all crop rotations improvements in the important chapatti quality measures.
The best grain yields obtained in these experiments were 5.5-6.0 t ha-1 and these yields are consistent with a decade-long ‘attainable yield’ identified for wheat in rice-wheat rotations for Haryana. The results in this experiment have highlighted opportunities for farmers to increase yield to what is identified as the current attainable yield for wheat, but also to improve their N fertiliser use efficiency. If farmers can achieve market recognition
Page

Final report: Enhancing farm profitability in north-western India and South Australia by improving grain quality of wheat
for chapatti quality, and with the use of appropriate varieties, then farmers can assume that the best practice outlined here for optimising grain yield with integrated nutrient and soil management will be the same practice that optimises chapatti quality.
Grain yields with zero till were similar or slightly better at all sites where zero till sowing was the method used for crop establishment. The grain from the zero till also had higher protein, grain hardness and chapatti score from all 4 of the rotations. The data given here show that with zero tillage and an integrated practice of nutrient management farmers in Haryana can maintain grain yields of wheat whilst improving quality outcomes.
In the market place our surveys have revealed that often more than 40% of the wheat sold is sold directly and locally to consumers as unbranded wheat. The project has explored in preliminary ways getting farmers to form local village cooperatives to market branded wheat where high quality wheats have been grown. It is clear that the initial stages of the development of a quality-based market will have to follow this farmer directed ‘bottom-up’ approach. The market will have to be self-regulated with local cooperative providing the compliance and quality assurance requirements. It is recognised that villages initially will need assistance with generating the particular needs of a cooperative including development of a marketing business plan.
9.2 RecommendationsGiven the comprehensive nature and conclusive outcomes of the experimentation undertaken here relating to wheat yield and chapatti quality for Haryana, further experimentation in this area is not required.
Extension activities extending outcomes of the findings of this study, particularly relating to marketing need to be on-going and should reinforce the understanding that the locally branded market for chapatti wheat represents a huge opportunity for Indian farmers to increase on-farm profitability.
Establishment of village-based farmer cooperatives would seem the best opportunity for farmers to progress opportunities for locally-based marketing. It is clear farmers would need assistance initially with cooperative formation and particularly developing a business plan suitable for small locally based businesses. For this purpose there is a need for the production of marketing guide pamphlets and appropriate tools, and activities to highlight the development of a ‘bottom up’ approach to marketing. A small number of cooperatives should be developed and supported initially focussing on the villages where this project has concentrated its activities.
Similarly there is recognised an opportunity to support a parallel education campaign by the involvement of teachers in the Home Science departments at KVK outlets in Bawal, Sirsa and Mahendragagh, and NGOs in the Karnal area. The extension and use of the home-based chapatti quality protocol in concert with a market development plan would ensure that consumer awareness and demand is concurrently developed.
Page

Final report: Enhancing farm profitability in north-western India and South Australia by improving grain quality of wheat
10References
10.1References cited in reportAlam, M. M., Ladha, J.K., Foyjunnessa , Rahman, Z., Khan, S. R, Harun-ur-Rashid, Khan, A.H., Buresh, R.J., 2006. Nutrient management for increased productivity of rice–wheat cropping system in Bangladesh. Field Crops Res. 96, 374–386.
Anonymous, 2009. Agricultural Statistics at a Glance (2009). DAC, Ministry of Agriculture, Government of India.
Mishra, B., Jag Shoran, Chatrath, R., Chatrath, A.K., Sharma, R.K. Gupta, R.K., Randhir Singh, Rane, J., Anuj Kumar, 2005. Cost effective and sustainable wheat production technologies. Directorate of Wheat Research, Karnal-132001, Technical Bulletin, No.8, 36.
Quinquennial Report, 2005-06. All India Coordinated Research Project on Micro and Secondary Nutrients and Pollutant Elements in Soils and Plants. Department of Soil Sciences, CCS Haryana Agricultural University, Hisar.
Singh, M.V., 2008. Micronutrient fertility mapping for Indian Soil, Technical
Bulletin. AICRP Micronutrients, IISS, Bhopal. Vol. 7, 1-60.
Singh, S., Malik, R.K., Dhankar J.S., Yadav, A., Garg Rajbir, Kamboj, B.R., Sheoran P., Lathwal O.P., 2010. Nutrient use pattern in the irrigated rice-wheat cropping system in the Indo-Gangetic plains of Haryana, India. Exp. Agr. 46, 191–209.
10.2List of publications produced by projectAshok Kumar, David Coventry, R.S. Poswal and Shashi Madan (2010). Improving grain yield and quality of wheat grown in Haryana (NW India). Proceedings of the Australian Society of Agronomy, Christchurch, New Zealand.
D.R. Coventry, A. Yadav, R.S. Poswal, R.K. Sharma, R.K. Gupta, R.S. Chhoka, S.C. Gill,V. Kumar, A. Kumar, A. Mehta, S.G.L. Kleemann, J.A. Cummins (2011). Irrigation and nitrogen scheduling as a requirement for optimising wheat yield and quality in Haryana, India. Field Crops Research 123, 80–88.
D.R. Coventry, R.K. Gupta, A. Yadav, R.S. Poswal, R.S. Chhokar, R.K. Sharma, V.K. Yadav, S.C. Gill, A. Kumar, A. Mehta, S.G.L. Kleemann, A. Bonamano, J.A. Cummins (2011). Wheat quality and productivity as affected by varieties and sowing time inHaryana, India. Field Crops Research 123, 214–225.
D.R. Coventry, R.S. Poswal, A. Yadav, R.K. Gupta, S.C. Gill, R.S. Chhokar, V. Kumar, R.K. Sharma, A. Kumar, A. Mehta, S.G.L. Kleemann, J.A. Cummins (2011). Effect of tillage and nutrient management on wheat productivity and quality in Haryana, India. Field Crops Research, 123, 234–240.
Randhir Singh, David Coventry, RK Sharma, RK Gupta, RS Chhokar, Subhash Chander Gill, Anuj Kumar, Ashok Kumar Yadav, Amrit Bir Singh Riar, Ramesh Chand and Jay
Page

Final report: Enhancing farm profitability in north-western India and South Australia by improving grain quality of wheat
Cummins .2011. Effect of Tillage and Nutrient Management on Wheat Yield and Quality in Rice-Wheat Rotation. In WHEAT: Productivity Enhancement under Changing Climate (Eds S.S. Singh, Hanchinal, G. Singh, B.S. Tyagi, M.S. Saharan, Indu Sharma ), pp 211-217. Published by Narosa Publishing House, New Delhi.
Page

Final report: Enhancing farm profitability in north-western India and South Australia by improving grain quality of wheat
11Appendixes
11.1Appendix 1: Sample news clippings:
Page

Final report: Enhancing farm profitability in north-western India and South Australia by improving grain quality of wheat
Page

Final report: Enhancing farm profitability in north-western India and South Australia by improving grain quality of wheat
Page

Final report: Enhancing farm profitability in north-western India and South Australia by improving grain quality of wheat
Page

Final report: Enhancing farm profitability in north-western India and South Australia by improving grain quality of wheat
Page

Final report: Enhancing farm profitability in north-western India and South Australia by improving grain quality of wheat
Page
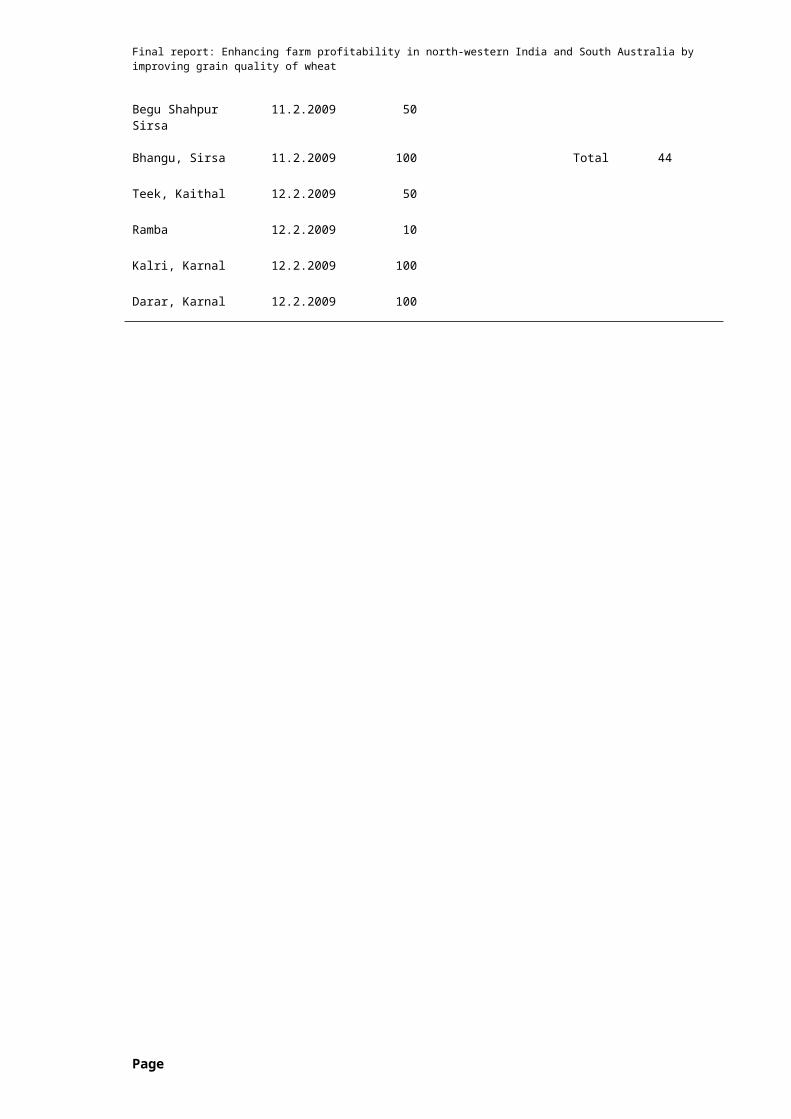
Final report: Enhancing farm profitability in north-western India and South Australia by improving grain quality of wheat
Page