Embed Size (px)
Citation preview

HAL Id: hal-00569843https://hal.archives-ouvertes.fr/hal-00569843
Submitted on 25 Feb 2011
HAL is a multi-disciplinary open accessarchive for the deposit and dissemination of sci-entific research documents, whether they are pub-lished or not. The documents may come fromteaching and research institutions in France orabroad, or from public or private research centers.
L’archive ouverte pluridisciplinaire HAL, estdestinée au dépôt et à la diffusion de documentsscientifiques de niveau recherche, publiés ou non,émanant des établissements d’enseignement et derecherche français ou étrangers, des laboratoirespublics ou privés.
X-ray laser spectroscopy of highly charged ions atFLASH
S W Epp, J R Crespo López-Urrutia, M C Simon, T Baumann, G Brenner, RGinzel, N Guerassimova, V Mäckel, P H Mokler, B L Schmitt, et al.
To cite this version:S W Epp, J R Crespo López-Urrutia, M C Simon, T Baumann, G Brenner, et al.. X-ray laserspectroscopy of highly charged ions at FLASH. Journal of Physics B: Atomic, Molecular and OpticalPhysics, IOP Publishing, 2010, 43 (19), pp.194008. �10.1088/0953-4075/43/19/194008�. �hal-00569843�

X-ray laser spectroscopy of highly charged ions at FLASH
S W Epp1,2, J R Crespo López-Urrutia2, M C Simon2, T Baumann2, G Brenner3, R Ginzel2, N Guerassimova3, V Mäckel2, P H Mokler2, B L Schmitt2, H Tawara2, and J Ullrich 2 1Max Planck Advanced Study Group at CFEL, D-22761 Hamburg, Germany 2Max-Planck-Institut für Kernphysik, D-69117 Heidelberg, Germany 3HASYLAB, Deutsches Elektronen-Synchrotron DESY, D-22603 Hamburg, Germany
Email: [email protected]
Abstract. Laser spectroscopy, widely applied in physics and chemistry, is extended into the soft x-ray region for the first time. Resonant fluorescence excitation of highly charged ions (HCI) by soft x-ray free-electron lasers shows here the potential for unprecedented precision on photonic transitions hitherto out of reach. The novel experiments combine an electron beam ion trap (EBIT) with the Free-electron LASer at Hamburg (FLASH) to measure resonant fluorescence by trapped HCI as a function of the wavelength. The present experiments reach already the performance of conventional soft and hard X-ray spectroscopy. We present the results obtained for three fundamental and theoretically challenging transitions in Li-like ions, namely 1s22s 2S1/2–1s22p 2P1/2 in Fe23+ at 48.6 eV, in Cu27+ at 55.2 eV, and 1s22s 2S1/2–1s22p 2P3/2 in Fe23+ at 65.3 eV. The latter demonstrates laser spectroscopy of multiply or highly charged ions at more than one order of magnitude higher energies than hitherto reported. Resolving power leading to relative precision up to 6 parts-per-million points to the possibility of providing an atomic absolute wavelength standards in this spectral region, which is still lacking.
1. Introduction
With an average density of only 10-25 kg/m3, the universe contains nevertheless tremendous amounts of hot, and in principle observable, baryonic matter [1]. In most circumstances atoms will be found in ionic states ranging from those missing only a few electrons to the ones with most of them stripped off, up to bare nuclei. These highly charged ions (HCI) [2] are present in stars and their atmospheres, in supernovae, in near-stellar clouds, in shocks and jets from active galactic nuclei, in stellar winds and in various other astrophysical environments. Their spectral features provide us with direct and unique information on the composition and the state of matter of even the most distant known objects. Gaining insight into the spectra is therefore indispensable for understanding and developing astrophysical and cosmological models. Huge efforts have been undertaken to measure their emission spectra with increasing resolution, culminating in a series of X-ray satellite missions in the past decade like XMM-Newton or Chandra. Moreover, distinct quantitative knowledge of photon emission and absorption by HCI is crucial for modelling earthbound plasmas such as those used in fusion research [2] or for exploring the equation of state (EOS) of warm dense matter (WDM) [3].

HCI are, in comparison to neutral atoms, relatively simple atomic systems. Neglecting the constituents of the nucleus, only a few particles —for spectroscopy at least one bound electron is needed— are interacting, and therefore the electronic level structure become less complex than in atoms. Furthermore, in HCI one can control this complexity by choosing the number of bound electrons. As an example, exploring hydrogen-, helium-, or lithium-like systems with the same nuclear charge is one way of varying electron-electron correlation contributions in the system. In this respect, HCI are an ideal test bench for forefront atomic structure theory, with important fundamental implications. In HCI the strength of various electromagnetic effects rises in comparison with their equivalents in neutral atoms. It is not surprising that this increase scales up with Z, the atomic number of the ion, since it is the field created by the charge Ze (e being the elementary charge) in which the last bound electron (1s in U91+) experience electric and magnetic field strengths of up to 1021 V/m and 108 T. At such high field strengths, the semi-classical Bohr radius is already smaller than the Compton-wavelength. Effects caused by non-trivial quantum vacuum, e. g., vacuum polarization (VP) and self-energy (SE) [4], exert significant influence on the interaction between the electrons and the nucleus. In the above example, field strengths close to the Schwinger limit (8 x 10¹⁸ V/m), in which the energy gained by an electron within the distance of a Compton-wavelength is sufficient to create real electron-positron pairs, cause very large radiative contributions. Scaling laws are usually given in the form Zκ, where the exponent κ is dependent on the origin and characteristic of the specific electromagnetic interaction. While electron-nucleus interactions within the ion scale with κ=3, interelectronic correlations grow with κ=2. Hence, in HCI the relative influence on the total binding energy of interelectronic correlation goes down while Z rises. Relativistic contributions to the binding energy, for example, scale with Z4, and are therefore strongly boosted in HCI compared to the case of neutral atoms. Transition probabilities can show an even stronger Z dependence, the M1 transition matrix element for example is rising with Z11. The linewidth of inter-combination transitions between multiplets of different total spin S scales as Z10. Since the lifetimes scale in a reciprocal way, the corresponding optical ‘forbidden’ transitions become observable. Such lines were found in the emission spectrum of the sun already in 1869, but their explanation had to wait until the 1930’s [5]. Newer approaches try to exploit the advantageous Z5-dependency of contributions to the transition wavelength due to Z boson exchange inducing parity non-conservation [6], or to detect minute drifts in time of fundamental physical constants as the fine-structure constant α [7]. Although highly abundant in the universe, HCI do not occur naturally on earth, as temperatures needed for their production easily exceed 105 K. However, HCI up to even H-like uranium have become available in a few laboratories, either with accelerators [8] feeding ion storage rings [9, 10], or
(c) (a) (b)
Figure 1. (a) Energy scheme of a hydrogen-like ion versus (c) that of a Li-like ion. In (b), Feynman graphs of the one-loop self-energy (top) and vacuum polarization (bottom) responsible for the major contributions to the Lamb shift.

by means of electron beam ion traps (EBITs) [11, 12, 13]. A great variety of spectroscopic methods have been applied [14] to cover the broad emission spectrum of HCI, from the infrared up to the hard X-ray range. Spectroscopy of neutral atoms and molecules was revolutionized by the advent of lasers, with impressive examples, such as the ∆ν⁄ν=1.8⋅10-14 (or even better) accuracy demonstrated in measurements of the absolute 1S-2S transition frequency ν in atomic hydrogen [15], an improvement compared to conventional spectroscopy by several orders of magnitude. In spite of the broad range of laser spectroscopy applications to neutral (cf. [15, 16]) and singly-charged species (cf. [17, 18]), these techniques have been applied to HCI in the visible and near ultraviolet spectral range only in a few exceptional cases, such as the hyperfine splitting of heavy H-like ions [19], and the fine structure splitting of some light ions [20, 21, 22] in which the electronic structure of the HCI allows for an optical transition. However, photon emission by HCI is naturally most intense in the X-ray region. The absence of laser spectroscopic data in this region was a consequence of the complete lack of intense X-ray laser sources, and of the fact that HCI were only available as very tenuous beams. The lack of appropriate lasers meant that X ray wavelength measurements in HCI had to use conventional wavelength or energy dispersive methods as crystal or grating X-ray spectrometers [13, 23], or solid-state detectors [24, 25]. Despite intense efforts invested in instrumentation development over several decades, their absolute limitations with regard to accuracy, stability, and efficiency remained an insurmountable barrier to further experimental progress. As a consequence, the most accurate wavelength measurements in HCI with a nuclear charge Z around 20 or higher did not exceed 2 parts-per-million (ppm) [23] in general or 15 ppm in Li-like ions [26], systematically limited by instrumental resolving power and statistics. Also recently Lestinsky and coworkers performed a storage ring based energy measurement on Li-like scandium (Z=21) with an overall accuracy down to 5 ppm [27]. Due to these limitations, in accuracy and resolution, the status of HCI spectroscopy resembled that of optical spectroscopy prior to the availability of tunable lasers. In this report we summarize our work extending laser spectroscopy, a key technology for the last 50 years in fields like biology, chemistry, physics and various others, to ground-state transitions in HCI and, moreover, into the soft X-ray range. The goal is to develop a technique of utmost precision in ion spectroscopy by combining two advanced technologies, namely a state-of-the-art EBIT —providing a target of trapped highly charged ions— and the first soft X-ray laser. With the highly intense and bright radiation of FLASH we were able to excite one-photon transition up to 64 eV energy difference so far. During our two week-long campaigns at FLASH in the years 2006 and 2008 we focused on the ground-state transitions in Li-like highly charged ions with Z>20. These ions have three remaining electrons and a fully occupied n=1 shell, while the 2s sub-shell is half filled by one electron. Not coincidentally, those systems are among the ones measured with the highest accuracies in the field of HCI and thus most challenging to compare with, and beyond that, they are also of enormous interest to test predictions of strong field quantum electrodynamics (QED) [4, 28-31]. The transitions we are most interested in are the two ground-state transitions 22S1/2 — 22P1/2 and 22S1/2 — 22P3/2 present in all Li-like ions (figure 1 (c)). Fortunately, at least for the 22S1/2 — 22P1/2 transition almost all transition energies along the Li-like iso-electronic sequence from Z=15 (≈20 eV photon energy) to the heaviest elements in the periodic table up to Z=75 (≈200 eV) can be addressed by FLASH using its fundamental mode. This set of data on different nuclear charge Z can be of crucial importance to understand QED and other contributions to the transition energy such as nuclear size effects. With an outer electron in a s-state Li-like systems show many parallels with hydrogen or H-like ions. With the exception of positronium, hydrogen or H-like ions have the simplest structure among bound systems. This simplicity was the only reason the minuscule Lamb-shift [32] could be discovered as the energy difference between the 2s1/2 and the 2p1/2 levels, which should not exist according to Dirac’s theory stating the degeneracy of states with the same angular momentum. The explanation of this energy shift strongly promoted the theory of QED. Within its framework, calculating the vacuum polarisation and especially the self-energy contributions became possible in the one-loop

representation [33], shown as a Feynman graph in figure 1 (b). In principle, for arbitrary accuracy on the QED part of any transition, theorists need to calculate an infinite number of such graphs. Since their complexity rapidly increases with the loop-order, the calculation of just a single diagram becomes more and more challenging. Steady progress over decades has made weak-field QED the best tested scientific theory, with impressive confirmation by experiment in the case of atomic hydrogen [34], but for strong-field QED both theory and experiment remain still away from that certitude by many orders of magnitude. A calculation of an individual Feynman graph is usually carried out by series expansion with Zα as one of the expansion parameters (with α≈1/137 the fine-structure constant). In weak-field QED, Zα<<1 (Z=1 for atomic hydrogen) is a small parameter, and the expansion converges rapidly. In a HCI, however, Z is much larger, and the series frequently does not converge at all. Therefore bound strong-field QED requires a different approach using all-order techniques [4]. Presently, neither calculations nor experiments on Li-like HCI reach a one ppm level. Although a hypothetical deviation, if found at higher accuracy levels, might not necessarily lead to ‘new’ or ‘not yet expected’ physics, one can argue that for a theory as uniquely fundamental as QED is, it becomes mandatory to predict accurate energy values for transitions in systems like H-like, He-like, or Li-like HCI. If nothing else to benchmark the mathematical tools, since these are not only applied to these few cases, but find use in all realms of physics and advanced chemistry. Naturally, verification by comparison to accurate experimental results is called for. An obvious approach to test QED with HCI might be investigating the Lamb-shift 2s1/2 — 2p1/2 in different H-like systems. There have been direct measurements [35-38] of this transition and also related indirect determinations using measurements of the 2s1/2 — 2p3/2 transition [20, 39-41]. In one particular case of H-like sulphur this was performed by applying laser techniques [42], but only with comparatively light elements. The upper limit, so far, is Ar17+ (Z=18), and the accuracy did not exceed 10,000 ppm [38]. Experimentally difficulties arose from the fact that the initially long-lived 2s1/2 level loses its longevity with the 11th power of Z. Already at Z=18, the 2s1/2 decays to the 1s1/2 ground state in less than 3 ns. As a consequence, absorption techniques starting from the 2s1/2 level suffer from dilute targets due to the rapid decay. Furthermore, emission spectroscopy with suitable spectrometers is hindered by the unfavourable branching ratio between the suppressed 2s1/2 — 2p1/2 and the dominant 2s1/2 — 1s1/2 decay channels. These problems had brought Lamb-shift investigations to nearly insurmountable experimental limits. QED effects do not exclusively apply to the original 2s1/2 — 2p1/2 Lamb shift, but exerts its influence in all electronic energy levels. The 2s1/2 — 2p1/2 shift in hydrogen is the remainder of an unequal shift of two levels. In order to speak of a shift, a reference point needs to be defined, and this is in this case the energy eigenvalue found by solving the Dirac-equation. As a rule of thumb, in hydrogen or H-like ions the electronic shells with smaller principal quantum number n are influenced more strongly by QED, so for instance 1s more than 2s and 2p more than 3p. Additionally, s levels are shifted stronger than p levels, and so lies 2s higher than 2p. Therefore, the 1s electron has the largest shift with respect to its Dirac value, causing a smaller total binding energy. Thus, measurements of the 1s Lamb shift in H-like ions with different Z up to U91+ have contributed significantly to QED tests (see [9, 43] and references therein). This strong scaling in the nuclear charge Z can be illustrated by comparing the values of the shift with 0.000034 eV in hydrogen, 1.145 eV in Ar17+ and 467 eV in H-like uranium [4]. As already mentioned, Li-like systems form a term level diagram similar to that of hydrogen-like systems, see figure 1 (a) and figure 1 (c). It is immediately noticeable that, however, the 22S1/2 level is the most tightly bound one, contrasting to the hydrogenic case. In Li-like systems this is simply a consequence of the shielding due to the two 1s electrons which affects the ‘penetrating orbits’ of s electrons far more strongly than those of p electrons. We see that the largest fraction of the energy splitting 22S1/2 — 22P1/2 in Li-like ions is not related to QED corrections but rises up from humbler roots. Nonetheless, this transition is still the one having the highest possible QED contribution to the total energy difference. From neutral Li with 1.85 eV transition energy and a -0.000031 eV total QED contribution (17ppm) [44] to that transition, it scales

up rapidly to 48.600 eV and -0.503 eV QED part (10000 ppm) in case of Li-like Fe23+ to finally 280.645 eV transition energy and a -42.8 eV QED in Li-like U89+ (152000 ppm) [45, 29]. So, even if the measurable absolute QED shifts of the optical electron in Li-like ions is smaller than that of H-like ions of same Z, this transition in Li-like ions nevertheless offers a higher relative QED contribution. This is a great experimental advantage for spectroscopy, in particular since it is an intra-shell transition with n=2 and not an inter-shell transition involving the 1s level, as needed for H-like ions. In other words, in the latter the significant QED contribution is hidden within the very large energy difference between the 1s level and any other one. For example at least 3318 eV are needed in H-like Ar17+ (having a 1 eV QED part) to excite the 1s electron, and 102.17 keV in U91+ that has 467 eV QED (plus nuclear size) contributions [46]. A complete discussion of the influence of QED on bound electrons definitively requires investigation of He-like ions (see [23, 47-49] and references therein) and Be-like ions [50], which have an increasing complexity. The electronic sub-shells of those systems are fully closed, therefore their description, even for the outer electrons, is influenced by inner-shell interactions. With combined theoretical and experimental efforts, a stepwise understanding of the few-electron HCI would appear a sensible approach to understanding the QED of many-electron systems, and finally, that of inner-shell electrons in atoms.
2. Experimental setup
Figure 2. Longitudinal section of FLASH-EBIT and photography of the device out of a similar perspective (upper right). The electron beam is indicated in red colour. It emerges from the electron gun, passes the drift tube assembly, where ions are produced and trapped, and is dumped on the collector. The apparatus has a length of 2.5 m and weighs approximately 1,500 kg.

2.1. The Heidelberg FLASH-EBIT An EBIT [51] produces and stores ions in a cylindrical volume with the dimensions of a human hair of a few centimetres length. It is different to most other devices used for producing and investigating HCI in its ‘table-top’ character. The first EBIT was commissioned 1986 at Lawrence Livermore National Lab by Levine and co-workers [52]. Scince then a dozen of such machines now operate around the world. A scheme of FLASH-EBIT is shown in figure 2. A near monoenergetic electron beam emerging from the cathode of an electron gun is used to sequentially ionize atoms from their neutral to any desired charge state. The beam electrons are accelerated to the energy required for ionization by an appropriate potential difference between the gun and the trap electrodes. Typical values are of the order of some keV depending basically on the desired charge state and the ion species. To efficiently produce H-like uranium, for example, a kinetic energy of 200 keV is needed. The high current electron beam (up to 550 mA) is additionally compressed in diameter to achieve a very high current density, in some cases beyond 10000 A/cm2, or nearly one electron per barn per second. For this purpose EBITs are equipped with a non-uniform radially symmetrical (with respect to the electron beam axis) magnetic field produced by a solenoid or a pair of Helmholtz coils, which increases from zero (at the cathode of the gun) to up to 6 T at the trap region. As a consequence of the conservation of angular momentum in the cyclotron motion of the electrons, a 3 millimetre diameter beam starting at near-zero magnetic field is compressed to diameters of 60-100 µm by the strong magnetic field at the trap centre. The electron beam provides another essential ingredient for an electron beam ion trap, namely the stationary electrostatic field created by its negative space charge. In this way, a narrow cylindrical cloud of ions is radially confined within the beam or around it (figure 3 (a)). Typically, there is a complex dynamic interplay between the beam and the ions, caused by various processes such as electron impact ionization, radiative and dielectronic recombination, electronic excitation and radiative decay, plasma heating and others. This combination of interactions of the various charged particles produces ion clouds where most of the ions are typically within a diameter of 2-3 times larger than that of the electron beam, in the present experiments of around 200 to 300 µm. The extension of the ion cloud along the electron beam, strictly speaking the trap length, is determined by the settings of several ring shaped drift tubes on both sides of the central trap region to appropriate positive potentials. This stack of nine electrodes allows thus for adjusting the trap length. In all experiments within the context of this report the trap length was set to be as short as possible, i. e., around 55 mm. Since highly charged ions are extremely sensitive to charge transfer in collisions with the neutrals of the residual gas, a vacuum level below 10-11 mbar is established by cryo-cooling down to 4-5 K the whole electrode stack by means of a two-stage 3 K coldhead, which also cools the superconducting coils (see figure 3). In this respect the FLASH-EBIT was the first cryo-cooled EBIT, not employing a helium cryostat but instead taking advantage of a closed-cycle refrigerator. Low maintenance, reduced cost of operation and longer experimental stability are some of the rewards of this setup. The device is on one hand capable of running at acceleration voltages up to 80 kV. On the other hand, it is also possible to operate it at acceleration voltages of only 50 V, which is very low for such devices [54]. This allows the experimenter to produce, trap and investigate a huge variety of different ions and charge states in a targeted way, presently from N3+ to He-like Ba54+ or even higher. The beam intensity is space-charged limited; at acceleration voltages of more than 5 kV we have reached already currents of more than 550 mA. This makes the device the one with the highest current worldwide. At low acceleration potentials (100 V) it still supports currents of a few mA. The entire apparatus was designed to be as compact as possible without compromising performance, and was built to exploit radiation facilities worldwide. It fits with its periphery, ancillary equipment and electronics in a modified shipping container. The EBIT itself is typically operational within 2-4 days after shipping. Cutting-edge performance is usually regained within some 7 to 10 days later and is a price paid for venting the experiment partly (although with dry nitrogen) for shipping. Prior to experiments at FLASH the EBIT ran already successfully at BESSY in Berlin on photo-ionization of ions [53, 54] and will have beamtime in the near future at LCLS (Linear Collider Light Source) in Menlo Park, USA.

2.2. Setup and experiment 2.2.1. Setup at FLASH. At our two beamtimes at FLASH during the years 2006 and 2008 we worked basically with the same setup. The experiments were carried out at the PG2 beamline which was constructed and maintained by a combined effort of DESY and Hamburg University. This beamline is equipped with a plain grating monochromator [55] which reduces the already narrow bandwidth
(b)
Figure 3. (a) Longitudinal section view of the trap assembly within the superconducting magnet section. Ions (green, centre) are produced by successive electron impact ionization caused by a highly compressed, intense and energetic electron beam (red) guided through the trap. The negative space charge potential of the compressed electron beam is able to confine radially the ion cloud. Its length (about 55 mm) is defined by potentials applied to the different trap electrodes. The FLASH photon beam (yellow) enters from the left and illuminates collinearly the ion cloud. (b) Radial section at the position of the ion cloud. Various detectors installed at 90 collect radiation emitted by the ions. (c) scintillator (1) with its holder (2) which is inserted into the trap region to verify (d) the position of the electron beam (left) and of the soft X-ray beam (right) by scintillation in the visible range.
(c) (d)
(a)

natural to FLASH further to meet particular spectroscopic needs. Figure 4 (a) shows a photograph of the EBIT setup on the PG2 platform. The optical path of this beamline is schematically depicted in figure 4 (b). Coherent radiation with a source width of 150-300 µm is emitted in the undulator section. The plane switching-mirror M0 is followed by the toroidal mirror M1, providing vertical focusing. Furthermore, M1 has also a horizontal focus at Z. Further downstream, mirror M2 guides the beam onto the plane grating. The vertically dispersed light is refocused by a cylindrical mirror M3 onto the polychromatic focus at the exit slit S. The toroidal mirror M4 images S into a single spot at the target. Theoretically, a focus dimension RMShor. × RMSver. of 100–150 µm × ∆S [0–2000 µm] with ∆S the adjusted slit width could be expected [55]. During our measurements we found a spot approximately double the size in vertical direction which corresponds with results in [56]. A significant reduction of the spot size has since been reported [57]. The monochromator should by design reduce the intrinsic energy bandwidth of FLASH of about E/dE ≈ 100 to a level up to E/dE ≤ 30,000. However, one has to consider the direct relationship between bandwidth and resolution, on one hand, and the final photon flux of photons at the interaction region on the other hand. The monochromator scheme trades off photon flux for resolution. Free-electron laser (FEL) seeding schemes should in future improve the current situation. During the here reported runs, we tried to use the maximum resolution available at sufficient flux (2006: E/dE ≈ 2000, 2008: E/dE≈ 3000). As displayed in figure 4 (a), we used a linear configuration in which the photon beam entered the EBIT from the back first passing the electron collector (where the electron beam is
Figure 4. (a) Photograph of the set up during our beamtime showing the last 12 m of the beam path after the mirror M3. (b) Schematic drawing of the light path of the PG2 beamline from the undulator to the experiment in a side and top view. The angles α and β of the grating (see inset) can be set and determine the dispersion (resolution) at the slit. Adapted from [55].
(a) (b)

dumped), continuing on its way co-linearly with the electron beam towards the ion cloud (target) in the centre of the trap region. Finally, the photon beam was dumped on the electron gun cathode (see figure 2). In principle it should be possible to utilize the photo-electron signal derived from the cathode as a timing trigger for the photon-ion interaction. However, efforts to use this signal to receive additional shot-to-shot intensity information did not achieve convincing results.
2.2.2. Principle of measurement. So far, all of our measurements on HCI soft X-ray laser spectroscopy were performed in a single photon excitation scheme. The wavelength of the FLASH laser beam was adjusted by means of the monochromator to excite the transition under investigation. In the case of a short lived upper level, as it is the case for electric dipole transitions, its rapid decay leads to the emission of fluorescence radiation. In the simplest scenario, this radiation has the same wavelength as the exciting radiation. In a more general scheme, the upper level B could also decay to an intermediate level C by emission of photons with longer wavelength. However, the emission of this fluorescence radiation occurs on the whole perpendicularly to the FLASH beam axis. The situation is depicted in figure 3 (a). The Fluorescence radiation was detected in a non-dispersive single photon counting mode. Due to the lack of wavelength resolution in this detection scheme, we applied a time coincidence condition with the FLASH pulse to discriminate ‘true’ fluorescence photons from the strong, electron impact excited radiation background of the EBIT.. The ion cloud and the photon beam were brought to overlap. Both had a comparable diameter of 200-300 µm (figure 3 (a)). The FLASH beam consisted of photon pulse-trains of 30 single pulses, see figure 5 (a), with a 1 µs separation between them. The pulse trains itself had a 5 Hz repetition structure summing up to 150 (nonequidistantly distributed) single pulses every second. Each pulse contained approximately 2·1012 photons within the typical length of 20-80 fs. The total flux amounts to roughly 3·1014 photons/s. As mentioned, fluorescence occurs immediately after each single photon pulse has interacted with the ions. In this spectral range, electric dipole allowed transitions have decay times in the nanosecond range or below, and thus practically all fluorescence photons from a singe pulse are recorded together, since detection time resolution was limited to a few nanoseconds. However, multi hits are not expected since interaction rate times detection efficiency lies well below one fluorescence photon per
Figure 5. (a) FLASH pulse structure. Each pulse train consist out of 30 single pulses separated by ∆tSP=1 µs. The pulse trains repeat on a 5 Hz frequency. (b) Fluorescence (blue) of Fe23+ ions from excitation of the ions with the un-monochromatized FLASH radiation (0th order). No fluorescence is detected for either running on an empty trap (green) or stopping the injection of iron into the trap (black), thus clearly proofing the origin of the fluorescence at this early stage.
(a) (c)

single pulse. Data acquisition was synchronized to the FLASH time structure, and the arrival time of every fluorescence photon with respect to the FLASH trigger was recorded. Figure 5 (b) shows the fluorescence signal when the monochromator was set to 0th order (no bandwidth reduction, maximum flux) and the data acquisition time window encompassed the whole bunch trains of 30 µs length. Theoretically, a structure of 30 single pulses should be visible. At some positions, however, no or very weak signals are seen. The explanation is that either FLASH did not lase during the passage of these electron bunches through the undulator at all, or the (within its bandwidth stochastically varying) photon wavelength systematically did not match the monochromator settings and thus the transition in these pulses. Since data acquisition was linked to the 5 Hz structure, the data showed do not represent one single bunch but rather the integrated signal over thousands of pulse trains. This means that, for example, the signal of every 5th single pulse within a train was accumulated in the same few time bins of our TDC (timing-to-digital converter) and this preserves the 30 pulse sub-structure. In order to retrieve the transition energy we recorded the fluorescence signal as a function of the monochromator wavelength settings. The monochromator scans the wavelength within the broader FLASH bandwidth, covering the transition of interest in that range. For this scheme it is more convenient to link the data acquisition not to the 5 Hz repetition rate of the pulse trains but instead to the single photon pulse timing. All the fluorescence light is accumulated not in 30 single time peaks but just in a single one. The timing gate can be set to less than 1 µs (the time between two subsequent single pulses) and opens just before every individual single pulse passes the ions, thereby summing up the fluorescence signal of thousands of such pulses. By this scheme, our data acquisition remains open only 150 times 1 µs within every second, but retains sensitivity for all potential fluorescence photons. An important benefit is a background reduction by a factor of at least 6000; a further decrease of the time window by post-analysis of the time-ordered data within the 1 µs time window multiplies this suppression by a factor of roughly 20. Time discrimination allows, by reducing background by five orders of magnitude, to extract a extremely weak fluorescence signal from the midst of an environment with a counting rate of (electron-beam excited) soft X-ray photons close to the MHz range. Scattered photons from the FLASH beam are naturally suppressed by the near-zero reflectivity of the cathode and other surfaces within the beam, and by the judicious choice of perpendicular detection geometry, which would require multiple reflections of the scattered photons before they can reach the fluorescence detector. The wavelength dependence of the fluorescence signal demonstrates how effectively scattered photons are suppressed. 2.2.3. Photon detection. Figure 3 (b) shows a section of the trap region. This EBIT provides access to the trap centre through 6 radial viewports, which allow direct observation of the radiation emitted by
Figure 6. Spectrum recorded by our flat field grating spectrometer in the wavelength range from 13 to 33 nm (from 95 eV down to 37 eV). Two iron lines we excited also by FLASH radiation are indicated.

the ions by means of various instruments. During the two campaigns the following equipment was used: (1) a two stage gas jet chamber for injection of gaseous or volatile neutral species into the trap; (2) a 52 mm soft x-ray MCP-detector for monitoring purposes; (3) two cylindrical silicon mirrors to focuses fluorescence light onto another MCP detector. The total detection probability (detection efficiency × solid angle) of this mirror system was estimated to be 10-4 for photon energies below 80 eV. (4) a liquid nitrogen cooled germanium X-ray detector (intrinsic germanium low-energy type, IGLET) on a cold finger was utilized for ion charge-state monitoring, and (5) a flat-field grating spectrometer [58] with a cryo-cooled CCD camera for spectrally resolved detection of the soft X-ray radiation by trapped ions. The IGLET detects X-ray photons in the energy range 1 to 160 keV and permits analysis of the contents of the trap, exploiting the characteristic radiation of differently charged ions. A further diagnostic tool is the grating instrument, of which a typical spectrum is displayed in figure 6. It shows the wavelength interval from 12-33 nm with a resolution up to 1000. This allows the user to cross-check our laser spectroscopic measurements. In our experience, a maximum in fluorescence yield for our laser spectroscopy measurement is directly connected with a maximum visibility of the same line (electron beam excited) in the grating spectrometer, which operates in a time integrating mode with exposures lasting several minutes. We stress however that the fluorescence yield is too small to become visible on the grating spectrometer, no matter if the FLASH radiation is ‘on’ or ‘off’. A strong line in the grating spectrum simply indicates an optimized ion production process and thus a maximum amount of the desired ions in the trap.
3. Results 3.1. First run in 2006 This first beamtime period was dedicated to demonstrate the proof-of-principle of our scheme for extending laser-spectroscopy with its enhanced accuracy for the first time to transitions in ions in the soft X-ray spectral region. The results appeared in [59]. As target we chose Li-like iron (Fe23+), for which we intended to excite the already mentioned ground state transition 22S1/2 — 22P1/2 , see figure
Figure 7. Electron recombination photons recorded as a function of the electron beam acceleration voltage and their energy. The most prominent structures belong to the Fe KLL resonances.
(a) (b)
1 (b). Iron was an ideal candidate for experiments for various reasons. It is abundant both on earth and in outer space, and it is a key element in the solar corona [60] in particular in charge states from 9+ to 23+. Iron is from a spectroscopist’s point of view one of the most intense and visible elements used in EBITs. Fortunately, the 22S1/2 — 22P1/2 transition energy of 48.6 eV (wavelength λ=24.5 nm) was within the range FLASH was capable to deliver stably with high photon flux at that time. With a 22P1/2-level lifetime of 0.6 ns, fluorescence follows immediately excitation, and our detection scheme discussed above could be applied effectively. To introduce iron into the trap we injected vapour of iron pentacarbonyl (Fe[CO]5) through the two- stage gas inlet (figure 3 (b)). The minimum electron energy needed to ionize beryllium-like Fe22+
to our desired state Fe23+ is 1960 eV. However, the electron impact ionization cross-section at ionization threshold is zero, and reaches a maximum, as a rule of thumb, at two to three times higher values. At electron energies of 4900 to 5600 eV, however, production of the He-like charge state Fe24+ is almost equally probable, since its production threshold lies with 2050 eV only slightly above that of the Li-like species. To be able to maximize the Fe23+ target density, we ran the EBIT in a mode in which He-like iron is resonantly recombined into the Li-like state at a high rate. This is possible by exploiting a dielectronic recombination resonance [61] at around 4660 eV, more specifically two close-lying He-like KLL resonances. At that electron energy setting, the energy released by radiative recombination of a free electron from the beam into a 2p level of the He-like ion matches exactly the energy required for inner-shell excitation of a 1s electron to the 2p level. The intermediate Li-like states populated thereby relax radiatively to the Li-like ground state by characteristic emission of a 6.64 keV photon. Figure 7 shows a two-dimensional density plot with the rate of photons emitted by the ions with energies between 2-9 keV, which are detected by our IGLET detector as a function of the electron acceleration voltage applied between the electron gun and the trap electrodes. Clearly visible is the resonant character of dielectronic recombination (black rectangle labelled Fe KLL). The electron
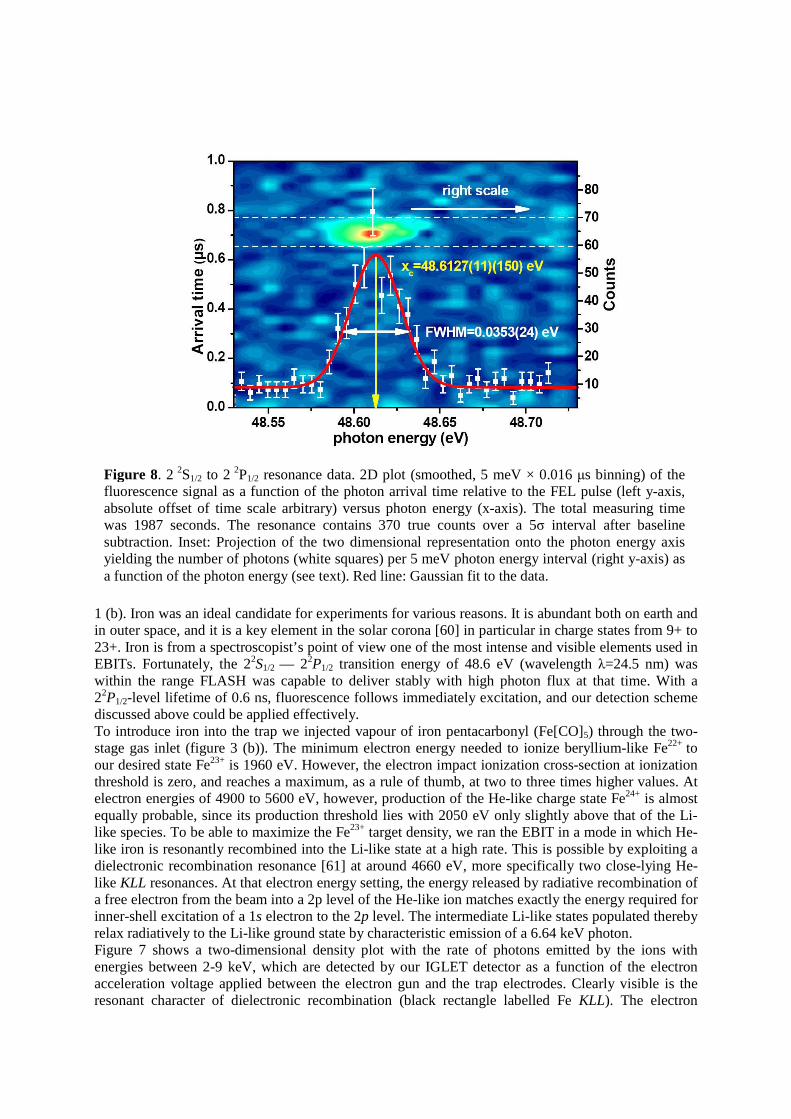
Figure 8. 2 2S1/2 to 2 2P1/2 resonance data. 2D plot (smoothed, 5 meV × 0.016 µs binning) of the fluorescence signal as a function of the photon arrival time relative to the FEL pulse (left y-axis, absolute offset of time scale arbitrary) versus photon energy (x-axis). The total measuring time was 1987 seconds. The resonance contains 370 true counts over a 5σ interval after baseline subtraction. Inset: Projection of the two dimensional representation onto the photon energy axis yielding the number of photons (white squares) per 5 meV photon energy interval (right y-axis) as a function of the photon energy (see text). Red line: Gaussian fit to the data.

energy was tuned to resonance with the lowest energy transition of the four intense resonances observed. Due to strong space charge effects, the acceleration voltage times the elementary charge e lies always higher than the actual electron energy, from which follows that the resonance appears in this representation at values higher than the theoretical 4660 eV. From the data in figure 7 we estimate the number of Li-like ions in the trap lying between one and two million at electron beam currents of more than 500 mA, and thus achieving average ion target densities of more than 1010 per cm3 within the trapped ion cloud. The most cumbersome task during this first campaign was to bring the FLASH laser beam with its diameter of 200 µm to overlap with the ion cloud of a similar diameter. The light path of FLASH is fixed in space and cannot be adjusted by the user. In the EBIT itself, the relative alignment of the superconducting magnet axis and the electron beam are optimized carefully for minimized electron beam loss. With the magnet coils fixed to the EBIT supporting frame, and all other elements of the apparatus adjusted to it, moving ten million Fe ions in space involves a mechanical effort increased by 23 orders of magnitude. Therefore, we had to adjust the whole EBIT with a total mass of more than 1,500 kg on a sub-millimetre basis until we fixed the open five free orientation parameters to align those two cylindrical volumes. To ease alignment, we first used a brighter, unmonochromatized beam (monochromator in 0th order) to find fluorescence. Afterwards we sought and found fluorescence with the monochromatic beam, and extracted excitation energy information. Figure 8 shows our main result, the accumulated number of photons detected during a single, final continuous run of approximately 33 minutes in which we repetitively scanned the monochromator over the resonance. The relative arrival time of those photons with respect to the 1 µs gate is displayed as the ordinate in the two-dimensional representation in figure 8. As we can see, fluorescence photons appear concentrated in a region well defined with respect to wavelength and arrival time. This result tells us two things: Firstly, counts depend on the wavelength set at the monochromator, in contrast to the wavelength-independent background by the continuously running EBIT (as high as 50,000 counts per second, three orders of magnitude more intense than the fluorescence) as well as by FLASH radiation scattering on vacuum parts or (elastically) on trapped ions in the trap. Secondly, photons counted on that spot structure arrive within a small 70 ns time window within each 1 µs gate, which proves their correlation to the FLASH photons in an additional way, thus allowing for even stricter photon background discrimination. The projection of the resonance structure (as contained within the two horizontal white lines) onto the photon energy axis is represented by the white data points (right scale), and delivers the resonance energy evaluation of the 22S1/2 — 22P1/2 transition. A Gaussian fit to the data provides a centre-of-mass energy E0= (48.6127±0.0011stat.) eV, or conversely a wavelength λ0= (25.5045 ± 0.0006stat.) nm. The resolution of this measurement is given by E0/FWHM=1350 (full-width-at-half-maximum), and corresponds approximately to the monochromator resolution of 2000 in connection with the chosen 700 µm exit slit. One has to keep in mind that the radial extension of the ion cloud acts practically as an additional slit and can thus increase the resolving power in comparison with the nominal exit slit width. The total true fluorescence count within a 5σ-interval beneath the red fit curve in figure 8 is only 370 within the 2000 s of run time. Those 370 counts have been isolated from a background of total 108 photons by the techniques discussed above. Although our measurement was carried out within a comparatively short run we were able to reach a statistical accuracy similar to the total uncertainty level of the so far best value [62] achieved with grating spectroscopy of Elit.= (48.5997±0.0009abs.) eV. Unfortunately, for causes unrelated to this novel technique, our wavelength measurement was limited by the systematic uncertainty in the calibration of the monochromator, which was not better than ±0.0150 eV at this time. This adds a systematic error of that magnitude to our final result E0= (48.6127±0.0011stat. ±0.0150sys.) eV. 3.2. Second run in 2008
The plan for our ten 12 hour shifts in the 2008 campaign was to resume work where it was left in 2006, namely the clear evidence of a wavelength dependent fluorescence signal on the 22S1/2 — 22P1/2 transition in Fe23+, and from this point to focus in obtaining an absolute wavelength determination. For this task it was mandatory to calibrate and characterize the PG2 monochromator. To our knowledge there has not been a single instance for which a soft X-ray monochromator calibration with our desired accuracy at synchrotron light sources was reported. This is most likely consequence of the lack of appropriate calibration sources or techniques, as we will be discuss in more detail below. Our experimental setup remained principally unmodified to the description given above, but for the addition of a small and, in principle, straightforward, beam monitor that nonetheless served very well to achieve overlap between the FLASH beam and the ion cloud target. This arrangement consists of a Ce:YAG scintillator crystal which is inserted through a slotted aperture into the central trap electrode by a push-pull manipulator (figure 3 (c)). Challenges were posed to design by the cryogenic, 4K temperature of this drift tube, the high voltage applied to it, the need to rotate the crystal after insertion through the narrow aperture, its exposure to and charging-up by the electron beam, and the long distance from which the extremely weak scintillation had to be imaged. The scintillator itself is a disc of 10 mm diameter with a thickness of one millimetre, and can be adjusted after insertion into the central electrode such that one side faces the electron beam and the other side the FLASH beam. A Ce:YAG crystal emits fluorescence light in the optical range when irradiated by either soft X-ray photons or bombarded by charged particles. By means of a fast, electron multiplication intensified CCD camera (Andor LUCA), our setup allows for imaging the fluorescence spots induced either by the FLASH photon beam or by the electron beam, see figure 3 (d). With the position of the electron beam recorded by the camera, which is mounted on the EBIT supporting frame, we have an ideal proxy for the ion cloud axis. Overlap of the electron beam position, and hence the theoretical centre of the ion cloud, and the FLASH beam axis, or strictly speaking the EBIT axis is then established by observing the photon-beam fluorescence position while adjusting the EBIT supporting frame. Additionally, this setup enables one to directly monitor the beam shape of FLASH while, e. g., changing the exit slit width. We investigated the 22S1/2 — 22P1/2 as well as the 22S1/2 — 22P3/2 transition in Li-like Fe23+ and the 22S1/2 — 22P1/2 transition in Li-like Cu26+ during this run. In the case of 22S1/2 — 22P1/2 in Li-like iron
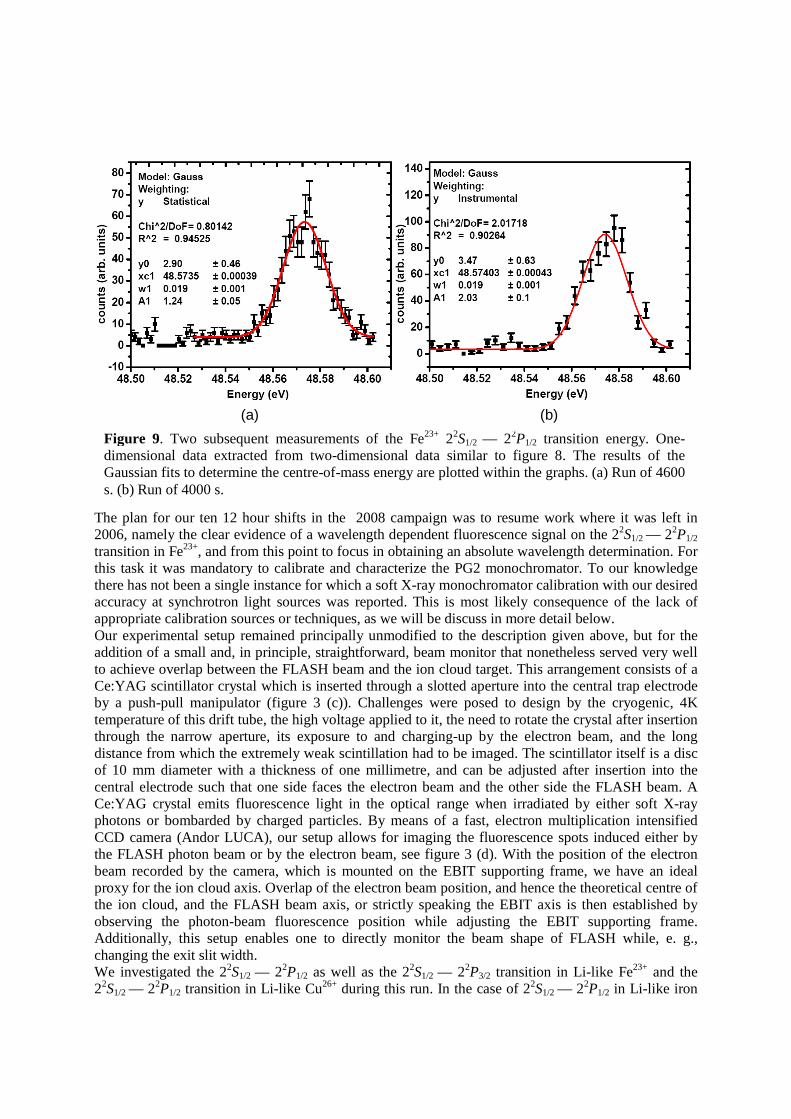
Figure 9. Two subsequent measurements of the Fe23+ 22S1/2 — 22P1/2 transition energy. One-dimensional data extracted from two-dimensional data similar to figure 8. The results of the Gaussian fits to determine the centre-of-mass energy are plotted within the graphs. (a) Run of 4600 s. (b) Run of 4000 s.
(a) (b)
we tested the possibility to achieve a calibration by using known photo-ionization lines of neutral neon. 3.2.1. 22S1/2 — 22P1/2 transition in Fe23+ and photoionization of Ne. With the ability to visualize the FLASH beam as well as the ion cloud position we were able in 2008 to swiftly return to the situation at the end of our 2006 run. Figure 9 shows two subsequent measurements on the 22S1/2 — 22P1/2 transition in Fe23+. The first dataset took over 4600 s, the second dataset 4000 s exposure time. Both measurements show around 700 true fluorescence counts, and the achieved resolving power is E/FWHM=2000 on both, with a FWHM of 22 meV. It is noteworthy that the line centers, which are, E1=(48.57350 ± 0.00039stat.) eV and E2=(48.57403 ± 0.00043stat.) eV respectively, match perfectly within their sub meV uncertainties, and thus prove stable conditions over the 2.5 hours of measurement, resulting in an average of E0=(48.57374 ± 0.00029stat.) eV. This demonstrates a statistical accuracy of 6 ppm, a fourfold improvement in comparison with the 23 ppm achieved in 2006. However these results cannot constitute absolute values while monochromator energy (or wavelength) scale is not independently calibrated at a better level, which is by itself a rather challenging task. One approach to achieve a moderately accurate absolute calibration is the use of known photoionization absorption lines in neutral neon, where a group of resonances lie between 48.7 and 49.0 eV. Photons with energy matching absorption lines generate three different types of signals which could be exploited: one can detect the (i) photoelectrons emitted from the atoms while scanning the wavelength, or analogously the (ii) photoion yield, and, since beam photons are absorbed by the ionization process, (ii) the FLASH beam intensity after passing the neon gas absorber (which was a photon beam attenuator by design). Thus, the photon beam flux downstream the gas attenuator can be measured as a function of the photon energy and the positions of the absorption lines can be compared to their literature values. In principle, this could be best done by inserting the neon gas directly into the area surrounding our interaction point in the central trap drift tube. But in order to achieve measurable absorption the gas pressure needed would be so high that we would spoil the ultra high vacuum of our trap for days. Therefore, it would be more convenient using an absorption cell inserted in the PG2 beamline right before the EBIT entrance port. Unfortunately, this absorption cell was not operational due to damage to its MCP detector, and there was no way to overcome this problem within
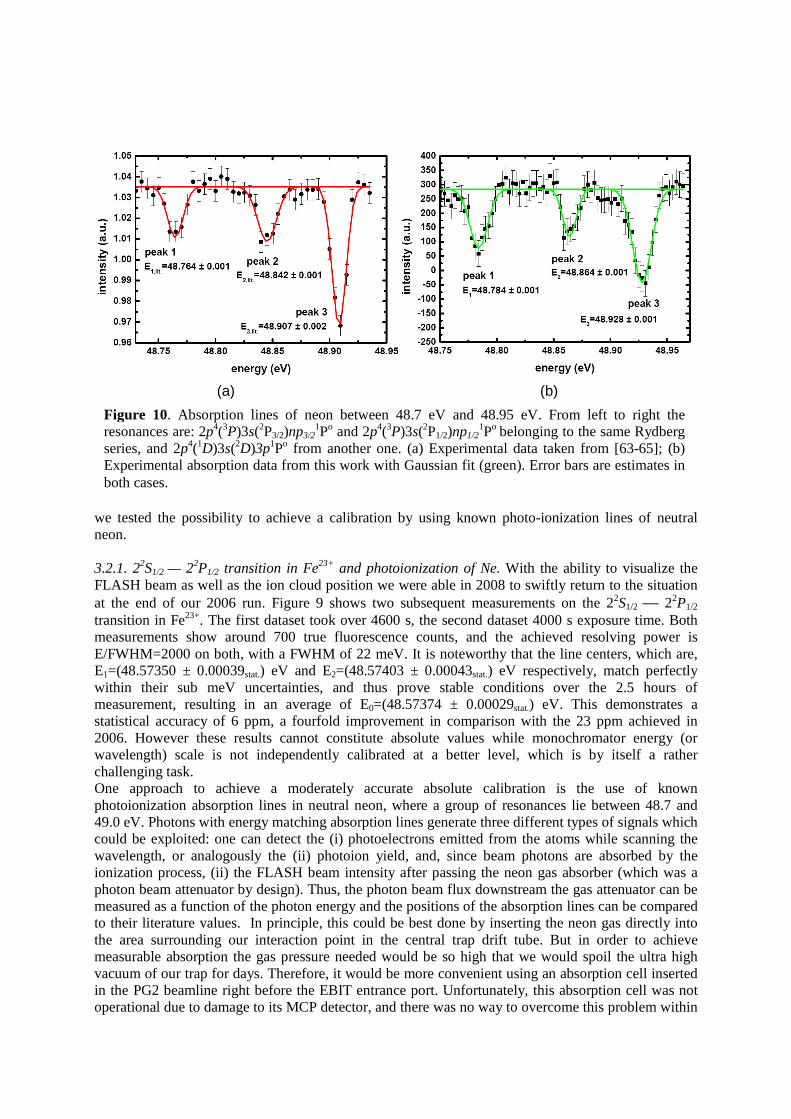
Figure 10. Absorption lines of neon between 48.7 eV and 48.95 eV. From left to right the resonances are: 2p4(3P)3s(2P3/2)np3/2
1Po and 2p4(3P)3s(2P1/2)np1/21Po belonging to the same Rydberg
series, and 2p4(1D)3s(2D)3p1Po from another one. (a) Experimental data taken from [63-65]; (b) Experimental absorption data from this work with Gaussian fit (green). Error bars are estimates in both cases.
(a) (b)

our user beamtime. We had to follow the inconvenient way of using the 15 m long beam attenuator of FLASH located upstream to the point where the FLASH beam is distributed to various beamlines, flooding it with Ne to base pressures up to 150 mbar. This location lies upstream from the monochromator, implying that the FLASH light first interacted with the neon, ionizing it, and then passes the monochromator. By scanning it accross the interval from 48.7 to 49 eV, where the usable absorption lines lie, we had to measure the intensity of FLASH as a function of the photon energy. We did that by using our Ce:YAG crystal in its position within the central trap-electrode in two different ways. First, we recorded the fluorescence intensity by means of our intensified CCD camera, and second, we used in parallel our silicon-mirror setup to counting soft x-ray photons scattered at the scintillator crystal. Figure 10 (b) shows three photo absorption resonances we could record by this arrangement. A fundamental drawback of this approach is that one has to measure a small intensity decrease on top of a large signal, with poor signal-to-noise ratio, thus requiring several hours to record the curves shown. Nevertheless, the centroid determination of all three peaks has an uncertainty in all cases of roughly 1 meV or even better. We compared their values with those reported in [63] and [64,65] respectively, which are given with absolute accuracies of 1 meV. Those reference data are shown in figure 10 (a). A least-square minimization of the resonance energy positions in comparison with the reference values yields a shift of (20.95 ± 0.50stat..) meV with a remarkably small uncertainty, thus indicating perfect agreement within error bars between the two calibration measurements. Inexplicably, inclusion of this shift as correction in our measured transition energy E0 leads to a calibrated result of E0,cal=(48.55278 ± 0.00075stat. ± 0.001sys.) eV. Comparing this with the literature value given in section 3.1 indicates that our experimental value is off by almost 45 meV (actually the measured shift of about 21 meV points in the ‘wrong’ direction). Since the two measurements, namely that of the Li-like transition, and the photoionization calibration, were carried out with utmost caution, we have no explanation but that some systematic, unknown deviation has affected our measurement. It is not clear what origin this problem might have. It could result from stability problems since it is necessary to keep the FLASH photon beam parameters, such as its pointing, or the source-point position, constant for almost half a day. Other possible cause could be the fact that we do not use the position of the ion cloud itself (which acts as an exit slit under certain circumstances) as the reference in both measurements. In the case of the photoionization, all light passing the exit slit of the monochromator is scattered by the crystal or causes it to scintillate; in contrast, in the case of the photoexcitation of the 22S1/2 — 22P1/2 transition, the ion cloud acts as a second slit, which may or may not be perfectly centered on the mechanical exit slit. This can lead to an asymmetric response, and hence to a constant shift, if the (at the exit slit) angularly divergent but geometrically focussed photons of different energies spread out on their way to the interaction point. Nevertheless, it is worth mentioning that photoionization lines can not be used to calibrate on the level of the small statistical uncertainty demonstrated here, since they are at their best good to 1 meV in this spectral range. Lack of adequate calibration sources and their inherently asymmetric Fano lineshape is limiting the suitability of these photoionization lines as secondary standards in general. 3.2.2. 22S1/2 — 22P3/2 transition in Fe23+. With a photon energy of around 64 eV, the 22S1/2 — 22P3/2 transition in Li-like iron is the most energetic transition we have resolved this far by laser spectroscopy. Fig. 11 shows a run over 3600 s yielding E0 = (64.54658 ± 0.00050stat.). We achieve 8 ppm accuracy in the determination of the line center within a hour beamtime. It is interesting to compare the energy difference between the 22S1/2 — 22P3/2 and the 22S1/2 — 22P1/2 transitions, namely ∆exp.=.15,9729 eV, with the most accurate reported value [66] ∆lit.=15.9659 eV. Both values disagree by 0.007 eV only, which has to be viewed in the context of the 0.045 eV shift of the first of the two inferred if the Ne absorption calibration was correct. Obviously, relative changes of the monochromator settings over the comparatively large scanning distance from 48.6 to 64.5 eV still lie well within reasonable bounds. This finding would favour our second scheme for absolute calibration,

where both the measurement line and a reference line are present at the same time, which we could realize in Li-like Cu26+ for the first time. 3.2.3. 22S1/2 — 22P1/2 transition in Cu26+. Measuring simultaneously a transition of interest and the calibration references would seem an ideal way to attain highly accurate absolute results. A class of very appropriate candidates for reference lines are H-like and He-like light ions, such as Be, B, C, N, O, and to a lesser extent F and Ne. These highly abundant species have naturally stimulated the physicists’ interest in their spectra since decades, and thus a comprehensive body of data exists [66]. Moreover, they allow already (or are likely to do it in the near future) for sufficiently precise electronic structure calculations, and hence even the theoretical energy levels of these fundamental transitions can provide references with adequately small uncertainties. The 22S1/2 — 22P1/2 transition energy in Li-like Cu lies at about 55.2 eV, close to the (1s2s) 3S1—(1s3p) 3P2 transition in He-like C4+ at 54.5715 eV. The lower state of the latter is not the ground state but a long-lived metastable state (lifetime τ=20 ms in C4+), and the lowest possible excited state of this ion. It is analogous to the well known metastable state of the triplet configuration of the isoelectronic neutral helium atom. This metastability is crucial because absorption technique like laser spectroscopy require a well populated lower level, thus either ground state or a metastable state, for photon absorption to happen. Volatile copper compounds are extremely rare and choices limited, we vaporized a rather complicated copper organometallic compound (CH3)3SiC≡CSi(CH3)3·[CF3COCH=C(O-)CF3]Cu (CAS 137039-38-4) to bring Cu into the trap. It has a molecular weight of 480 u, and carries a single copper atom only, but contains also the elements H, C, O, F, and Si in different proportions, which were intended to serve for calibration. Fig 12 shows a measurement of the Cu26+ 22S1/2 — 22P1/2 line in which a broader energy range than usual was scanned in order to include the designated reference lines. The measurement time is about 3600 s, but each wavelength data point has an statistical significance obviously lower than that of the measurements in iron described above. When we switched from iron to copper, it was not possible to optimize the trapping parameters to the same level we reached with the former element. Unfortunately, this copper compound was less suitable than the iron carbonyl molecule for efficient trap loading due to the low fraction of the element in the sum molecular weight.
Figure 11. Measurements of the Fe23+ 22S1/2 — 22P3/2 transition energy. One-dimensional data extracted from two-dimensional data similar to figure 8. The data was recorded in 1 hour of measurement time. Parameters of the Gaussian fit (red) are plotted.

Nevertheless, two fluorescence peaks at about 54.6 eV and 55.2 eV are visible in the spectrum and could be fitted. Their centroid energies in an uncalibrated scale are (1)E0=(54.615 ± 0.003stat.) eV and (2)E0=(55.177 ± 0.003stat.) eV, respectively. The blue data curve is taken from the spectrum simultaneously recorded with the soft-x-ray grating spectrometer (1D representation). This data also shows a weak —but clearly visible — spectral line at an energy position of 54.6 eV, and an additional strong spectral line at around 54.4 eV not reproduced in the laser excitation data, although it reaches half the intensity of the strong line at 55.2 eV. This line can be identified as a transition (2s22s2—2s22s2p) from the ground state in Be-like Cu25+. Since this is an intercombination line between two different multiplets, the transition probability is about 40 times smaller than that of the 22S1/2 — 22P1/2 peak at 55.2 eV. At this level of statistics it should remain invisible in the photoexcitation spectrum. The fact that is shows up in the emission spectrum taken with the grating spectrometer results from direct electron impact excitation in the EBIT, and is not due to FLASH photons. Electron impact excitation is subject to different selection rules than electric dipole transitions. Moreover, the upper level can be populated by cascades from higher levels easily excited by the electron beam and not accessible to resonant laser excitation. Once populated, decay of this state to the ground level proceeds in the EBIT, no matter what the transition probability is, because (i) there are no competing radiative decay channels, and (ii) collisional quenching by electrons plays only a minor role. We also found a spectral line in our grating spectrum at 71.55 eV, which we assign to the (1s2s) 3S1—(1s4p) 3P2 transition in He-like C4+, thus supporting the assumption that the line seen at 54.6 eV belongs to that carbon ion. However, there is always some possibility that this line could be an unknown line in a highly-charged silicon or fluorine ion, but we can certainly exclude lines from C, O, Fe (still present as a residue in the trap) or Cu. The upper (1s3p) 3P2 level of the reference line in C4+ is a triplet state (J=0,1,2) where each individual state within the multiplet is excited with equal probability. The central transition energy of this triplet is (1)EC4+= (54.57147 ± 0.00009) eV [66]. Taking this value as a calibration for the energy axis in Fig. 12, the 22S1/2 — 22P1/2 transition in Cu25+ takes a value of (2)ECu = (55.134 ± 0.005) eV, what has to be compared to the literature value [66] of
Figure 12. Measurements of the Cu26+ 22S1/2 — 22P1/2 transition energy. One-dimensional data extracted from two-dimensional data similar to figure 8. The data (black) shows two peaks fitted by a Gaussian (red) and their centroid. The lower energy scale (black) is uncalibrated. The blue curve shows data from our grating spectrometer for comparison; its energy scale (upper scale) is shifted on basis of the strongest line.
(55.156 ± 0.001) eV. The two values disagree by four standard deviations. Alternatively, by reversing the original thought, and taking the copper line as a reference instead, we find for the line at 54.6 eV a value of (1)Enew=(54.593 ± 0.005) eV fitting to F3+ line at (54.595 ± 0.009) eV. We see here that a higher statistical significance would be required to arrive at a conclusive interpretation. However, we succeeded in performing laser spectroscopy on two different ion species at the same time, a significant and necessary step toward high accuracy absolute measurements frequency comparisons of soft X-ray transitions in highly charged ions.
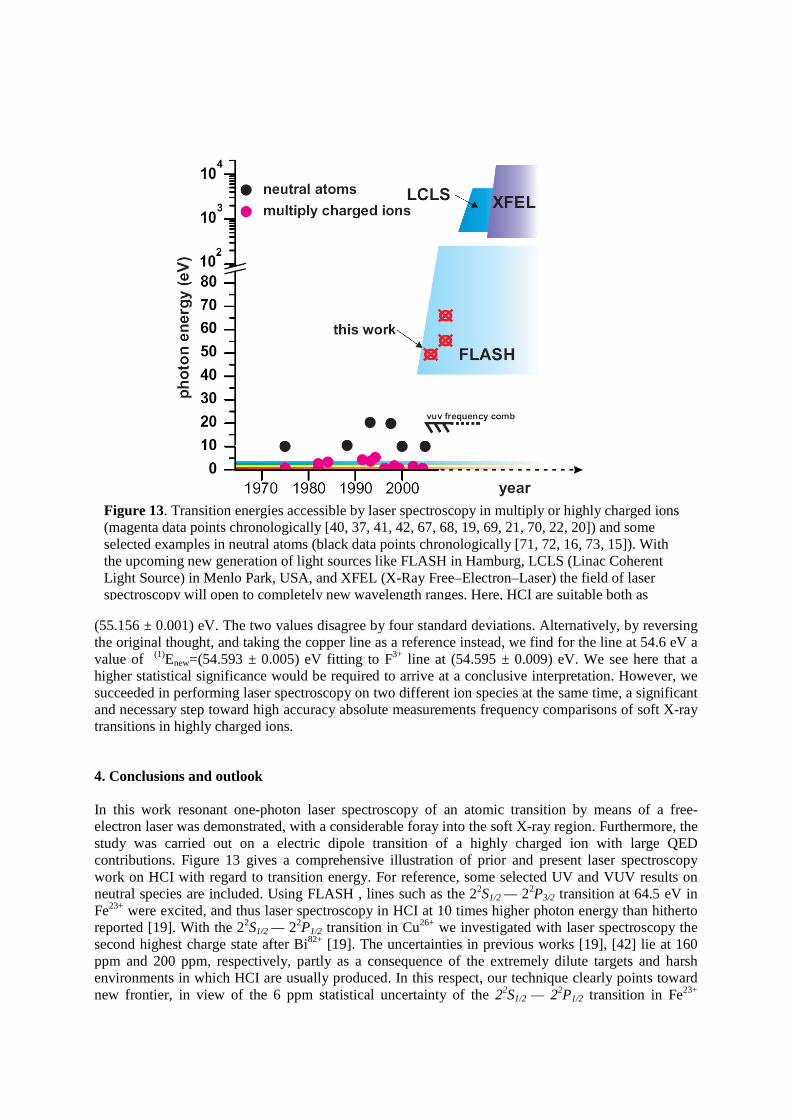
4. Conclusions and outlook In this work resonant one-photon laser spectroscopy of an atomic transition by means of a free-electron laser was demonstrated, with a considerable foray into the soft X-ray region. Furthermore, the study was carried out on a electric dipole transition of a highly charged ion with large QED contributions. Figure 13 gives a comprehensive illustration of prior and present laser spectroscopy work on HCI with regard to transition energy. For reference, some selected UV and VUV results on neutral species are included. Using FLASH , lines such as the 22S1/2 — 22P3/2 transition at 64.5 eV in Fe23+ were excited, and thus laser spectroscopy in HCI at 10 times higher photon energy than hitherto reported [19]. With the 22S1/2 — 22P1/2 transition in Cu26+ we investigated with laser spectroscopy the second highest charge state after Bi82+ [19]. The uncertainties in previous works [19], [42] lie at 160 ppm and 200 ppm, respectively, partly as a consequence of the extremely dilute targets and harsh environments in which HCI are usually produced. In this respect, our technique clearly points toward new frontier, in view of the 6 ppm statistical uncertainty of the 22S1/2 — 22P1/2 transition in Fe23+
Figure 13. Transition energies accessible by laser spectroscopy in multiply or highly charged ions (magenta data points chronologically [40, 37, 41, 42, 67, 68, 19, 69, 21, 70, 22, 20]) and some selected examples in neutral atoms (black data points chronologically [71, 72, 16, 73, 15]). With the upcoming new generation of light sources like FLASH in Hamburg, LCLS (Linac Coherent Light Source) in Menlo Park, USA, and XFEL (X-Ray Free–Electron–Laser) the field of laser spectroscopy will open to completely new wavelength ranges. Here, HCI are suitable both as

attained in 2.5 hours of measurement time. Given the comparatively low resolution settings at the monochromator of not more than E/∆E=3000, great improvements can in principle be soon expected, with the photon flux loss easily being compensated by improvements of the FLASH performance expected after the major shutdown in 2009/2010, which will bring the facility closer to its initial design parameters [87]. However, using a resolving power of E/∆E>100,000 as reported [88] for a similar monochromator at 3rd generation synchrotron light sources might prove fruitful only if the pointing stability of FLASH is improved. In the near future, establishing absolute energy and frequency standards based in electronic transitions in the soft X-ray spectral range will draw our full attention. If we ask ourselves how much energy, e. g., a “48.6” eV photon carries, we will immediately see that the answer is finally connected to its frequency and thus to the definition of the second. This physical constant, however, is still linked to a Cs hyperfine transition lying in the microwave region. Our work is far off this spectral range (figure 13), and presently no frequency chains exist which extend into the spectral range of FLASH. The frequency-comb technique, recently shown to reach into the VUV region [89], could provide a suitable approach for measurements of the 1S-2S interval of He+ [90] at energies as high as 20.3 eV. Unfortunately, it was not possible to use existing experimental data to cross-calibrate our measurements. Considering for instance the experimental accuracies reported for the 2S1/2 — 22P1/2
transition in different Li-like ions, as seen in figure 14, it becomes evident that our present statistical accuracy limit of 6 ppm already exceeds the precision of the best conventional measurements, and thus a calibration with data obtained by those seems inadequate. Therefore, in future we have to link our data to more fundamental transitions in light H-like and He-like highly charged ions as Be, B, C, N, O,
Figure 14. Theoretical [29, 74, 30, 75] as well as experimental results for the Li-like isoelectronic 1s22s 2S1/2–1s22p 2P1/2 transition for various elements with different nuclear charge Z. Shown from the top down: absolute energy, main QED contributions to the transition, main sources of uncertainty to the theoretical error budget, total theoretical uncertainty for some Z [45, 76], and finally total uncertainty of this work (statistical error) as well as of other reported experiments [77, 49, 78, 79, 28, 62, 80-86,10, 13]. The spectral tunability of FLASH indicated on top allows for systematic measurements across the periodic table.

F and Ne, and laser spectroscopy has to be applied on two different species of ions simultaneously. Our Li-like Cu26+ measurement is a first step in this direction. The statistical accuracy achieved here is ten times smaller than the current uncertainty of theory for the 2S1/2 — 22P1/2 transition for Fe23+ [30]. Therefore, sensitivity to three-loop contributions to the inter-electron interaction (black curve in figure 14) and potentially to the dominant contributions of the pure H-like self-energy correction in order O(α2) (purple curve) appears within reach. However, to take advantage of these experimental advances the main uncertainties from the relativistic recoil of the electron and the screening of the H-like self-energy (a third order effect) have to be reduced by better calculations. Obviously, theory will benefit from higher experimental accuracy in these transitions, which have the largest relative QED contributions in atomic physics. The spectral range of FLASH (in its fundamental) allows for investigations of the 2S1/2 — 22P1/2
transition across almost the whole periodic table. Systematic studies for different values of Z as well as on various isotopes will be of crucial importance to determine nuclear size contributions rapidly rising with Z (figure 14), thus checking different models of the nuclear charge distribution. The use of a laser ion source for filling the trap will enable those studies. As figure 13 illustrates, FLASH, and other upcoming FELs open an unexplored photon energy range to laser spectroscopy. Higher photon energies will not only allow for resonant excitation of fundamental ground state transitions as 1S-nP in H-like ions aiming at the 1S Lamb-shift, but also for photoionization experiments in HCI. Moreover, the short FEL pulses make femtosecond-scale lifetime studies possible [91, 92] by pump-probe schemes using one or two-colour schemes. Steep scaling laws as a function of Z for the lifetimes of levels depopulated by multipole transitions (M1, E2, 2E1, M2...) facilitates those studies with HCI. Lifetimes reflect spatial aspects of the wavefunction to which transition energies are less sensitive, especially to correlation terms between the initial and final states, which are nearly unexplored in the domain of relativistic, QED-sensitive electronic transitions of HCI.
Acknowledgements We gladly acknowledge help from: S. Düsterer, B. Farts, J. Feldhaus, V. Kocharyan, M. Kuhlmann J. R. Schneider, E. A. Schneidmiller, S. Toleikis, R. Treusch, M.V. Yurkov, and the whole FLASH-team (DESY). We also thank to M. Wellhöfer, M. Martins and W. Wurth, all from Hamburg University, as well as to C. Kaiser, K. Bechberger, N. Müller, and T. Busch (MPI-K) for their technical support. Funding was provided through the MIDFEL-Initiative.
References [1] Fang T T and Canizares C R 2000 Astrophys. J. 539 532 [2] Gillaspy J D 2001 J. Phys. B 34 R93 [3] Koenig M et al 2005 Plasma Phys. Control. Fusion 47 B441 [4] Mohr P J, Plunien G, Soff G 1998 Phys. Rep. 293 227 [5] Swings P 1939 Scientia 65 72 Edlén B 1943 Z. Astrophys. 22 30 [6] Bednyakov I, Labzowsky L, Plunien G, Soff G, Karasiev V 2000 Phys. Rev. A 61 012103 [7] Andreev O Y, Labzowsky L N, Plunien G, Soff G 2005 Phys. Rev. Lett. 94 243002 [8] Schweppe J et al 1991 Phys. Rev. Lett. 66 1434 [9] Gumberidze A et al. 2005 Phys. Rev. Lett. 94 223001 [10] Brandau C et al. 2003 Phys. Rev. Lett. 91 0732021 [11] Marrs R E, Elliott S R, Knapp D A 1994 Phys. Rev. Lett. 72 4082 [12] Crespo López-Urrutia J R, Beiersdorfer P, Savin D W and Widmann K 1996 Phys. Rev. Lett. 77 826 [13] Beiersdorfer P, Chen H, Thorn D B, Träbert E 2005 Phys. Rev. Lett. 95 233003

[14] Martinson I 1989 Rep. Prog. Phys. 52 157 Beiersdorfer P 2009 Phys. Scr. T134 014010 Le Bigot E O et al 2009 Phys. Scr. T134 014015 Crespo López-Urrutia J R 2008 Can. J. Phys. 86 111 [15] Niering M et al 2000 Phys. Rev. Lett. 84 5496 Fischer M et al 2004 Phys. Rev. Lett. 92 230802 [16] Eikema K S E et al 1996 Phys. Rev. Lett. 76 1216 [17] Herrmann M, Batteiger V, Knünz1 S, Saathoff G, Udem Th, and Hänsch T W 2009 Phys. Rev. Lett. 102 013006 [18] Wolf A L, van den Berg S A, Ubachs W, and Eikema K S E 2009 Phys. Rev. Lett. 102 1216 [19] Klaft I et al 1994 Phys. Rev. Lett. 73 2425 [20] Hosaka K et al 2004 Phys. Rev. A 69 011802 [21] Seelig P et al 1998 Phys. Rev. Lett. 81 4824 [22] Redshaw M and Myers E G 2001 Phys. Rev. Lett. 88 023002 [23] Bruhns H, Braun J, Kubiček K, Crespo López-Urrutia J R, and Ullrich J 2007 Phys. Rev. Lett. 99, 113001 [24] Thorn D B et al 2009 Phys. Rev. Lett. 103 163001 [25] González Martínez A R et al 2005 Phys. Rev. Lett. 94 203201 [26] Sugar J, Kaufman V and Rowan W L 1993 J. Opt. Soc. Am. B 10 13 [27] Lestinsky M et al 2008 Phys. Rev. Lett. 100 033001 [28] Sapirstein J and Cheng K T 2001 Phys. Rev. A. 64 022502 [29] Yerokhin V A, Indelicato P and Shabaev V M 2006 Phys. Rev. Lett. 97 253004 [30] Yerokhin V A, Artemyev A N and Shabaev V M 2007 Phys. Rev. A 75 062501 [31] Volotka V A, Glazov D A, Shabaev V M, Tupitsyn I I and Plunien G 2009 Phys. Rev. Lett. 103 033005 [32] Lamb W E and Retherford R C 1947 Phys. Rev. 72, 241 [33] Bethe H A 1947 Phys. Rev. 72 339 [34] Jentschura U D, Kotochigova S, Le Bigot E, Mohr P J and Taylor B N 2005 Phys. Rev. Lett. 95 163003 [35] Lundeen S R and Pipkin F M 1981 Phys. Rev. Lett. 46 232 [36] Zacek V et al 1984 Z. Phys. A 318 7 [37] Wood O R et al 1982 Phys. Rev. Lett. 48 398 [38] Gould H and Marrus R 1978 Phys. Rev. Lett. 41 1457 [39] Hagley E W and Pipkin F M 1994 Phys. Rev. Lett. 72 1172 [40] Kugel H W et al 1975 Phys. Rev. Lett. 35 647 [41] Pellegrin P, El Masri Y, Palffy L and Prieels R 1982 Phys. Rev. Lett. 49 1762 [42] Sträter H D et al 1984 Phys. Rev. A 29 1596 [43] Yerokhin V A, Indelicato P and Shabaev V M 2003 Phys. Rev. Lett. 91 073001 [44] Yan Z and Drake G W F 2003 Phys. Rev. Lett. 91, 113004 [45] Yerokhin V A, Artemyev A N and Shabaev V M 2007 Phys. Rev. A 75, 062501 [46] Johnson W R and Soff G 1985 Atomic Data and Nuclear Data Tables 33 405 [47] Munger C T, Gould H 1986 Phys. Rev. Lett. 57 2927 [48] Gumberidze A et al 2004 Phys. Rev. Lett. 92 203004 [49] Artemyev A N, Shabaev V N, Yerokhin V A, Plunien G and Soff G 2005 Phys. Rev. A 71 062104 [50] Safronova M S, Johnson W R and Safranova U I 1996 Phys. Rev. A 53 4036 [51] Marrs R E, Beiersdorfer P and Schneider D 1994 Physics Today 47 Issue 10 27 [52] Levine M et al 1989 Nucl. Instrum. Meth. B 43 431 [53] Simon M C et al 2010 J. Phys. B. 43 accepted [54] Simon M C et al 2010 Phys. Rev. Lett. submitted [55] Martins M. et al 2006 Rev. Sci. Instrum. 77 115108

[56] Wellhöfer M, Martins M, Wurth W, Sorokin A A and Richter M 2007 J. Opt. A 9 749 [57] Guerrasimova N 2009 private communication [58] Lapierre A et al 2007 Rev. Sci. Instrum. 78 123105 [59] Epp S W et al 2007 Phys. Rev. Lett. 98 183001 [60] Hummer D G et al 1993 Astro. Astrophys. 279 298 [61] Hamann Z 2008 private communication [62] Reader J, Sugar J, Acquista N and Bahr R 1994 J. Opt. Soc. Am. B 11 1930 [63] Wilhelmi O et al 1999 Journal of Electron Spectroscopy and Related Phenomena 101–103 155 [64] Schulz K et al 1996 Phys. Rev. A 54 3095 [65] Persson W 1971 Physica Scripta 3 133-155 [66] Ralchenko Yu, Kramida A E, Reader J and NIST ASD Team 2008 NIST Atomic Spectra Database Available: http://physics.nist.gov/asd3 [67] Dinneen T P, Berrah-Mansour N, Berry H G, Young L and Pardo R C 1991 Phys. Rev. Lett. 66 2859 [68] Scholl T J et al 1993 Phys. Rev. Lett. 71 2188 [69] Myers E G, Howie D J H, Thompson J K and Silver J D 1996 Phys. Rev. Lett. 76 4899 [70] Myers E G et al 1999 Phys. Rev. Lett. 82 4200 [71] Hänsch T W, Lee S A, Wallenwein R and Wieman C 1975 Phys. Rev. Lett. 34 307 [72] Chu S et al 1988 Phys. Rev. Lett. 60 101 [73] Bergeson S D et al Phys. Rev. Lett. 80 3475 [74] Yerokhin V A, Artemyev A N, Shabaev V M, Sysak M M, Zherebtsov O M and Soff G 2001
Phys. Rev. A 64 032109 [75] Yerokhin V A et al 1999 Phys. Rev. A 60 3522 Yerokhin V A 2007 private communication [76] Kozhedub Y S et al 2007 Phys. Rev. A 76 012511 [77] Sandlin G D, Brueckner G E, Scherrer V E and Tousey R 1976 Astrophys. Jour. 205 L47 [78] Edlén B 1983 Phys. Scr. 28 [79] Sugar J and Corliss C 1985 J. Phys. Chem. Ref. Data Suppl. 14, 2 [80] Knize R J 1991 Phys. Rev. A 43 1637 [81] Staude U et al 1998 Phys. Rev. A 58 3516 [82] Madzunkov S et al 2002 Phys. Rev. A 65 032505 [83] Hinnov E et al 1989 Phys. Rev. A 40 4357 [84] Bosselmann P et al 1999 Phys. Rev. A 59 1874 [85] Feili D et al 2000 Phys. Rev. A 62 022501 [86] Martin S et al 1989 Europhys. Lett. 10 645 [87] Richard F et al (eds.) 2001 TESLA Technical Design Report DESY 2001-11 see also: http://tesla.desy.de/tdr/ [88] Follath and Senf F 1997 Nucl. Instrum. Methods Phys. Res. A 390 388 [89] Diddams S A et al 2005 Nature 445 627 [90] Ozawa A et al 2008 Phys. Rev. Lett. 100 253901 [91] Träbert E 2009 Physica Scripta 79 068101 [92] Brenner G, Crespo López-Urrutia J R, Harman Z, Mokler P H and Ullrich J 2007 Phys. Rev. A 75 032504


![dspace.jaist.ac.jp · generate positively charged ions or negatively charged ions. There are two possible ion formation mechanisms for ESI sources, as illustrated in Figure 1.3 [8]](https://img.dokumen.tips/doc/110x75/5f0a60ca7e708231d42b5813/generate-positively-charged-ions-or-negatively-charged-ions-there-are-two-possible.jpg)